Measurement of electronegativity during the E to H mode transition in a radio frequency inductively coupled Ar/O2 plasma?
Peng-Cheng Du(杜鵬程), Fei Gao(高飛), Xiao-Kun Wang(王曉坤),Yong-Xin Liu(劉永新), and You-Nian Wang(王友年)
Key Laboratory of Materials Modification by Laser,Ion,and Electron Beams(Ministry of Education),School of Physics,Dalian University of Technology,Dalian 116024,China
Keywords: electronegativity,E to H mode transition,radio frequency inductively coupled plasma
1. Introduction
Inductively coupled plasmas (ICPs) operating in electronegative gases under radio frequency (rf) excitation have manifold applications, e.g., dry etching and thin film deposition in the microelectronic manufacturing.[1]In particular,ICPs operated in oxygen-containing feedstock gases are often employed in silicon oxidation[2]and photoresist ashing.[3]In ICPs, when the applied power is relatively low, the capacitive mode(E-mode)dominates a discharge,i.e.,the plasma is mainly sustained by an electrostatic field. In the E-mode, a plasma exhibits a low electron density and a high sheath voltage. By increasing the applied power, the induction electric field, which is produced by the rf current flowing in an antenna coil,is enhanced and,thus,plays a more important role in sustaining a discharge(H-mode). In the H-mode,a plasma exhibits a higher electron density and a stronger optical emission intensity.[4-10]In other words, as the applied power increases,the discharge experiences a mode transition from the E-mode to the H-mode. In electronegative ICPs, the negative ions influence the species transport, chemical reactions and physical processes,[11,12]which finally leads to changes of etching profile[13]and the deposition film.[14,15]Therefore,researches on the E- to H-mode transition in electronegative ICPs have been extensively and intensively carried out.[6,10,16]
Wegner et al.[6]found that during the E-to H-mode transition in an Ar/O2ICP,the current and voltage amplitudes of the coil are increased in proportion, and the phase angle between them stays almost constant in the E-mode,while it decreases slightly in the H-mode. Lee et al.[16]investigated the electron energy distribution function(EEDF)during the E-to H-mode transition of an ICP operated in N2, and they found that as the power increases, the EEDF evolves from an unusual distribution (with a hole near 3 eV) in the E mode to a Maxwellian distribution in the H mode. By using a twophoton absorption laser induced fluorescence method,Zeng et al.[10]revealed that the ground state atomic oxygen density increases by one order of magnitude during the E- to H-mode transition in an O2ICP. By employing space and phase resolved optical emission spectroscopy,Zaka-ul-Islam et al.[17]studied three distinct operation modes(E mode,H mode,and E- to H-transition mode) in an O2ICP. Their results showed that in the E mode the plasma mainly operates in an alphamode,while in the H mode the plasma is mainly sustained by an induction electric field. By contrast, in the hybrid mode(during the E-to H-mode transition stage),electron avalanche plays a significant role.
Corr et al.[18]investigated the E mode and the H mode in O2ICPs through a photo-detachment diagnostic technique combined with a global model. They found that the negative ion density is comparable in both modes, but with a higher electronegativity in the E mode. By contrast, in pulse modulated RF O2ICPs, Wegner et al.[11]found that the E- to Hmode transition occurs at the initial pulse stage,during which both the electronegativity and the negative ion density change significantly, which was considered to be caused by the electron dissociative attachment with O2molecule.
Although many investigations have been carried out,there are few measurements of the negative ions and the electronegativity during the E- to H-mode transition, especially for O2and O2-containing ICPs. Therefore, in this paper, the measurements of the negative ion (measured by the photodetachment combined with a microwave resonance probe)and the electronegativity during the E to H mode transition are executed under different pressures and O2contents in continuous wave (CW) Ar/O2ICPs. At the same time, the electron density and the optical emission intensities at Ar 750.4 nm and O 844.6 nm are also measured by a microwave resonance probe as well as a Langmuir probe, and via optical emission spectroscopy(OES),respectively. Finally,the conclusions are drawn.
2. Experimental setup
The schematic diagram of the experimental setup is shown in Fig.1.The stainless steel chamber is cylindrical,and is grounded. A quartz window (13 mm in thickness), placed at the top of the chamber, is used for the chamber seal and the feeding of the rf power. A two-turn water-cooled planar antenna (made of copper pipe) is placed on the quartz window. For the investigation of the E-to H-mode transition,the adjustable capacitors in the matching network are fixed to reduce its influence.[8]In this experiment, the total flow rate is fixed at 50 sccm via a mass flow controller.More details about the chamber can be found elsewhere.[19-23]
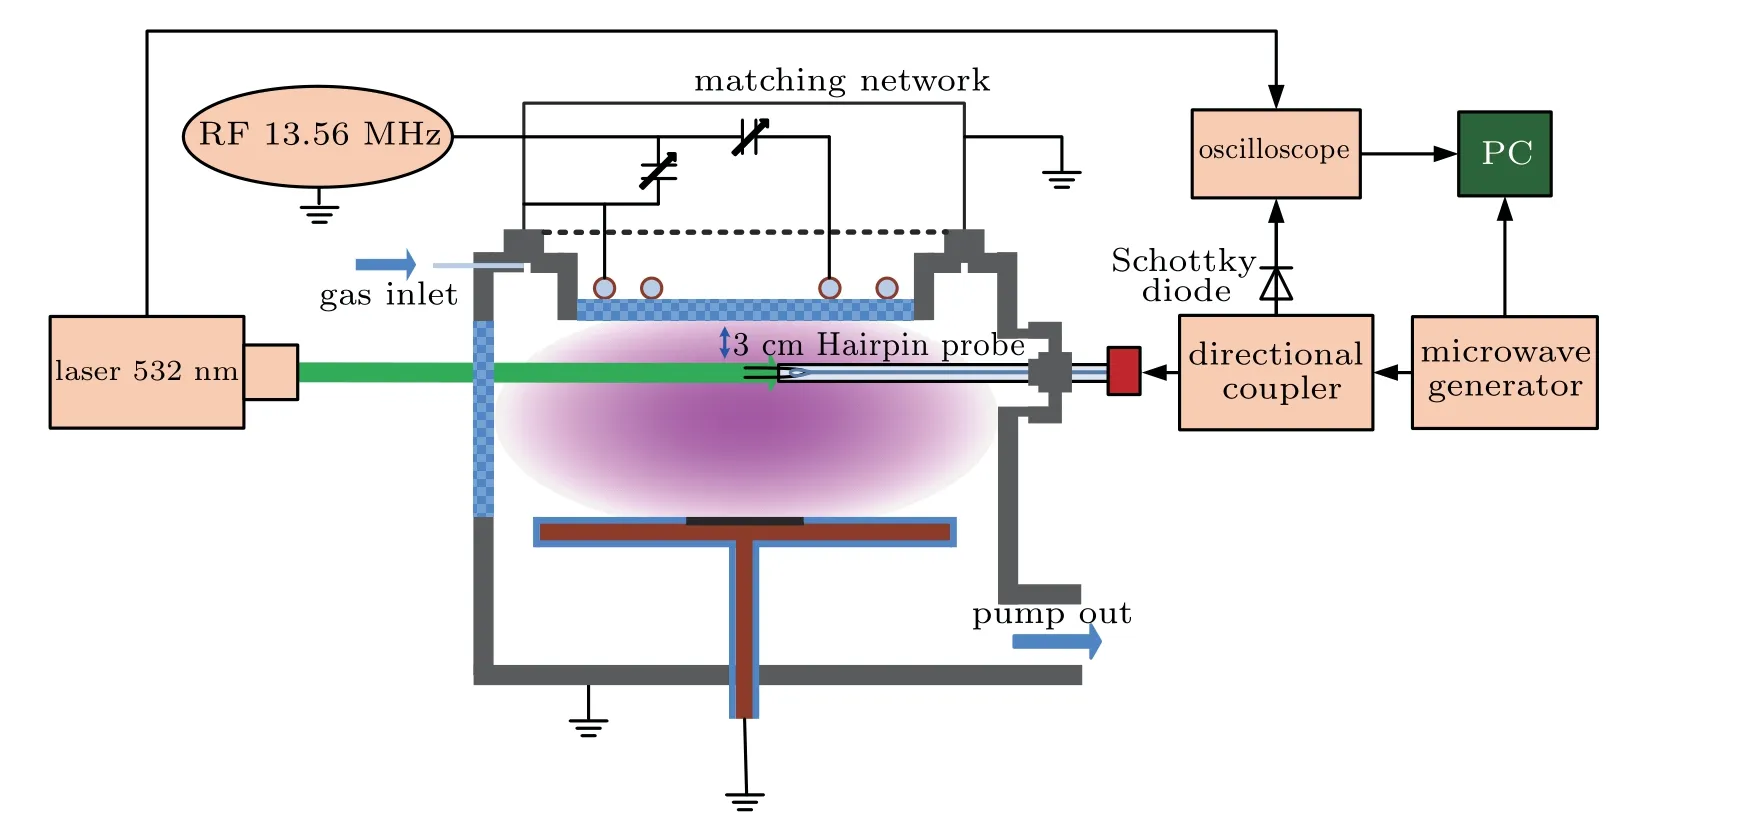
Fig.1. Schematic diagram of the ICP chamber supplemented by various diagnostics,including a laser photo-detachment system,a microwave resonance probe system,and a Langmuir probe.
A commercial Langmuir probe[24-29](Impedans ALP SystemTM) is used to measure the electron density at the axial center and 3 cm below the quartz window. The probe tip is made of tungsten wire with 10 mm in the length and 0.3 mm in the diameter. The optical emission intensities at Ar 750.4 nm and O 844.6 nm(i.e.,the summed intensity of 844.62,844.64,and 844.68 nm) are measured by an optical multichannel analyzer(Princeton Instruments Acton SP2750 with a PI-MAX 4 detector)through the quartz window on the side wall of the chamber. The optical probe is placed at the same height as the Langmuir probe. Consequently, the radial integral of the light intensity is actually obtained. In order to determine the electronegativity(α)of the ICP operating in Ar/O2, which is defined as the ratio of the negative ion density to the electron density[11,30]

we employed a laser photo-detachment technique, which is a combination of a microwave resonance probe system and a Nd:YAG (neodymium-doped yttrium aluminium garnet;Nd:Y3Al5O12) laser system. The schematic diagram of the photo-detachment diagnostic system is shown in Fig.2. The microwave resonance probe tip is a“U-shape”structure,made of tungsten wire with 3 cm in length and 0.3 mm in diameter,and the distance of the two tips is 4 mm. The principle and the sensitivity of the microwave resonance probe,and the temporal resolution measurement of the microwave resonance probe system are detail introduced elsewhere,[31-34]and we will give a brief description here.

Using the resonant frequency of microwave resonance probe, the electron density nein a plasma can be written as follows:[31,32]where fris the resonant frequency in the plasma, f0is the resonant frequency in vacuum, both of them are in unit GHz.For time-resolved measurement of the electron density, the time-dependent resonance frequency of microwave resonance probe fr(t) is obtained by the microwave generator with a step frequency output, according to resonance frequency at the different time, the electron density versus time is obtained. The microwave resonance probe system is driven by the RIGOI DSG3120 microwave generator with a sweep range from 1 kHz to 10 GHz,and a Directional Coupler Pasternack(PE2243-10) was used to achieve the incident signal and reflected signal shunt. The amplitude of reflected signal rectified by a Schottky diode (PE8013), is then displayed on an Oscilloscope (Tektronix MSO56), and the frequency scan is automatically controlled through the Labview.
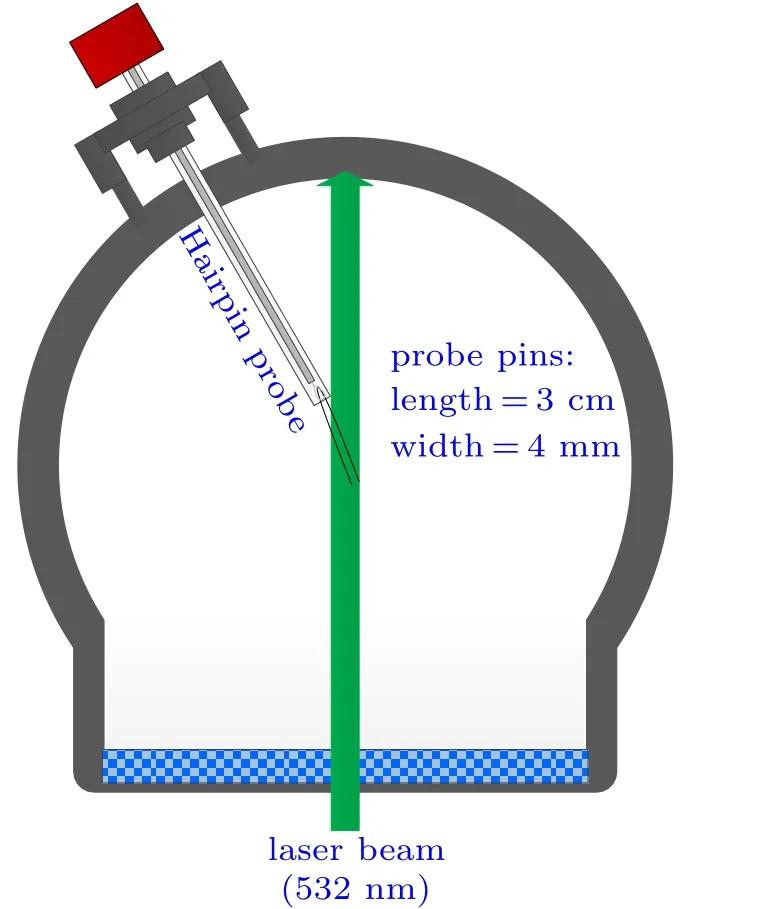
Fig.2. Schematic diagram of the laser photo-detachment system, which consists of a microwave resonance probe and a pulse Nd:YAG laser system,and the light path is indicated by a green arrow.
The laser(Quantel Q-smart 100 Nd:YAG laser)has a repetition frequency of 10 Hz and a pulse width of 7 ns. For the measurement of the negative ions O?in an Ar/O2ICP,the second harmonic of the laser pulse produces 532-nm photons with the energy of 2.33 eV, which is able to detach the electrons from O?(with electron affinity of 1.46 eV)and O?2(with electron affinity of 0.44 eV).According to previous studies, the majority of negative ions is O?in O2ICPs[14]with the photo-detachment cross section of 6.5×10?18cm2.[34]The photo-detachment system is illustrated in Fig.2, where the laser beam is 4.7 mm in diameter, so that the probe tips are completely covered by the cylindrical region illuminated by the laser beam. It can be seen from Fig.3 that the change of the electron density with time during the detachment of the laser pulse is measured and, particularly, the increase of the electron density, i.e., Δn=nmax?nback, is believed to be equal to the negative ion density(n?),[34]where the nmaxis the electron density of the photoelectron peak and the nbackis the background electron density. More details about the photoelectron signal can be seen in Ref. [32]. For a plasma with a single negative ion species,the photo-detachment rate is given by[35]

where σpdis the photo-detachment cross section,E is the laser power,hν is the photon energy,and S is the cross section of the laser beam. In order to reduce the ablation of the chamber,the laser energy used in this experiment is set to be 380 mJ/cm?2.
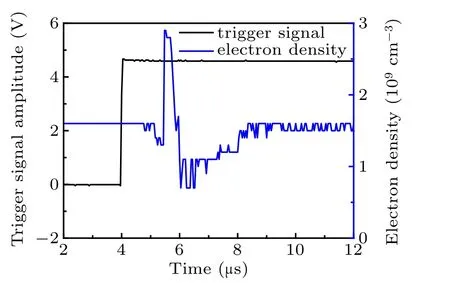
Fig.3. The temporal evolution of the trigger signal of the pulse laser and the electron density measured by the microwave resonance probe. And it is obtained in the E-mode in Ar/O2 (the O2 contents of 80%)discharge at the 100 W and 1 Pa.
3. Results and discussion
Figure 4 shows the electron density measured by the Langmuir probe as a function of the applied power under different O2contents when the pressure is fixed at 5 Pa. It can be seen that at low applied powers, the electron density is within the range of and the plasmas are operated in the Emode. By increasing the applied power, neincreases gradually. When the applied power reaches a threshold power, nejumps dramatically to a higher value, suggesting that the Eto H-mode transition happens. After that, the plasma is operated in the H-mode. From Fig.4, it can be found that as the O2content increases, the threshold power of the E to H mode transition monotonously increases,to be more specific,the threshold power is 40 W (at pure Ar), and increases to 120 W (at 60% O2content). This is due to the fact that with the increase of the O2content, the energy consumed via the inelastic collision processes gradually increases, as a consequence,the mode transition occurs at a higher applied power.Besides,with the O2content raising from 0%to 60%,the increase of neduring the E- to H-mode transition (i.e., the difference between critical electron density after mode transition and critical electron density before mode transition)exhibits a decline from (at 0% O2content) to (at 60% O2content) and particularly, when the O2content is increased to 80%, the Eto H-mode jump vanishes. This is caused by the lower neunder higher O2content, which weakens the “shielding effect”of the capacitive field, resulting in a decrease of the electron density increase between the E-mode and the H-mode.[36-38]
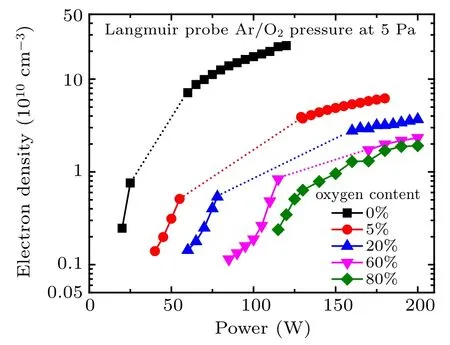
Fig.4. The ne measured by the Langmuir probe as a function of the applied power for different O2 contents.
According to the previous investigations,[12,39,40]the electron density measured by a Langmuir probe shows discrepancies for different laser wavelengths, it is because compared with the background electrons in a plasma, in the laser path the photo-electrons can get extra energy from laser photons, leading to the formation of a potential barrier and, consequently, the plasma potential in the laser beam region is changed,causing a significant increase in the background electron density and temperature. Therefore,a floating microwave resonance probe is more suitable to be used in this experiment to measure the time-resolved electron density. Comparing the electron densities measured by the microwave resonance probe in Fig.5(a)and the Langmuir probe in Fig.5(b),at the O2content of 60%, it can be found that with the increase of the applied power,the nemeasured by the microwave resonance probe exhibits a good agreement with that by the Langmuir probe,however,nemeasured by the microwave resonance probe is 1.5 times larger than that by the Langmuir probe,this is because the current-voltage curve determined by the Langmuir probe in an electronegativity plasma is distorted.Additionally,the oxidation layer is inescapability deposited on the Langmuir probe tip in an O2plasma, which will reduce the current collected by the probe.[20]It can be seen that with the pressure increasing,the electron density monotonously decreases and the E-to H-mode transition threshold power gradually increases. This is caused by the fact that with the pressure increasing, electron energy relaxation length decreases,so that more energy is consumed by the inelastic collisions,leading to the decrease of ionization reaction and,thereby,the increase of the critical applied power of the mode transition.Besides, a continuous E- to H-mode transition at a low pressure (3 Pa) is also observed in Fig.5, and this is related to the stronger capacitive field and the infrequent elastic/inelastic collisions.[37]

Fig.5. The electron density measured by (a) a microwave resonance probe and (b) a Langmuir probe as a function of the applied power at different pressures.
Figure 6 shows the electron density,the negative ion density and electronegativity as a function of the applied power for different pressures at different O2contents of 20%, 40%,and 60%,corresponding to the left,middle,and right columns,respectively. At 20%O2content,it can be seen from Fig.6(a)that the E-to H-mode transition exhibit a jump for all the pressures investigated here. However, at a relatively higher O2content, e.g., for the results shown in Figs. 6(b) and 6(c), it presents a continuous E- to H-mode transition at a low pressure, i.e., 3 Pa, the reason for these phenomenon has been given above.For the negative ion density,from Figs.6(d)-6(f),it can be found that it changes with the applied power in a similar fashion as the electron density.However,with the increase of the pressures, the negative ion density (n?) monotonously decreases in the E-mode, while it monotonously increases in the H-mode. A similar trend for the negative ion with the change of the pressure has been found by Corr et al.[18]that,in case of the low electron density(about 109cm?3), O?ion and the O atom densities are strongly dependent on ne. They found that in the E-mode,the detachment by metastable oxygen molecule (via the reactions: O2(a1Δg) + O?→O3+ e)and oxygen atoms (via the reaction: O + O?→O2+ e) are the dominant loss mechanisms of the negative ion,whereas in the H-mode, the ion-ion recombination and the detachment by oxygen atoms are the dominant loss channels. In the Emode, the electron density is so scarcity that the production of the negative ion is the major restraining factor of the negative ion density,with increasing the pressure,as can be seen in Figs.6(a)-6(c),the electron density monotonously decreases,leading to a decline of the n?. However,in the H-mode,with the increase of the pressure, the monotonous increase of n?might be caused by that there are abundant electrons which can produce the negative ion,and the loss of the negative ion is the major restraining factor of the negative ion density,e.g.,the detachment rates of negative ion by high-energy electrons and oxygen atoms decrease with the pressure increasing, and we will verify this assumptive explanation in the follow. Besides,we found from Figs.6(g)-6(i)that with the increase of the applied power,the electronegativity shows an abrupt drop during the E-to H-mode transition. This is because in the Hmode the plasma exhibits a higher dissociation rate of the O2molecule due to inductive heating, which contributes significantly to the production of the negative ion.[18]
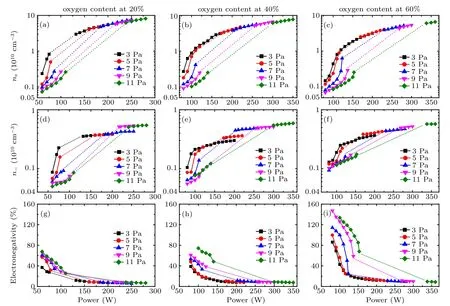
Fig.6. The electron density [(a)-(c)], the negative ion density [(d)-(f)], and electronegativity [(g)-(i)] as a function of the applied power during E- to Hmode transition at different pressures. Note that the left,middle,and right columns correspond to the O2 contents of 20%,40%,and 60%,respectively. The densities of the electron and the negative ion are measured by the microwave resonance probe and its combination with a laser photo-detachment technology.
The optical emission intensities of Ar (750.4 nm) and O(844.6 nm)as a function of the applied power for different O2contents and different pressures are shown Fig.7, where the top two panels (Figs. 7(a) and 7(b)) show the results corresponding to different pressures for a fixed O2content of 60%,and the bottom two (Figs. 7(c) and 7(d)) are obtained at different O2contents for a fixed pressure of 5 Pa. Obviously,with the increase of the applied power,the emission intensity exhibits a similar evolution trend as ne, i.e., as the applied power increases, the emission intensity first increases gradually, and then rises abruptly to a higher value, after that, its growth slows down again. Besides, from Fig.7, it can be seen that the emission intensities of 750.4 nm and 844.6nm monotonously decrease with increasing the pressure and the O2content, which is caused by the decrease of the dissociation rate of oxygen molecule ([O]/[O2]). When increasing the pressure or the O2content,[10,41,42]the electrons will lose their energies significantly via inelastic collision with populated background O2, and the fraction of the energetic electrons,which can excite O and Ar atom,decreases. According to the previous studies,[43,44]the collisions with the electron and oxygen atom dominate loss processes of the negative ion at low and high pressures, respectively. Therefore, from the emission intensities of 750.4 nm and 844.6 nm in Figs. 7(a)and 7(b), it is inferred that with the increase of the pressure,the excitation rates of the Ar and O atoms decreases,suggesting that the loss rate of O?ion via the detachment process by high-energy electrons is decreasing. It verifies the assumption mentioned above,since as shown in Figs.6(d)-6(f),in the Hmode the negative ion density increases with increasing the pressure. From Figs. 7(c) and 7(d), with the increase of O2content, the emission intensity exhibits a monotonic decline,indicating that more inelastic collision channels provided by the O and O2consume large fraction of the energetic electrons, leading to a decrease of the electron density as shown in Fig.4, and a decrease of the loss of O?. So, we see from Fig.8 that the electronegativity increases monotonously with increasing the O2content.

Fig.7. The emission intensities of(a)750.4 nm and(b)844.6 nm as a function of the applied power for at pressures for a fixed O2 contents of 60%. The emission intensities of(c)750.4 nm and(d)844.6 nm as a function of the applied power at different O2 contents for a fixed pressure of 5 Pa.

Fig.8. The electronegativity as a function of the applied power during E-to H-mode transition for different O2 contents at 5 Pa.
4. Conclusions
In summary, the electron density, the emission intensity,the negative ion density,and the electronegativity as a function of the applied power during the E-to H-mode transition are investigated in an Ar/O2ICP.By increasing the O2content and the pressure, the threshold power of the E- to H-mode transition increases monotonically. With the increase of the applied power, the emission intensity shows a similar evolution as the electron density. However, as the pressure increases,the negative ion density exhibits opposite trends during the E- to H-mode transition. This is because in the E-mode the negative ion density closely depends on the electron density,whereas in the H-mode the negative ion density is primarily determined by its loss channels, i.e., their collisions with the high-energy electrons and the O atoms. Through the measurement of the optical emission intensities of Ar(750.4 nm)and O(844.6 nm),it was found that the high-energy electrons are monotonously decreased with the increase of the pressure or the O2content. Besides,the previous studies showed that with the increase of the pressure, the dissociation rate of the O2molecule decreases and,therefore,the loss rates of O?ion via the detachment processes by the high-energy electrons and O atoms decline,result in an increase of negative ion density in the H-mode. Besides,as the applied power increases,the electronegativity shows an abrupt drop during the E mode to H mode,due to a higher dissociation rate of the O2molecule in the H-mode.
- Chinese Physics B的其它文章
- Nonlocal advantage of quantum coherence in a dephasing channel with memory?
- New DDSCR structure with high holding voltage for robust ESD applications?
- Nonlinear photoncurrent in transition metal dichalcogenide with warping term under illuminating of light?
- Modeling and analysis of car-following behavior considering backward-looking effect?
- DFT study of solvation of Li+/Na+in fluoroethylene carbonate/vinylene carbonate/ethylene sulfite solvents for lithium/sodium-based battery?
- Multi-layer structures including zigzag sculptured thin films for corrosion protection of AISI 304 stainless steel?

