
Ultrasonic backscatter characterization of cancellous bone using a general Nakagami statistical model?
2019-02-25 07:22:40ChengchengLiu劉成成RuiDong東蕊BoyiLi李博藝YingLi李穎FengXu徐峰DeanTa他得安andWeiqiWang王威琪
Chinese Physics B 2019年2期
關(guān)鍵詞:李穎
Chengcheng Liu(劉成成),Rui Dong(東蕊),Boyi Li(李博藝),Ying Li(李穎),Feng Xu(徐峰),Dean Ta(他得安),3,?,and Weiqi Wang(王威琪)
1 Institute of Acoustics,School of Physics Science and Engineering,Tongji University,Shanghai 200092,China
2 Department of Electronic Engineering,Fudan University,Shanghai 200433,China
3 State Key Laboratory of ASIC and System,Fudan University,Shanghai 200433 China
Keywords:ultrasonic backscatter,cancellous bone,statistical analysis,Nakagami model
1.Introduction
Osteoporosis is a metabolic bone disease that is characterized by a systemic impairment of bone mass and microarchitecture,leading to an increased risk of fractures.[1-3]Currently,the diagnosis of osteoporosis centers on the bone mineral density(BMD)measured with dual energy x-ray absorptiometry(DXA).[4]The DXA provides an area-based measure of bone mineral and does not allow assessment of bone geometry or inner trabecular microarchitecture,which are important determinants of bone strength.[1]Quantitative ultrasound(QUS)has been used as a promising and non-invasive tool for bone assessment.[5-15]The ultrasonic through-transmission measurements of calcaneus bones were widely used to predict the fracture risk in the clinic.[16-18]
Recently,ultrasonic backscatter has attracted attention and has shown potential for cancellous bone evaluation.[19-28]With only one transducer working in the pulse-echo mode,the backscatter measurement provides easier access to the hip and spine bones,where osteoporotic fracture is more likely to occur.[29]Cancellous bone could be modeled as a random isotropic continuum containing scatters and ultrasonic scattering from cancellous bone could be estimated using a weak scattering model based on small perturbations in a binary mixture.[27]The ultrasonic backscatter was demonstrated to be significantly correlated with BMD,trabecular structure and elastic modulus.[30-33]
Statistical distributions have been used extensively in ultrasonic characterization of soft tissues.[34]Various models have been introduced in the literature for the first-order statistics of the echo envelope.Based on the properties of the backscatter statistics,the distributions of backscatter envelope were initially classified into pre-Rayleigh,Rayleigh,and post-Rayleigh(or Rice)distributions.[35,36]Ultrasound speckle results from the accumulation of scattering from within the resolution cell.[37,38]When the number density of random scatterers is large and the phases of the scattered waves are uniformly distributed over 0-2π(referred to as fully developed speckle in B-mode image),the central limit theorem applies and the envelope of the backscatter echo will be Rayleigh distributed.[39,40]If some of the scatterers are periodically organized or sufficiently dense such that there is little variation in the phases of the scattered waves,coherent signal component appears in net scattered field and the probability density function of echo envelope will be Rice distribution.[39,41]Pre-Rayleigh distributions corresponds to relatively fewer scatterers per resolution cell(the central limit theorem does not apply),and the statistical properties were commonly determined by the effective number of scatterers per resolution cell.[39]The K-distribution was also used to model ultrasonic scattering from a variable density of random scatterers and the K distribution approximates to the Rayleigh distribution under conditions of high values of the effective number of scatterers.[42]The homodyned K-distribution correspondsto the generalcase of a variable effective density of random scatterers with or without a coherent signal component and was considerably more general than the Rayleigh model to describe the statistics of the backscattered envelope.[35,43]A much simpler model based on the Nakagami distribution could describe the statistics of the backscattered envelope from an ensemble of scatterers with varying number densities,varying cross sections,and the presence or absence of regularly spaced scatterers(i.e.,coherent component).[36]The Nakagami model is a general model that can incorporate Rayleigh or K distributions as special cases with different values of the shape parameter m.Shankar showed that the Nakagami distribution corresponds to a Rayleigh distribution with m=1,Rice distribution with m>1,and pre-Rayleigh distributions with m<1.[36]Destrempes et al.also proved that,for all practical purposes,the Nakagami model coincides with the K-distribution and Rice(or Rician)distribution for the case m<1 and m>1,respectively.[41]The Nakagami distribution is an approximation to the homodyned K-distribution,but comprising two parameters instead of three.[41]Therefore,the Nakagami model is a general model that has the advantages of a simple analytical nature and the ability to encompass different scattering conditions,which might be useful in modeling the backscatter signal from cancellous bone with quasiperiodic and random scatterers.
Cancellous bone is a porous tissue that is composed of plate-like or rod-like trabeculae and bone marrow that fills in the pore spaces.[44,45]Due to a relatively high mismatch of the acoustic impedance between the trabeculae and soft tissue(i.e.,bone marrow),cancellous bone can be treated as a scattering medium.[46]The ultrasonic echoes scattered by the trabeculae in cancellous bone can be described as a result of the random walk process.[47]The received backscatter signal is a superposition of the ultrasonic echoes scattered by the trabeculae in a resolution cell.[38,39]Wear and Garra measured the signal-to-noise ratio(SNR)of the backscatter envelope(not compensated for attenuation)from calcaneal bone and revealed that the radio frequency signal approximately obeys circular Gaussian statistics and the envelope obeys Rayleigh statistics.[46]Litniewski et al.modeled the envelope of ultrasonic backscattered echoes from trabecular bone using the Rayleigh distribution and found deviations of the backscattering properties from the Rayleigh distribution.[20]Wang et al.measured the backscatter signal in the tibia and the calcaneus in vivo,and found that the Nakagami parameters for osteoporotic patients are higher than those for healthy subjects.[47]The results imply that the statistics of the backscatter signal in the cancellous bone might be useful for quantitative measurement of the bony tissues.
The goal of this study is to analyze the associations between Nakagami parameters and bone densities and structure,and to evaluate the availability of using the Nakagami distribution parameters for cancellous bone characterization.In-vitro backscatter measurements were performed on bovine cancellous bone specimens,and statistics of the backscatter envelope was analyzed using Nakagami model.The associations between the Nakagami parameters and the bone features were analyzed using simple and multiple linear regressions.
2.Materials and methods
2.1.Nakagami distribution model
Initially,the Nakagami model was proposed to describe the statistics of returned radar echoes.Shankar invoked this model for the ultrasonic characterization of soft tissue.[36]Under the Nakagami model,the probability density function of the envelope is defined by[36]

where Γ(·)is the Euler gamma function,R is the envelope of the backscatter signal,and m is the Nakagami shape parameter.Statistical distributions of backscatter envelope are mainly dependent on the shape parameter m.The parameter m is expressed from the moments of the envelope as
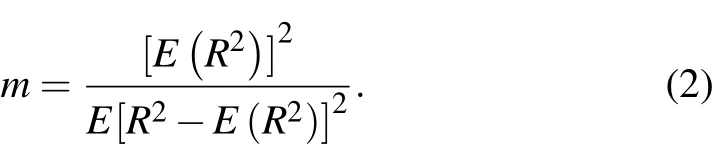
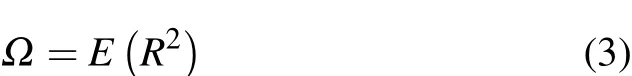
The scaling parameter Ω is related to the average energy or power in the signal and can be obtained from the expectation of the second moments of the ultrasonic backscattered envelope
The signal-to-noise ratio(SNR)of the backscatter envelope can be computed as a ratio of the mean to the standard deviation of the envelope,
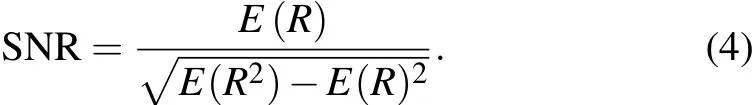
In Eqs.(2)-(4),E stands for the statistical mean or the expectation.
2.2.Cancellous bone specimen
Cancellous bone specimen was cut from the proximal end of fresh bovine femurs along the anatomic orientations(i.e.,proximal-distal,medial-lateral,and anterial-posterial directions).With the dense cortical part removed,the cancellous bone specimen was sawed into a cuboid shape(approximately 2.0×2.0×1.5 cm)in a local machining center.The bone marrow was flushed out using a high-pressure water jet.After the water flush,the bone specimens were stored for 48 hours in a solution of 1:1 chloroform/ethanol to dissolve any remaining bone marrow.A total of 24 cancellous bone specimens were used in this study.
The bone specimens were degassed in distilled water and underwent a Micro-CT scan(Sky-scan1076,Skyscan,Antwerp,Belgium)for measurement of the bone density and microstructure.The Micro-CT measurement was performed by certified technicians.The bone specimens were scanned and reconstructed with a spatial resolution of 18μm.Reconstruction was done using NRecon?software(version 1.6.9.8,Skyscan,Antwerpen,Belgium).A cuboid volume of interest(approximate 10 mm in length)within the center of each bone specimen was delineated for data analysis.Morphological properties of trabecular structure were measured using direct method without any model-based.[48]The CT Analyzer software suite(CTan,version 1.14.4.1,Skyscan,Antwerp,Belgium)was employed to calculate the BMD and microstructural information of the specimens,including the bone volume fraction(BV/TV),the bone surface over the total volume(BS/TV),mean trabecular thickness(Tb.Th),trabecular number density(Tb.N),mean trabecular separation(Tb.Sp),connective density(Conn.D),structure model index(SMI)and the degree of anisotropy(DA).[49]
2.3.Ultrasonic backscatter measurements
Figure 1 shows a schematic view of the backscatter measurement system.The ultrasonic backscatter measurements were performed using a three-dimensional ultrasonic scanning system(Ultra-pac scanning,PK268-03B,NJ,USA).A focused ultrasonic transducer(V305,the diameter A=0.75 inch(1 inch=2.54 cm),focal length F=1 inch,central frequency is f=2.25 MHz,Olympus-Panametrics Inc.,MA,USA)was immerged in degassed water and used to transmit the ultrasonic signals.Cancellous bone specimens were placed in degassed water tank.The distance between bone specimens and transducer was adjusted in each case so that the depth of the backscatter signal used for data analysis(approximately 8μs-14μs,as shown in Fig.2)was approximately centered about the transducer focal length.[23]The ultrasonic beam was along the medial-lateral direction of the specimens and the ultrasonic waves propagated perpendicular to the main trabecular orientation.[19,44]The backscattered signal was received by the same transducer and recorded with a 128-waveforms average in the time domain to reduce the random noise.The sample frequency of the backscatter signal was 100 MHz.Using a 3-axis motor controller(Ultrapac scanning,PK268-03B,NJ,USA),spatial scan was performed on each bone specimen with a 1.0-mm interval,and the scanned region of interest was 1.0×1.0 cm across the top of bone specimen.Therefore,100 A-line backscatter signals from different locations were obtained for each specimen.The backscatter signals were stored for of fline analysis.Considering the bone samples in a cuboid shape(approx.2.0×2.0×1.5 cm)and the ultrasonic scanned region of interest(1.0×1.0 cm),there was at least approx.4-mm bone tissue between the ultrasonic mainlobe beam and the surrounding border of bone sample.Therefore,the contribution of reflected waves from surrounding trabecular border was relatively small and might be neglected.The analyzed backscatter signal was mainly derived from the scattering from the internalstructure ofcancellous bone.The wave reflected by a polished steel plate at the focal length of the transducer was measured as the reference signal.The effective frequency band(1.46 MHz-3.22 MHz)was determined from the-6-dB bandwidth of the reference signal.

Fig.1.A schematic view of the backscatter measurement system.
2.4.The backscatter signal analysis
The frequency-dependent attenuation was estimated using a short time Fourier analysis multinarrow-band technique.[23,50]A narrow rectangular window(length=2μs)was displaced with 50%overlap along each analyzed part of backscatter signal(8 μs-14 μs)and the backscatter power spectrum wasobtained with each windowed signal.The power spectrum from all scanned sites were averaged to obtain the spatially averaged power spectrum.Assuming that the trabecular bone specimen is homogeneous,the frequency-dependent attenuation(α(f))could be estimated as a function of frequency from the slope of a linear fit to the logarithmic decay of the spatially averaged power spectrum versus ultra-sonic propagation depth in cancellous bone.[23,50]The measured normalized broadband ultrasound attenuation(nBUA)of the bone specimens had a mean±standard deviation of 16.7±2.7 dB/MHz/cm,and ranged from 8.7 dB/MHz/cm to 23.0 dB/MHz/cm.
The measured backscatter signals were compensated for the frequency-dependent attenuation in the following method.[20]First,the backscatter signal was fast Fourier transformed(FFT)to obtain the amplitude spectrum.Then,each spectral component in effective frequency band was individually compensated for ultrasonic attenuation.Next,inverse Fourier transform was applied to the attenuation-compensated spectrum.Finally,the attenuation-compensated backscatter signal(S(t))was determined as the real part of the constructed complex signal.The frequency-dependent-attenuation compensation process is described by the formula[20]
where FFT is a complex spectrum of original backscatter signal,c denotes velocity of the longitudinal wave in trabecular bone,α(f)is the frequency-dependent attenuation of ultrasound waves,i stands for the imaginary unit,and[fmin-fmax]is the effective frequency band.
Figure 2 shows a typical A-line original ultrasonic backscatter signal and the attenuation-compensated waveform.The envelope of the backscatter signal was obtained using Hilbert transform.A specular echo(i.e.,reflected wave)with relatively large amplitude is usually observed in front of the backscatter signal.The reflected wave is a specular reflection resulting from the mismatch between the acoustic impedances of soft tissue(or water)and bone.To analyze the backscattering effect of cancellous bone,the specular echo was usually excluded in the backscatter analysis.[19,51]As illustrated in Fig.2,a rectangular window(length=6μs)starting after the excluded signal(length=4μs)was used to select the backscatter envelope for data analysis.For each bone specimen,the measured 100 A-line backscattered waveforms with a 6-μs-duration analyzed signal(sampling frequency=100 MHz)resulted in a data sequence of 6×10⁴envelopes,which are sufficient for statistical analysis.The Nakagami parameters m,Ω,and the SNR were calculated with the analyzed envelopes(6×10⁴data for each bone specimen)using Eqs.(2)-(4),respectively.Considering that the frequencydependent attenuation was compensated for the backscatter signal,different selections of backscatter signal showed little in fluence on the backscatter statistics.
2.5.Statistical data analysis
Descriptive statistics and the distribution of all of the measurements were examined.Means and standard deviations(SD)were calculated for all of the bone and backscatter parameters.Kolmogorov-Smirnov(KS)tests were conducted to test the hypothesis that the backscatter envelope followed a Nakagami distribution with the measured model parameters.Using simple linear regressions,we assessed the relationships between bone features and Nakagami-model parameters.Finally,forward stepwise multiple regressions were used to produce optimal models for predicting Nakagami distribution properties using combinations of bone density and microstructural variables.The introduction and removal of new variables in the equation was analyzed with regard to significance of R2change(an entrance tolerance of 0.05,and an exit tolerance of 0.10).The adjusted multiple R2of these optimal models was calculated as well as the increase of R2(ΔR2),representing the variance of backscatter properties explained by these optimal models independently of BV/TV.Statistical results were considered significant for p values less than 0.05,except speci fically noted.All of the statistical computations were processed in MATLAB(Mathworks,Natick,MA).
3.Results
3.1.Descriptive statistics for backscatter in cancellous bone
Table 1 lists the descriptive statistics forthe Nakagamiparameters and bone features.The Nakagami parameter m was with a mean±standard deviation of 0.84±0.13,ranged from 0.58 to 1.09.The SNR of the envelope was 1.84±0.09,in the range of 1.63 to 1.97.KS tests showed that the backscatter envelope followed a Nakagami distribution with the measured parameters m and Ω at a 0.05-significance level(KS test fails to rejectthe nullhypothesisatthe 0.05 significance level).Figure 3 shows examples of histograms of the backscatter envelope from cancellous bone specimens with low bone density(a)and high bone density(b).The fitted Rayleigh distribution and theoretical Nakagami distribution were also illustrated in Fig.3.Note that for Rayleigh distributions,m is equal to 1,and SNR is 1.91.[35,36]The value of m and SNR indicated that there was a deviation from Rayleigh distribution and the backscatter signal from cancellous bone mainly followed pre-Rayleigh distributions.As bone density increased,the deviation from Rayleigh distribution decreased and the backscatter envelope gradually yield Rayleigh statistics for high-density cancellous bone.

Fig.3.Examples of histograms of the backscatter envelope from cancellous bone specimens with(a)low density and(b)high density.
3.2.Associations between Nakagami statistics and bone features
The scatter plots of the associations between the parameter m and BV/TV and mean trabecular number(Tb.N)are shown in Fig.4(a)and Fig.4(b),respectively.The m yield a significant correlation with the BV/TV(R=0.81,p<0.001).A significant,positive correlation was found between m and Tb.N(R=0.77,p<0.01).As shown in Fig.5,significant correlations were observed for the parameter Ω and the BMD(R=0.8,p<0.001)and the structure model index(SMI,R=-0.65,p<0.01).
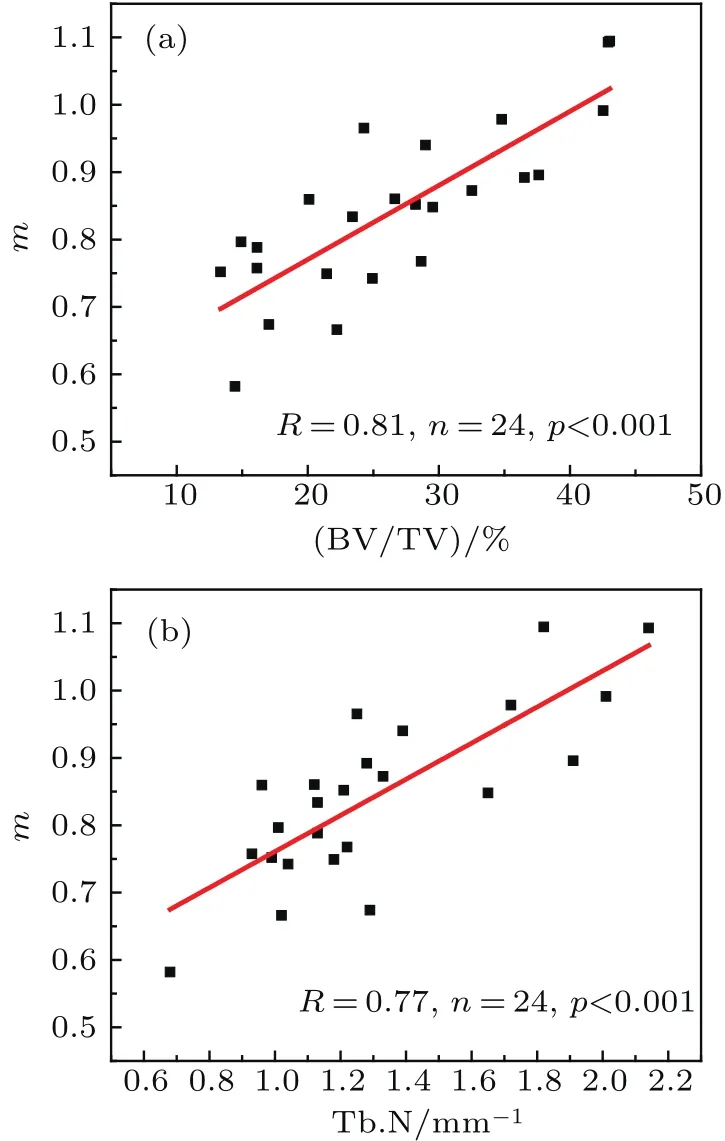
Fig.4.The associations between(a)parameter m and BV/TV and between(b)parameter m and Tb.N.

Fig.5.The associations between(a)parameter Ω and BV/TV and between(b)parameter Ω and SMI.
Table 2 summarizes Pearson’s linear correlations between the statistics of the backscatter signal and the bone features.The statistics from the backscatter signal were significantly correlated with BMD(R=0.76-0.8,p<0.001),BV/TV(R=0.77-0.81,p<0.001)and the microstructure of cancellous bone(|R|=0.41-0.78,p<0.05).No significant correlations were observed between the backscatter statistics(m,Ω,and SNR)and the degree of anisotropy(DA).Among the bone features,the BV/TV yielded the best correlation with the Nakagami parameters and SNR of the backscatter envelope.
Table 3 summarizes the optimal models for predicting Nakagami distribution parameters using combinations of bone density and microstructural variables.The results showed that the BV/TV was the main determinant of Nakagami parameters.Among the microstructures,only mean trabecular bone separation(Tb.Sp),bone surface over the total volume(BS/TV)and SMI produced significantly independent contribution to Nakagami distribution parameters,and the increase of the variance explained was small(ΔR2=6.4-10.2%,p <0.05).The multiple regression models based on BV/TV combined trabecular microstructure achieve slightly better predictive performances(adjusted R2=0.74 at best,p<0.001)than models based on BV/TV alone.The BMD did not contribute significantly to the multiple regression models in prediction of Nakagami distribution parameters.
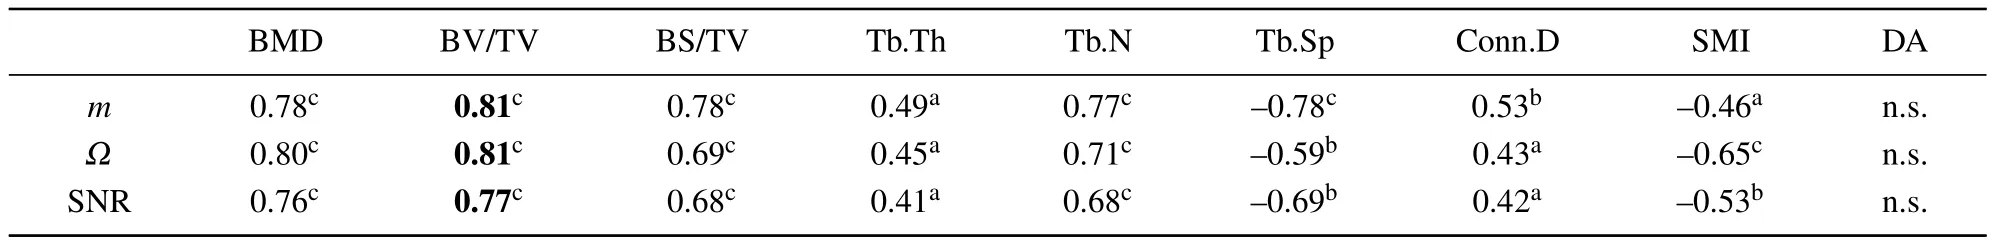
Table 2.Linear correlations between the distribution statistics and bone features.Bold values indicate better correlations than other results and corresponds with the most predictive univariate predictor.a p<0.05;b p<0.01;c p<0.001.

Table 3.Multiple regression models predicting Nakagami-model parameters with bone densities and microstructure.The associations were positive unless otherwise indicated by a negative sign before the independent variable.a p<0.05;b p<0.01;c p<0.001.The third column is the root mean square error(RMSE)of the regression.The fourth column is the square of the adjusted Pearson’s correlation coefficient of the regression.The fifth column is the increase in the square of the adjusted Pearson’s correlation coefficient compared to a univariate regression based on BV/TV as the independent variable.
4.Discussion
The backscatter signal from cancellous bone was in fluenced by the backscatter effect,ultrasonic attenuation and transducer diffraction properties.Ultrasonic attenuation in cancellous bone was much heavier than that in soft tissue.The frequency-dependent attenuation of ultrasound produced a depth-dependentexponentialdecay forthe backscattered signal in cancellous bone.The attenuation affect the amplitude and frequency content of the scattered signal and thus significantly in fluenced the envelope statistics.Therefore,we compensated the frequency-dependent attenuation for ultrasonic backscatter signals in cancellous bone.A strong focused transducer(f-number=1.33)was used in the backscatter measurements.Due to the effect of focusing,the ultrasonic beam was variated with ultrasonic propagation depth along the main axis.In the backscatter measurements,the ultrasonic interrogated trabecular volume(approximate 5.0 mm in length)was centered about the focal point of the transducer.Considering that 1-dB decay of the sound intensity along the main axis corresponded to a depth of focus of approx.8αk×λ ×(F/A)2=5.4 mm(αk=0.51 corresponding to 1-dB ultrasound intensity decay).[52,53]We can see that the variation of the analyzed ultrasound signal due to focusing effect was quite small(less than 1 dB).The impact of focusing on the analyzed signal could be diminished with the measured trabecular volume centered about the transducer focal length.[23]
The statistics of backscattered envelope were essentially dependent on the effective number of scatterers per resolution cell.[54]The volume of resolution cell(VRC)was mainly determined by the ultrasonic beam profile and the range resolution of backscatter measurement.[38,55]Assuming the speed of ultrasound at 2.25 MHz in cancellous bone is v=1690 m/s(Riekkinen et al.,2006),the range resolution of ultrasound waves is determined as ΔL=v× ΔT/2=0.93 mm,[38,55]where ΔT ≈ 1.1 μs is the pulse length corresponding to pulse waveform above-10-dB threshold of the reference signal.The lateral radius of the-10-dB mainlobe beam is estimated as r=0.9λ×F/A=0.90 mm,[37,52]where the transducer diameter A=0.75 inch,focal length F=1 inch.Considering the main beam is in a circular shape in lateral direction,the cross-sectional area of the beam was approximately 2.54 mm2.The VRC could be estimated as the product of the cross-sectional area of the-10-dB mainlobe beam and the range resolution,i.e.,VRC=2.36 mm3.[38,55]The mean trabecular number(Tb.N)describe the number density of trabecular scatterers(i.e.,the regular and diffuse trabecular bones).Therefore,the number of scatterers per resolution cell is estimated as VRC×Tb.N3=approximately with a mean value of 5.3,ranged from 0.7 to 23.1 scatterers(the Tb.N is with a mean value of 1.31/mm,ranged from 0.68/mm to 2.14/mm).
The measured Nakagami parameter m,ranged from 0.58 to 1.09,yield significant positive correlations with bone densities and trabecular number density.The number of scatterers in resolution-cell volume is estimated ranged from fewer than 1 to plenty 23.1 scatterers,dependent on the bone density of the specimens.Considering that the low-density bone specimens with relatively small Tb.N,the number density of scatterers in resolution-cell volume seems not high enough to meet the requirements of the central limit theorem.According to Shankar,a few scatterers in the range cell(a low concentration)result a pre-Rayleigh distribution or Nakagami-Gamma distribution with m<1.[36]Therefore,the backscatter envelopes from the low-density cancellous bones mainly followed pre-Rayleigh distributions(m<1 and SNR<1.91).The Rayleigh(Nakagami m=1 and SNR=1.91)and Rice distributions(Nakagami m>1 and SNR>1.91)emerged only when the number density of the scatterers is high enough(a high concentration)to meet the requirements of the central limit theorem.[36,47,56]With increasing bone density,the number density of scatterers(trabecular bones)increased(Tb.N was positively correlated with BV/TV)and approached the requirements of the central limit theorem,the envelope of the backscatter signal changed from pre-Rayleigh to Rayleigh distributions,resulting in an increase in the Nakagami parameter m and the SNR of the envelope.That might be the reason for the positive correlations observed between parameter m(and SNR)and the bone density and Tb.N.The scaling parameter Ω,calculated as the expectation of the second moments of the backscattered envelope,was related to the average energy or power in the signal.Note that the backscatter scatter signal was compensated for ultrasonic attenuation in this study.As the bone densities increased,the backscatter cross-section increased and the signal energy of the backscatter signal was increased.Therefore,positive correlations were observed between Ω and the bone density measurements.
The Nakagami distribution statistics(m,Ω,and SNR)yielded significant correlations with the bone densities(BMD and BV/TV)and trabecular structural features.The best determinant for the backscatter distribution statistics was BV/TV,explaining approx.The 59%-66%of the variance in the Nakagami statistics,and the remaining variance might be due to other factors such as bone microarchitecture or measurement errors.Multiple linear regressions based on bone density plus microarchitectural features achieve slightly better predictive performance than models based on bone density alone,which indicates that trabecular microstructure produced significant contributions to the prediction of backscatter statistics(m,Ω,and SNR)independent of bone densities.It is important to note that the envelope statistics are not only dependent on the nature of trabecular bone being measured,but also are dependent on the resolution cell volume of backscatter measurement system.The variation in the number of scatterers in resolution cell volume may be due to the insonating frequency,pulse shape,and the characteristics of the transducer.Measurements with different transducers would have a direct in fluence on the statistics of the backscatter envelope.Therefore,careful design of backscatter measurement system is quite necessary for the statistics of backscatter envelope from trabecular bone.
One limitation of this study is that bovine cancellous bone were used in the in-vitro backscatter measurements.In addition to that the bovine bone was slightly denser than human cancellous bone,[6,24]there might be some difference in the architecture between bovine bone and human bone.The Tb.Th ofbovine bone specimens in this study(0.20±0.04)was much bigger than that of human bone(0.138±0.025),[6,24]while approximately same values of Tb.N(1.31±0.38/mm for bovine bone in this study and 1.33±0.40/mm for human bone).[6,24]The Nakagami model parameters might have potential for cancellous bone characterization,but the extrapolation of conclusions drawn from bovine bones to human bones should be more careful.The present in-vitro study was performed on cancellous bone without the cortical bone and overlying soft tissue.However,the outer cortical bone and overlying soft tissue emerge naturally for in vivo measurements.The overlying soft tissue and cortical bone will produce a frequencydependent attenuation of ultrasonic waves,[57]while the in fluence on Nakagami model parameters await future studies before clinical application.The multiple reflections in the dense cortical bone showed significant in fluence on the backscatter signal.[58,59]We suspect the multiple reflected waves might also produce interference signals for the measurement of Nakagami model parameters.The in fluences of soft tissue and cortical bone need to be determined before the in vivo measurement of cancellous bone using the Nakagami distribution model.
5.Conclusions
In conclusion,in-vitro ultrasonic backscatter measurements were performed,and a general Nakagami model was adopted for bone evaluation.The statistics of the backscatter envelope yielded moderate to strong correlations(R up to 0.81,p<0.001)with bone density and microstructure measurements.The results also demonstrated that the backscat-ter signal from cancellous bone mainly followed pre-Rayleigh distributions.Multiple linear regressions showed that BV/TV was the main determinant of Nakagami parameters,but multiple models based on BV/TV combined with trabecular microstructure(i.e.,SMI,BS/TV,and Tb.Sp)achieve slightly better predictive performances than models based on BV/TV alone,with a moderate increase of the variance explained(ΔR2=10.2%at best,p<0.05).The parameters derived with Nakagami model might be used for cancellous bone characterization.This study suggests that the statistical models have potential for the ultrasonic backscatter characterization of cancellous bone.
猜你喜歡
Chinese Physics B(2022年9期)2022-09-24 07:58:46
Chinese Physics B(2022年8期)2022-08-31 09:54:56
語數(shù)外學(xué)習(xí)·初中版(2022年1期)2022-05-30 21:26:23
Chinese Physics B(2021年9期)2021-09-28 02:17:50
考試與評(píng)價(jià)·七年級(jí)版(2021年3期)2021-08-14 22:22:45
美與時(shí)代·美術(shù)學(xué)刊(2018年4期)2018-06-21 10:18:34
小學(xué)生必讀(中年級(jí)版)(2018年3期)2018-06-05 06:08:12
Chinese Physics B(2017年9期)2017-08-30 08:25:00
小說月刊(2017年8期)2017-08-16 22:34:39
美與時(shí)代·城市版(2017年4期)2017-06-09 11:00:05

- Chinese Physics B的其它文章
- Superlubricity enabled dry transfer of non-encapsulated graphene?
- Synthesis and characterization of β-Ga2O3@GaN nanowires?
- Low-energy(40 keV)proton irradiation of YBa2Cu3O7-x thin films:Micro-Raman characterization and electrical transport properties?
- Preliminary investigation on electrothermal instabilities in early phases of cylindrical foil implosions on primary test stand facility?
- Effects of secondary electron emission on plasma characteristics in dual-frequency atmospheric pressure helium discharge by fluid modeling?
- In fluence of low-temperature sul fidation on the structure of ZnS thin films?