
Detecting treeline dynamics in response to climate warming using forest stand maps and Landsat data in a temperate forest
2018-09-12 09:14:52MalihehArekhiAhmetYesilUlasYunusOzkanandFusunBalikSanli
Forest Ecosystems 2018年3期
Maliheh Arekhi,Ahmet Yesil,Ulas Yunus Ozkan and Fusun Balik Sanli
Abstract Background: Treeline dynamics have inevitable impacts on the forest treeline structure and composition. The present research sought to estimate treeline movement and structural shifts in response to recent warming in Cehennemdere,Turkey. After implementing an atmospheric correction, the geo-shifting of images was performed to match images together for a per pixel trend analysis. We developed a new approach based on the NDVI,LST(land surface temperature) data, air temperature data, and forest stand maps for a 43-year period. The forest treeline border was mapped on the forest stand maps for 1970, 1992, 2002, and 2013 to identify shifts in the treeline altitudes, and then profile statistics were calculated for each period. Twenty sample plots (10 × 10 pixels) were selected to estimate the NDVI and LST shifts across the forest timberline using per-pixel trend analysis and non-parametric Spearman’s correlation analysis. In addition, the spatial and temporal shifts in treeline tree species were computed within the selected plots for four time periods on the forest stand maps to determine the pioneer tree species.Results: A statistically significant increasing trend in all climate variables was observed, with the highest slope in the monthly average mean July temperature (tau = 0.62, ρ < 0.00). The resultant forest stand maps showed a geographical expansion of the treeline in both the highest altitudes (22 m–45 m) and the lowest altitudes(20 m–105 m) from 1970 to 2013. The per pixel trend analysis indicated an increasing trend in the NDVI and LST values within the selected plots. Moreover, increases in the LST were highly correlated with increases in the NDVI between 1984 and 2017 (r = 0.75, ρ < 0.05). Cedrus libani and Juniperus communis app. were two pioneer tree species that expanded and grew consistently on open lands, primarily on rocks and soil-covered areas, from 1970 to 2013.Conclusion: The present study illustrated that forest treeline dynamics and treeline structural changes can be detected using two data sources. Additionally, the results will have a significant contribution to and implication for treeline movement studies and forest landscape change investigations attempting to project climate change impacts on tree species in response to climate warming. The results will assist forest managers in establishing some developmental adaptation strategies for forest treeline ecotones.
Keywords: NDVI, Geoshift, LST, Timberline, Mann-Kendall, Landsat, Climate warming
Background
Do forest treelines respond to global warming? The vegetation of treelines and alpine ecotones is among the most vulnerable and sensitive to the impact of global warming on earth (Masek 2001; Bharti et al. 2012;Weisberg et al. 2013; Gaire et al. 2017; Mishra and Mainali 2017). The movement of forest treelines towards higher altitudes is mainly related to thermal variations and other factors (Zinnert et al. 2011; Du et al. 2017;Gaire et al. 2017; Holtmeier and Broll 2017; Skowno et al. 2017), such as enhanced atmospheric CO2and nitrogen deposition (Masek 2001; Grace et al. 2002; Salzer et al. 2009; Capers et al. 2013; Skowno et al. 2017).Simultaneously, increases in these factors usually result in the migration of alpine plants to upper altitudes.Moreover, downward shifts in treelines and decreases in treeline stability have been reported due to harsh environmental conditions (Zhang et al. 2009; Du et al. 2017;Gaire et al. 2017) and human disturbances (Jump and Penuelas 2005; Li et al. 2016b). Indeed, these shifts probably have a remarkable influence on plants that are a carbon sink major source (Hanberry and Hansen 2015;Li et al. 2016a). In fact, the reliable assessment of forest treeline dynamics is essential to conserve the ecological condition of alpine ecotone biodiversity for sustainable management and forest conservation strategies (Grace et al. 2002; Holtmeier and Broll 2010; Mishra and Mainali 2017; Skowno et al. 2017).
Various methods have developed and used in various parts of the world to determine woody plant encroachment in response to global warming, including methods using dendroecological techniques (Danby 2007; Salzer et al. 2009; Du et al. 2017; Gaire et al. 2017; Wang et al.2017b), aerial photograph assessments (Lutz et al. 2013;Solár 2013; Ropars et al. 2015), field plot resurveys(Grabherr et al. 1994; Holtmeier and Broll 2005; Danby and Hik 2007a; Elmendorf et al. 2012), satellite images(Masek 2001; Holtmeier and Broll 2005; Fraser et al.2011; Zinnert et al. 2011; Patrick Shawn Sawyer 2014;Mishra and Mainali 2017; Skowno et al. 2017), repeated photographic evidence (Kullman 1993), palynological data investigations (Grace et al. 2002), seedling recruitment studies (Miller et al. 2017), and model scenarios(Masek 2001; Trivedi et al. 2008). Furthermore, the number of successful investigations that have integrated remote sensing images and historical maps is increasing(Wallentin et al. 2008; Zinnert et al. 2011; Weisberg et al. 2013). Simultaneously, remote sensing data provide both fine- and coarse-resolution data (Fraser et al. 2011,2012). Moreover, Landsat satellite data are the most effective data sets and cover large areas (Arekhi et al.2017; Chen et al. 2017). Landsat images, which have been recorded since 1972 and are freely available for a period of more than 45 years with high spatial-temporal resolution and a 16-day revisit time (Masek 2001; Wang et al. 2017a), represent one of the most valuable data sources for determining woody plant encroachment.Likewise, they provide a great resource for depicting timberline dynamics and treeline movements with various methods and vegetation indices (Holtmeier and Broll 2005, 2017; Zinnert et al. 2011; Bharti et al. 2012;Elmendorf et al. 2012; Gaire et al. 2017; Wang et al.2017a). The NDVI is the most common vegetation index, and it is well known as a good representative of plant biomass. Additionally, the NDVI is directly indicative of plant photosynthetic activity (Zinnert et al. 2011;Du et al. 2016; Li et al. 2016a; Mishra and Mainali 2017). Therefore, monitoring of changes in the NDVI values across the forest timberline border provides a quantitative estimate of the tree biomass and density over time (Singh et al. 2011; Bharti et al. 2012; Sawyer and Stephen 2012; Iverson and McKenzie 2013), which demonstrates trends in historical shifts that can be detected by remote sensing techniques (Singh et al. 2011; Raynolds et al. 2013; Ropars et al. 2015; Morley et al. 2017).
Combining forest stand maps with long-term Landsat data provides a good opportunity for detecting and monitoring historical shifts in the forest structure, timberline border, and treeline movement(Zinnert et al. 2011; Solár 2013). Additionally, another aspect of remote sensing data accessibility is that its data include LST, which provides an unprecedented opportunity to investigate and compare forest dynamics (van Leeuwen et al. 2011) among certain interval times. The importance of LST in climate change analyses has been proven (Cristóbal et al. 2008; Brabyn et al. 2014; Shuman and Comiso 2002; Parastatidis et al. 2017). However, LST anomalies are poorly investigated, and the spatial and temporal monitoring of LST can be used in treeline monitoring studies. The Mediterranean region is recognized as an area impacted by global warming in Turkey, and it is facing increasing summer temperatures and winter precipitation (Solomon et al. 2007;Talu et al. 2010; Parolly 2015). Moreover, evidence of the upward movement of treelines has been reported in the eastern Karadeniz region (Black Sea),and treelines may move approximately 200–400-m according to climate change predictions (Terzioglu Salih 2015). Some climate change scenarios have indicated that the mountain flora in the western and central Taurus mountain regions (Parolly 2015) and the eastern Mediterranean region are threatened (Ozturk et al. 2015). Conventionally, a treeline vertical movement of approximately 640 m is expected to occur with a 4.5 °C warming rate per century and 33 m of movement per 1 °C increase.Holtmeier and Broll (2017) stated, “82% of coarse scale(regional) variation in treeline elevation is associated with thermal conditions”. However, there is evidence that accel-erated glacier melt in sensitive, snow-covered mountain areas due to increasing temperature impacts treeline structure and composition (MacDonald et al. 2008; Capers et al. 2013; Wilmers et al. 2013;Holtmeier and Broll 2017). However, there are a few studies investigating the case of forest treelines in the Mediterranean region, and there is a gap in knowledge about forest treeline dynamics and structural shifts.
The present study objectives were 1) to quantify treeline movement rates from 1970 to 2013 by the combination of NDVI maps with forest stand maps;2) to explore whether the increasing trends in LST and NDVI coincided with treeline advancement from 1984 to 2017; 3) to determine promising tree species in the timberline border in four times (1970, 1992,2002, 2013) by overlaying forest stand maps on NDVI maps.
Method
Study area
The present research focused on one area in the Mediterranean region, Cehennemdere, which is located in the southern part of Turkey (37.430–38.430° E, 44.650–44.850°N) (Fig. 1). The study area covers 16,413.5 ha, of which 8822 ha were selected as the research area. Investigating the forest management plans of each studied period showed that selected study area was a protected area for wildlife and vegetation gene preservation in all periods. The annual mean temperature is 13.4 °C. Moreover, it is a unique area consisting of various natural vegetation communities, namely, Pinus nigra, Abies cilicica, Juniperus oxycedrus, Quercus sp., Cedrus libani, Juniperus communis,Juniperus oxycedrus, Pinus brutia. The study area in-dicates the southern boundary of forest in Turkey, which is known as the Taurus Mountains. The study area covers indigenous trees and it receives precipitation at high elevations in the summer months, according to forest management plans (OGM, 2016).
Landsat data preparation and other data collection
Landsat data were acquired from ESA (European Space Agency) (http://www.esa.int/ESA). These data have a medium, 30 m spatial resolution. The 1972 Landsat MSS was considered a base map for determining the forest treeline in 1984. Concurrently, images were acquired from 1984 to 2017, except for 2012 (29 Landsat 5 TM and four Landsat 8 OLI images). However, on both the ESA and USGS websites, Landsat data for the maximum growing season were not available from 1972 to 1983.Typically, phonological differences are another major factor impacting the digital number of images. For this reason, the maximum growing season was chosen to reduce the influence of some errors (Fraser et al. 2011). In addition, Bing Aerial data with a high spatial resolution,which were taken in 2017, were used to monitor the current status of the forest timberline and treeline. The atmospheric correction of all scenes was performed using the Dark Object Subtraction 1 approach (Chavez and others 1996; Congedo 2016). In addition, all images had been orthorectified by the provider, and all preprocessing processes, including checking cloud impacts,were performed. Further, Landsat 8 OLI images were considered base images, and other images were geoshifted by the “geoshift” function of the “Landsat”package. It is valuable to note that applying this function on images significantly reduces the impacts of georegistration errors by warping images (Masek 2001)using georeferencing images. The NDVI maps were calculated for the study period. The LST maps were generated using statistical algorithms in three steps by considering both the NDVI and the thermal bands(Weng et al. 2004). At the same time, all images were subset to the research area. First, we derived the mean LST for each year from 1984 to 2017 to estimate the significance of the LST change trend over the study period for the entire study area. Second, 20 experimental sites(10 × 10 pixel) across the treeline ecotone boundaries were selected using the stratified random method. To illustrate, multiple plots were selected to track the forest stand shifts across the forest–alpine ecotone edges throughout the research area. Simultaneously, the established plots of mean NDVI and LST were calculated separately for each sample plot five times (1984–1992–2002-2013-2017). In addition, each plot pixels’ center was determined by the “pixel centroid” function to perform a pixel-based trend analysis for the nine time periods (1984–1988–1992–1997–2002–2007–2010–2013–2017). In addition, the forest stand maps were acquired from the General Directorate of Forestry four times(1970–1992–2002–2013). The forest stand maps were prepared using photointerpretation techniques with 1/15000 scale aerial photographs and field-based survey measurements. Each forest stand map was georeferenced and digitized by importing in the Qgis environment.Simultaneously, to display the treeline, a vector layer of the study area territory was prepared by digitizing the forest stand map. At the same time, we determined the forest treeline for each period from the available forest stand maps by digitizing the highest trees species stands on the topography map (1970–1992–2002–2013) using the “Profile tool” plugin. This plugin plots terrain profiles along interactive polylines based on the DEM with 30 m spatial resolution. Then, profile statistics were calculated through the “qProf” plugin for each treeline border elevation. Annual monthly air temperature(mean, min, max) data were obtained for 1970–2017 from the Mersin meteorological station of the Turkish State Meteorological Service. It is important to highlight that the interpolation analysis was not performed to extract the temperature grid maps due to the lack of sufficient meteorological stations within the study area. All image processing and GIS analyses were conducted with the “semi-automatic classification” plugin of Quantum GIS (QGIS Development 2015). The methodological flow chart shows the method step by step (Fig. 2). In the present study we tried to develop a new method using remote sensing, air temperature data, and forest stand maps to depict tree-line dynamics for over more than 43 years. First, Mann-Kendall trend test is used to investigate significance trend the all temperature variables. Second, the forest treeline border was mapped in forest stand maps for each study period (1970, 1992, 2002 and 2013) to identify the treeline altitude, and then the treeline altitude profile statistics for each period were computed. The treeline altitude borders were overlaid on the NDVI maps belonging to each date to detect shifts in the NDVI density. Third, 20 sample plots (10 × 10 pixels)were selected to estimate the NDVI and LST shifts at higher elevations across the timberline for the nine study periods by using per pixel trend analysis. In addition,the spatial and temporal treeline tree species shifts were computed within the selected plots for each period on the forest stand maps to determine the pioneer tree species.
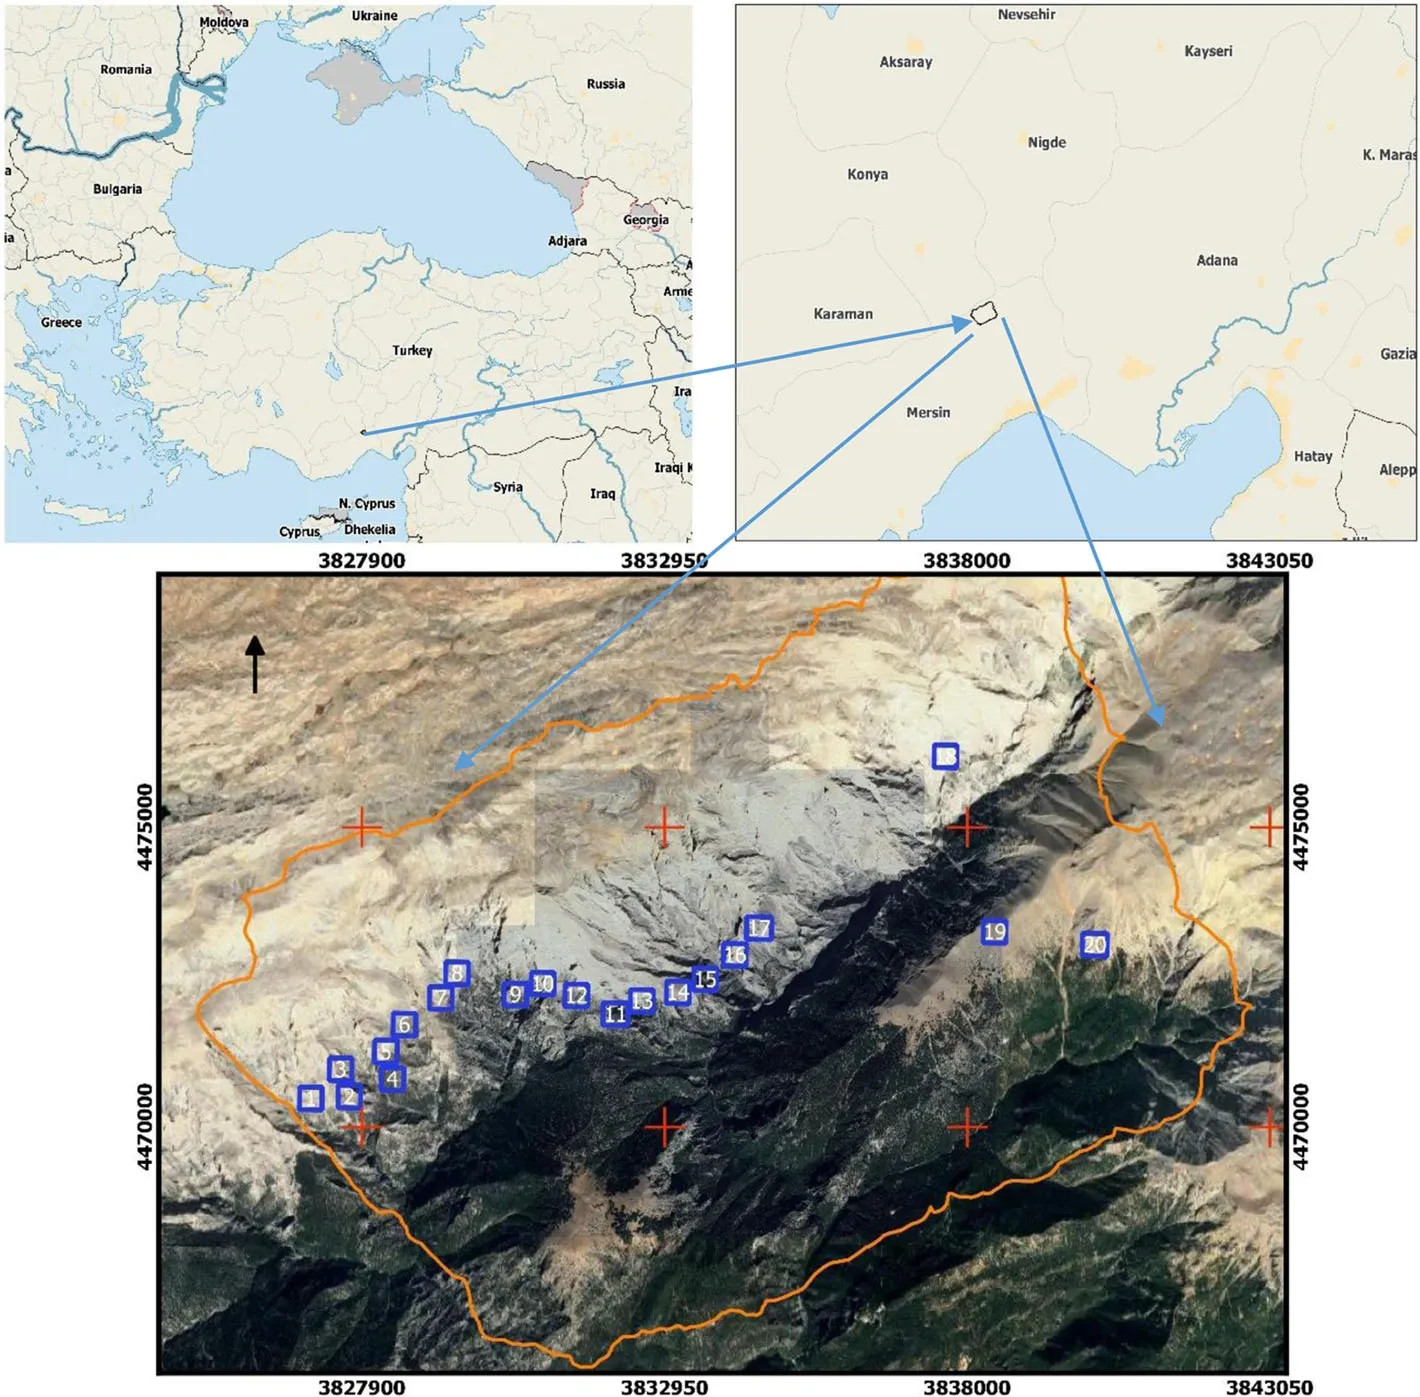
Fig. 1 Location map of the study area and sample plots in the Mersin, Turkey. The blue squares mark the locations of sample plots.
Estimating land surface temperature (LST) maps
The LST maps were estimated in three steps by Landsat thermal bands and NDVI maps using the statistical algorithms applied by Weng et al. 2004; first, the digital numbers of the images were converted to radians values.Second, the image spectral radiance was transformed into satellite brightness temperature. Third, the satellite brightness temperature was converted to land surface temperature. To explain, this process was applied to band 6 for Landsat TM and band 10 for Landsat 8 OLI. The LST map was generated for each study period in °C. Moreover, this method considers both NDVI and thermal bands to calculate the LST (Weng et al.2004).All calculations were done in the Qgis Raster Calculator and R program using the“raster package”and “Landsat package”.
Data analysis
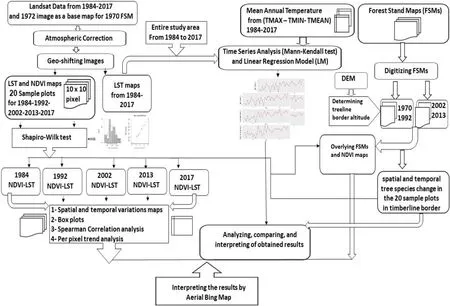
Fig.2 Research methodology framework
The non-parametric Mann-Kendall trend test and linear model(LM)were implemented to determine variable significances and trends,respectively.In particular,statistical significance was analyzed using the “tua”coefficient.Trend analysis was applied to climate parameters by the Mann-Kendall trend test to identify their trends and the significance of(Fensholt et al.2012)climate variables(monthly average temperature(TMEAN),monthly average minimum temperature(TMIN),and monthly average maximum temperature(TMAX)).Additionally,profile statistics of the treeline border elevation were computed for each year.To determine treeline shifts from the forest stand maps,the elevational variation was calculated by overlying the stand maps on a topography map for the periods of 1970–1992,1992–2002,2002–2013 separately.The obtained treeline maps were overlaid on NDVI maps from the related year to detect any changes in the NDVIdensity value for each study period at the treeline boundary.The NDVI and LST values of all 20 sampling plots were averaged and recorded in the R environment.At the same time,the normal distribution of LST and NDVI was analyzed using the Shapiro-Wilk test(nonparametric test)for all research periods.Equally,boxplots and scatter plots between the NDVI and LST were separately conducted for each year(1984–1992–2002-2013-2017).The per pixel trends for the NDVI and LST of each sample plot were computed on a pixel-based robust linear model,and the trend significance was calculated for the nine time periods(1984–1988–1992-1997-2002-2007-2010-2013-2017)using the R statistics program.Additionally,the nonparametric Spearman correlation analysis between the per pixel NDVI and LST was estimated between 1984 and 2017.Concurrently,spatial and temporal tree species changes were computed within the selected plots to monitor forest stand structure and treeline shifts for four time periods(1970–1992–2002-2013).Moreover,the significance levels were set at four values(0.00,0.001,0.01,0.05).All statistical analyses were performed with R software(TEAM and others 2010)and various Quantum GIS(QGIS Development 2015)plugins.
Results
Time series Mann-Kendall trend analysis
A statistically significant and increasing trend in all climatevariables was observed(Fig.3).The time series analysis of temperaturedata,mainly themonthly averagetemperature,indicated the study area encountered a prominent warming trend of at least 3°C since 1980(Table 1)and it warmed by 4°C since 1970.The trend analysis of the long-term mean LST(tau=0.265,ρ<0.01),monthly averagemean temperature(TMEAN),monthly average minimum temperature(TMAX),and monthly average maximum temperature(TMAX)displayed statistically a positive trend over the study period(Table 1).An analysis of the average monthly mean and maximum air temperatureover 32 years(from 1984 to 2016)revealed most significant warming trend in July((tau=0.62,ρ<0.00 for TMEAN7),(tau=0.595,ρ<0.00 for TMAX7)),January– July((tau=0.525,ρ<0.00 for TMEAN1–7),(tau=0.523,ρ< 0.00 for TMAX1–7)),and January– December((tau=0.562,ρ<0.00 for TMEAN12),(tau=0.558,ρ< 0.00 for TMAX12)),respectively(Table 1).
Elevational Treeline change
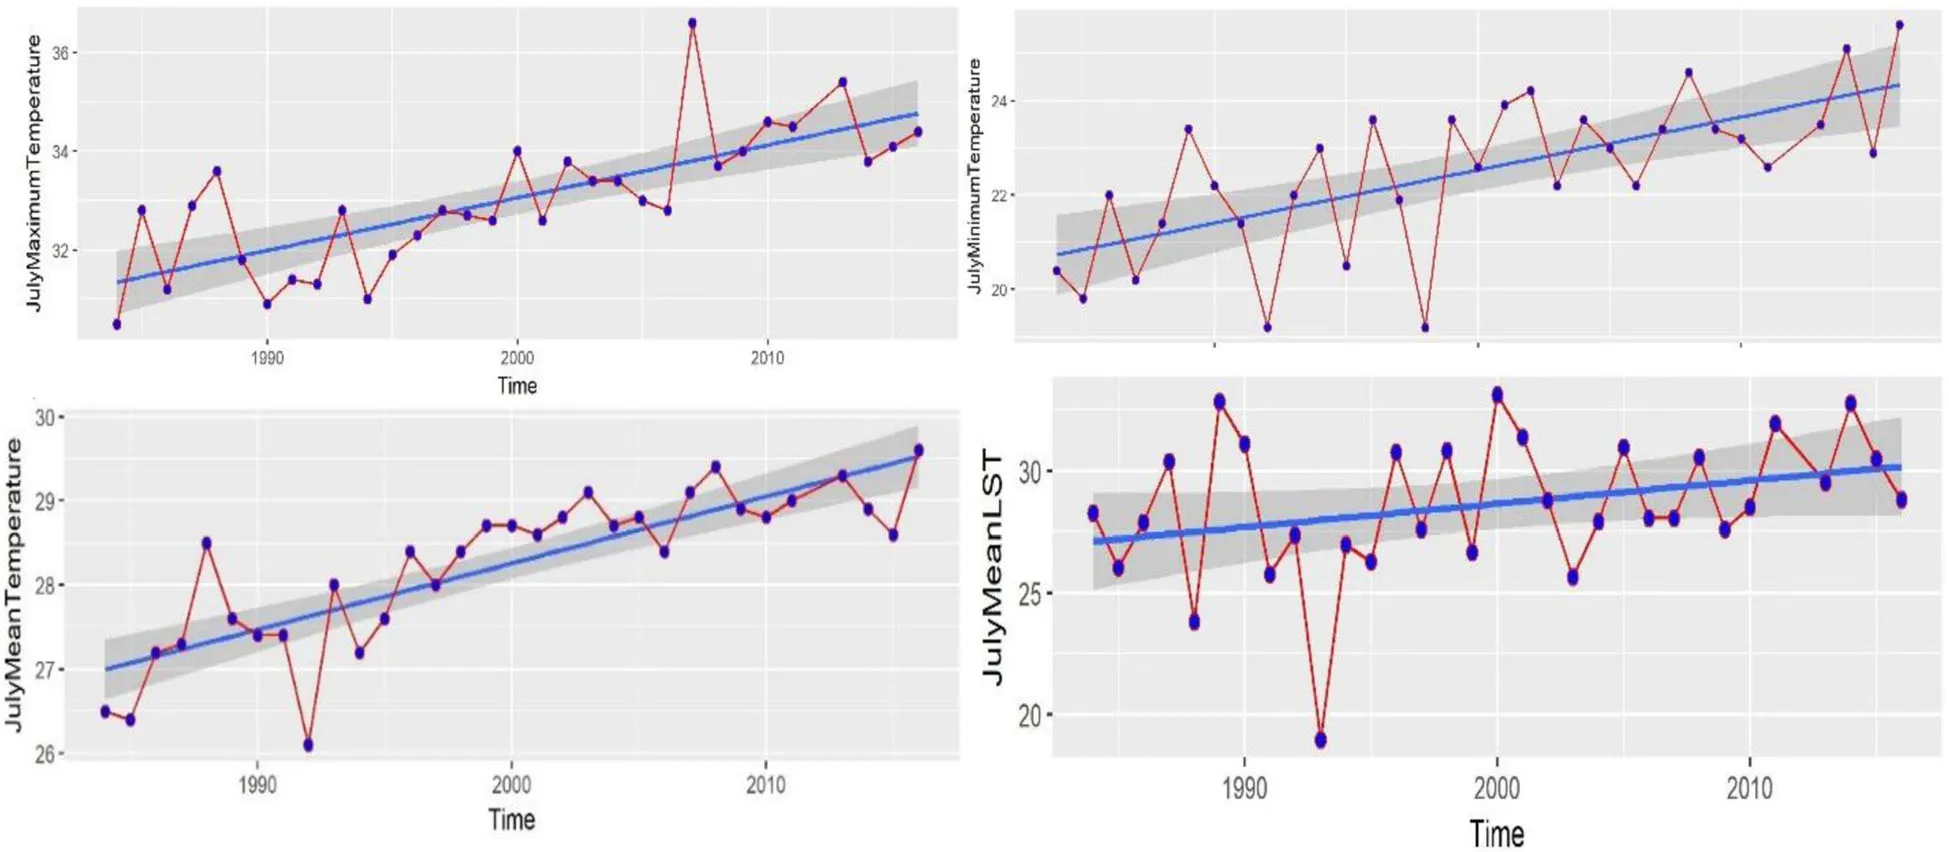
Fig.3 Variations in July temperature(TMEAN7,TMAX7,TMIN7),NDVI,and LSTfrom 1984 from 2016
The treeline altitudinal position and its change were explored for the 1970–1992,1992–2002,and 2002–2013 periods.Treeline shifts in both the lowest and highest treeline altitudes occurred in all three time periods(Table 2).The highest treeline altitude reached 2442.48 m in 2013,while it was 2335 m in 1970.The 1992–2002 period experienced a treeline rise of approximately 44.45 m,which was much greater than those of other periods.The lowest treeline altitude increased by nearly 22.3 m between 2002 and 2013.In addition,theestimated lowest treeline altitude increased from 1158.75 m in 1970 to 1303.82 m in 2013(Table 2).Similarly,the comparison of stands at the time periods revealed that the timberline density and treeline increased notably from 1970 to 2013 in the forest stand maps(Fig.4).Notwithstanding,the observed shifts were not consistent across the entirety of the forest stand boundaries.No prominent shifts were detected in some upmost stands.However,according to the spatial distribution details of the forest stand maps,there is evidence for the expansion of forest tree species in all parts of the study area,indicating treeline advancement towards higher elevations.In total,tree species patches have increased over the study period according to the documented forest stand maps,and this trend was obviously observed on the Bing Aerial images in the Qgis environment.At the same time,the visual interpretation of the NDVI maps by Bing Aerial images indicated an obvious increase across the forest stand border(Fig.4).
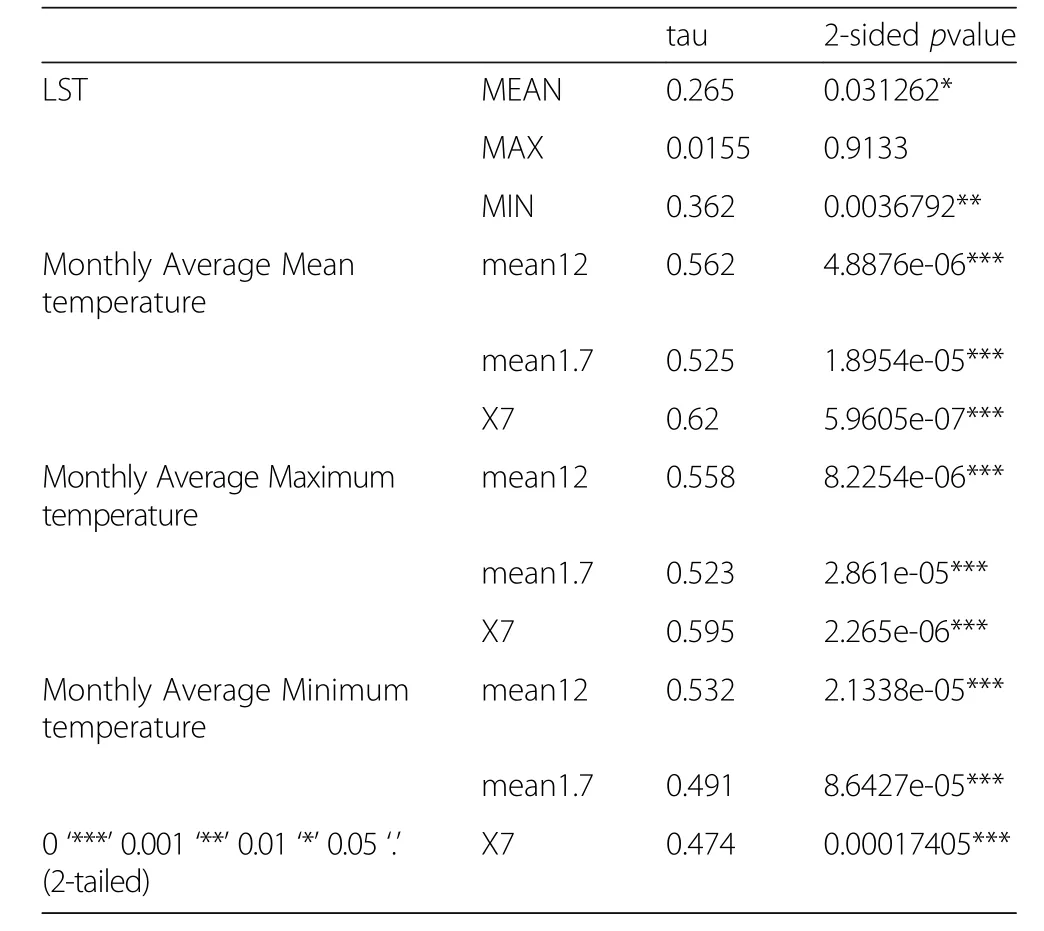
Table 1 Time seriesanalysisof climate variables(monthly average temperature(TMEAN),monthly average minimum temperature(TMIN),and monthly average maximum temperature(TMAX)),and LST(MEAN,MAX,MIN).(mean12=average January–December,mean1.7=average January–July temperature,X7=average July temperature)
Sample plot analysis
The NDVI and LST values of sample plots have increased from 1984 to 2017.Significant increases in the mean NDVI and LST range values within the sample plots were estimated for each study period(1984–1992-2002-2013-2017)(Fig.5a).The magnitude of the average NDVIshift was positive and statistically meaningful.The rise in NDVI was positively correlated with the increasing average LST(Table 4)for each study period for both the mean and minimum LST parameters but not the maximum LST parameter.A moderate positive correlation between the mean NDVI and mean LST at most sample plots in the entire study period(1984,1992,2013,2017)wasobserved,except for in 2002.Therewasa statistically significant positive correlation between the mean NDVI and the mean LST(r=0.634;ρ<0.05)in 1984(Table 3).The boxplots demonstrate a consistent increase in the mean NDVIvalues at the sample plots of the forest edges(Fig.5a).Concurrently,these event coincide with the increases in LST at the sample plots(Fig.5b).The LST range varied from 24 °C to 38 °C over the study period(Fig.5b).The mean LST and NDVIvalues demonstrated an increasing trend over time,with R2values of R2=0.94 and R2=0.96,respectively(Fig.6).Each NDVI and LST pixel showed an increasing trend over time based on the per pixel analysis(1984–1988–1992-1997-2002-2007-2010-2013-2017).The correlation analysis of the mean NDVIwith the mean LST indicated a significantly positive correlation(r=0.75,ρ<0.05).The per-pixel correlation coefficient between NDVI and LST varied(r=0.22–0.99).The mean NDVIincreased from 0.25 to 0.39 from 1984 to 2017 at the 20 sample plots(Fig.7).The mean NDVI density at each site varied among study periods.The NDVI greenness trend result was consistent with the forest tree species cover.In plots1,2,3,7,13,15,17,and 18,
the rock and soil cover extent consistently decreased and was replaced by sparse Juniperus communis spp.and Cedrus libani.Tree developmental stage,tree crown closure,and tree diameter increased gradually from 1970 to 2017 in plots 4,5,8,9,10,11,12,14,19,and 20.The monitoring of plot 16 showed there was a consistency between the rising NDVItrend and the extent of the classes(Fig.6 and Fig.8).However,each site consisted of the tree species(mostly Cedrus libani,Juniperus communis spp.),soil,and rock classes.In general,the treespecies increased from 1970 to 2013.In all observed sites,the species Cedrus libani consistently rose more than the other tree species over the study period.However,an exploration of the forest stand sample plots revealed that the gradual upward movement of Cedrus libani over the study period coincided with that of Juniperus communis from 1970 to 2013. At the same time, NDVI density was accompanied with an increasing trend of forest stand greening.Moreover, an examination of the composition and structure of each sample plot showed the complexity and diameter of the older tree species increased (Fig. 7). All sample plots had an overall reduction in the rock class from 1970 to 2013 (Fig. 8). Cedrus libani and Juniperus communis were two tree species that increased rapidly from 1970 to 2013. An expansion in Cedrus libani on the rocks was observed in the forest stand maps (Fig. 8), mostly in the sparse form. However, Quercus sp., Pinus brutia and
Pinus nigra were three tree species that disappeared in the 2013 forest stand map, while they were present in the 1970 forest stand maps (Fig. 8).
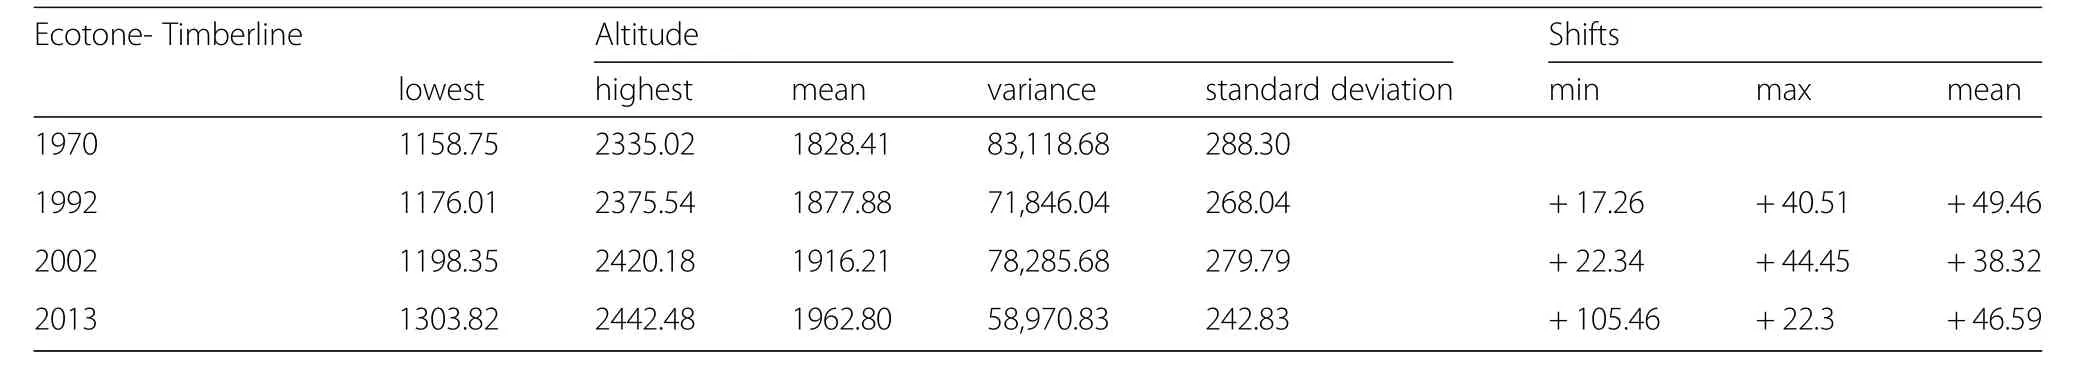
Table 2 Treeline altitudinal position(m)and itschange
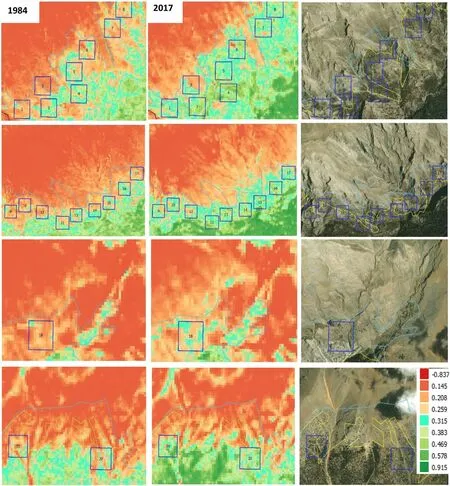
Fig.4 NDVImaps(1984,2017)(the blue squares display the locationsof sample plotson the Aerial Bing images)
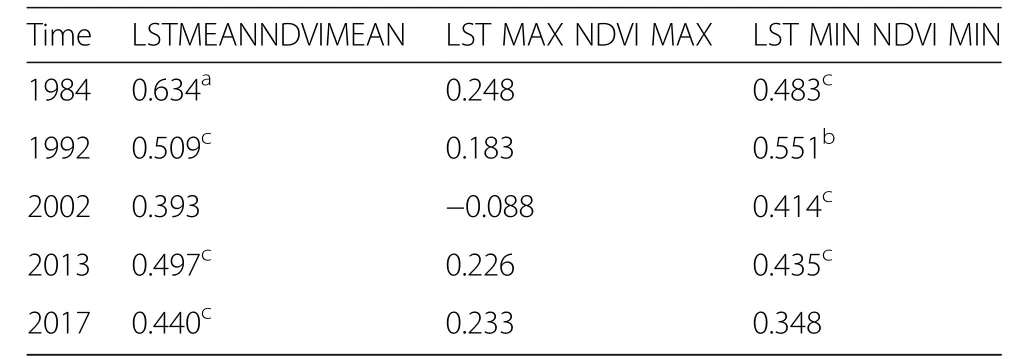
Table 3 Correlation matrix between LST(MAX,MEAN,MIN)and NDVI(MAX,MEAN,MIN))for four periods
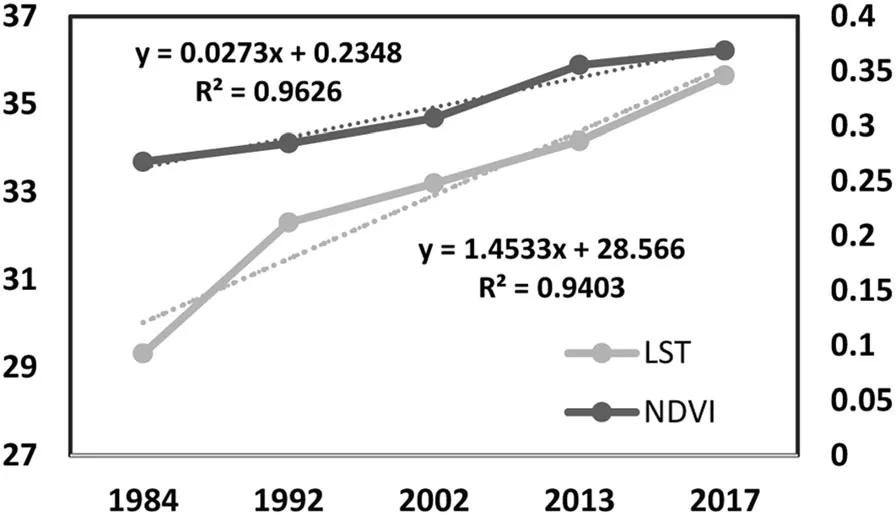
Fig.6 Average NDVIand LSTtrend over study period
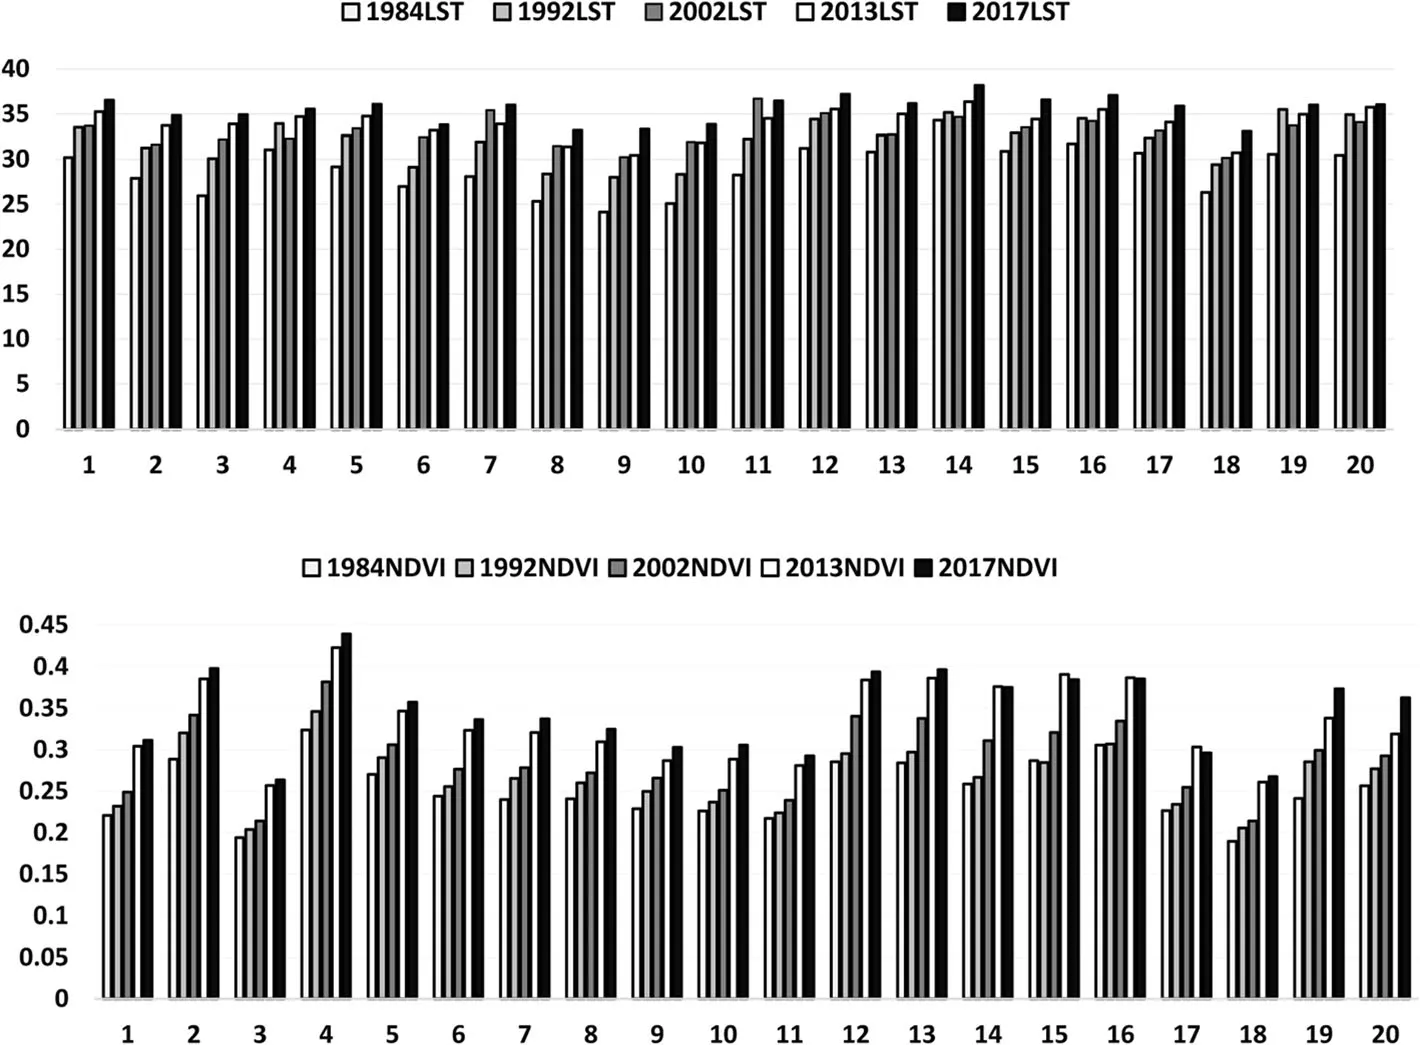
Fig.7 Sample plots NDVIand LSTfluctuation(XAxis=plot number)
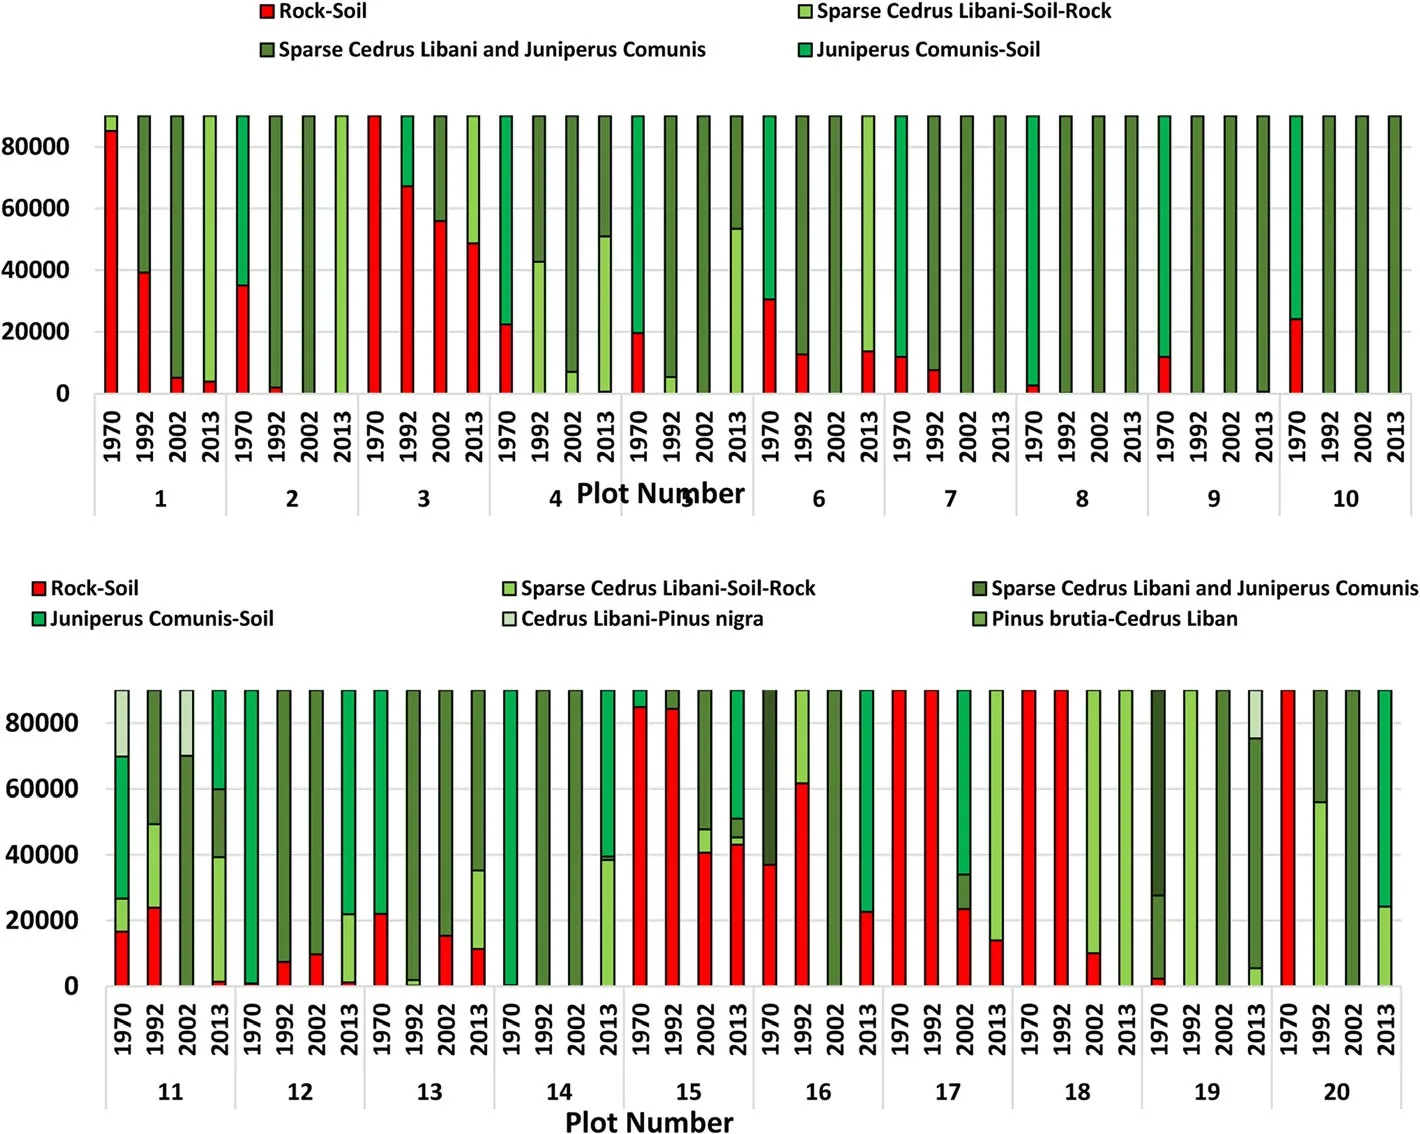
Fig.8 Forest stand maps each class in the sample plots in square meter(m2)
Discussion
This paper reports the feasibility of detecting treeline dynamics and structural shifts through the integration of Landsat data with forest stand maps. Additionally, the present study sets aimed to address the importance of measured forest stand maps at certain time intervals in forest treeline dynamics investigations, which has been less considered by prior studies. The current study found that the treeline expanded from 1970 to 2013 according to the performed difference analysis between the time periods. The resultant maps showed the geographical expansion of the uppermost treeline over 43 years, with an expansion of approximately 20 to 40 m each decade; the treeline altitude increased to 2442.5 m from 2335 m (Table 2). However, changes in some regions were not uniform(Virtanen et al. 2010; Elmendorf et al. 2012; Hanberry and Hansen 2015; Bruggeman et al. 2016). The findings of the current study are consistent with those of previously conducted investigations that have either used remote sensing data or field survey data, such as tree species dendrological measurements (Danby and Hik 2007a; Du et al. 2017), alpine ecotone biology observations (Virtanen et al. 2010), repeated photo evi-dence (Grace et al. 2002;Fraser et al. 2011), and remote sensing method (Masek 2001; Grace et al. 2002; Fraser et al. 2012; Li et al. 2016b;Holtmeier and Broll 2017). Moreover, the movement of the treeline to higher eleva-tions has been reported as a response to global warming, mainly the increase in air temperature. The trend ana-lysis of monthly average temperature (TMIN,TMAX, TMEAN) displayed a statistically positive trend over the study period, especially in the monthly average mean July temperature (tau = 0.62,ρ< 0.00) (Table 1). As dis-cussed, our research supports that climate warming is accompanied by the advancement of treelines towards higher elevations(Danby 2007; Virtanen et al. 2010; Singh et al. 2011;Monleon and Lintz 2015; Du et al. 2017). Our study findings are consistent with those of other scientific studies that have recorded the upslope movement of trees, particularly those in the northern hemisphere(MacDonald et al. 2008; Solár 2013). Similar results achieved by other investigations have emphasized the potential of recorded historical Landsat data to pro-vide an extraordinary opportunity for observing and determining forest timberline and treeline shifts (Masek 2001; Weisberg et al. 2013). Previous studies have suggested and documented an altitudinal advance of the treeline worldwide between 140 and 700 m over the past century (Grace et al. 2002), with an average change of 3 m per year (Singh et al. 2011). Moreover, for some cases, a mean altitudinal change for tree species of nearly 29 m has been reported. A 1 °C increase in temperature leads to 11–40 m of treeline expansion(Grabherr et al. 1994; Lenoir et al. 2008). Similarly, our finding depicted a 4 °C increase over 40 years, which confirmed the treeline increased between 20 to 40 m per decade, if we assume that temperature increased 1 °C per decade. In other findings, the expansion rate of the lowest treeline altitude was between 20 m to 106 m,which needs to be investigated in further studies (Table 2).In addition, numerous investigations have reported that the upward trend in treeline movement is likely to result in the natural succession of trees and reach an optimum in the Early Holocene, which must be considered in fur-ther investigations (Grace et al. 2002; MacDonald et al. 2008; Holtmeier and Broll 2010). These shifts would have a significant impact on the landscape,affecting the plants, microorganisms, and animals that live in the tangible mountain ecosystem. Additionally,if the upward expan-sion of trees continues, they will reduce high-latitude albedo and increase global warming (MacDonald et al. 2008). Therefore, they are possibly contributing to further climate warming (Liess et al. 2012).
The selected plots showed an increasing trend in the mean NDVI and LST values over the study period. However, the results indicate that the increase in the mean NDVI was consistent with the increase in the mean LST(Fig. 5a). A moderately positive correlation between the mean NDVI and mean LST values at most sample plots in all study periods for each year (1984, 1992, 2013, 2017)was observed, except for in 2002. There was a sta-tistically significant positive correlation between the mean NDVI and the mean LST (r = 0.634; ρ< 0.05) in 1984 (Table 3).The increasing trends in mean LST and NDVI had R2values of R2= 0.94 and R2= 0.96, respectively (Fig. 6). The increase in the mean NDVI was positively correlated with the increase in the mean LST using per pixel correlation analysis in the nine time periods between 1984 and 2017 (r=0.75, ρ<0.05)(1984-1988-1992-1997-2002-2007
-2010-2013-2017). The correlation coefficient was positive and significant (r = 0.901–0.777, ρ< 0.05) between the forest stand density and summer temperature in (Danby and HIK 2007b) the study, with values of r = 0.537, ρ< 0.05(Li et al. 2016b). Based on the field investigations, a significant and positive trend and meaningful correlation was observed between the temperature and tree growth in July (K?rner 1998; Li et al. 2016b), which is in agreement with the results obtained for the 20 sample plots and July LST temperature over the study period using per pixel trend analysis (r = 0.75, ρ< 0.05). Therefore, according to per pixel trend analysis, the increasing LST played a considerable role in the increasing NDVI trend during the study period in the selected plots (Fig. 6). The warmer the pixel temperature, the higher the tree species growth and seedlings (MacDonald et al. 2008; Monleon and Lintz 2015; Miller et al. 2017). This finding suggests that the tree expansion in the study area can be attributed to climate change factors, especially temperature (Fraser et al. 2011).The monthly average temperature in July was the variable that experienced the largest significant shift among the climate factors in our study (tau = 0.62, ρ< 0. 00, Table 1).The control of the treeline situation by the summer temperature (Harsch et al. 2009), mostly the mean July temperature, has been proven in Northern Eurasia(MacDonald et al. 2008). The monitoring of treelines has delineated that altitudinal forest expansion is evident in all of the study sites, with a consistent warming trend (Liess et al. 2012; Morton et al. 2012; Hanberry and Hansen 2015) in the LST values from 1984 to 2017.Concurrently, it seems that the temperature increases possibly met the growth needs of tree species(Grace et al. 2002). However, year-to-year changes in climate factors, mainly temperature, can be anticipated to have a signifi-cant influence on vegetation shifts(Virtanen et al. 2010). In previous studies, it has been noted that rising temperature is the main reason for shifts in the timberline ecotone. It is likely that the expansion of temperate forests reflects increases in temperature as an indicator of global warming (Salzer et al. 2009; Singh et al. 2011; Hanberry and Hansen 2015).
There is obviously mounting evidence of shifting landscape structures at the sample plots (Fig. 8). In the research area, during the last three decades, Cedrus libani and Juniper communis spp. have moved to higher elevations in all directions more quickly than other coniferous species, according to the comparison of the available forest stand maps for each decade (Fig. 8). These shifts can be considered increasing greenness in the resultant NDVI maps (Fig. 4). However, in some stands, shifts in the observed tree species cannot be distinguished by the NDVI values. An examination of 20 sample plots showed a consistent increase in the NDVI greening trend and vascular plants, especially Juniper communis and Cedrus libani. Moreover, the expansion of Juniper spp. into grassland was reported by multitemporal analysis of vegetation indices extracted from Landsat data (Wang et al. 2017a). In addition, the expansion of forest into treeless regions was recorded (Wallentin et al. 2008). Similar to the increasing NDVI trends in the sample plots, findings showed that the forest stand tree species covers expanded, especially in sample plots with already enduring tree species stands (MacDonald et al.2008; Fraser et al. 2011; Solár 2013; Ropars et al. 2015),mostly based on the NDVI obtained using Landsat data(Bharti et al. 2012; Morton et al. 2012; Fraser et al. 2014;Patrick Shawn Sawyer 2014). Interestingly, according to previously conducted investigations, Cedrus libani is a promising tree species that is able to sustain even the severe cold of winter and extended summer droughts. In addition, Cedrus libani depicted a high compatibility with climate change conditions, and it is likely to provide permanent and productive forest stands (Hajar et al. 2010; Güney et al. 2015; Messinger et al. 2015).Furthermore, the expansion of Cedrus libani to higher elevations was recorded by the model scenario investigations, and its adaptation is discussed (Hajar et al. 2010).Various tree species responded differently, which needs to be considered in further studies. Another important finding is the expansion of Cedrus libani on the rocks more than Juniperus communis. Three tree species(Quercus sp., Pinus brutia and Pinus nigra) were replaced with Juniper communis, Cedrus libani (Fig. 8).The expansion of woody species has been reported at a global scale (Zinnert et al. 2011). The present research proved that it is possible to detect and estimate the compositional and structural shifts in tree species types under climatic warming using forest stand maps,and our findings are consistent with those of previous scientific studies conducted at the treeline ecotone(Virtanen et al. 2010; Singh et al. 2011). However, it cannot be denied that the response of each tree species to warming varies, which is likely related to their particular ecological characteristics and basic requirements and the site states. However, high mountains in the eastern Mediterranean are seriously affected by climate warming, so the effects of anthropogenic impacts and forest fires (Ozturk et al. 2015)need to be investigated in further studies. Both data sets complement each other and add a reality and validity to the obtained results. This significant aspect is discussed in other studies (Fraser et al. 2011; Iverson and McKenzie 2013). It should be noted that the available forest stand maps which is generate with high accuracy(Cakir 2006) or repeated field survey measurements validate the NDVI greenness obtained from remote sensing data for vegetation cover (Fraser et al. 2011) and high aerial photos, such as Bing Aerial maps.Integrating other ecological factors, dendrological studies and tree species seedling recruitment and putting experimental plots in the study area are suggested. In further investiga-tions, treeline sensitivity to shifts in environmental parameters should be considered in various forest types, such as the tropical and boreal forest. Furthermore, the importance of treeline history needs to be considered in treeline dynamics studies. It has been emphasized, considering the post-glacial history of the research area, that impacts on treeline position shift the existing ecotone structure (Fraser et al.2014). However, the research area has experienced a rapid warming, and its glaciers disappeared in 1980. If the upward movement of the treeline continues, it is likely to threaten the biodiversity of the plant belts in the higher altitudes. It should be noted that the present study has its limitations. One of its weaknesses is the lack of enough meteorological stations in the study area. According to the obtained results, one alternative to meteorological stations is the use of LST maps with Landsat thermal bands, which provide temperature information for each 30 m × 30 m pixel. However, many studies have proved the feasibility of using LST instead of air temperature in remote regions (Shuman and Comiso 2002; Cristóbal et al.2008; Brabyn et al. 2014). Moreover, the LST potential in climate change investigations has been reported in forest monitoring studies (Shuman and Comiso 2002; Parastatidis et al. 2017).
Conclusions
The present research illustrates the feasibility of monitoring treeline expansion rates and structural shifts using forest stand maps, long-term Landsat data (NDVI, LST),and temperature data for more than 43 years. The results were verified by available high-resolution Bing Aerial images in the Qgis environment and existing forest stand maps. The uncertainties associated with the use of only Landsat data or forest stand maps are likely reduced by integrating two datasets with Bing Aerial maps based on the applied method. In the present study,three significant sciences, namely, GIS techniques, remote sensing data, and field-based measurements, were integrated. Prior studies have been conducted based on just remote sensing and greenness or just field-based methods (dendrology and biology studies). This study showed that LST, an indicator of temperature, and NDVI, a surrogate of the green biomass of the treeline ecotone, demonstrated an overall increasing trend from 1983 to 2017 at the plot scale. The research results show that treeline temperature anomalies can be detected successfully in the ecotone zones with LST by using per pixel trend analysis and linear model. Additionally, shifts in the heterogeneity of the forest structure over space and time can be detected by integrating two data sources. Moreover, the present study depicted an apparent change and increase in both Cedrus libani and Juniperus communis determined two pioneer tree species by both NDVI maps and forest stand maps. In the current study, Cedrus libani became a pioneer tree with Juniperus communis results showed that warmer temperatures enhanced the NDVI values,which supports the hypothesis that climate warming leads to the upward movements of treelines. Therefore,determining how the timberline border vegetation responds to increasing temperatures helps establish some developmental adaptation strategies for forest managers in the treeline ecotone. Future investigations should focus on the comparison of NDVI and other vegetation indices to examine their performance in detecting timberline and treeline movements. Further studies should investigate the expansion and reduction in various tree species, such as Cedrus libani, and Juniperus communis,their competition and compromises with other
tree species. Additionally, investigating other alpine vegetation shifts, such as shifts in shrubs and herbs, is recommended. These findings suggest that, in general,these outputs can be used effectively in niche modeling studies, although tree species modeling scenario investigations are based on stimulation rather than experimental data. In addition, future research should examine the contributions of other factors on timberline and treeline movement dynamics. Moreover, the use of medium-resolution data, namely, ESA’s Sentinel 2A and radar remote sensing data, that provide more reliable information coinciding with optical remote sensing data is recommended.
Abbreviations
LST: Land Surface Temperature; MEAN, MAX, MIN: Mean, maximum, minimum;mean1.7: Average January – July temperature; mean12: Average January– December temperature; NDVI: Normalized Difference Vegetation Index;TMAX: Monthly average maximum temperature; TMEAN: Monthly average temperature; TMEAN7, TMAX7, TMIN7: July mean temperature, July maximum temperature, July minimum temperature; TMIN: Monthly average minimum temperature; X7: Average July temperature
Acknowledgements
We would like to thank General Directorate of Forestry and Turkish State Meteorological Service which provide forest stand maps and climate data,respectively in our study.
Availability of data and materials
Applicable
Authors’ contributions
All authors read and approved the final manuscript.
Ethics approval and consent to participate
Not applicable
Competing interests
The authors declare that they have no competing interest.
Author details
1Institutes of Graduate Studies in Science and Engineering, Forest Engineering,Istanbul University, 34452 Istanbul, Turkey.2Faculty of Forestry, Department of
Forest Management, Istanbul University, 34473 Istanbul, Turkey.3Faculty of Civil Engineering, Department of Geomatic Engineering, Y?ld?z Technical University,34220 Istanbul, Turkey.
Received: 14 February 2018 Accepted: 24 April 2018


- Forest Ecosystems的其它文章
- Predicting the provisioning potential of forest ecosystem servicesusing airborne laser scanning data and forest resource maps
- Nutrient retention and release in coarse woody debris of three important central European tree species and the use of NIRS to determine deadwood chemical properties
- Species-specific,pan-European diameter increment models based on data of 2.3 million trees
- Drought can favour the growth of small in relation to tall trees in mature stands of Norway spruce and European beech
- Forests,atmospheric water and an uncertain future:the new biology of the global water cycle
- Dendroclimatic analysis of white pine(Pinusstrobus L.)using long-term provenance test sites across eastern North America