
Forests,atmospheric water and an uncertain future:the new biology of the global water cycle
2018-09-12 09:14:44DouglasSheil
Forest Ecosystems 2018年3期
Douglas Sheil
Abstract Theory and evidence indicate that treesand other vegetation influence the atmospheric water-cycle in variousways.These influences are more important,more complex,and more poorly characterised than is widely realised.While there islittle doubt that changesin tree cover will impact the water-cycle,the wider consequencesremain difficult to predict asthe underlying relationshipsand processesremain poorly characterised.Nonetheless,asforests are vulnerable to human activities,these linked aspectsof the water-cycle are also at risk and the potential consequencesof large scale forest lossare severe.Here,for non-specialist readers,Ireview our knowledge of the links between vegetation-cover and climate with a focuson forestsand rain(precipitation).Ihighlight advances,uncertainties and research opportunities.There are significant shortcomingsin our understanding of the atmospheric hydrological cycle and of itsrepresentation in climate models.Abetter understanding of the role of vegetation and tree-cover will reduce some of these shortcomings.Ioutline and illustrate variousresearch themeswhere these advancesmay be found.These themesinclude the biology of evaporation,aerosolsand atmospheric motion,as well as the processes that determine monsoons and diurnal precipitation cycles.A novel theory—the ‘biotic pump’—suggests that evaporation and condensation can exert a major influence over atmospheric dynamics.Thistheory explainshow high rainfall can be maintained within those continental land-massesthat are sufficiently forested.Feedbackswithin many of these processescan result in non-linear behavioursand the potential for dramatic changesasa result of forest loss(or gain):for example,switching from a wet to a dry local climate(or visa-versa).Much remains unknown and multiple research disciplinesare needed to addressthis:forest scientistsand other biologistshave a major role to play.New ideas,methodsand data offer opportunitiesto improve understanding.Expect surprises.
Keywords:Biotic pump,Climate,Condensation,Evaporation,Ice-nucleation,Transpiration,GCM,Vapour,Water-cycle
Introduction and background
The availability of water determines where life,including people,can occur and is in turn influenced by such life—again including people.Increasing human populations and improving living standards are impacting the earth’s surface(Godfray et al.2010;Sayer et al.2013).Over one third of the Earth’s ice-free land comprises agriculture,pasture and urbanisation(Ramankutty et al.2008).One and a half million square kilometres of dense tree-cover were lost between 2000 and 2012(gross 2.3 million lost and 0.8 million gained,Hansen et al.2013).At the same time,evaluations indicate major increases in people with impeded access to fresh water and also in those exposed to floods(e.g.,Arnell et al.2016).For those confronting these issues,a concern is whether we know enough to understand,predict,and address how land cover influences water availability.
Water vapour comprises one quarter of 1%of the mass of the atmosphere—equivalent to just two and half centimetres of liquid over the entire Earth(atmospheric water in the form of liquid droplets and ice adds less than one hundredth to this miniscule total).The behaviour of this atmospheric water nonetheless governs water availability on land.Terrestrial life,including human life,depends on and impacts this availability.Understanding these links and vulnerabilities is vital if we want to avoid the water scarcity,droughts and floods that may otherwise result from changing land cover.
Global vegetation and climate are linked in both directions:when climate changes,so will vegetation,and when vegetation changes,so will the climate.These links are more important,more complex,and more poorly characterised than most people realise.
Water availability raises more tangible concerns for most people than do temperature and carbon.In any case,those concerned with temperature recognise 1)that around half the solar energy that falls on land is converted into the evaporation of water thus cooling the land surface(Pokorny et al.2010;Wang and Dickinson 2012),2)that water vapour is the dominant greenhouse gas on our planet(Ravishankara 2012;Sherwood et al.2010)and 3)that the distribution of clouds and snow cover exert a major influence on planetary albedo(the proportion of incident light reflected back into space)and energy balance(Donohoe and Battisti 2011;He et al.2014).Those concerned with carbon recognise that water is the most limiting factor for terrestrial ecosystem carbon uptake,and that uncertainties over water imply uncertainties over biomass and carbon fixation(Polis 1999;Good et al.2013;Bernacchi and VanLoocke 2015;Thorley et al.2015;Viglizzo et al.2016;Taylor et al.2017;Zhu et al.2017).Furthermore,those concerned with environmental conservation,stability and the maintenance of speciesdiversity recognise both the significance of freshwater biodiversity(supporting over 126,000 species of plants and animals,many of them vulnerable,on 0.8%of the world’s surface,Garcia-Moreno et al.2014)and the links between terrestrial diversity and moisture(Kreft and Jetz 2007;Sheil et al.2016;Viglizzo et al.2015).
In this article,I review our understanding of vegetation-climate relationships focusing on how land cover,particularly trees,influences the atmospheric water-cycle.I focus on challenges and advances rather than policy and synthesis(e.g.,McAlpine et al.2010;Mahmood et al.2013;Lawrence and Vandecar 2015;Ellison et al.2017)or specific regions(e.g.,McAlpine et al.2009;Nobre 2014).For reasons that will become apparent,I shall avoid the substantial literature focused on climate simulations and scenarios(Mahmood et al.2013;Devaraju et al.2015;Salazar et al.2015;Mahmood et al.2016;Prestele et al.2016).I target forest scientists and others outside atmospheric sciences and thus minimise jargon.I first describe the global water-cycle,and then examine key aspects:evaporation,aerosols,winds and their interactions.
The water-cycle Background
Precipitation—rain,snow and hail in all their forms—denotes the stage in the water-cycle when water falls to earth from the atmosphere. Most of us rely on this water, and demand is growing. Between 1992 and 2015 the sum total of global freshwater resources divided by the total human population has declined by over 25%(from around 8000 m3to below 6000 m3per person)(Ripple et al. 2017). Availability is uneven and often limited. Two thirds of the global population already experience water scarcity for more than a month each year while half a billion face year-round scarcity(Mekonnen and Hoekstra 2016). Those who rely on the world’s finite ground water reserves are vulnerable to their accelerating depletion (Wada et al. 2010).
Reliability and variation in precipitation matter. Extreme events can be catastrophic: from 1900 to 2013 more than eleven million lost their lives as a result of drought and seven million people died as a result of floods, while half a billion required emergency aid due to such events(Sheil 2014).
While much atmospheric water vapour originates from the oceans much is also recycled off land. Of the approximately 117,600 km3of water that falls to the terrestrial surface as precipitation each year, less than a half 45,800 km3(39%) comes from the ocean while the majority (71,800 km3, or 61%), derives from the land(Schneider et al. 2017). (For a discussion of how such values are estimated, and the associated uncertainties, see, e.g., Gimeno et al. 2012). Thus, most terrestrial precipitation depends on moisture derived from land.More than half of this land-derived atmospheric moisture comes from transpiration by plants, though the precise fraction remains contested (Jasechko et al. 2013;Sutanto et al. 2014; Wei et al. 2017).
One recent study estimated that land cover changes have caused a 5% to 6% reduction in global atmospheric moisture (Sterling et al. 2013).Comparing this with growing demand for water and the finite supplies avail-able, the authors concluded that impacts on the global water-cycle were already“much closer … than previously thought” to further negative impacts on human lives (Sterling et al. 2013).
The degree to which precipitation depends on moisture derived from land varies with location, ranging from low,for some oceanic islands, to high in some continental regions such as northwest China (van der Ent et al. 2010;Zhao et al. 2016). The Amazon Basin, East Africa, Western North America, and central Eurasia are major sources of water vapour for areas downwind (van der Ent et al.2010). The typical distances that moisture evaporated from land travels in the atmosphere before it falls to earth once more are in the order of 500–5000 km meaning that large-scale influences in land cover are crucial (van der Ent and Savenije 2011). One recent study to evaluate these links concluded that even in several major river basins,including those of the Amazon, Congo and Yangtze,precipitation was more influenced by land-use change occurring outside the basin than inside (Wang-Erlandsson et al. 2017).
As total global precipitation and evaporation balance,any reduction in precipitation at one time or place may result in an increase at another and visa-versa (Rosenfeld et al. 2008). There are many examples where increasing frequencies and severities of droughts and floods appear to follow disruptions to the water-cycle (Millán 2014;Hirsch and Archfield 2015; Erfanian et al. 2017). While global precipitation held relatively constant over recent decades, observations indicate that increases occurred over the tropical oceans and higher latitudes (much of North America and Eurasia), while declines occurred over Africa and various mid latitudes (notably the Mediterranean and southern Asia) (Trenberth 2011; Adler et al.2017). The Intergovernmental Panel on Climate Change(IPCC) expresses “medium confidence” that human activities influenced precipitation intensity (especially Northern Hemisphere) over the second half of the twentieth century(Stocker et al. 2013). The ability to understand, predict and address such changes is a crucial research goal.
Models
Our best integrated-understanding of how the global water-cycle functions is arguably embodied in the simulation models used in climate sciences. The models used by climate scientists to simulate global climate and investigate how it changes—General Circulation Models, Global Climate Models, and Earth System Models (henceforth“models”)—have become increasingly sophisticated. Complexity has increased as additional phenomena and their associated sub-models are added and refined. Various aspects of vegetation cover, such as leaf area phenology,canopy roughness and rooting depth are generally included with varying levels of sophistication (Bonan 2008;Guimberteau et al. 2017).
Researchers recognise various problems with these models (Stevens and Bony 2013; Shepherd 2014; Marotzke et al. 2017). For example, one summary noted that `most models simulate precipitation that occurs prematurely and too often, and with insufficient intensity` (Trenberth 2011).Another review highlighted that the inability to model terrestrial precipitation represented the principle ‘roadblock to progress in climate science’ (Stevens and Bony 2013).Another more recent review written by modellers noted that ‘The global water-cycle — from the formation of clouds, to the release of precipitation, to land surface hydrology including its interaction with the atmosphere, to water storage and release in the cryosphere — remains one of the least understood natural cycles. Hence, the predictions of this cycle in a changing climate are amongst the most uncertain. This constitutes a major challenge in ascertaining future water availability’ (Marotzke et al. 2017).
Using models to make predictions assumes that they embody all the key relationships determining the changes under consideration in an adequatemanner.Many parameters in these complex models are not derived from measurements,but from tuning within and among submodels.Such tuning involves an iterative process of adjusting values to ensure that behaviours and outputs appear sufficiently similar to past periods(Hourdin et al.2017;Loehle 2017).But not all aspects of such complex models can be perfected simultaneously.For example,tuning a model to better represent seasonal shifts in precipitation can result in less accurate mean values(Kim et al.2012).
One way to test models is to see how their behaviours and predictions match reality(without local tuning).If they match we may be reassured,but if they don’t,we conclude that something is missing or incorrect.Such checks reveal discrepancies:for example,models indicate that rainfall over the major land masses of Indonesia is lower than that over the neighbouring oceans though the reverse is true(Qian 2008)and that the flow of water out of the Amazon River should be half what is observed(e.g.,Hagemann et al.2011).
There are other striking mismatches between models and observations.For example,data concerning longterm variation in precipitation within and among different regions of the globe are not captured by models(Ljungqvist et al.2016).In addition,it has long been recognised that while observations indicate a decline in terrestrial evaporation as temperatures increase,models indicate the reverse(Roderick and Farquhar 2002;Roderick et al.2009).Looking at the details we find that models predict that atmospheric water will increase by about 7%for each degree Kelvin of surface warming,with global precipitation increasing at a markedly slower rate varying from 1%to 3%per degree Kelvin(depending on the model)(Wentz et al.2007).Observations,in contrast,find that global atmospheric water and precipitation are increasing at a similar rate(Wentz et al.2007).Efforts to reconcile these observations are hampered by an inability to predict changes in wind speeds and circulation patterns(Jian et al.2016).Models also make diverging predictions regarding circulation patterns(Yim et al.2017).Shortcomings are also found in predicting the changing seasonal behaviour of monsoon climates as in India,where the winter winds blow from northeast and are relatively dry while the summer winds blow from the southwest and bring heavy rain(e.g.,Acharya et al.2011;Niu et al.2015).
There are multiple aspects to this uncertainty about the dynamics of water in the climate system(Stevens and Bony 2013;Shepherd 2014;Hegerl et al.2015).For example,the behaviour of clouds,and cloud related feedbacks,continue to vex climate researchers—with large differences among models and also between models and observations(Ceppi et al.2017).Attention has also focused on resolution and the effects of terrain(Peatman et al.2014;Li et al.2017).The influence of ocean temperatures and climate cycles,such as El Ni?o-La Ni?a,and the processes that govern these relationships,have also been highlighted(Miralles et al.2014).Discrepancieslikely reflect multiplefactors(Wang and Dickinson 2012;Mahmood et al.2013;Heald and Spracklen 2015).Uncertainties related to land cover appear relatively unexplored.In any case,there is agreement that large discrepancies and gaps in models and in fundamental understanding persist.
Most studies of how land use change influences climate and hydrology rely on models(e.g.,Piao et al.2007;Unger 2014;Garcia et al.2016;Mahowald et al.2017).These models are imperfect(Hagemann et al.2013;Maraun 2016).If they omit or misrepresent key processes or mechanisms,then their results,if unconfirmed by observations,should be treated with caution.
One consequence of these shortcomings in current models is that climate researchers have invited physical scientists to assist them(Bony et al.2015;Schiermeier 2015).I believe that they should also call forest scientists and other biologists.Many model discrepancies likely result from poorly characterised biological processes.As the other uncertainties are addressed,an increasing fraction of the remaining unresolved details will reflect biology(Sheil 2014).
Vapour
Atmospheric moisture can result from various sources and processes over land:evaporation from open water,soil,wet terrestrial surfaces,wet vegetation ‘interception’and transpiration(i.e.from within vegetation,Savenije 2004).In the previous section,we noted how most terrestrial precipitation is recycled from the land surface and that more than half of this derives from transpiration by plants.
All higher plants control when and how much water vapour they release(McAdam and Brodribb 2012).Leaves and other plant parts are typically waxy and relatively impermeable,with most gas exchange and water loss occurring through stomatal pores.Stomata control the entry of carbon dioxide into the leaf and the emission of water through transpiration (simultaneously regulating leaf temperature,Matthews et al.2017).These adjustable pores evolved around 400 million years ago and have influenced our planet’s water-cycle ever since(Berry et al.2010;Brodribb and McAdam 2017).The control of these pores determines the exchange of gases,including water vapour and carbon dioxide,between the plants’intercellular space and the external atmosphere.The behaviour of stomatal pores is assumed to optimize carbon gain (growth),depending on environmental conditions including access to water and the risks that arise from drought, but our understanding of these relationships remains a “work in progress” (Klein 2014;Martin-StPaul et al. 2017; Matthews et al. 2017; Meinzer et al. 2017). Furthermore, trees capture nutrients by drawing in soil water, thus increased transpiration rates can be a response to low nutrient environments (Matimati et al. 2013; Huang et al. 2017).
The dynamics of transpiration are surprisingly complex. For example, the stomata of tropical trees often close after a few hours of intense photosynthesis due to temporary depletion of available water, though this behaviour varies among species, and with conditions(Zhang et al. 2013). There are also processes that somehow coordinate stomatal opening and closing within and even among leaves (Kaiser and Paoletti 2014) and that can lead to pulsed, cyclic and even chaotic patterns of moisture release (Johnsson 2015). There is some evidence, from Costa Rica and Finland (in summer) that a cyclic pattern of moisture release occurs over actively transpiring forests with a mean period of 70 to 80 min(Bunyard 2014 and pers. comm. December 2017). Furthermore, evidence shows that most types of plants in every biome where it has been examined continue to lose water to some degree through their open stomata at night—the degree of this nocturnal transpiration varies among species, and the functional significance is not well understood, though it may (at least in some cases)relate to competition for nutrients (Dawson et al. 2007;Cramer et al. 2009; Rosado et al. 2012; Bucci et al.2016). Night-time sap-flow and transpiration are greatest in species with rapid growth, high concentrations of leaf nitrogen and lower shade tolerances (Marks and Lechowicz 2007). Comprehensive modelling of all these processes and relationships remains a challenge (Buckley 2017; Franks et al. 2017; Matthews et al. 2017).
The water evaporated from wet surfaces, including that intercepted by and held on vegetation, is also a major source of atmospheric moisture. Indeed there are theoretical reasons to suggest that this moisture is more likely to be recycled locally than that from transpiration(van der Ent et al. 2014).
In any case, the sum emission of water vapour from forests (transpiration and evaporation from other sources combined) typically surpasses that from other vegetation and even from open water. Though there are uncertainties concerning the best means to estimate these values (see review and discussion in Fisher et al.2009), tropical forest regions typically evaporate more than one meter of water each year1, averaging 1.37 m per year (m·yr?1, standard deviation 0.18 m·yr?1) across the Amazon basin (Fisher et al. 2009) and 1.32 m·yr?1(standard deviation 0.08 m·yr?1) across Borneo (Kume et al. 2011). Local values can be much higher, and some forests exceed 2.2 m·yr?1(Loescher et al. 2005). Such water is important. One pantropical evaluation examined rainfall across the tropics: for each location the re-searchers identified the path of the local wind over the previous 10 days and found that those that had traversed closed forest typically produced more than twice as much rain as those that had traversed open land (Spracklen et al. 2012).
Trees achieve high rates of transpiration by maintain-ing their high leaf area in moving air and by possessing roots able to access moisture even when the upper soil is dry.Furthermore, trees can use moisture stored in their stems when their needs exceed uptake—such stored water can provide 20%–30% of transpired water and this is typically replaced at night, though such tran-spiration may be maintained over several days, even with a growing moisture deficit (?ermák et al. 2007). In some locations trees capture, and then re-evaporate, signifi-cant moisture from clouds, fog or dew (Holder 2004; Fu et al. 2016;Wang et al. 2017)—a process often boosted by epiphytic vegetation (Holscher et al. 2004; Villegas et al. 2008;Stanton et al. 2014). While water on leaf sur-faces inhibits transpiration, the foliage of plants in wet environments tend to dry rapidly (Smith and McClean 1989; O'Brien et al. 2004). Other processes may play a role too, for example,condensation on cool stems (Laka-tos et al. 2012; Wang et al. 2017), and redistribution of moisture in the soil profile due to the presence of roots,(Dawson 1996; Domec et al.2010; Neumann and Car-don 2012; Prieto et al. 2012). The influence of air move-ments and turbulence (due to canopy structure and other features) on transpiration and water loss likely also plays a role (Hollinger et al. 1994;Vanclay 2009).
Forest soils tend to be deeper, more porous and more permeable than other soils, increasing moisture infiltra-tion and storage and reducing runoff (Malmer et al. 2010). Increased runoff is sometimes seen as desirable. For example, hydrologists note that the higher water use asso-ciated with dense tree cover reduces water availability compared with low tree cover(Bruijnzeel 1990; Sahin and Hall 1996; Viglizzo et al.2016). Thus, for example, one influential meta-analysis found that annual stream flow typically declined by over a third where closed-forests were planted, with larger losses at drier sites (all but three of the 506 assessments being Eucalyptus or Pinus, and all but two being outside the tropics) (Jackson et al. 2005). But there are important caveats, including that water gained by streams and rivers will no longer fall as rain downwind, that different effects operate at different scales(thus forest loss in one area may increase local runoff but may still reduce regional rain by a larger amount), and that comparing open land and dense forests neglects the non-linear relationships with infiltration and soil desiccation that may influence outcomes at intermediate tree densities(Ilstedt et al.2007;Malmer et al.2010;Thompson et al.2010).Studies in African drylands demonstrate the importance of such caveats by showing that there are non-zero tree densities where the benefits of improved soil infiltration can greatly exceed evaporation losses and can substantially increase,rather than deplete,ground water when compared to treeless areas(Ilstedt et al.2016).
Despite the increasing number of studies we know less about the influence of forest restoration or expansion on water than is generally acknowledged(Malmer et al.2010).One recent review notes that while most studies continue to report reduced runoff,these results provide an incomplete picture as infiltration,rainfall,intermediate-stemdensities and scale-effects are generally neglected(Filoso et al.2017).They also highlight that while local water yields often decline under young regrowth forests,yields change and may recover as the vegetation matures,though this trend isbeyond most short-term studies(Filoso et al.2017).
Observations indicate that changes in forest cover influence the local and regional climate.I will not attempt a synthesis here as these observations are reviewed elsewhere(e.g.,Bruijnzeel 2004;Bonan 2008;Lawrence and Vandecar 2015).To summarise:reducing forest cover often correlates with some decline in rainfall and cloud cover,though specific cases may be idiosyncratic.In all such correlations causal relationships are hard to prove given the impossibility of a replicated study and the multiple potential influences.
Atmospheric aerosols
Under common atmospheric conditions water vapour neither freezes nor condenses without the presence of atmospheric particles or droplets—aerosols—hence these can exert a major influence on clouds and precipitation(Després et al.2012).Any change in the abundance,character or dynamics of these aerosols will impact the water-cycle(Rosenfeld et al.2008;Rosenfeld et al.2014;Fan et al.2016).The key relationships are non-linear.For example,increasing aerosol densities can increase or decrease both cloud cover and precipitation(Rosenfeld et al.2008)and influence associated atmospheric behaviours(Koren et al.2014;Seinfeld et al.2016).Sensitivity to aerosols is illustrated by observations showing that the intensity of convective summer storms,and the occurrence of tornado and hailstorms in the eastern United States follow a seven-day cycle determined by week-day pollution(Bell et al.2009;Rosenfeld and Bell 2011).
While atmospheric aerosol particles include mineral dust,smoke and marine salts,many biological materials are also involved,e.g.,bacteria,archaea,viruses,pollen,spores and organic debris(Després et al.2012;Fr?hlich-Nowoisky et al.2016).It was only about a decade ago that researchers noted that the abundance of biological particles in the atmosphere had been“underestimated by atmospheric scientists”(Jaenicke et al.2007).These authors estimated that around one petagram(Pg)or 1012kilograms(kg),of such biological particles entered the atmosphere each year—a value comparable to that of mineral dust(~2.0 Pg)and marine salt(3.29 Pg)(Jaenicke et al.2007).Particles over forest regions remain poorly characterised in general but assessments indicate that they are diverse and that many(the proportion is unclear)are biological,e.g.potassium rich dust over the Amazon(Poehlker et al.2012).Recent studies,especially those employing methods that can detect and distinguish minute traces of genetic material,have revealed the abundance and diversity of organisms,and organism fragments,in clouds(Fr?hlich-Nowoisky et al.2012;Smith et al.2013;Cho and Jang 2014;Xu et al.2017).As an example,one study collected three cloud water samples taken from one site in France(D?me Mountain Meteorological Station)and detected genetic material from more than 28,000 distinct species of bacteria(30 phyla and 286 genera)along with 2600 eukaryotes(from 12 phyla primarily fungi)(Amato et al.2017).Most species appear to be plant epiphytes,pathogens or endosymbionts.A substantial fraction of all these detected organisms appeared to be active and metabolising(producing detectable RNA)(26.4%of the prokaryotes and 82%of the eukaryotes)(Amato et al.2017).
Ice formation
Various cloud properties and behaviours depend on the presence and dynamics of ice crystals(Kanji et al.2017).Ice formation in clouds promotes precipitation.There are multiple processes involved,but one key aspect,named the ‘Wegener-Bergeron-Findeisen process’,is that water vapour accumulates on ice more readily and at lower vapour pressure(lower moisture concentrations),than on water(Storelvmo and Tan 2015).Even when the densities of ice are initially low,the effect can multiply as ice crystals collide and fragment within clouds(Mason 1996;Phillips et al.2017;Sullivan et al.2017).Outside of the tropics,precipitation is generally associated with such ice forming processes(Mülmenst?dt et al.2015;Kanji et al.2017).
Liquid water commonly occurs in clouds at temperatures well below zero(down to –38 °C).Some particles have the ability to induce freezing in liquid water at such sub-zero temperatures.Much remains unknown about such “ice nucleation”particles in the Earth’s atmosphere but particles with biological origins are considered the most abundant and important in many contexts especially at temperatures above?10°C(Hoose and M?hler 2012).
Ice forming activity occurs in various lifeforms including some bacteria,pollen and fungal spores.Such activity is associated with specific molecules.In some case ice nucleation activity may benefit the organism.For example,the pathogenic rust Puccinia lagenophorae possesses ice nucleation sites on its aeciospores and it has been shown that leaves artificially infected with this fungus and subjected to frost suffer greater penetration of ice crystals into the plants’tissues,presumably improving access for the fungus(Paul and Ayres 1991).But sometimes such activity may be an incidental by-product of other selective processes.For example,cellulose promotes ice formation below –21 °C(Hiranuma et al.2015).
Ice-nucleating organisms are found in rain(Michaud et al.2014;Hara et al.2016;Failor et al.2017).Some are especially effective at promoting freezing,for example,spores of certain rust fungi(specifically,asexual urediospores)capable of long distance atmospheric transport,nucleate ice at temperatures as warm as?4 degrees centigrade(°C)(Morris et al.2013).We don’t know the degree to which these organisms influence cloud formation or precipitation but the relationships likely operate in both directions.Many particles are washed out of the air by rain,though the impact of droplets on surfaces can also yield increases(Joung et al.2017).Indeed these combined effects are known to modify the composition of airborne bacteria,for example observations in Korea indicate that after rainfall the airborne abundance of some families such as Carnobacteriaceae and Clostridiales typically decreased while the non-spore forming Actinobacteria such as the Propionibacteriaceae increased(Jang et al.2017).Increases in some particles also arise though biological responses.For example,observations near the coast of Southern Norway(Birkenes)indicate that atmospheric concentrationsof ice-nucleating particles(active at? 8 °C)increase after rain from May to mid-September but are supressed once snow lies across the landscape.Detection of the sugar alcohols arabitol and mannitol,suggest a fungal source for some of these ice promoting particles(Conen et al.2017).Similar seasonal relationshipsbetween ice-nucleating particlesand rain havebeen reported across Eastern Australia(Bigg and Miles 1964),the USA(forested areas of Colorado)(Prenni et al.2013),Switzerland(Chaumont)and Russia(Novosibirsk,Siberia)(Conen et al.2017).Laboratory observations have shown that ice nucleating particles are emitted from decaying leaves(Schnell and Vali 1972;Schnell and Vali 1973)leading to the proposal that the natural abundance of these particles is associated with the fungal activity that results from fallen leaves and sufficient moisture(Conen et al.2017).
Various bacteria(gram positive and negative)possess ice nucleating activity(Failor et al.2017).Certain strains of Pseudomonas syringae(plant pathogens)appear particularly effective,allowing freezing at even comparatively high temperatures(above –10 °C)(Maki et al.1974;Cochet and Widehem 2000).Pseudomonas bacteria were proposed as a natural source of atmospheric ice nucleation that might be harnessed to seed rain(Maki et al.1974),before they were detected in natural clouds(Joly et al.2013).Much remains unknown about how such bacteria influence the water-cycle,but we know that their abundances and their ice forming abilities vary among vegetation types,for example being less abundant on conifer trees than most angiosperm species(Lindow et al.1978).Their ice forming abilities likely improve their access to plant tissues(Morris et al.2014).Such mechanisms are restricted to regions where frosts occur and are likely less important in warmer regions.These leaf dwelling prokaryotes may be important determinants of precipitation at mid-latitudes.The‘bioprecipitation hypothesis’proposes a cycle in which Pseudomonas and other micro-organisms are lifted off leaves and other surfaces by air currents and promote freezing in clouds,resulting in increased precipitation within the region.This precipitation disperses the microbes and provides the moist conditions both they and their host plants need to grow—thus increasing their prevalence(Morris et al.2014).
Much remains unknown about the behaviour and impact of ice nucleating particles in the atmosphere(Carslaw et al.2017;Coluzza et al.2017)and we know almost nothing about these particles in the tropics(Yakobi-Hancock et al.2014).Methods now permit a much more detailed assessment of bacterial communities and their activities(Hill et al.2014;Failor et al.2017).The bacterial communities on the leaf surfaces of temperate forest trees include widespread generalist taxa,some which vary with time and location,and those that associate with particular tree species(Laforest-Lapointe et al.2016).
Condensation
Water vapour condenses when air is sufficiently saturated.The threshold depends on temperature,pressure,and available surfaces.All else being equal,condensation occurs at lower vapour concentrations in air containing suitable particles,i.e.condensation nuclei,than otherwise.Thus such particles influence cloud formation and precipitation.
The ability of particles to promote condensation depends on two principle factors:their surface chemistry,i.e.their “hygroscopicity”(the initial layer of water is technically not condensation but adsorption when the water molecules adhere to the particle surface)and their size(particles that are too small tend to evaporate water faster than they can gather it)(Hallquist et al.2009;Després et al.2012).While larger particles,such as pollen and fungal spores may be able to promote droplet formation without further size increases(Pope 2010;Hassett et al.2015),smaller particles must grow before they can play this role.
The surface chemistry and size of atmospheric particles can both be modified by the products that result from the breakdown of various volatile organic compounds(VOCs)in the atmosphere.About three quarters of these VOCs are relatively reactive and last less than one day in the atmosphere,with most,including isoprene and pinene,surviving just a few hours(Guenther et al.1995).Various chemical pathways are involved though few are well studied.For example,we know that hydroxyl radicals play a key role in the rapid modification of isoprene over tropical forests,and that these radicals appear to be regenerated rather than depleted during this process(Taraborrelli et al.2012).In general,chemical changes mean that most of these organic compounds lose their volatility due to reactions with other molecules,sunlight and radiation(e.g.,Cappa 2016).Some may aggregate and precipitate directly.Most will adhere to surfaces(Ehn et al.2014).These sticky compounds can accumulate allowing even the smallest particles to grow,and to reach sizes where they can promote droplet formation.
Most VOCs have biological origins and forests are major sources(here I follow convention and exclude methane though this is the most abundant organic gas(Bousquet et al.2006;Kirschke et al.2013;Tian et al.2016)).The atmosphere receives over one Pg(1012kg)of biological carbon as biogenic VOCs(“BVOCs”)annually(Guenther et al.1995).The carbon associated with these emissions are approximately 1%of the 120–130 Pg of carbon each year(C·yr.?1)of terrestrial gross primary production(see for example,Parazoo et al.2014).The main constituent appears to be isoprene(~44%)with most of the rest comprised of various monoterpenes such as pinene(~11%)and other oxygenated carbon compounds(Guenther et al.1995).Isoprene is produced primarily when plants are stressed by heat,with global emissions estimated at 0.44 to 0.66 Pg C·yr.?1concentrated over the tropics(Guenther et al.2006),while pinene is locally abundant over temperate conifer forests in summer(Guenther et al.1995).
Isoprene emissions vary among plant species.While many tree species are significant sources,this is not the case for grasses.Thus isoprene concentrations are typically higher over forests than grasslands.Indeed major emissions,with considerable local variation have been reported over the Amazon(Gu et al.2017).The ability of isoprene to increase cloud cover during periods of heat-stress,thus lowering temperatures and perhaps stimulating rain remains to be investigated(Sheil 2014).
Modern methods reveal hundreds of naturally occurring BVOCs each with their own distribution,chemical dynamics,and impacts.Many result from plants,some a result of stress or damage or of phenological state,with each species having its own range of compounds(Laothawornkitkul et al.2009;Lerdau and Slobodkin 2002;Holopainen and Blande 2013).Indeed the production of many BVOCs appears species(even genotype)and condition specific(Llusia et al.2002;Yuan et al.2009).One study found that a seedling of Scots pine(Pinussylvestris)emits at least 20 distinct monoterpenes(Heijari et al.2011)and just one of these,limonene,can become over one thousand distinct compounds in the atmosphere(Kundu et al.2012;Holopainen and Blande 2013).Our ability to detect and distinguish these compounds is improving:for example,one study over just one citrus orchard in the USA detected and tracked the varying atmospheric abundance of over 500 different organic compounds derived from the vegetation(Park et al.2013).
Trees and forests are not the only source of natural biological aerosols.Marine organism emit various BVOCs into theatmosphere including isoprene and monoterpenes(Shaw et al.2010).Particular attention has been given to dimethyl sulphide,a compound emitted by various phytoplankton and reef building corals particularly when they are stressed(Stefels et al.2007;Fischer and Jones 2012;Jones 2013).This volatile compound oxidises to generate sulphuric acid in the atmosphere and has long been suggested to play a role in promoting condensation and cloud formation(Stefels et al.2007;Ayers and Cainey 2008).We remain uncertain how influential these processes are but the runoff,sediments and smoke that often results from deforestation and other land cover related processes can impact marine life,suggesting that emissions associated with these organisms would be affected(Abram et al.2003;Prouty et al.2014;Ramos-Scharrón et al.2015;Teneva et al.2016).
Anthropogenic impacts
Though specific information is limited it is generally assumed that atmospheric aerosol concentrations were lower in the pre-industrial era(reviewed in Hamilton 2015;Carslaw et al.2017).In such conditions the climate system is thought to have been more sensitive to changes in these concentrations(Spracklen and Rap 2013;Carslaw et al.2017).Over the past century the products of industry,fires and other activities have added considerably to atmospheric particles though many details of these emissions and their dynamics remain unclear(Fuzzi et al.2015;Sánchez Gácita et al.2017).At the same time changes in land cover and climate have modified BVOC emissions(e.g.,Hewitt et al.2009;Yue et al.2015).
Studies indicate that human activities impact on the abundance and activity of biological ice-nucleating particles in the atmosphere.For example,observations in Franceindicatethat atmospheric acidification reducestheir influence(Pouzet et al.2017).Nonetheless evidence that human activities have impacted ice nucleating particles or their propertiesremains too limited to generalise(Carslaw et al.2017;Coluzza et al.2017).
More generally,there has been some effort to identify how changes in land cover,and other human activities,impact aerosols and their influence on climate.Much of this work has focused on smoke and industrial pollution rather than on natural aerosols.One synthesis concluded that land use change through the twentieth century likely led to cooling with between 10 and 50%of this effect due to anthropogenic aerosol emissions(they did not consider precipitation directly)(Heald and Spracklen 2015).These authors acknowledged many unknowns including the interactions that occur among these processes(Heald and Spracklen 2015).Where processes have been jointly considered they sometimes have conflicting implications.For example,pollution may mask some of the influences of forest loss on Amazonian rainfall(Cox et al.2008).Interactions can also be complex,for example,the isoprene derived particles found over the Amazon typically adhere to each other allowing aggregation and increased size but smoke reduces this aggregation(Bateman et al.2017).As another example,while forest loss generally reduces BVOC emissions,some land uses are major sources.For example,one study found that oil palm plantations in Malaysia emitted about seven times more isoprene per unit area than the forest they replaced(Hewitt et al.2009).The implications of all these processes for the global water cycle remain largely unexplored.
Winds and atmospheric circulation A role for temperature
A predictive understanding of atmospheric water transport must include atmospheric circulation,winds,and the factors that determine them.Edmund Halley,a contemporary of Isaac Newton and still widely known for predicting the periodicity of a comet,first suggested that global atmospheric circulation was determined by temperature gradients(Halley 1686).Halley’s ideas were intuitively appealing as they fitted with the recognised phenomena of sea-to-land winds or sea breezes which arise when the land is warmer than the ocean(Miller et al.2003)(Fig.1).They also explained monsoon cycles as a result of the seasonal switch as land-ocean temperatures gradients switch direction from warmer-ocean to warmer-land and back.These seasonal shifts in wind direction impact moisture transport and precipitation.
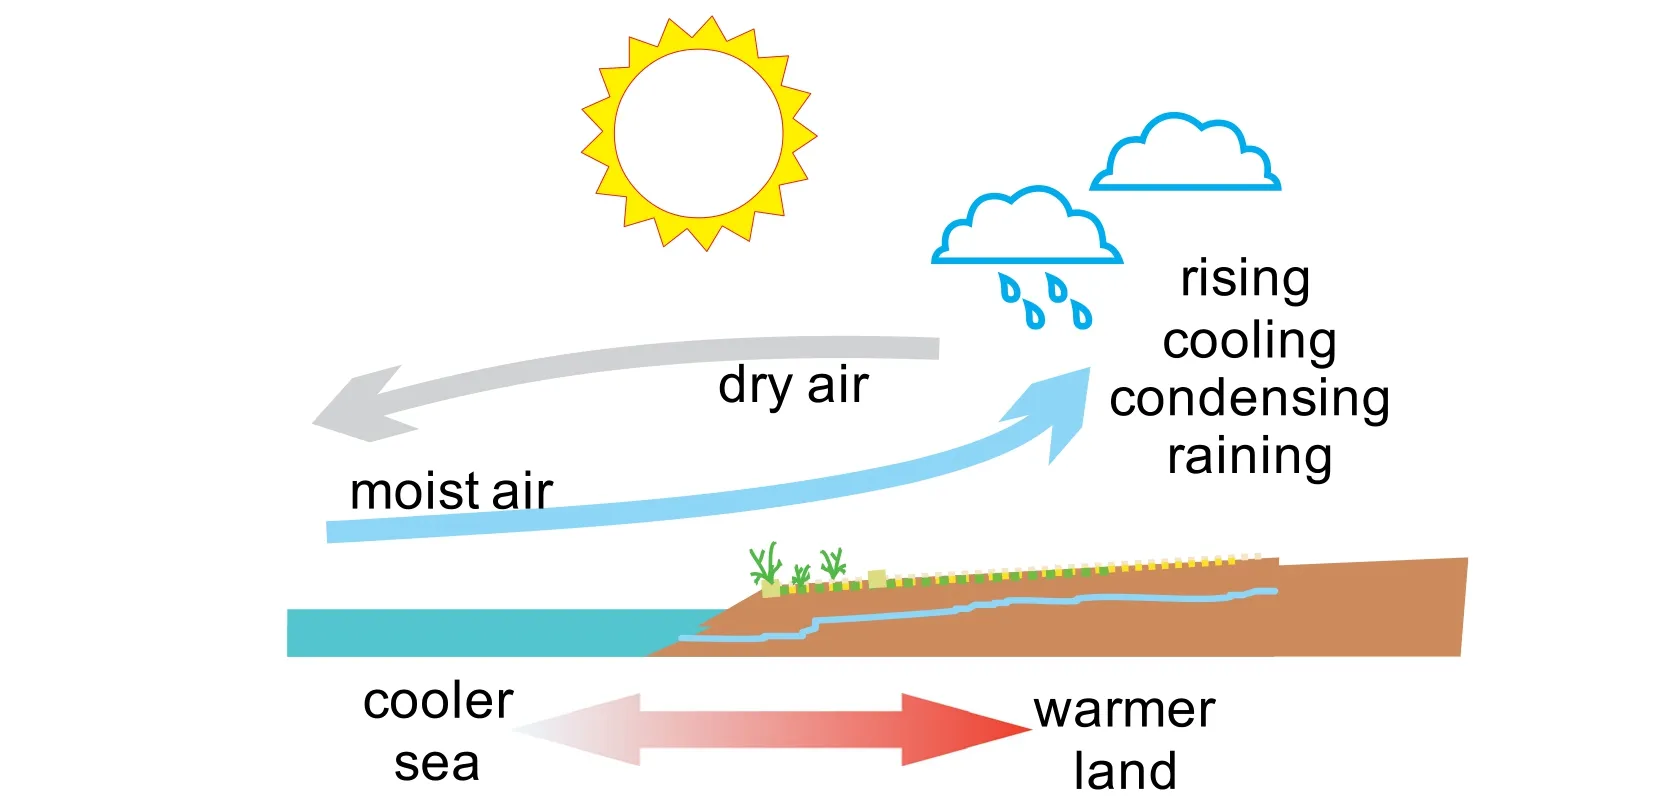
Fig.1 Aschematic of a temperature drive sea breeze.Air risesover the warmer land surface,lowering local air pressure and drawing in moisture laden air from over the ocean.This air converges,rises and cools,allowing the moisture it carries to condense and fall as precipitation
Halley’s temperature-gradient theory,with added details(Hadley 1735 etc.),remains the dominant explanation of how winds and global circulation patterns are generated(Schneider et al.2014;An et al.2015).The details include circulation cells and their seasonal shifts,and the influence of Earth’s rotation.Conservation of angular momentum,an effect known as the Coriolis Effect,deflects winds in the northern hemisphere rightwards and those in the southern hemisphere leftwards.Nonetheless,the force and energy that drives winds and circulations derive from differences in temperature.The modern perspective highlights how global circulation patterns migrate as sunlight and temperature gradients shift with the monsoon region lying between the annual extremes reached by the intertropical convergence zone(Liand Zeng 2002).
Various research interpreted from within the temperaturegradient theory implies a role for forest beyond passive moisture recycling(e.g.,Boers et al.2017;Wright et al.2017).For example,one study was interpreted as showing that transpiration from the forest provided the primary moisture source for rainfall during the transition that facilitates the seasonal(monsoon like)transition from dry to wet conditions in the southern Amazon(Wright et al.2017).Models have been used to investigate many details in these relationships,and their dependencies,but all these simulations assume that the temperature-gradient mechanism is correct and adequate.
No-one questions that temperature gradients can generate sea breezes,seasonal shifts in weather and convective weather systems.A more debated question is whether these processes are sufficient to explain atmospheric motion and moisture transport.Researchers recognise challenges in applying the temperature-gradient theory to global circulation.For example,the ascent of warm air drives the process,but as this air rises,other air must descend(the system circulates).But as air descends it warms and thus gains buoyancy resisting this circulation.Estimates of heat loss imply that this resistance should prevent circulation(Goody 2003).What then are thealternatives?
A role for water vapour
Anastassia Makarieva,Victor Gorshkov and various colleagues—recently including myself—have advanced a theory describing how evaporation and condensation influence atmospheric dynamics.This is the first theory indicating that condensation plays a general and dominant role in atmospheric dynamics(though others have suggested a role in cyclonic storms,see Lackmann and Yablonsky 2004;Wacker et al.2006).
The conventional temperature-gradient theory assumes that all the dominant processes that determine atmospheric pressure gradients can be understood without considering the changes in molecular(particle)densities that occur as water evaporates and condenses.The new mechanisms arise when we seek a more complete picture.I will briefly sketch some of the key principles.Those seeking more detail should refer to Makarieva and Gorshkov(2010),Makarieva and Gorshkov(2007)and Makarieva et al.(2013).
Water vapour is unevenly distributed in the atmosphere—imbalances are maintained by the constant interplay of evaporation and condensation.In all but the driest regions of our planet the concentration of water vapour declines markedly with altitude over the first kilometres in the lower atmosphere.It takes energy to evaporate water:i.e.,to free the molecules from each other as well as work against local atmospheric pressure to create space for the additional gas.Thus atmospheric water vapour stores energy.
When condensation occurs in the atmosphere stored energy is released—some is converted to heat(either radiated away or warming the local atmosphere),some(the gravitational energy)is dissipated to friction via the acceleration and motion of the falling water(n.b.some of this gravitational energy is tapped in hydroelectric schemes),and the remainder can accelerate air as it generates a pressure gradient(for a discussion of the relative values in the context of global circulation see,Makarieva et al.2013).It is thisfinal process,the ability of condensation to accelerate air,which was previously overlooked(Makarieva et al.2013;Makarieva et al.2017).
How does this acceleration occur?If we compare an atmospheric column over a moist humid region with one over a drier region we will find that the relationship of air pressure(and temperature)with altitude differ.If these columns are placed beside each other we find that the moist column maintains lower pressure at low altitude and higher pressure at high altitude than the drier column.This difference in pressure with altitude generates circulation such that the moist column(where most condensation is occurring)will draw in low-level air from the drier region,and return air to it at a higher-level.This moist column now rises and cools and the resulting condensation leads to a drop in atmospheric pressure at the lowest altitudes drawing in yet more moist air which rises,cools and condenses in turn.This process can be sustained as long as there is sufficient water vapour to fuel the process.The resulting pressure gradients,and expected rates of energy generation(power)associated with these processes are comparable to observations(Makarieva et al.2013).
Rates of evaporation and condensation are controlled by different factors.Condensation dominates the spatial patterns resulting from these processes because,while evaporation is a slow and widely distributed,energylimited process,increasing local pressure gradually over large areas,condensation can be both rapid and localised.Powerful storms arise when large volumes of moist air rise rapidly in a constrained region leading to intense condensation(Makarieva et al.2013).This idea predicts that storm power is linearly related to total rate of precipitation—this prediction matches observations(Makarieva et al.2015;Sabuwala et al.2015).
Fuller details of the theory and its implication can be found in physics journals(Makarieva and Gorshkov 2009;Gorshkov et al.2012;Makarieva et al.2014)and in the atmospheric and meteorological science journals(Makarieva et al.2013;Makarieva et al.2013;Makarieva et al.2017;Makarieva et al.2017).We also summarised the ideas for non-specialists(Makarieva and Gorshkov 2010;Sheil and Murdiyarso 2009).Furthermore,we have described failings in the temperature-driven theory of winds(Makarieva et al.2015)and revised the fundamental equations governing atmospheric dynamics(Makarieva et al.2017).As I shall summarise in the following section we also examined the influence of forests.
The breeze from the trees
A key implication of the condensation-driven theory of winds is that regions that generate high evaporation rates relative to surrounding regions develop lowerpressure zones which draw in air.This air converges,rises and cools and moisture condenses,generating rainfall that can surpass local evaporation.All else being equal,the difference in mean evaporation between adjacent regions predicts the wind between them.Regions with higher leaf area are thus expected to attract winds from areas with lower leaf area(Makarieva et al.2013).This relationship implies that sufficiently large areas of tree cover actively draw in air and moisture from elsewhere.This process is called the ‘biotic pump’.
The attraction of transpiring vegetation for moist air has been recognised previously.For example,there is evidence from dryland southern Africa that the delayed increase in leaf area that follows rainfall reinforces subsequent winds and precipitation such that`the vegetation draws airflow toward itself in a self-sustaining way`(Chikoore and Jury 2010).Similar observations concern monsoon systems(see below).
The biotic pump explains various phenomena.It explains how high rainfall is maintained in the continental interiors of the Amazon,Congo and Siberia,while in areas without forest the declines in rainfall with distance inland is steeper(typically halving each few hundred kilometres over level terrain in an approximately exponential decline)(Makarieva and Gorshkov 2007;Makarieva et al.2009;Sheil and Murdiyarso 2009;Makarieva et al.2013).Neither global circulation patterns nor regional recycling can explain these patterns—they could influence the rate of decline with distance but not negate it.This effect—the drawing of rain into continental interiors—requires a biologically functioning forest,so we would predict that the effect will be smaller over boreal forests in deep winter(when transpiration ceases).Observations support these predictions(Makarieva et al.2013;Sheil 2014).The low pressure generated over forests can explain how the wind called the“Caribbean Low Level Jet”opposes the prevailing trade winds as it is drawn towards the South American continent(Poveda et al.2014).There is considerable scope for further evaluating theserelationships.
Instabilities and implications
Among the insights provided by recognition of positive feedbacks in land-cover climate change relationships,is the potential to switch depending on how evaporation differs among neighbouring regions.These switches can occur on a regular basis as in monsoons or more permanently.Though the idea of alternate ecologically determined states is established(Scheffer et al.2001),such climate switching remain poorly characterised.Such behaviours warrant evaluation.
As noted previously,temperature based models do not match the observed switching behaviour of monsoons(e.g.,Acharya et al.2011;Niu et al.2015).Additional controversy surrounds mechanisms and the causes of annual variation(Boos and Storelvmo 2016;Levermann et al.2016).Furthermore,the abrupt shifts in monsoon climates sometimes seen in paleo-data remain unexplained(Herzschuh et al.2014).The temperature driven theory suggests we should find a clear difference in land-ocean temperature contrasts between seasons and as an explanation of when switching occurs—in practice such a pattern is absent.Indeed,Antonio Nobre(pers.comm.,see also,Nobre 2007)talks about the“Cold Amazon Paradox”as the strange state of affairs when the strongest winds blow from the Atlantic into the Amazon not as expected—from a na?ve temperature-gradient theory derived perspective—when the Amazon is warmest,or the temperature contrast greatest,but when the Amazon is markedly colder than the ocean(see Fig.2,for a fuller examination of regional moisture flows in this region see Drumond et al.2014).
The biotic pump offers an alternative explanation.The switch between dry and wet conditions found in monsoon climates arises from the positive feedbacks that occur as the predominant difference in evaporation rates kick the prevailing winds from a land-to-sea to a sea-toland configuration(Makarieva and Gorshkov 2007;Sheil and Murdiyarso 2009;Makarieva et al.2013).The most extreme seasonal switch occurs in the boreal forests where transpiration and thus inland moisture transport is predicted and observed only when transpiration can occur(Makarieva et al.2013;Sheil 2014).
Observations in the tropics show that evergreen forests maintain relatively high humidity year round including dry periods(Bunyard 2014).The evergreen forests of the seasonal Amazon also maintain significant transpiration through the year(Myneni et al.2007;Wu et al.2016).Recent studies indicate that the ability of the Amazonian forests to maintain transpiration in the dry season plays a key role in determining the dry-towet season transition in the southern Amazon(Wright et al.2017).The “dry-season”transpiration typically permits some rainfall and this retained moisture facilitates the return of the wet season.The region’s more balanced land-sea evaporation contrast also explains the absence of the abrupt switching of onshore winds found in drier monsoon regions(Zhou and Lau 1998).Overall,it appears that the switching behaviour suggested by the biotic pump appears to match observations,though other explanations have also been proposed(e.g.,that'shallow convection'maintains moisture locally(Wright et al.2017)).
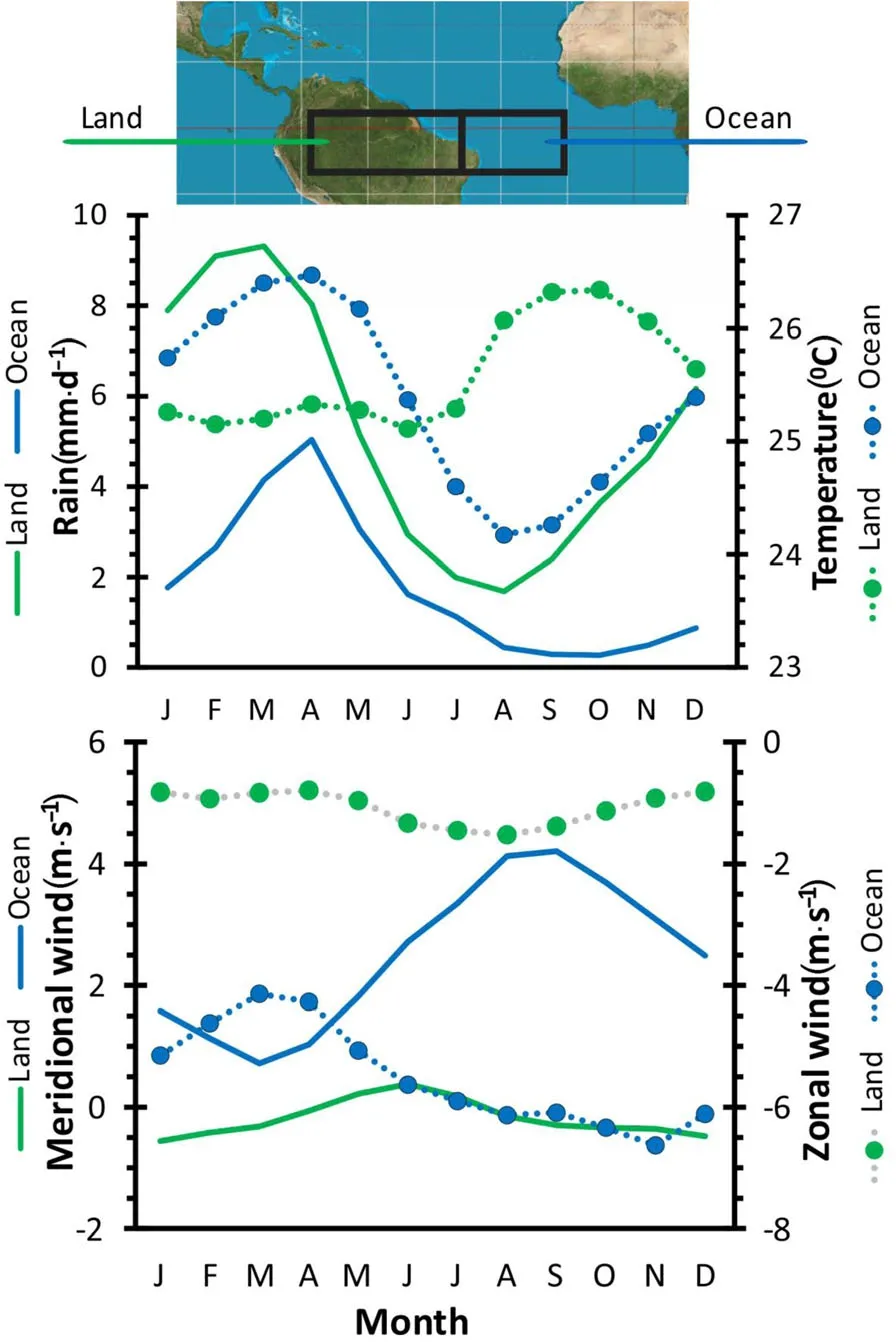
Fig.2 The Cold Amazon Paradox:during the wettest monthsthe land iscolder,not warmer,than the ocean.We compare two areas(top panel)land in the Amazon,green-lines(all land between 70 Wand 40 W,2.5 Nand 7.5S),and ocean,blue-lines(seaat 40 W-20 W,2.5 N and 7.5S).Upper graphs:Monthly rainfall and surface temperature oC(at 1000 hPa).Lower graphs:winds:meridional(south to north)and zonal(west to east).These mean valueswere derived from 1978 to 2013 using datafrom the National Centersfor Environmental Prediction–National Center for Atmospheric Research(NCEP–NCAR)reanalysis(Kalnay et al.1996)
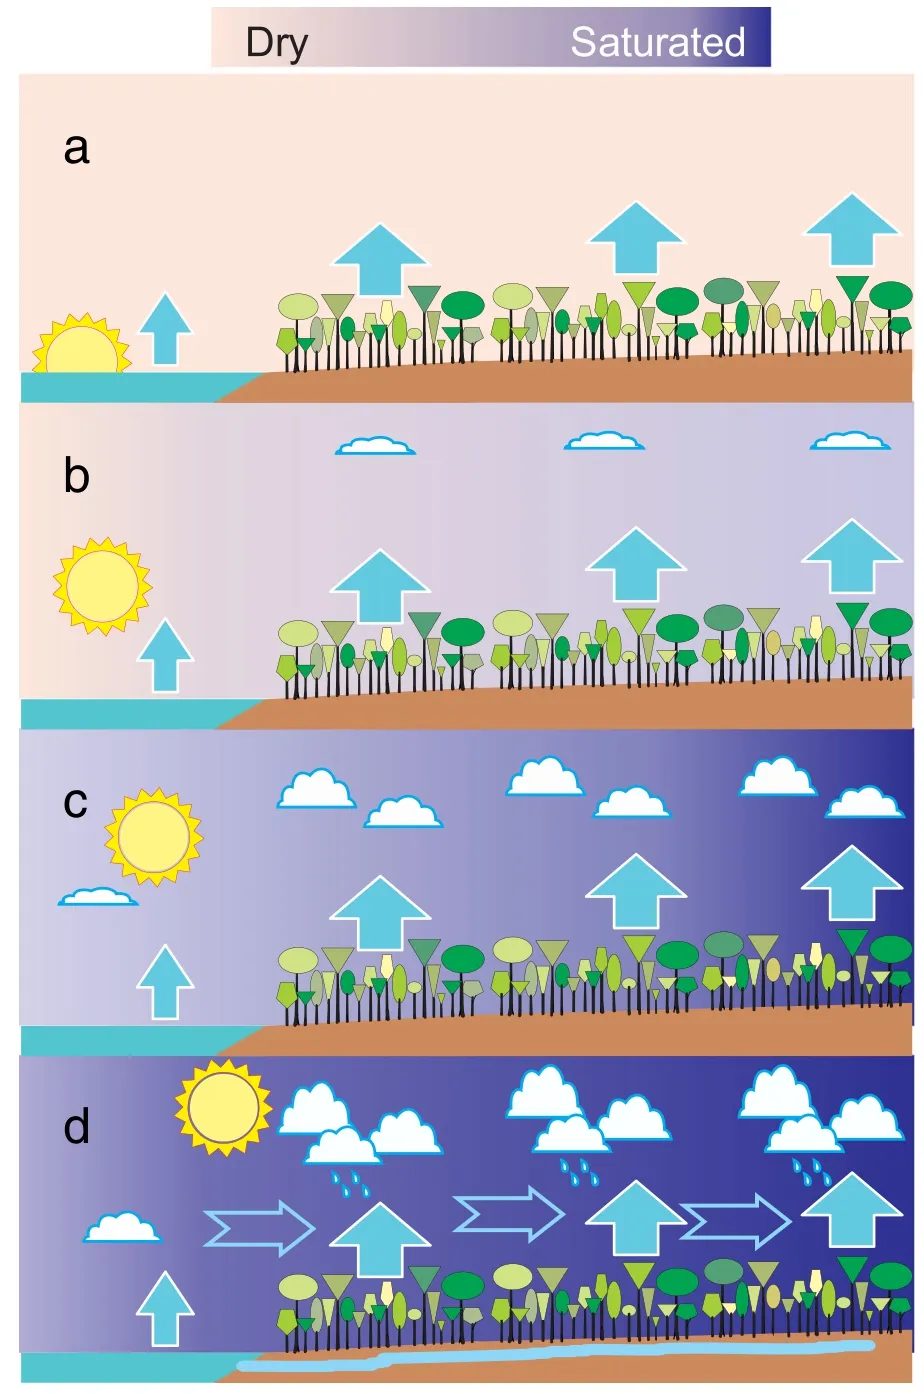
Fig.3 A schematic of how condensation driven winds develop between ocean and forest.a Morning:the atmosphere isstill and dry(pink colour).Once the sun rises the forest emits water vapour(vertical arrows)at a greater rate per unit area than the ocean.Slowly,through the day(b)and(c)moisture accumulatesover the forest(bluer colour),until(d)the water vapour over the forest is sufficient to condense(possibly accelerated by aerosols).This condensation reduces local air pressure thus drawing in moist air from elsewhere(horizontal arrows).In contrast to the slow evaporation of water vapour,condensation occurs quickly,and leads to air being drawn in,converging,rising,cooling and condensing additional moisture in a self-sustaining process.Moisture generated locally via forest evaporation precipitates together with much additional moisture brought from the ocean.This additional moisture is what ensures land remainswet counteracting the loss of water via rivers to the ocean
The diurnal weather cycle over forest can also be seen as a daily monsoon.I will use this example to illustrate and evaluate the role of evaporation and condensation(for more information see Makarieva et al.2014).To explain our predictions,first consider an idealised case(see Fig.3).Note that,all else being equal,precipitation is more likely in a wetter atmosphere(Holloway and Neelin 2010).Note too that any local increase in gas molecules,water vapour included,will raise local atmospheric pressure.Thus if we compare days with and without rain,in an area generating rain we predict that on rainy days we will observe greater local atmospheric pressure just prior to rain falling,i.e.more water vapour raises both atmospheric pressure and the likelihood of subsequent rain.To evaluate this prediction,we gathered data for pressureand precipitation from 42 meteorological stations divided over three regions(one within and two outside the Amazon forest).These data were provided by the Brazilian Meteorological Institute.We used all the available data for each station up to the end of 2012(the longest running provided 53 years of data,see www.inmet.gov.br/portal/index.php?r5bdmep/bdmep).To summarise the results:rainy days within the forested Amazon region are,consistent with the accumulation of more water vapour,preceded by a period of higher atmospheric pressure greater than any such pattern on rainless days(detected at 13 of 14 stations).In the peripheral and more deforested regionstheresultsare lessconsistent with most sites showing some drop in pressure prior to rain(around two thirds of the stations indicate decreased pressure).We believe that these latter sites do not generally sustain enough evaporation to trigger rain locally but that air movements are initiated elsewhere(Makarieva et al.2014).While these patterns are not easily explained by temperature effects alone,they conform to the predictions of the biotic pump.The effects of temperature and moisture dynamics on winds clearly require further study(Makarieva et al.2015).
The diurnal and annual monsoon cycles show how changes in evaporation and condensation can potentially switch a region from wet to dry.Such switching can also occur at longer timeframes(Makarieva and Gorshkov 2007;Sheil and Murdiyarso 2009).If inland rainfall depends on large near-contiguous forest,then deforestation,especially near the coast,risks switching the continent from wet to dry—with catastrophic implications.The precursor of such a switch would be declining rainfall and reduced reliability.This fits with patterns of declining rainfall in southwest Australia(averaging a 21%reduction relative to coastal values)being due to the reduction of native woody cover from 60%to 30%between 1950 and 1970(Andrich and Imberger 2013).It also fits with declining reliability in rainfall as correlated with forest loss on the Atlantic coast of Brazil(Webb et al.2005).The increasing desiccation,and more frequent droughts,can result in tree death,increased flammability,fires,and further drought(Zemp et al.2017b).
Alternative explanations require examination too.Some also identify positive feedbacksand the possibility of switching states(e.g.,Boers et al.2017;Wright et al.2017).Others suggest that more gradual transitions are possible(Levine et al.2016;Zemp et al.2017a).It is crucial to distinguish which theory or theories best conform to reality and the risk of climate switching.Observing how air pressure,vegetation behaviour,and precipitation vary over the diurnal and monsoon cycle can provide key insights.
If regional patterns in the relative abundance of water vapour generate and stabilise winds,then both reduced tree cover and increased atmospheric carbon dioxide(inducing reduced stomatal opening,which leads to lower water-use,see e.g.,de Boer et al.2011)will reduce atmospheric moisture,leading to reduced continental precipitation and related winds.Long-term data already indicate a long-term decline in wind intensity over the tropics and mid-latitudes(McVicar et al.2012)not all of which can be ascribed to changing surface roughness(Wever 2012).Shifts in circulation cell boundaries are also predicted with major impacts for the areas affected(Heffernan 2016;Makarieva et al.2017).The eastward shift of the rainfall zone over South East Asia may be such an impact,perhaps arising from interactions between regional circulation patterns and forest loss(Tokinaga et al.2012;Sheil 2014).
If condensation can indeed determine wind patterns,then aerosols that promote condensation,or freezing,may influence regional climate to a greater degree than already recognised.The biotic pump implies that the locations where condensation starts most readily and frequently are those that draw in winds.All else being equal,this will be over the areas that evaporate the most moisture.But aerosols can change this by permitting condensation at lower vapour concentration and shifting the balance.This offers an alternative means by which vegetation can influence precipitation and winds.
Cyclones
Our work on cyclonic systems—hurricanes,typhoons and cyclones—suggests that forests may reduce the frequency and intensity of storms,especially those that develop near land.Given their high vapour emission it may initially seem that forests should generate and support cyclonic storms.This does not occur because,unlike oceans,forests possess a marked diurnal cycle with reduced transpiration overnight,moreover dragfriction over forests is severe,absorbing energy and slowing winds.Furthermore,while cyclonic storms concentrate air flows and resulting condensation into their eye,forests release moisture and aerosols in a more diffuse form,ensuring that condensation remains more broadly spread in both space and time.Thus cyclonic storms cannot form or be sustained over,or near to,extensive forests.In addition,given the need for water vapour to fuel these storms,if forests constantly draw moisture away as the biotic-pump theory suggests then they would reduce the energy available to fuel storms in nearby oceans.The combined result of all these process means that storms are unlikely to form near to extensive areas of forests,and any storms carried by the prevailing winds towards such forests are likely to decline in power.
Cyclones generally form over the ocean at latitudes where large amounts of water vapour are available,that is within two belts 10°–20°north and south of the equator:latitudes that lie between those of wet tropical forests and dry deserts(deserts yield only dry air),where the desiccating effect of neither dominates.The inhibiting effects of forests to either side likely explains why cyclonic storms are rare in the South Atlantic(Hurricane Catarina in 2004 was the only exception).Loss of the Amazon and Congo forests would increase the likelihood of such storms.Any such protective properties are scale-dependent,and while the influence of large forests such as those in the Amazon are likely extensive,the impacts of small areas will also be small.For example,few Caribbean islands possess sufficient areas of forest to greatly influence cyclonic storms—though such properties could be boosted by large-scale rehabilitation.
Discussion
A jigsaw with missing pieces
We know enough to recognise that our picture of how the global climate system works is very different than how it was viewed even a few years ago.We also know enough to recognise that much remains unclear.Here I will briefly note a few intriguing topics for research(see also Sheil and Murdiyarso 2009)before considering some practical aspects.
New insights
Insights into vegetation-atmosphere relationships can advance,and draw upon,many disciplines.For example,there are fundamental biological questions such as why plants use as much water as they do(Cramer et al.2009;Wolf et al.2016).We also need to understand how plant traits that influence wider water availability evolve in response to natural selection.
Research can improve understanding of the processes and relationships that underlie the biotic pump.While laboratory evaluations appear theoretically feasible,see for example the ideas in appendix 4 of Makarieva et al.(2013),in practice it is technically demanding to separate the effects of temperature,buoyancy and molecular densities in an enclosed apparatus(e.g.,Bunyard 2014;Bunyard et al.2017).Furthermore,small-scale studies may remain difficult to interpret in the context of real largescale atmospheric behaviours.Unambiguous tests may require field observations.I encourage creative researchers to explorethese problems.
There is plenty to examine in current meteorology too.For example,the daily precipitation patterns that are characteristic in many regions of the tropics remain poorly understood(Kikuchi and Wang 2008;Sakazaki et al.2017).Recognition of biological processes may help(Makarieva and Gorshkov 2007;Sheil and Murdiyarso 2009;Sakazaki et al.2017;).We know that transpiration often ceases temporarily,or periodically,after high rates have been achieved(Zhang et al.2013).This may disturb local pressure dynamics and thus influence cloud dynamics and precipitation.The pulsing patterns of moisture release,and resulting raised humidity,indicated over at least some forests(see Bunyard 2014)may be one way for the forest to generate the vapour concentrations required to trigger condensation—though the mechanisms underlying this behaviour and how it might have evolved remain unknown.
There are longer cycles to be explored too,for example,rainfall correlates to lunar phases(Brier and Bradley 1964;Carpenter et al.1972;Pennycuick and Norton-Griffiths 1976;Cevolani et al.1987;Hanson et al.1987;Roy 2006)and again physical explanations have been elusive(Camuffo 2001;Kohyama and Wallace 2016).But such rhythms may be biological in origin(for examples see,Reinberg et al.2016;Zaj?czkowska and Barlow 2017).Indeed,some older studies noticed how,for example,the presence of ice nucleating particles also varied with the lunar cycle(Bigg 1963;Bigg and Miles1964).
At longer time-scales,our understanding of past events may require reassessment too.For example,concerning the role of humans and fire use in the formation,expansion and maintenance of drylands often ascribed to climate alone.The desiccation of Australia may be an example(Makarieva and Gorshkov 2007;Sheil and Murdiyarso 2009).Another possible example is the savanna vegetation that reaches the west African coast between Ghana and Nigeria(Savenije 1995;Salzmann and Hoelzmann 2005).We should also consider the climatic influence of people in paleo-extinctions where past analysis consider human activities and climate change as distinct(Cooper et al.2015;Stuart 2015).Similarly it may raise new factors regarding the causes and role of declining rainfall in the history of various civilizations,from the Maya of Central America,to the Axumites of Eastern Africa and the Polynesians of Easter Island(Douglas et al.2016;Rull et al.2016;French et al.2017).
Advances in theory,methods and data handling provide new opportunities.For example,genetic methods now permit the detection and identification of very low concentrations of airborne microbes(Hill et al.2014;Failor et al.2017).At a larger scale,while challenges remain (Maggioni et al.2016),satellites and models already permit the monitoring of global patterns in precipitation and wind patterns(Spracklen et al.2012).There are major research efforts looking at aerosol particles and their origins,dynamics and influences and new discoveries remain frequent(Failor et al.2017;Gu et al.2017).I expect surprises.
Water security and the imperative of improved understanding
The lives and livelihoods of billions of people depend on reliable access to water(Sheil 2014).We must safeguard the processes that this access depends on.For that we need to understand how the hydrological cycle works and what it depends on.Despite recent progress,this knowledge remains fragmented and incomplete.One consequence is that models and their predictions remain unreliable(Trenberth 2011;Stevens and Bony 2013;Shepherd 2014;Marotzke et al.2017).
So what do we know?We know that the hydrological cycle is changing and that this is impacting people and the environment(Stocker et al.2013;Hegerl et al.2015;Mekonnen and Hoekstra 2016).We know that changes in land cover impact atmospheric moisture(Sterling et al.2013),air temperature(Alkama and Cescatti 2016),aerosols(Heald and Spracklen 2015)and air movements(Detto et al.2008;Santana et al.2017).We know that the hydrological cycle is influenced by multiple feedbacks at multiple spatial and temporal scales(Mahmood et al.2013;Wang-Erlandsson et al.,2017)and that trees and forests play a significant role(Bonan 2008;Spracklen et al.2012;Morris et al.2014;Sheil 2014;Ellison et al.2017;Wei et al.2017).
We know what aspectsmatter even if we don’t yet know or agree the details.For example,we know that the flow of water vapour from the land surface depends on many factors,not all of which are fully characterised or represented in models(and the many simulations,such as the IPCC scenarios,that depend on these).Such effects may oppose each other,making the outcome unclear,for example,we know that forest loss and reduced stomatal opening associated with increasing carbon dioxide is likely to reduce vapour transpired to the atmosphere(Spracklen et al.2012;Sheil 2014;Franks et al.2017),but increasing leaf area observed in many regions may also boost transpiration(Zhang et al.2015).
Complexity means that some relationships,such as the effects of aerosols,may defy easy generalisation.But others,notably fuller inclusion of evaporation and condensation processes in atmospheric dynamics(the‘biotic pump’),offer elegant insights and,if integrated into more comprehensive models,may resolve some of the discrepancies plaguing current climate models.
While evidence shows that climate is influenced by tree cover(locally and elsewhere),not all tree cover has equal effects.Some properties reflect the species and genotypes present(volatile gas emissions,leaf phenology).While a large area of planted forest will certainly influence the local water-cycle,it is not yet clear how when and where this can replace the various properties and functions of natural forest.For example,we know that to a greater degree than most planted forests,many natural forests maintain low understorey temperatures during the day and generate a local atmospheric inversion at night maintaining a moist understorey that will influence how and when water vapour is released(Szarzynski and Anhuf 2001).Tree diversity may stabilise climate feedbacks by reducing vulnerability to changing conditions and to disturbance(e.g.,Schurr et al.2006;Hisano et al.2017;O’Brien et al.2017).In any case,younger vegetation has distinct properties when compared to morematurevegetation and wemust acknowledgethat the impacts of restoration and forest recovery are dynamic(Bruijnzeel 2004;Filoso et al.2017).Hydrological impacts are context dependent:a site can only influencewater that is available(in the vicinity).So,for example,while there was optimism that increasing tree cover in the arid regions of northern China would increase rainfall and initiate wider greening even without explicit attention to longrange water transport(e.g.,Jiang and Liang 2013),recent appraisals suggest little progress in the driest areas(Ahrends et al.2017).Some studies suggest that planting(Deng et al.2016)and alien species(Cavaleri et al.2014)can be more disruptive and less beneficial than natural recovery by native vegetation.Nonetheless,such differences require more study before broad generalisations are justified as there may be exceptions or management options that can reduceor negate such differences(Sheil and Murdiyarso 2009).
Sustaining a resilient and reliable water cycle is a global challenge,and requires understanding and action at many levels.While I have emphasised biophysical relationships,the challenges and opportunities cannot be addressed by the biophysical sciences alone.As links and dependencies are identified at local,regional and transcontinental scales there will be a major role for those concerned with devising and implementing the social and institutional arrangements required(see for example,Cohen 2012;Ellison et al.2017;Keys et al.2017).
Among the most profound and disturbing insights offered by this review is the potential for non-linear behaviours:the indication that a continent or region that passes some threshold of forest loss might tip from a wet to a dry climate.While various details remain poorly characterised,and some are debated,the overall linkages appear uncontroversial.We know that large scale forest loss or die-back will generally reduce atmospheric moisture,rainfall and cloud cover,and increase the likelihood of drought and further loss or die-back.Add in human activities,increasing temperatures and fires,and changes could be rapid,making whole regions near uninhabitable and releasing vast amounts of carbon stored in vegetation and soils into the atmosphere over only a few years.There is also a positive side:rainfall can be stabilised and regained by maintaining and restoring tree cover.Characterising these threatsand opportunitiesisa priority.
Conclusion
Life depends on water while water frequently depends on life.Understanding these dependencies is crucial in ensuring the reliable availability of fresh water.We know that forests and trees play a major role though many details remain debated.In the future,forests should be protected,managed and planted,at least in part,for their role in sustaining atmospheric water and all that depends on it.Much now depends on improving our understanding.Forest scientists and other biologists have a major role to play.
Endnotes
1Note that like precipitation,evaporation is represented in units of depth,e.g.,the equivalent depth of water.This also clear from considering the water involved as a volume(length cubed)divided by an area(length squared)giving units of depth(length).
Abbreviations
BVOC:Biogenic VOCs;C:Carbon;IPCC:The Intergovernmental Panel on Climate Change;Kg:Kilogram;m:Meter(s);oC:Degrees Centigrade;Pg:Petagram or 1012kg;VOCs:Volatile organic compounds—moleculesthat can occur asgasesin the atmosphere and whose chemicalstructure includes carbon(but excluding carbon dioxide,carbon monoxide,all carbides,and carbonates).While methane isformally a VOCit isoften excluded;Yr:Year
Acknowledgements
Many ideaspresented here are the result of discussionswith colleagues,particularly Anastassia Makarieva and Victor Gorshkov who also provided detailed feedbackon earlier drafts.Iam grateful for the insightsand suggestionsof two anonymousreviewersaswell asto Jan Vermaat,Rannveig Margrete Jacobsen,Antonio Donato Nobre and Peter Bunyard for commentson a near final draft.Ithank Miriam van Heist for help with document review and preparation.
Funding
DS’s time was paid by the Norwegian University of Life Sciences.He acknowledges the value of participation in the Australian Research Council projects under grants DP160102107 and LP130100498.DSalso benefitted from the meeting in Leuven,Belgium in 2015 where his participation was funded by WeForest and the Center for International Forest Research,and also from the meeting in Wageningen,Netherlands,also in 2015,where his participation wasfunded by Tropenbos.
Availability of data and materials
Not applicable.
Authors’contributions
DSisthe sole author:he reviewed the literature,planned,drafted and finalised the text.The author read and approved the final manuscript.
Authors’information
DSisan ecologist who focuses on the monitoring,conservation and management of tropical forests.
Ethics approval and consent to participate
Not applicable
Consent for publication
Not applicable
Competing interests
The author declares that he hasno competing interests.
Received:3 September 2017 Accepted:2 January 2018


- Forest Ecosystems的其它文章
- Predicting the provisioning potential of forest ecosystem servicesusing airborne laser scanning data and forest resource maps
- Detecting treeline dynamics in response to climate warming using forest stand maps and Landsat data in a temperate forest
- Nutrient retention and release in coarse woody debris of three important central European tree species and the use of NIRS to determine deadwood chemical properties
- Species-specific,pan-European diameter increment models based on data of 2.3 million trees
- Drought can favour the growth of small in relation to tall trees in mature stands of Norway spruce and European beech
- Dendroclimatic analysis of white pine(Pinusstrobus L.)using long-term provenance test sites across eastern North America