
Nutrient retention and release in coarse woody debris of three important central European tree species and the use of NIRS to determine deadwood chemical properties
2018-09-12 09:14:50SteffenHerrmannandrgenBauhus
Forest Ecosystems 2018年3期
Steffen Herrmannand Jürgen Bauhus
Abstract Background: Coarse woody debris (CWD) is very important for forest ecosystems, particularly for biodiversity and carbon storage. Its relevance as a possible reservoir and source of nutrients is less clear, especially in central Europe.Methods: Based on a chronosequence of known ages of logs, we analyzed the nutrients stored in CWD of Fagus sylvatica, Picea abies, and Pinus sylvestris at different sites in Germany. To quantify nutrient concentrations, we assessed the use of Near Infrared Reflectance Spectroscopy (NIRS) to determine the chemical properties of CWD.Results: NIRS models were suitable to predict concentrations of C, N, P, lignin and extractives. Concentrations of most nutrients increased with mass loss, with the exception of potassium, which decreased for beech and pine and remained relatively constant for spruce. The highest nutrient concentrations (N, P, S, Ca and Mn, except Mg and K)were generally observed in highly decomposed spruce logs. The net effect of decreasing CWD mass and increasing nutrient concentrations was either a decreasing (N, P and K in beech; P, Mg, K and Mn in pine), constant (S, Ca and Mg in beech; N, S and Ca in pine) or increasing amount of nutrients (N, P, S and Ca in spruce; Mn in beech) in the logs over the course of decomposition. The C/N ratio decreased for all tree species, most markedly for spruce from ca. 1000 at the beginning of the decomposition process to 180 at 36 years. The N/P ratio converged to a value of about 30 for all three species. Lignin concentrations increased for spruce and beech and remained constant for pine.Conclusions: Our results indicate that most nutrients remain in CWD for long periods. Nutrients may be used and cycled by microorganisms within CWD, but with the exception of P (in beech), Mg (in pine) and K (in beech and pine),there appears to be little net nutrient export until two thirds of the mass is lost. Instead, N, P, S and Ca were accumulated in spruce logs, indicating that CWD became a net sink rather than a net source of some nutrients for several decades.
Keywords: CWD, NIRS, Decay, Carbon, F. sylvatica, P. abies, P. sylvestris
Background
Coarse woody debris (CWD) is structurally and functionally very important for forest ecosystems, in particular in relation to biodiversity (Siitonen 2001; Grove et al.2002; Müller and Bütler 2010) and carbon sequestration(Harmon et al. 1986; Turner et al. 1995; Pregitzer and Euskirchen 2004). It can clearly play a key role in the carbon and nutrient cycle, i.e. as a temporary reservoir,but its importance varies with context. Most research on nutrient dynamics associated with CWD has been conducted in boreal forests of North America and Russia(Bauhus et al. 2018). Some studies have found that the store of nutrients in dead wood is significant when compared to other biomass pools in boreal forest ecosystems of northwestern Russia (consisting of Scots pine, Norway spruce and birch; Krankina et al. 1999), whereas others have found no substantial contribution of CWD to the nutrient cycle for North-American coniferous forests(Laiho and Prescott 2004). Very little information is available for central European forests and the economically most important tree species Fagus sylvatica, Picea abies and Pinus sylvestris. In fact, only six studies considered, at least to some extent, nutrient dynamics in CWD for F. sylvatica (Christensen and Vesterdal 2003;Kraigher et al. 2003; ódor and Standovár 2003; Müller-Using and Bartsch 2007; Kuehne et al. 2008; Kahl 2008),there are two relevant studies for P. abies (Kahl 2003;Bütler et al. 2007), and none for P. sylvestris. In addition,all of these studies were case studies carried out at single sites. These studies found that concentrations of P and the base cations Ca and Mg increased significantly over the course of decomposition, which may be particularly important in forest ecosystems with highly acidified soils.In these systems, the quantity of calcium in CWD can reach dimensions similar to those of the forest floor compartment (Müller-Using and Bartsch 2007). Accumulation of CWD on the forest floor can improve soil quality locally and provide hotspots for certain nutrients and the organisms that depend on them, such as the gastropod community that depend on Ca in CWD in forests on highly acidic soils (Kappes 2005; Kappes et al. 2006, 2007).
To reduce efforts and costs for wet chemical analyses of wood, near infrared reflectance spectroscopy (NIRS)may be used as an indirect method to determine the chemical composition (e.g. lignin and cellulose content)of wood based on its spectral properties (Kelley et al.2004; Poke et al. 2004; Poke and Raymond 2006; Via et al. 2014). NIRS has been used successfully for the assessment of chemical properties of forest floors organic material and heterogeneous plant material (Gillon et al.1999; Chodak et al. 2002; Gruselle and Bauhus 2010).However, to our knowledge NIRS has never been used for the rapid assessment of the chemical properties of decomposing wood. Here we assessed changes in nutrients and organic constituents in CWD of Fagus sylvatica,Picea abies and Pinus sylvestris across different decay stages.Further,we assessed the use of NIRSto determine the chemical properties of CWD,which can then be used to predict nutrient concentrations for additional samples without wet chemical analysis.
Specifically,we hypothesized that:
1)Nutrient concentrations increase with advancing decomposition,whereas the quantities of nutrients in decomposing logs remain constant or decrease with increasing mass loss.
2)The quantity of nutrients stored in decomposing logs is higher in Fagus sylvatica(angiosperm)than in Picea abies and Pinus sylvestris(gymnosperms).In addition,we aimed to determine whether nutrient concentrations in dead wood can be accurately predicted with NIRS.
Methods
Study sites
For the chronosequence approach that relates mass(i.e.wood density×volume)to the age of CWD,logs were sampled at sites where the previous stand had been wind-thrown and where no or only little salvage logging had taken place.Thus,we could be certain about the period that logs had undergone decomposition.The study sites were mainly located in southern Germany,except for the oldest site that was situated in northern Germany(Lower Saxony,near the city of Hannover)and Forêt de Haguenau,in the Alsace,France.All selected sites were hit by severe winter storms in 1999,1990 and 1972(Table 1).
Sampling design
Downed CWD of F.sylvatica,P.abies and P.sylvestris from three different years since tree fall(1972(except for beech),1990 and 1999)was sampled after 36,18 and 8 yearsof decomposition in three different initial diameter classes(>10 cm –≤20 cm,>20 cm –≤40 cm,>40 cm).Samples originating from wind throws in 1999 were collected along an altitudinal gradient from the Rhine valley up to the top of the black forest(Table 5 in Appendix).This represents a climatic gradient with regard to temperature and precipitation(see Table 1).Unfortunately,no pine CWD wasfound at the highest elevation.
In our design,site was not independent from year since tree fall.Generally,we sampled at least 5 replicates for each combination of species,site,and diameter.Where clearly different diameter classes were present along the length of a single log,we selected in some cases several sample-points at a minimum distance of 2 m within a given log,where cross-sectional stem discs were extracted.Discs were approximately 10 cm thick.On average,we extracted 2.5 sample discs per log.These samples were treated as separate samples,because the variations in wood density within one log and within the same decay class were comparable to the variations within the same decay class when collected from a large population of logs in the field(see also Müller-Using and Bartsch 2009).Separate samples from the same log can also differ considerably in composition of the microflora,as has been shown by others(Shigo 1986;Schwarze et al.1999).In addition,our preliminary analysis showed that samples of mass remaining from the same log were not auto-correlated according to the Durbin Watson-Test(DW=1.7).

Table 1 Description of the study sites
Decay class was assessed for each log and measurement position according to a 4-stage classification system(Albrecht 1991,for P.abies and P.sylvestris),modified for F.sylvatica by Müller-Using and Bartsch(2009).Based on the decay class and the associated known wood densities,log volumes assessed in field inventories can be converted into CWD mass and C content(Grove et al.2009).However,because the internal log condition may not be represented by a visual decay classification(Meyer 1999),large errors can result when calculating C pools on this basis.Therefore,we also assessed the internal density of logs with the drill resistance method(Kahl et al.2009;see also Herrmann et al.2015).At each point,where log diameter was measured,two drill resistance measurements were conducted,one horizontally and one vertically.In general,at least one stem disc per tree,representing the dominating decay class,was cut with a chainsaw at a drill resistance measurement position for further calibration of the method and wet chemical analysis.If more than one diameter or decay class was analyzed per log,the number of extracted discs increased accordingly.At one reserved site(‘Lot’)no discs could be removed for most beech logs,as their position was very close to a hiking trail.In this case,samples were taken with a wood corer(according to the method applied above).
Wood cores were taken from intact wood(1 sample per diameter class per species and site,except for the sites ‘Biw’, ‘Lot’ and ‘FdH’) to estimate initial nutrient concentrations. Where no wood cores could be extracted, we used initial nutrient concentrations from other sites with similar soil conditions. In the case of‘Biw’ (spruce and pine) the average of the initial nutrient concentrations from the sites ‘Kib’, ‘Roe’ and ‘Sig’ was used. The same was done for the site ‘Lot’ in the case of spruce. In the case of beech, we used the average from‘Roe’ and ‘Hof’ for the site ‘Lot’, as well as for the site‘FdH’ (beech only).
Density assessment
Density was assessed gravimetrically and via drill resistance measurements using the Resistograph 3450S(RINNTECH, Heidelberg, Germany) with a resolution of 0.01 mm and a maximum drilling depth of 44 cm (for further details see Herrmann et al. 2015).
Chemical analysis
Following density assessment, a subset of all samples with a total of 3 replicates per species, decay stage and diameter class was finely ground and analyzed for concentrations of C, N, P, S, Ca, K, Mg and Mn. The C and N concentrations were determined by combustion at 950 °C with a Leco Truspec? CN analyser (St. Joseph, MI, USA). Concentrations of P, S, Ca, K, Mg, and Mn were analyzed with Inductively Coupled Plasma-Optical Emission Spectroscopy (ICP-OES) (Spectro, Kleve, Germany), following HNO3digestion in pressure chambers. Extractives and lignin concentrations were measured according to the methods proposed by TAPPI (1976) and Effland (1977).
Near infrared reflectance spectroscopy (NIRS)
NIR-spectra for C, N, P, lignin and extractives were obtained from the finely ground and dry samples for the wave number range from 4000 to 11,000 cm?1using a Tensor 37 spectrometer (Bruker Optics GmbH, Ettlingen,Germany).
The detailed method for spectra acquisition as well as development and validation of NIRS prediction models using the OPUS software(version 5.5,Bruker Optics GmbH,Ettlingen,Germany)along with the QUANT option of the OPUS software(Conzen 2001)followed the description in Gruselle and Bauhus(2010).
The total number of samples used for model development is displayed in Table 2.
The best NIRS prediction model for each parameter was identified according to the highest coefficient of determination(R2)and the lowest root mean square error of prediction (RMSEP;Table 2).To evaluate the prediction quality of NIRS models,the statistical parameters R2and the ratio of performance to deviation(RPD=ratio of standard error of prediction to standard deviation)were used.The usefulness of these statistical parameters to characterize the quality of NIRS models has been discussed controversially(Chang et al.2001;Williams 2001;Malley et al.2004;Zornoza et al.2008).Especially for soil analysis,high values for RPD and R2are rarely achieved(Malley et al.2004).To judge our RPD and R2values,we followed the classification suggested by Malley et al.(2004),who provided an overview and summary on this topic.We applied the following 4 levels to classify model quality:
· Level A:R2>0.95 and RPD>4,excellent calibrations,usable for all applications
·Level B:R2between 0.90 and 0.95,RPD between 3 and 4,successful calibrations usable for most applications with some caution,e.g.quality assurance
·Level C:R2between 0.80 and 0.90,RPD between 2.25 and 3.00,moderately successful calibrations,usable with caution,e.g.research
·Level D:R2between 0.70 and 0.80,RPD between 1.75 and 2.25,moderately useful calibrations,usable for screening of samples
Data analysis
To calculate mass loss,mean dry density from gravimetric density assessment was used if available.Otherwise we used mean dry density based on drill resistance.For each measurement position,the volume of the stem disc represented by this position was calculated based on formula 1:

Original dry mass of undecayed wood of the three tree species was calculated based on the original diameter and dry densities provided in the literature(Trendelenburg and Mayer-Wegelin 1964).Reference values for dry density(g·cm?3)were a)for F.sylvatica:Lot:0.65,all other sites:0.68;b)for P.abies:Lot:0.4,Kib:0.46,all other sites:0.43;c)for P.sylvestris:Kib>40 cm:0.45,all other sites and diameter classes:0.49(see also Herrmann et al.2015 for further details).
If the original diameter was different from the current diameter(i.e.bark and/or(sap)wood was already decomposed),it was reconstructed based on the thickness of intact parts on the same log.
Statistical analysis
Statistical analyses were conducted using SPSSStatistics 17.0(SPSS Inc.,Chicago,IL,USA)and R(R Development Core Team).All significance testing was done with p<0.05.The analysis for even distribution of the residuals was conducted graphically via normal qq-plot and scatter plot(residuals vs.predicted values;and vs.fitted values (linear regression model)),as well as via Kolmogorov-Smirnov tests(Dormann and Kühn 2009).A transformation(usually ln or log)was conducted,if residuals were not evenly distributed.This was done for all elements,except for amounts of C and lignin.We used log10 for transformation in the case of C/N and N/P ratios as well as for C concentration.Concentrations of K,Mg and lignin as well as amounts of N(for comparison between species)S,K,Mg,Ca and Mn were ln transformed,while concentrations of Pand Ca as well as amounts of N(for comparison at the species level between the different decomposition times)and P were square root transformed.
A one-way ANOVA followed by LSD or Dunnett T3 post-hoc test(if variances were not homogenous)wasconducted to test for differences in nutrient concentrations and amounts between the three species and(at the species level)between the different periods for which logs had undergone decomposition.The influence of substrate-specific(tree species,diameter class,decay stage)and environmental variables(site)on nutrient concentrations and amounts remaining after different periods of decomposition in the field was analyzed based on a linear mixed-effects model.To decide if a model was better than a previous model,we used the explained variation(R2)and the AIC as 1st and 2nd criteria.Eta squared was used as an effect size measure.
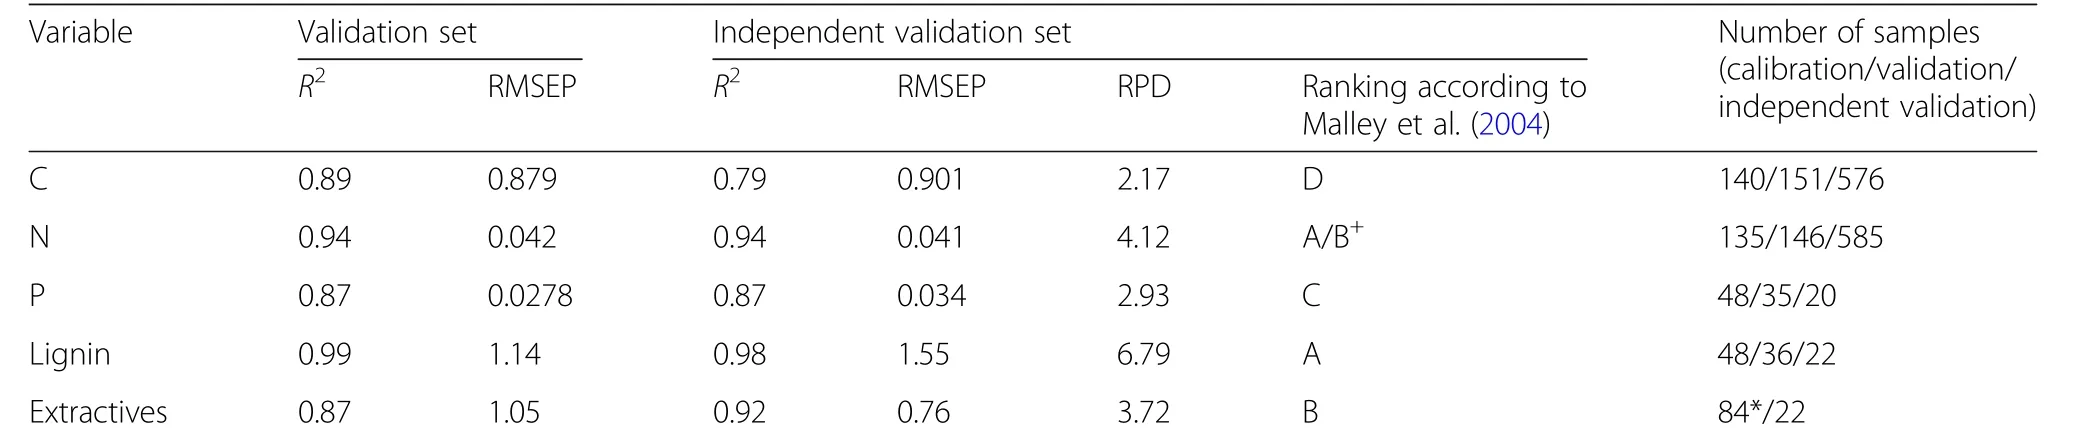
Table 2 Validation and independent validation statistics as well as number of samples used for NIRSmodel development
Results
Prediction of chemical composition of CWD with NIRS
Strong correlations were found between predicted and true valuesfor C,N,P,lignin and extractives(Table 2).According to the classification system by Malley et al.(2004),the model quality varied between level A for lignin and level D for carbon concentration(Table 2).Importantly,the models were of sufficient quality for lignin and extractives,which could be determined in the conventional,wet-chemical way only for a small number of samples.
Element concentrations and amounts in CWD
Carbon concentrations(%)were significantly higher in CWD of spruce and pine than in beech(p<0.001;Fig.1,Table 3),whereas no significant differencebetween spruce and pine was observed.Carbon concentrations increased significantly with advancing decomposition for all three species(p<0.01;Fig.1,Table 3)and were mainly influenced by tree species(35%),decomposition time(11.8%)and diameter(2.5%),which,together with a random factor(consisting of site and log;12.9%),explained 62.3%of the total variation(Table 6 in Appendix).If we subtract the random factor,which cannot be predicted,49.4%of the variation in C concentration may be predicted for the tree speciesinvestigated here.
In contrast,the amount of C decreased in all tree species relative to the initial value and parallel to mass loss(Fig.3)and was mainly influenced by decomposition time(36.4%)and log diameter(21.1%).Together with the interactive effect of decomposition time and tree species(5.9%)and tree species as a single factor(2.4%)about 74.3%of the total variation could be explained(Table 7 in Appendix).Excluding the random factor of 8.5%(Table 7 in Appendix),65.8%of the variation in C quantities in CWD logs may be predicted.
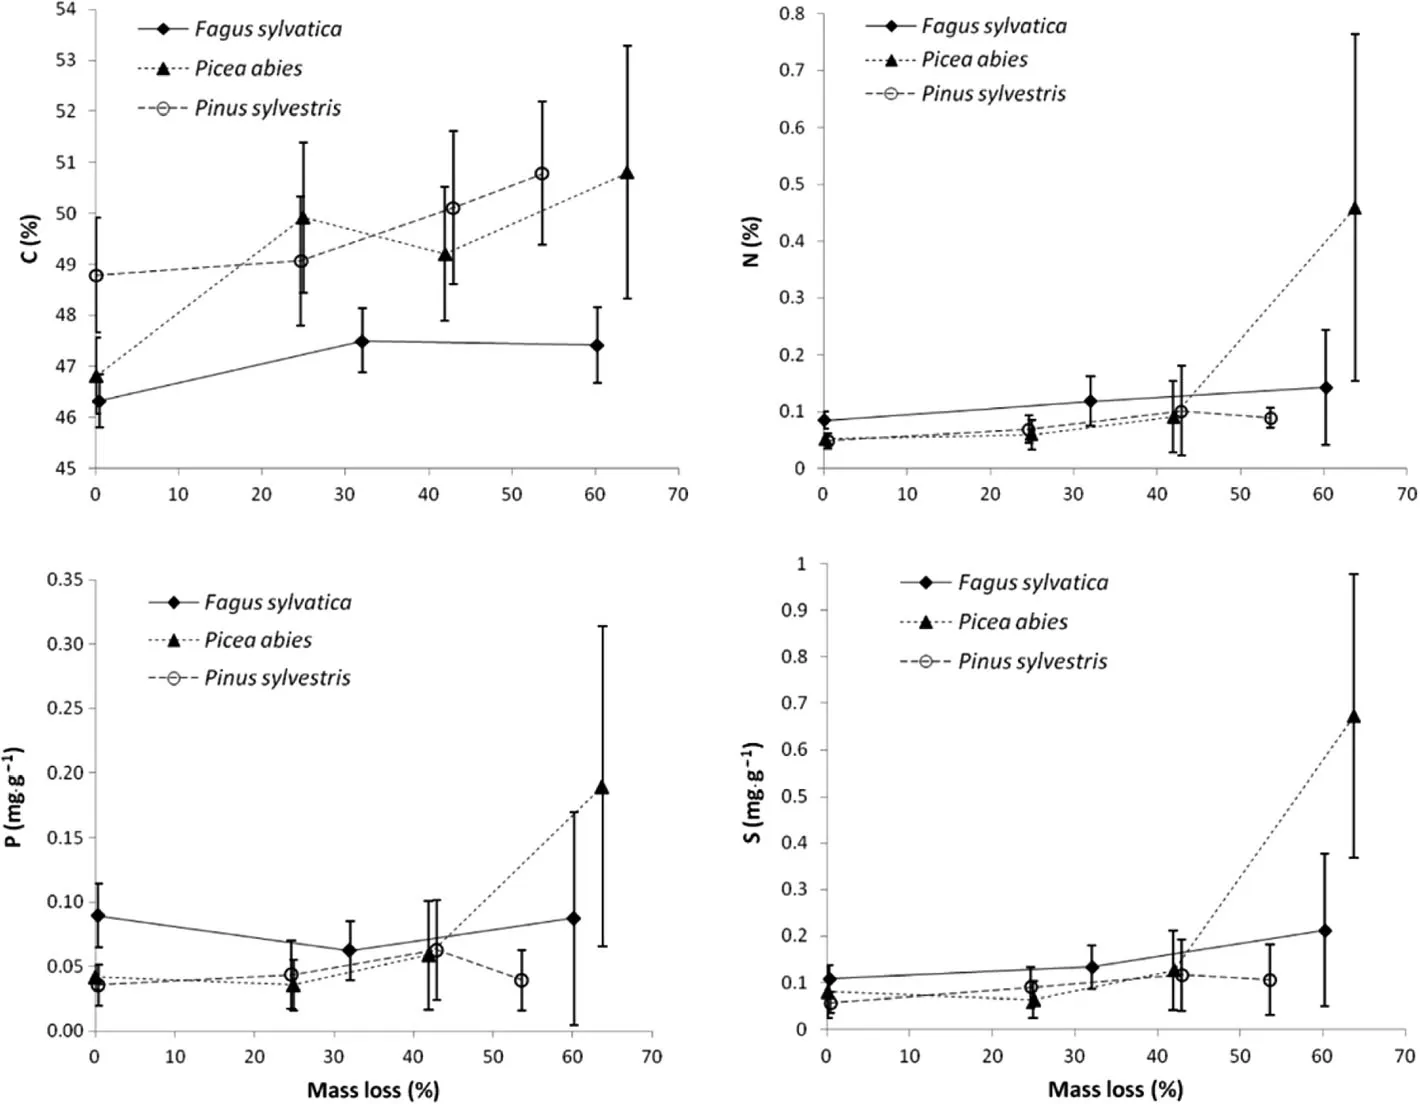
Fig.1 Concentrations of C,N,Pand S(mean and corresponding standard deviation)in decaying log segments of Fagussylvatica,Picea abies and Pinus sylvestris in relation to mass loss;2nd symbol at 8 years,3rd symbol at 18 years,4th symbol at 36 years
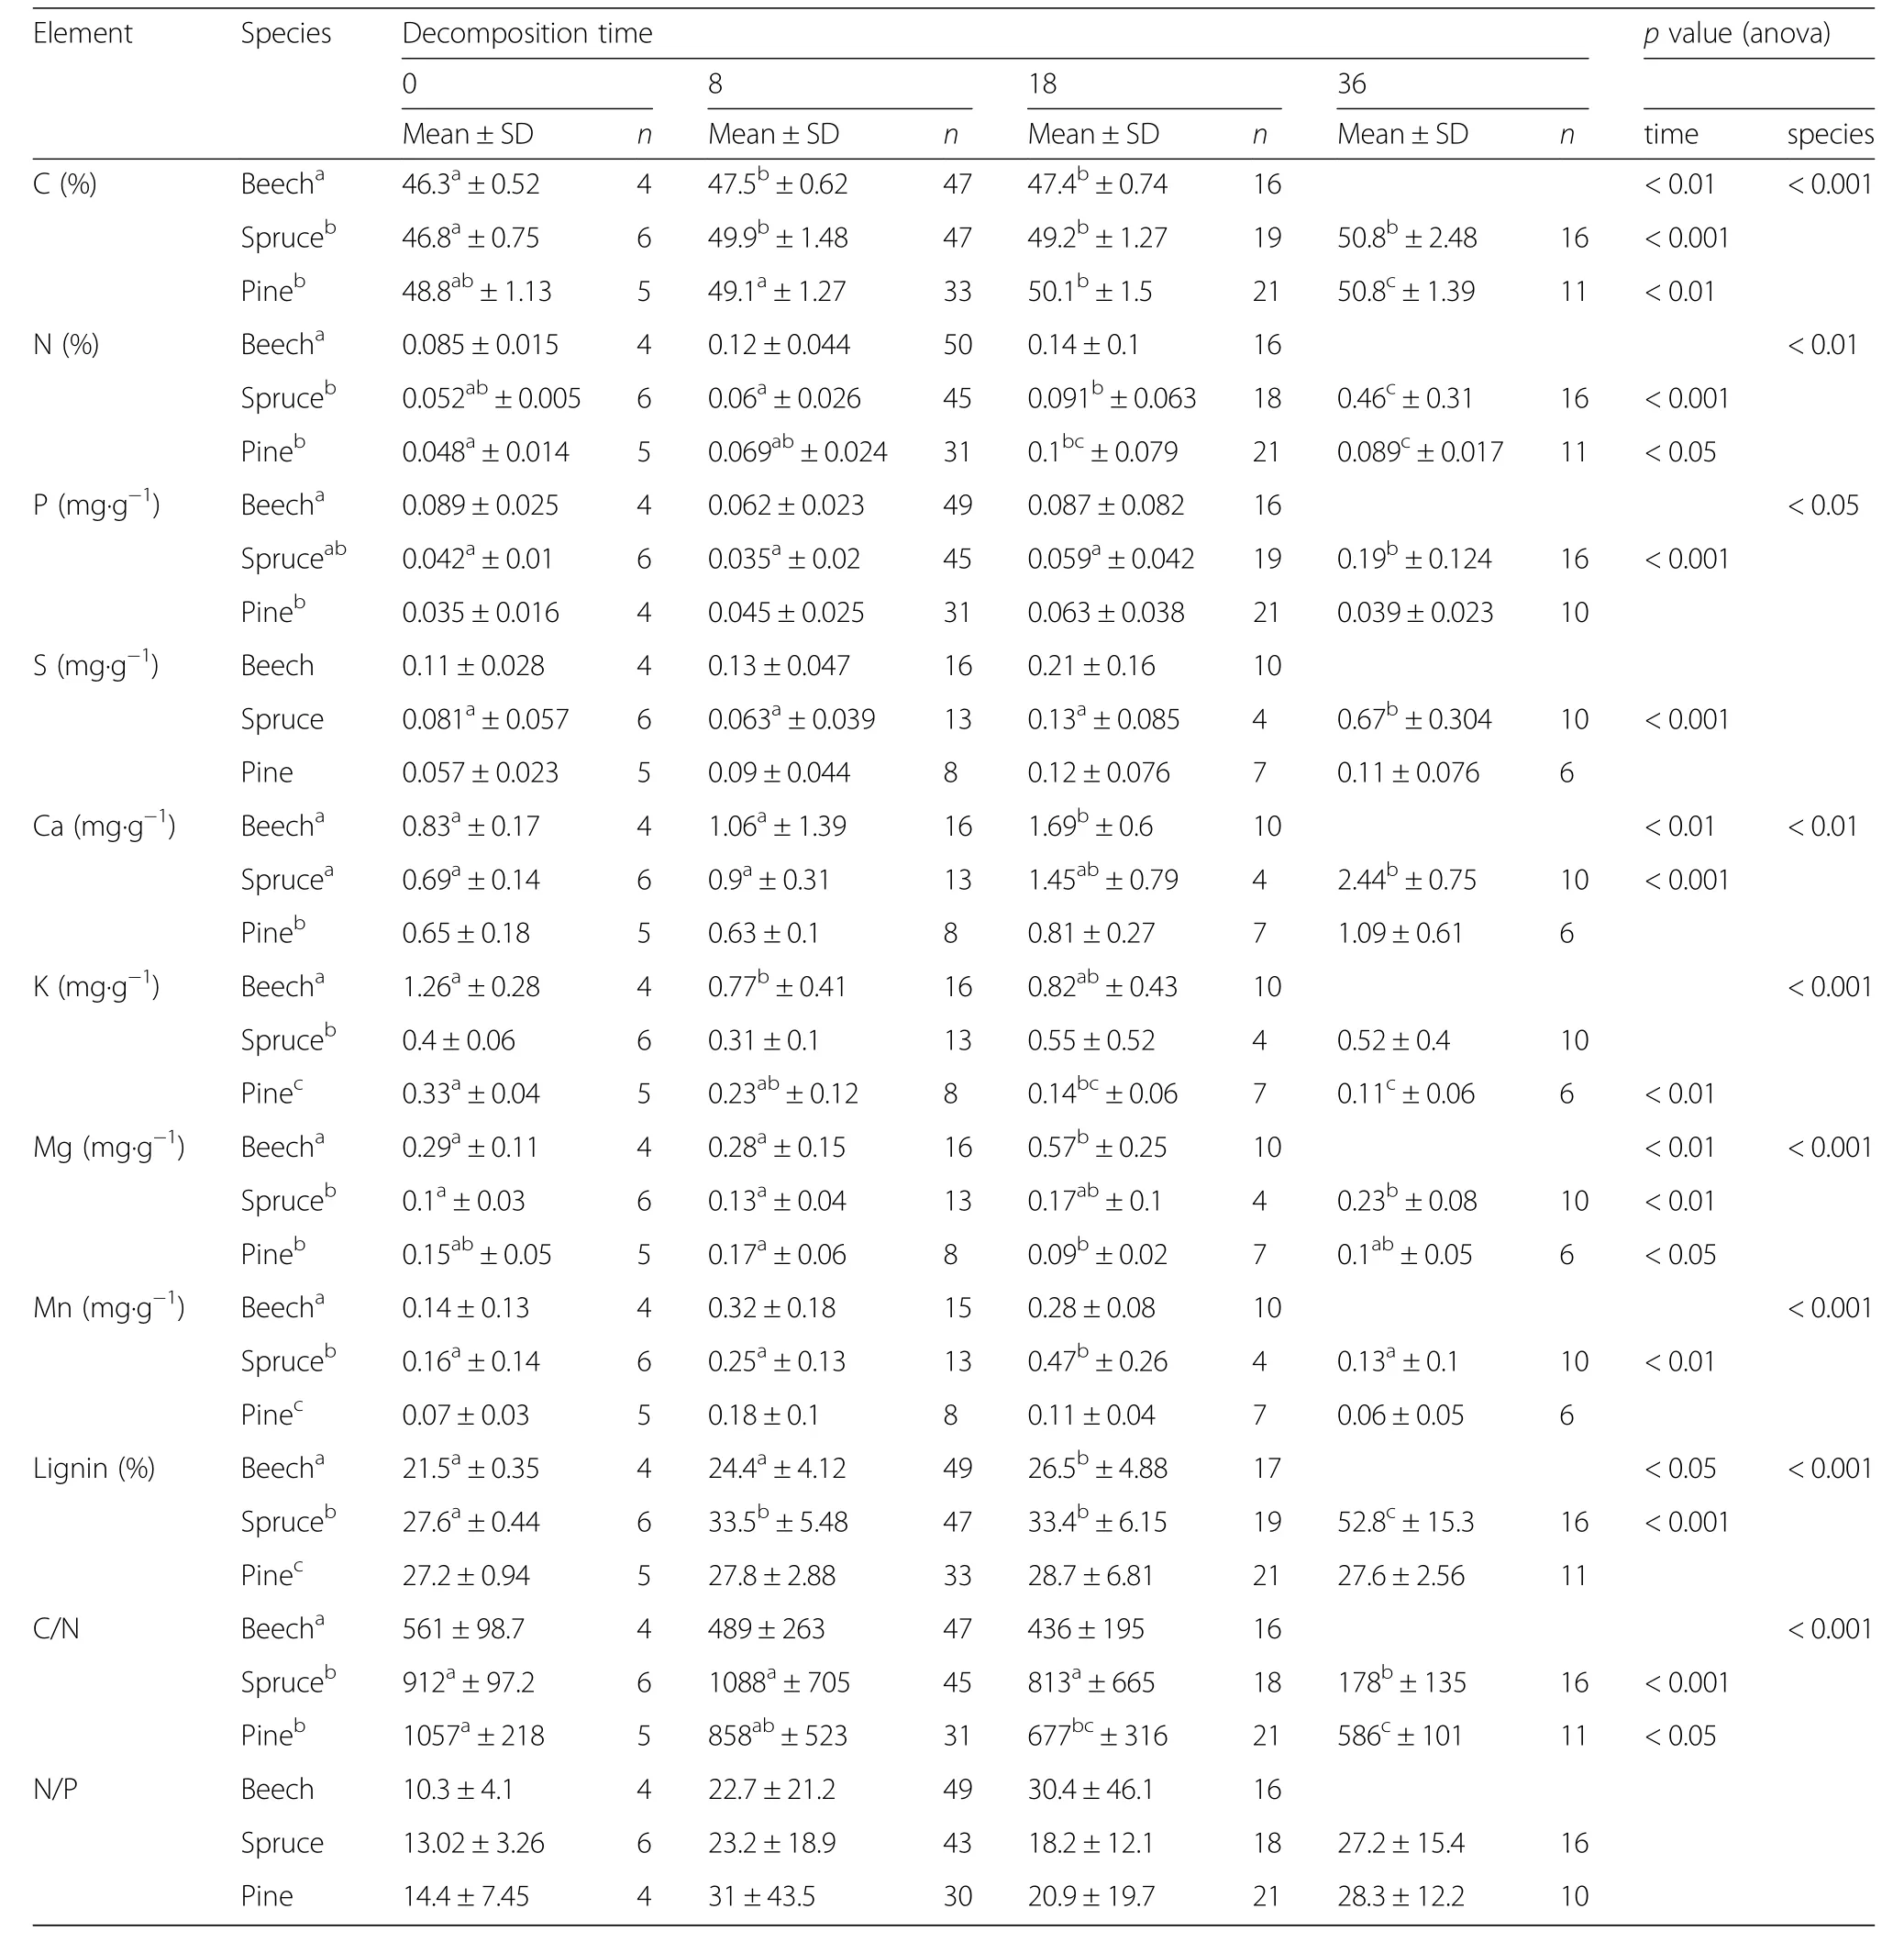
Table 3 Concentrations of C,N,P,S,Ca,K,Mg,Mn and Lignin(%and mg·g?1)as well as C/Nand N/Pratio,mean ± standard deviation(SD),in log segments of Fagussylvatica,Picea abies and Pinussylvestris;mass loss at 8 years:32%,24.9%and 24.6%,18 years:60.2%,41.9%and 42.9%,and 36 years:63.8%and 53.6%for beech,spruce and pine respectively;small values indicate significant difference(p<0.05)between species as well as between periods of decomposition;n=number of samples
While the concentrations of most nutrients increased significantly over the course of decomposition,in particular for spruce between 18 and 36 years(42%and 64%mass loss),concentration of K decreased significantly in pine and beech logs(Figs.1 and 2,Table 3).The K concentrations in spruce logs remained more or less constant and tended to increase with high variability from 8 years(25%mass loss)onwards to about 30%above the initial concentration at 36 years.Nutrient concentrations(N,P,S and Ca)were generally highest in highly decomposed spruce CWD at 36 years corresponding with 64%mass loss(Figs.1 and 2,Table 3),whereas the concentration of Mn was highest in spruce CWD at 18 years and that of Mg in beech CWD at 18 years corresponding with 42%and 60%mass loss,respectively.Concentrations of Mn were highest at early and intermediate decomposition stages(Fig.2,Table 3).
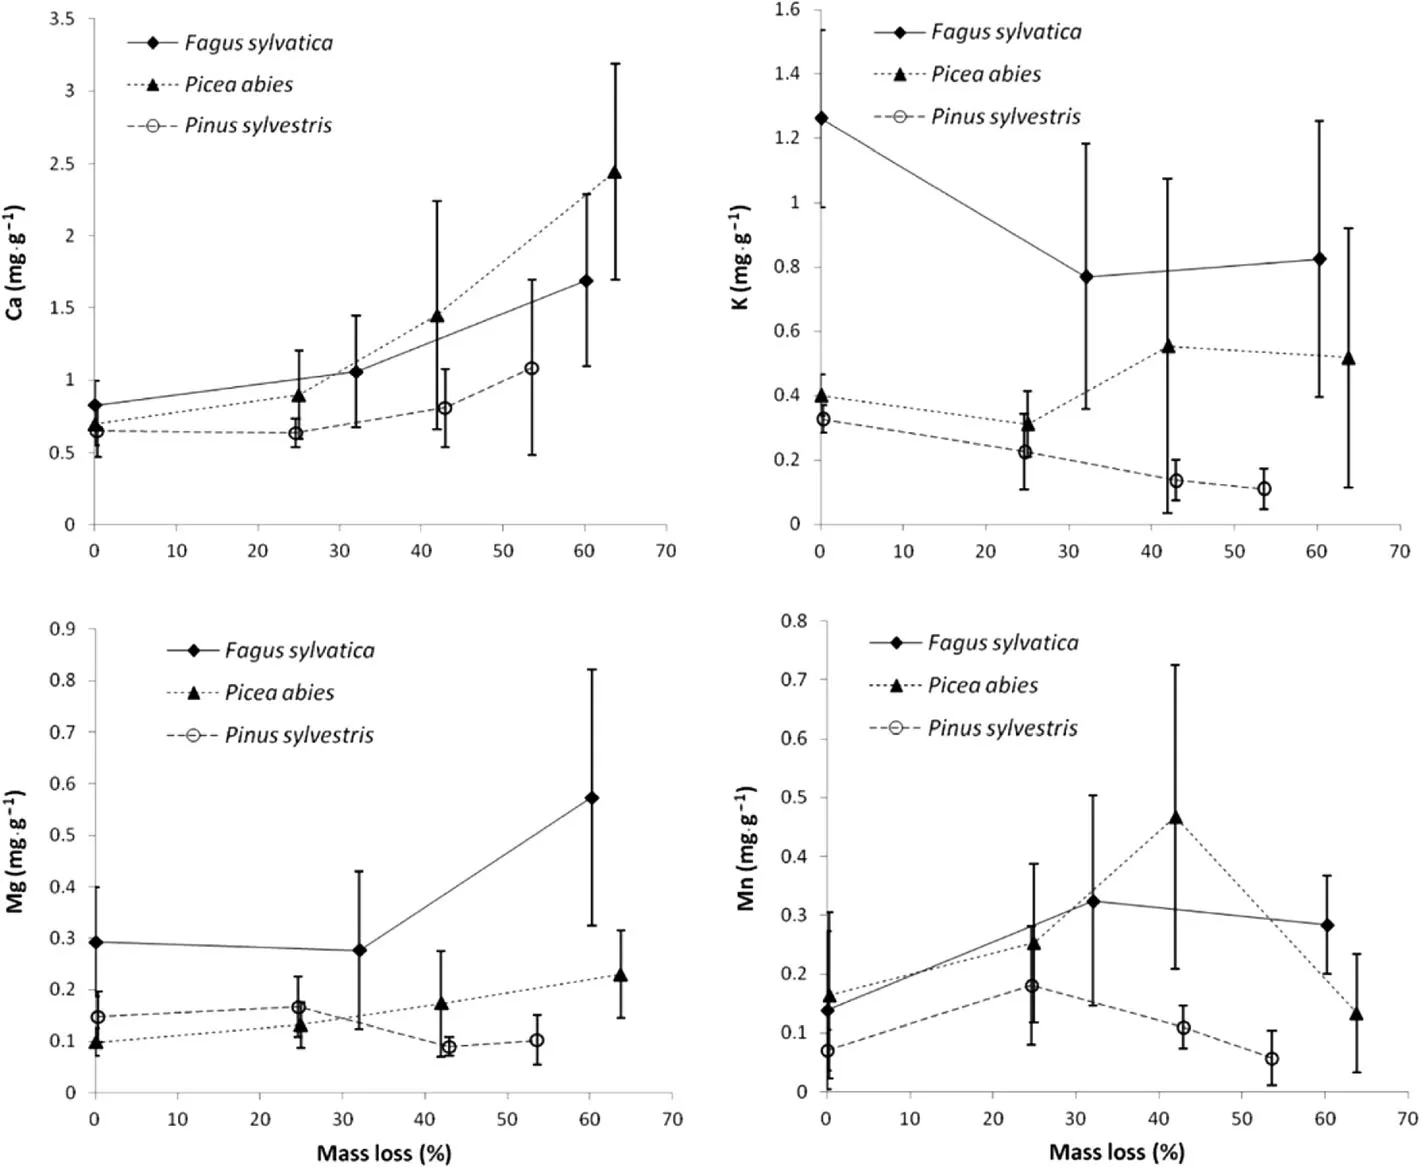
Fig.2 Concentrations of Ca,K,Mg and Mn(mean and corresponding standard deviation)in decaying log segmentsof Fagussylvatica,Picea abies and Pinussylvestris in relation to mass loss;2nd symbol at 8 years,3rd symbol at 18 years,4th symbol at 36 years
The total explained variation in statistical models for nutrient concentrations varied between 42%(P)and 79%(Mn;Table 7 in Appendix).The most important fixed factors were tree species and decomposition time.Tree species was the most important variable in models for N and K,while decomposition time was most important in models for concentrations of S,Ca and Mn.The interaction between tree species and decomposition time was the most important fixed factor in the case of Pand Mg.The random effect of site and log explained between 0(S)and 46.7%(Mn)of the total variation.If we subtract the random factor,between 32.1%(P)and 66.3%(Ca)of the variation may be predicted(Table 6 in Appendix).
In contrast to nutrient concentrations,the amounts of most nutrients remained constant or decreased over the course of decomposition or,in the case of spruce,increased in the latest decomposition stage(Figs.3 and 4,Table 4).This increase was significant only for N,Pand S(Table 4).In contrast,the quantities of K decreased significantly for beech and pine,whereas an intermittent increase of about 25%relative to initial values was observed between 25%and 42%mass loss in spruce(Fig.4,Table 4).Similar to K,amounts of N(although less pronounced)and P decreased significantly in CWD of beech.Until 60%mass loss,33%,73%and 79%of the initial amounts of N,Pand K in beech CWD were lost.Average nutrient quantities(in%of initial values)were generally highest in spruce CWD,where the highest amountsof N,P,Sand Cawereobserved at 36 years and the highest amounts of K and Mn at 18 years of decomposition(Figs.3 and 4,Table 4).Nutrient quantities were mainly influenced by the interaction of decomposition time and tree species,whereastree speciesasa singlefactor was most important in the case of Ca and decomposition time as a single factor was most important in the case of K.However,the interactive effect of diameter and tree species was the most important fixed factor for Mg.Most of the variation in nutrient quantities could be explained for Mg(85.8%)and least for N(28.6%).Between 11.7%(Mg)and 62.8%(S)of the variation could be predicted excluding the random factor in statistical models(Table 7 in Appendix).
The C/N ratio in CWD decreased significantly for spruce and pine and tended to decrease for beech(Fig.5,Table 3).The strongest decrease was observed for spruce from C/N ratios between 912 and 1088 at 0 and 8 yearsto values of 813 and 178 at 18 and 36 years,when 42%and 64%of mass were lost,respectively.In contrast,the N/P ratio was highly variable and tended to increase in all tree speciestowards a similar level of about 30(Fig.5,Table 3).
Lignin concentrations increased significantly over the course of dead wood decomposition in spruce and beech logs and remained constant in pine(Fig.6,Table 3).In contrast,the amount of lignin decreased in all tree species,but remained constant between 18 and 36 years of decomposition for spruce(Fig.6,Table 4).The highest proportion of the variation in lignin concentrations and amounts could be explained by the variables decomposition time and tree species as well as the interactive effect between these two factors(Table 8 in Appendix).The model for lignin concentrations was substantially better than that for lignin amount.
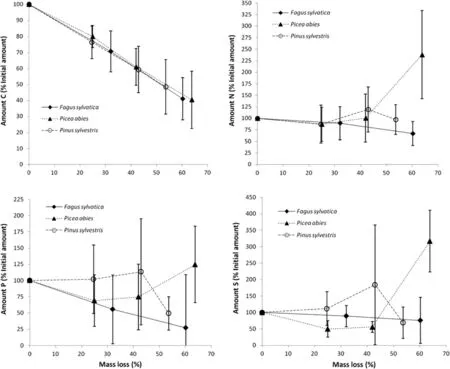
Fig.3 Amounts of C,N,Pand S(mean and corresponding standard deviation)in decaying log segmentsof Fagussylvatica,Picea abies and Pinus sylvestris in relation to mass loss;2nd symbol at 8 years,3rd symbol at 18 years,4th symbol at 36 years
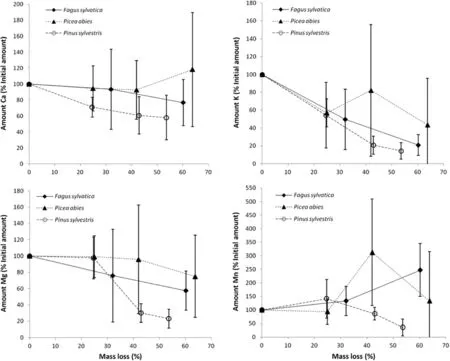
Fig.4 Amounts of Ca,K,Mg and Mn(mean and corresponding standard deviation)in decaying log segments of Fagussylvatica,Picea abies and Pinus sylvestris in relation to mass loss;2nd symbol at 8 years,3rd symbol at 18 years,4th symbol at 36 years
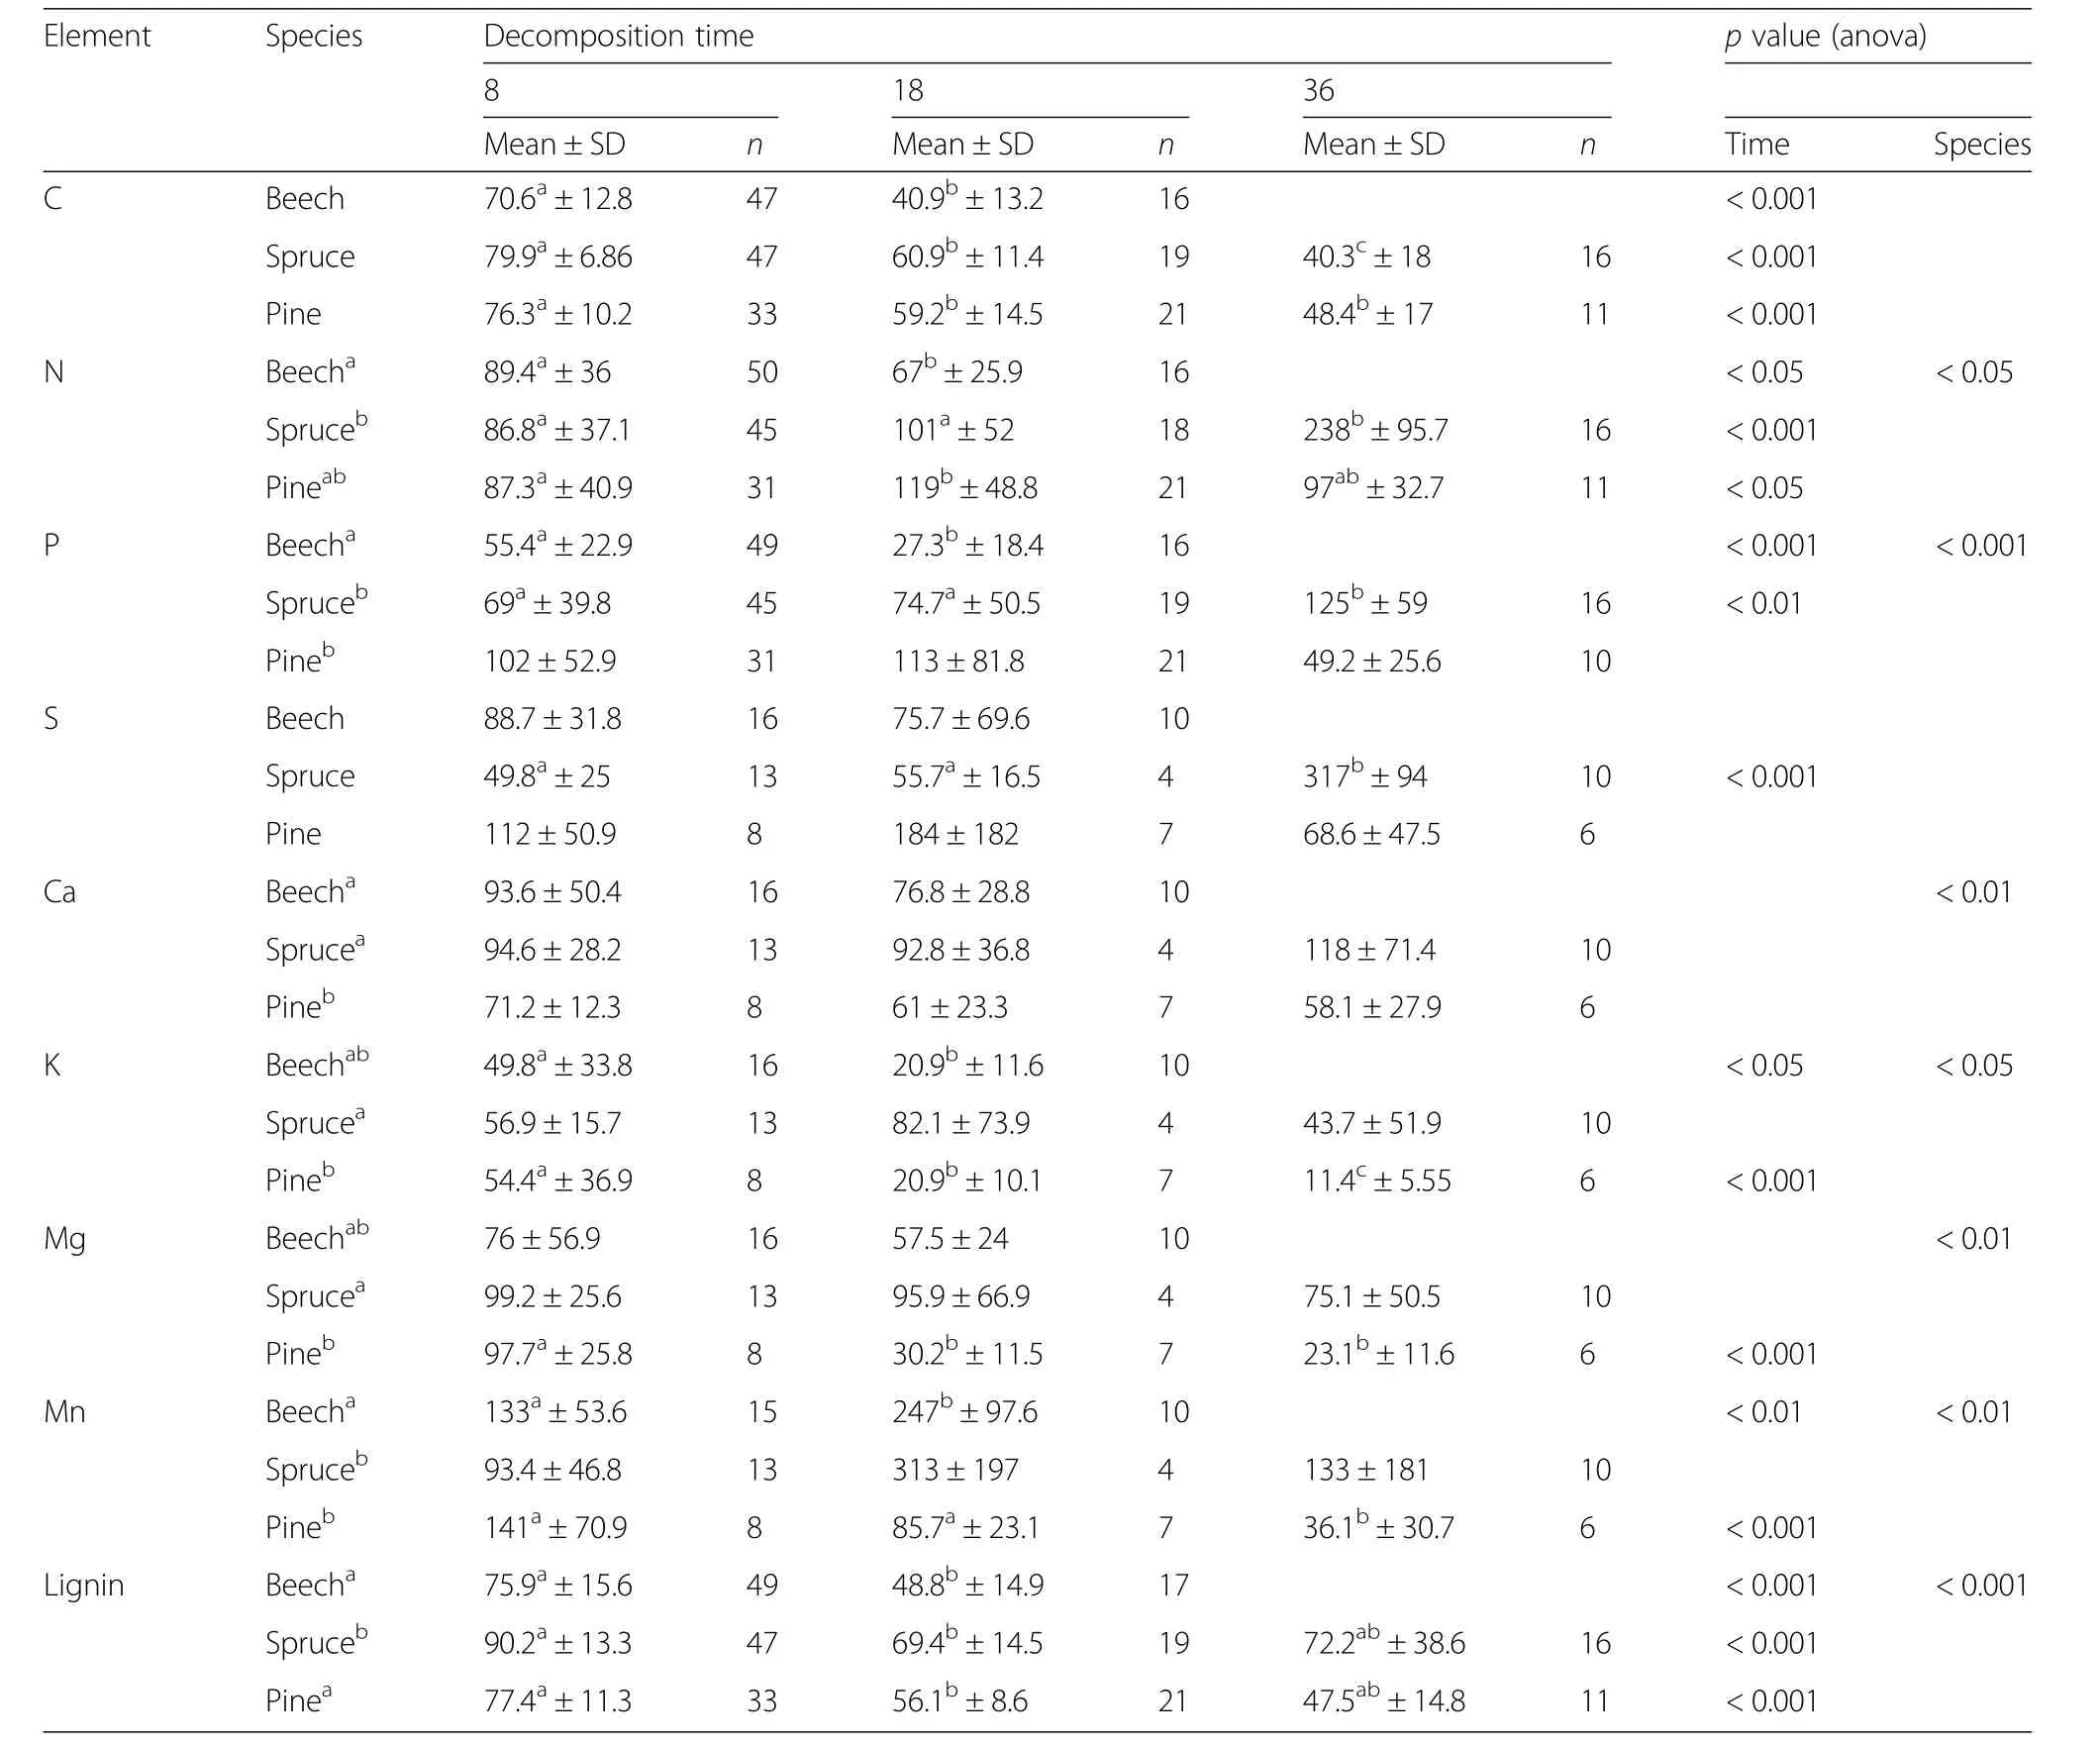
Table 4 Amounts of C,N,P,S,Ca,K,Mg,Mn and Lignin(%Initial amount),mean±standard deviation(SD)in log segments of Fagussylvatica,Picea abies and Pinussylvestris;mass loss at 8 years:32%,24.9%and 24.6%,18 years:60.2%,41.9%and 42.9%,and 36 years:63.8%and 53.6%for beech,spruce and pine respectively;small values indicate significant difference(p<0.05)between species as well as between periods of decomposition.n=number of samples
Discussion
NIRS
Our results demonstrate that concentrations of C,the nutrients N and P and the organic constituents lignin and extractives in dead wood can be predicted with NIRS.However,the predictive quality varied according to the specific range of each variable and the amount of samples available for calibration and validation.High predictive power,i.e.level A-B,was achieved for N,where a high number of samples was available for model development.Whereas the amount of samples was also high for C,the specific value range was very restricted with 95%of the measured C concentrations between 48.8%and 49.3%and a difference between the minimum and maximum C concentration of only 9%.Owing to this problem,the predictive quality was only level D.Despite a low amount of samples excellent NIRS-models could be developed for lignin(level A).
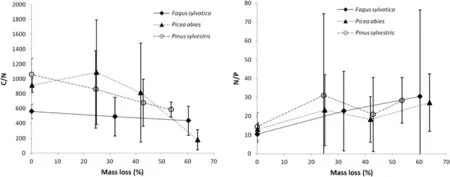
Fig.5 C/Nand N/Pratio(mean and corresponding standard deviation)in decaying log segmentsof Fagussylvatica,Picea abies and Pinussylvestris in relation to massloss;2nd symbol at 8 years,3rd symbol at 18 years,4th symbol at 36 years
In other studies,R2values of NIRS models for lignin varied between 0.67(Poke and Raymond 2006)and 0.99(Poke et al.2004),while for extractives R2values between 0.85(Kelley et al.2004;Via et al.2014)and 0.89(Poke et al.2004)were found.Differences in results between these studies can be mainly attributed to ground wood vs.sound wood - with generally higher correlation coefficients for ground wood.Further influencing factors were tree species and type of wood(hardwood vs.softwood;Poke and Raymond 2006).The lower R2values for extractives relative to lignin observed in our study are consistent with findings in the literature.Extractives comprise of a range of non-structural compounds that are soluble in organic solvents and water.Therefore,prediction of extractives from the NIR spectra can be expected to be moredifficult(Poke and Raymond 2006).Our results for the prediction of C,N and Pconcentrations were comparable to those found in other studies(Gillon et al.1999;Chodak et al.2002;Gruselle 2010),except for C concentrations.However,in other studies the difference between minimum and maximum C concentration varied between 25%(Gillon et al.1999)and 32%(Chodak et al.2002)and high R2values between 0.96(Gruselle 2010)and 0.99(Gillon et al.1999)were achieved.In comparison to N,the predictive quality was lower for P also in other studies(Gillon et al.1999;Chodak et al.2002;Gruselle 2010);probably because P,like other minerals,does not absorb energy in the near-infrared region.Its prediction relies on the secondary correlation with components that can be measured by NIRS(Gillon et al.1999).
Element concentrations and amounts in CWD
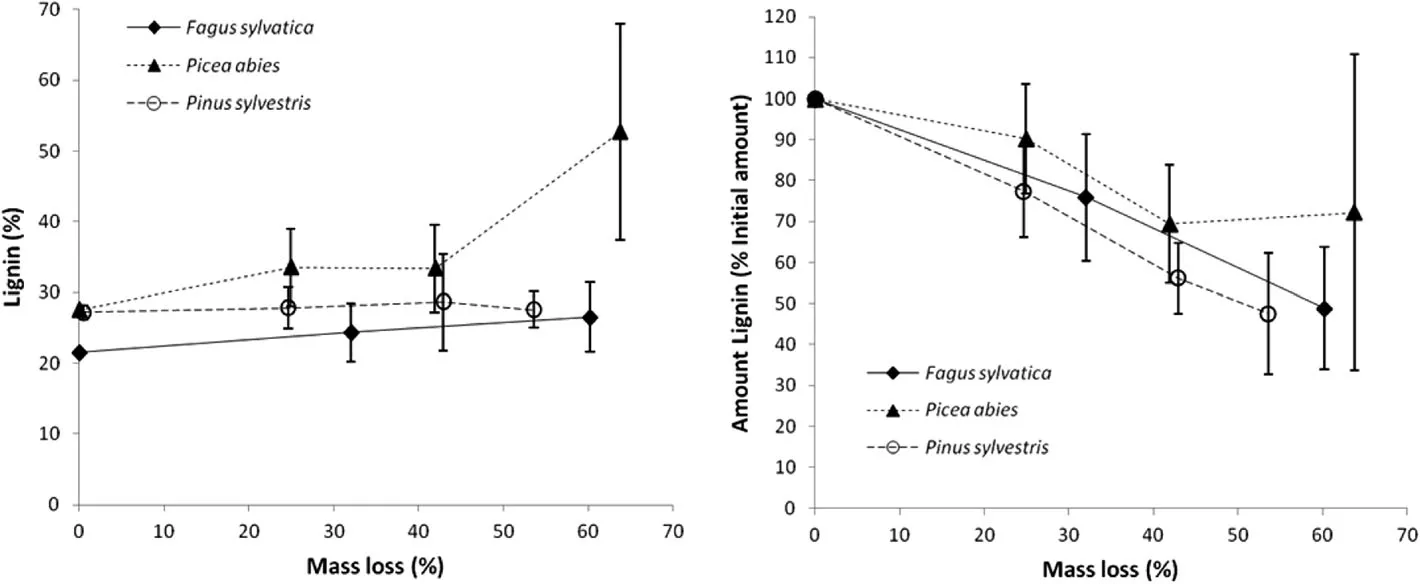
Fig.6 Concentration(%)and amount(%initial amount)of Lignin(mean and corresponding standard deviation)in decaying log segments of Fagus sylvatica,Picea abies and Pinus sylvestris in relation to massloss;2nd symbol at 8 years,3rd symbol at 18 years,4th symbol at 36 years
C concentration in CWD of spruce and pine was significantly higher than in beech,reflecting the higher C concentration in undecomposed wood of gymnosperms when compared to angiosperms(Thomas and Martin 2012).With advancing decomposition,a slight increase in Cconcentration was observed for all three species.This result was also found by Müller-Using and Bartsch(2007)for beech.This change is probably driven by an increase of lignin and a decrease in cellulose,as lignin has a higher proportion of C than cellulose(see also Müller-Using 2005;Herrmann et al.2015).Other studies that followed C concentrations in beech CWD across different decomposition stages observed no changes(Christensen and Vesterdal 2003)or a decrease for the latest decomposition stage(Kraigher et al.2003;ódor and Standovár,2003).For spruce,increasing C concentrations with ongoing decomposition were also observed in other studies(Kahl 2003;Bütler et al.2007).As a consequence of the differences in density of sound wood among these species,more Cis stored per unit of CWD in beech than in spruce and pine.For example,according to our study,3.4 m3·ha?1beech CWD–the average volume of downed deciduous CWD in Germany(BMEL 2014)–would be equivalent to 739 kg C·ha?1(217 kg C·m?3).In contrast,in 5.9 m3·ha?1spruce CWD–the average volume of downed coniferous CWD – 958 kg C·ha?1(162 kg C·m?3)would be stored.
We observed an increase in nutrient concentrations with ongoing decomposition for most elements,except for K which decreased in beech and pine and remained more or less constant in spruce.K concentrations of all three species seem to stabilise at different levels from about 40%mass loss onwards.K has been found to be a very mobile cation,which decreases(due to leaching)already early in the decomposition process of dead wood(Lambert et al.1980;Means et al.1992;Holub et al.2001)and leaf litter(Gruselle 2010).In contrast,a significant increasein K concentration of spruce CWD was observed in a study that investigated nutrient dynamics in CWD in the boreal forests of Russia(Krankina et al.1999).The observed stabilisation and increase in K concentration during later stages of decomposition was also found in a meta-analysis of different North-American studies(Laiho and Prescott 2004)and might be explained by the fact that K(like Mg)is an important macronutrient for fungal growth,primarily needed asan enzyme cofactor(Kavanagh 2011).
Generally,we observed the largest increase in nutrient concentrations in CWD of spruce between 42%and 64%mass loss,which might also be related to the more advanced decomposition in CWD of spruce,in particular when compared to pine.In other studies,similar concentration increases have been found also for highly decomposed pine(Krankina et al.1999)and beech CWD(Christensen and Vesterdal 2003;Kraigher et al.2003;ódor and Standovár,2003;Müller-Using and Bartsch 2007).In the study by Müller-Using and Bartsch(2007),an increase in nutrient concentrations,i.e.N and P occurred between 61%and 80%mass loss(corresponding to 12 and 28 years of decomposition time;Müller-Using and Bartsch 2009).For comparison,the maximum mass loss of beech CWD in our study was 60%at 18 years of decomposition.In contrast to our study and the one by Müller-Using and Bartsch(2007),nutrient concentrations(N,P,Sand K)in beech logs were at least twice as high at the study-sites of the ‘Nat-Man-project’(Christensen and Vesterdal 2003;ódor and Standovár,2003;Kraigher et al.2003),pointing to differences in site conditions.In contrast to our studysites and the one by Müller-Using and Bartsch(2007),which were mainly on acidic soils,the study-sites of the‘Nat-Man-project’were on calcareous soils.According to Laiho and Prescott(2004),the N and P storage in CWD depends largely on the initial N and P concentrations in the wood,which again depend on the tree species and the nutrient status of the site.This is also reflected by our linear mixed-effects model analysis,where most of the variation in nutrient concentrations was explained by tree species.The influence of site and log(i.e.intraspecific variation)was most important only for Mn and P.
The remarkable increase in the concentration of lignin in the case of spruce and the stabilization in the amount of lignin in CWD of spruce after 40%mass loss(18 years of decomposition time),as well as the continuously decrease in the case of beech are most likely the result of the different wood decay types;i.e.brown rot in the case of spruce/pine and white rot in the case of beech(Rayner and Boddy 1988).In the case of brown rot,cellulose and hemicellulose are decomposed completely,while lignin is only partially decomposed;whereas in the case of white rot,cellulose,hemicellulose and lignin are decomposed completely(Rayner and Boddy 1988).Corresponding to the largest increase in the concentrations of C and lignin as well as the most advanced decomposition(i.e.highest mass loss)in spruce,the amounts of N,P,Sand Ca increased markedly after 40%respectively 25%(Ca)mass loss in CWD of spruce,and the C to nutrient ratios(i.e.C:N)decreased as has been found by others(e.g.Boddy and Watkinson 1995;Prescott et al.2017).Thus,in our study,CWD of spruce clearly became a net sink for N,P,Sand Ca in late decomposition stages,whereas the amounts of N,P and K decreased in beech CWD until 60%mass loss and those of Mg and K in pine CWD until 53%mass loss.Similar increases in the amounts of N,P and S,as observed for sprucein our study,werealso found for highly decomposed beech CWD in other studies(Christensen and Vesterdal 2003;Kraigher et al.2003).An accumulation of N and P was observed in a study that investigated decomposition and nutrient dynamicsover 40 yearsin stumpsof Pinussylvestris and Picea abies in southern Finland(Palviainen et al.2010a and b).However,those increases were 23%to 58%lower than in our study.The large variation in nutrient concentrations and remaining amounts observed in our study may be attributable to the low sample size,the different soil types of the study sites,and the occurrence of different fungal species that may have different capacities to translocate nutrients from the soil to the decomposing wood(e.g.Wells et al.1998).Nutrient accumulation and fixation in microbial biomass occurs most likely through nutrient import by fungi,which may occur through 1)contact with soil,2)mobilization through interstitial mycelium,the translocation through mycelium growing from wood through soil,and 3)N fixation by bacteria associated with wood-decaying fungi(Rayner and Boddy 1988;Hoppe et al.2014).Nutrients are released when animals invade,when mycelia interact with other fungi and bacteria,or die(Boddy and Watkinson 1995).Generally,the pattern of nutrient dynamics seems to be similar in CWD of pine and spruce,while reflecting theslower decomposition of pine.
We are aware that decomposition time and site were not independent in our study and that for each category,in particular at 18 and 36 years of decomposition time,site is represented by one single location only.However,as the focus of this study was to assess nutrient dynamics in CWD across different sites,we avoided any site specific interpretation.In addition,climatic parameters such as different temperatures and precipitation at individual sites were found to have only a minor effect on the decomposition process in this temperature and precipitation range(Herrmann et al.2015).
CWD as a net sink or source of nutrients
The role of CWD as a possible nutrient reservoir depends on the amount of CWD(m3·ha?1)and on tree species.Based on a comprehensive study that quantified the nutrient balance of forest ecosystemsof the German federal state Rhineland Palatinate(Wellbrock et al.2014),the amount of nutrients stored in CWD of our study was evaluated.In relation to other ecosystem pools the highest relevance was found for K in beech CWD.Assuming an amount of 20 m3CWD·ha?1(the German and Rhineland Palatinate average;BMEL 2014;Wellbrock et al.2014)and an average mass loss over 18 years of 37%,the proportion of total forest floor K contained in beech CWD would be 9%.For Ca and Mg this proportion would be 4.9%and 3.8%,respectively(median values;Table 9 in Appendix).In contrast,the proportion of total ecosystem K,Ca and Mg contained in dead wood of beech would beonly about 0.9%for K and Mg and 0.8%for Ca(Table 9 in Appendix).Unfortunately,this comparison could not be conducted for spruce and pine forests,because of the extensive liming at such sites in Rhineland Palatinate.In contrast to base cations,the amountsof N and Pin CWD of beech are only of minor importance in relation to other ecosystem pools.The same applies to CWD of spruce and pine except for N in CWD of spruce in advanced stages of decomposition(Table 9 in Appendix).The low relevance of the amounts of N and P in CWD of beech calculated in our study becomes also apparent,when comparing these with reported throughfall deposition rates in German(beech)forests.For example,average throughfall deposition rates for N and Sof 17 and 8 kg·ha?1·a?1respectively,have been measured between 2004 and 2006 at 75 nationwide distributed monitoring sites(MLUR 2009).However,in relation to the total deposition in forests,which can amount to more than 32 kg N·ha?1·a?1and more than 11 kg S·ha?1·a?1(MLUR 2009),the throughfall deposition rates can be regarded as conservative.If we assume an amount of 20 m3·ha?1of beech CWD(the German average;BMEL 2014)and,according to our study,an average content of 0.53 mg·cm?3N and 0.067 mg·cm?3S in dead wood,then the average CWD volume would store an amount of 10.6 kg N and 1.34 kg S,which is less than the quantity received in oneyear through deposition.
Higher N stores in coniferous CWD were measured in a study in the boreal region of Russia(Krankina et al.1999),where dead wood comprised 9.6%of the total aboveground N store in an old-growth spruce forest and 4.1%in a mature pine forest.The amounts of N and P stored in CWD of beech in our study were similar to those found at nutrientrich sites in Denmark(Christensen and Vesterdal 2003),whereastheamount of K wasabout 50%higher in our study.
Similar to our results,the N/Pratio converged towards a similar value across tree species also in the study by Herrmann and Prescott(2008).In contrast to our study,the N/P ratio tended to stabilize at about 19,instead of 30.According to Boddy and Watkinson(1995)the N/P ratio of fungal mycelium is about 14.According to Güsewell and Gessner(2009),the shift from N-limited to P-limited decomposition occurs at litter N/P ratios of 30–50.If this applies also to CWD,the decomposition process in our study would be mostly N limited and approach P limitation,while the one in the study by Herrmann and Prescott(2008)would have been N limited.The increase in N/P ratios with ongoing decomposition might indicate that either more N than P is imported into logs,either through N in the canopy through fall,through N fixation(e.g.Hoppe et al.2014),or through fungal mycelia,or that more P than N is exported from logs.
The higher C/N ratio of coniferous CWD(spruce,pine)relative to deciduous CWD(beech)observed in our study is a result of the generally higher nutrient concentrations in beech CWD.This observation isconsistent with findings in other studies and might be explained by the generally higher nutrient concentration in decomposing deciduous wood relative to coniferous wood(Cornwell et al.2009)as well as by a higher fungal biomass in decomposed deciduous wood(Noll et al.2016).
Except for K(in the case of beech and pine),P(in the case of beech)and Mg(in the case of pine)there is no clear indication that CWD of the three tree species investigated here has yet become a net source of nutrients.Thus,in the initial and intermediate phases of CWD decomposition,there has of yet been no significant net release for most macro-nutrients.Instead,nutrients(N,P,Sand Ca)are still accumulating in spruce CWD after 36 years of decomposition,resp.64%mass loss.Similarly,log segments of lodgepole pine,whitespruce,and subalpine fir continued to gain N and P even after 90%mass loss in three Rocky Mountain coniferous forests(Prescott et al.2017).Based on our analysis,CWD of the three studied tree species may become a significant net source of nutrients only in late stagesof decomposition after two thirdsof itsmassarelost.
Conclusions
Our results demonstrated that NIRScan be used successfully also for the rapid assessment of some chemical properties of decomposing wood of beech,spruce and pine in different stages of decomposition.Therefore,NIRSmay be useful in the assessment of large sample sets also in the field of CWD research.
We found that more C is stored in CWD of beech than in spruce and pine.The consideration of C contents in different decay stages would improve the accurate assessment of C stocks in dead wood,for example for National Greenhouse Gas inventories.
The question,if deadwood is a net source or sink of nutrients clearly depends on tree species and decomposition stage.Whereas CWD of spruce wasa net sink for nutrients such as N,P,Sand Ca even until two thirds of the original mass were lost,nutrient amounts in CWD of beech and pine remained constant(N(in pine),Mg(in beech),Sand Ca(in beech and pine))or decreased(N(in beech),Mg and Mn(in pine),P and K(in beech and pine);net source).CWD of beech became a net sink of nutrients only in the case of Mn.While the role of CWD as a net source or sink of nutrients and its relevance in the ecosystem is thus highly context dependent,it is clear that the widely held assumption that CWD serves as a net source of nutrients applies in its generality only in the long-term.In the short to medium term,CWD can also act as rather constant store or even a net sink of nutrients.
Appendix

Table 5 Year of storm event(i.e.decomposition time)and elevation for the 7 study sites
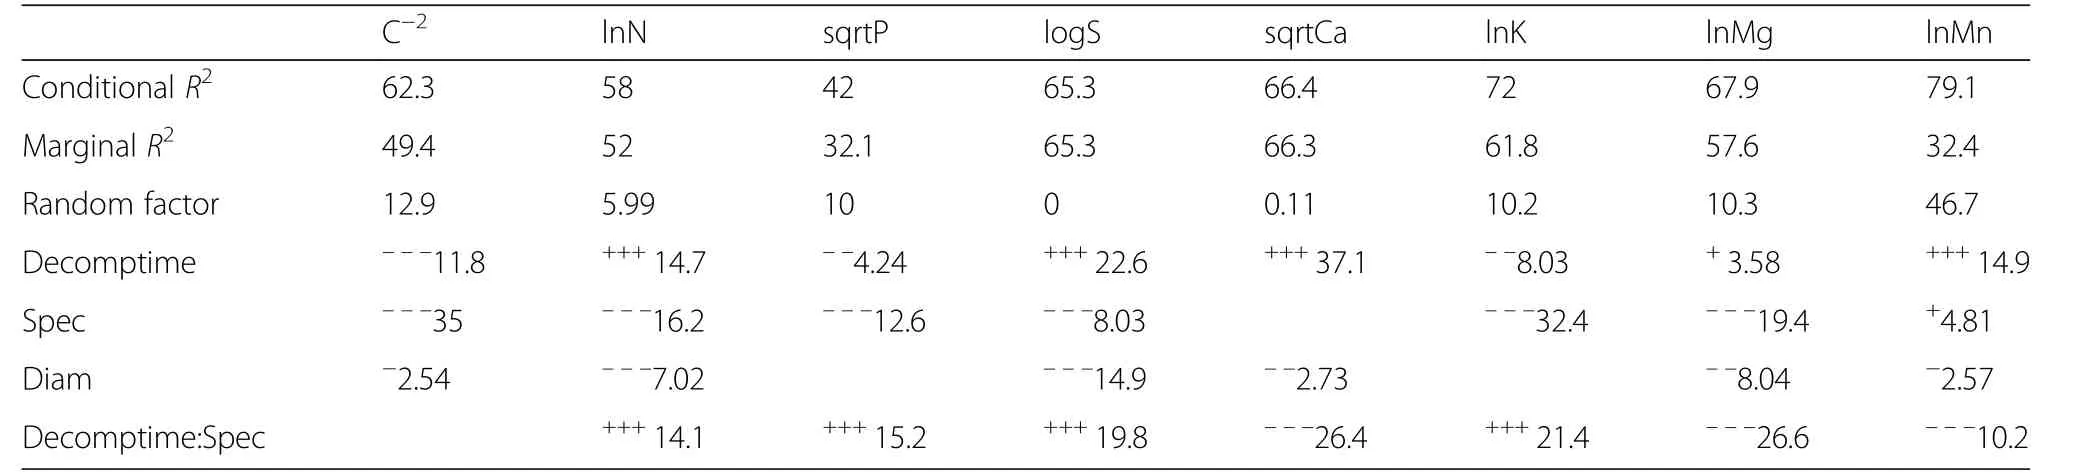
Table 6 Linear mixed-effect modelsto predict the nutrient concentrations(%(C)and mg·g?1)of Fagussylvatica,Picea abies and Pinussylvestris
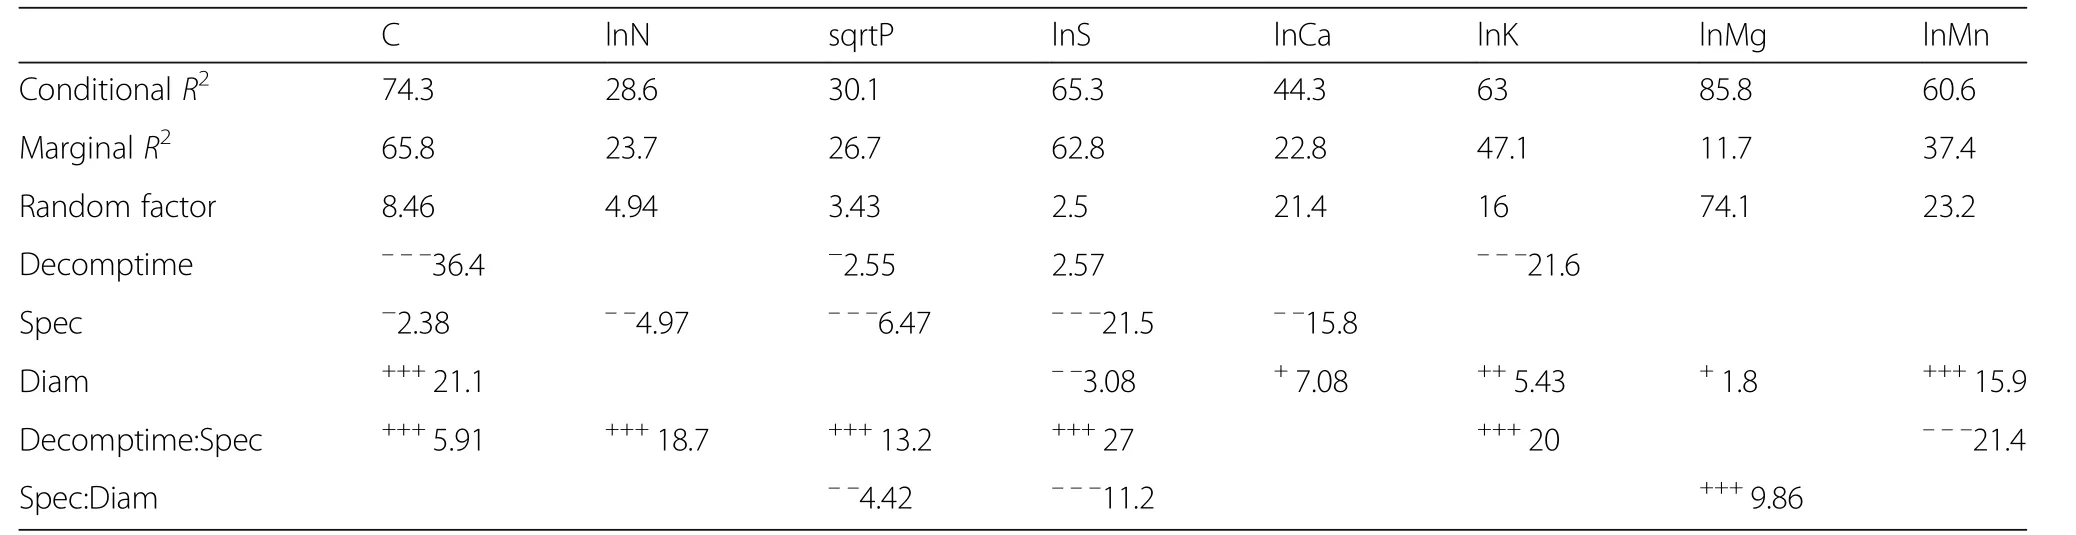
Table 7 Linear mixed-effect modelsto predict the nutrient amounts(%initialamount)of Fagussylvatica,Picea abies and Pinussylvestris
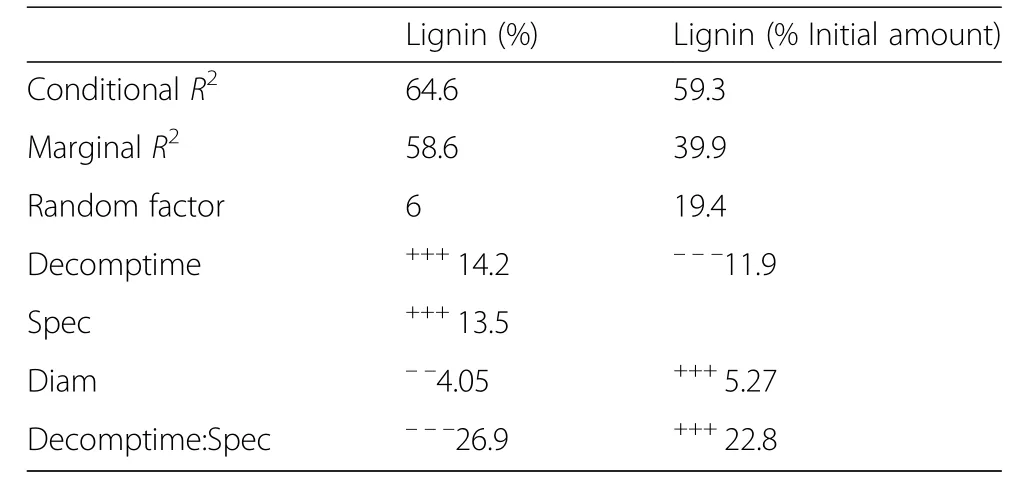
Table 8 Linear mixed-effect models(according to ANOVAtable)to explain lignin concentrations(%)and amounts(%Initialamount)in logsof Fagussylvatica,Picea abies and Pinussylvestris

Table 9 Quantities of nutrients(kg·ha?1;median values)in 20 m3·ha?1 CWDof a)Fagus sylvatica(37%average mass loss),b)Picea abies and c)Pinus sylvestris(33%average mass loss)in relation to other ecosystem pools in forests of Rhineland Palatinate(Wellbrock et al.2014)
Abbreviations
‘Biw‘:‘Bienwald’;‘Fd H’:‘Forêt de Haguenau’;‘Hof’:‘Hofstatt’;‘Kib’:‘Kiekenbruch’;‘Lot’:‘Lotharpfad’;‘Roe’:‘Roettlerwald’;‘Sig’:‘Silbersandgrube’;AIC:Akaike information criterion;ANOVA:analysisof variance;C:carbon;C/N:carbon/nitrogen;C/P:carbon/phosphorous;Ca:calcium;CWD:coarse woody debris;DW:Durbin Watson;F.sylvatica:Fagussylvatica;HNO3:nitric acid;K:potassium;LSD:Least Significant Difference;Mg:magnesium;Mn:manganese;N:nitrogen;NIRS:Near Infrared Reflectance Spectroscopy;NIR-spectra:Near Infrared-spectra;P:phosphorous;P.abies:Picea abies;P.sylvestris:Pinussylvestris;R2:coefficient of determination;RMSEP:root mean squared error of prediction;RPD:ratio of standard error of prediction to standard deviation;S:sulphur
Funding
Thisresearch wasfunded through a grant by the German Science Foundation(DFG-BA 2821/4-1)to J.Bauhus.
Availability of data and materials
Available on request.
Authors’contributions
SHplanned and conducted the study including field sampling and analysis and wrote the majority of the manuscript.JBconceived and guided the study and co-wrote the manuscript.All authors read and approved the final manuscript.
Ethics Approval
Not applicable.
Competing interests
The authors declare that they have no competing interests.
Received:2 January 2018 Accepted:10 April 2018


- Forest Ecosystems的其它文章
- Predicting the provisioning potential of forest ecosystem servicesusing airborne laser scanning data and forest resource maps
- Detecting treeline dynamics in response to climate warming using forest stand maps and Landsat data in a temperate forest
- Species-specific,pan-European diameter increment models based on data of 2.3 million trees
- Drought can favour the growth of small in relation to tall trees in mature stands of Norway spruce and European beech
- Forests,atmospheric water and an uncertain future:the new biology of the global water cycle
- Dendroclimatic analysis of white pine(Pinusstrobus L.)using long-term provenance test sites across eastern North America