
Drought can favour the growth of small in relation to tall trees in mature stands of Norway spruce and European beech
2018-09-12 09:14:46HansPretzschGerhardSchtzeandPeterBiber
Forest Ecosystems 2018年3期
Hans Pretzsch,Gerhard Schütze and Peter Biber
Abstract Background:Climate change triggered many studies showing that trends and events of environmental conditions can reduce but also accelerate growth at the stand and individual tree level.However,it is still rather unknown how climate change modifies the growth partitioning between the trees in forest stands.Methods:Based on long-term girth-tape measurements in mature monospecific and mixed-species stands of Norway spruce(Picea abies(L.)Karst.)and European beech(Fagussylvatica L.)we traced the effect of the severe droughts in 2003 and 2015 from the stand down to the tree level.Results:Stand growth of Norway spruce decreased by about 30%in the once-in-a-century drought 2015,while European beech was much more drought resistant.Water availability generally amplified size-asymmetric growth partitioning.Especially in case of Norway spruce water availability primarily fostered the growth of predominant trees,whereas drought favoured the growth of small trees at the expense of the predominant ones.We could not detect significant differences between mixed and monospecific stands in this regard.Conclusions:The drought-induced reallocation of growth in favour of small trees in case of spruce may result from its isohydric character.We hypothesize that as small trees are shaded,they can benefit from the reduced water consumption of their sun-exposed taller neighbours.In case of beech,as an anisohydric species,tall trees suffer less and smaller trees benefit less under drought.The discussion elaborates the consequences of the water dependent growth allocation for forest monitoring,growth modelling,and silviculture.
Keywords:Growth partitioning,Drought,Competition symmetry,Climate change,Norway spruce,European beech
Key message
Water availability induced size-asymmetric growth partitioning.Drought favoured growth of small trees at the expense of predominant trees.Stand growth share of dominant trees changed with water availability.
Background
The social position of trees in even-aged stands results mainly from the share of contested resources they manage to acquire.It may depend on the availability of the various resources,to what extent predominant trees can benefit from their size and privileged social position and how the resources and growth are distributed among the differently sized trees.Theory(Schwinning and Weiner 1998;Grote et al.2016)and model studies(Hara 1993)consider a wide range from completely symmetric,to sizesymmetric, and strongly size-asymmetric interindividual resource and growth distribution patterns.The resource and growth distribution pattern in a given stand may depend on the environmental conditions,and especially on the prevailing resource limitation.Harsh environments with equal limitations of all resources may result in rather symmetric growth and resource distribution.Limitation by water and nutrient supply may cause a size-proportional,i.e.size symmetric competition.Limitation by light with ample supply of water and nutrients may result in a size-asymmetric competition and over-proportional growth of tall trees compared with small trees(Schwinning and Weiner 1998).Many empirical studies show that latter environment may enable dominant trees to pre-empt light and other resources and cause shading,growth reduction and eventually mortality of their smaller neighbours(Wichmann 2001;Pretzsch et al.2012).The growth partitioning in mainly light-limited environments in temperate forests is rather well explored(Pretzsch and Biber 2010),represented in models(Biging and Dobbertin 1995),and applied for silvicultural prescriptions(Kramer 1988;Pretzsch and Zenner 2017).The growth partitioning under water limited conditions is rather far from being well explored and understood(Martínez-Vilalta et al.2012;Grote et al.2016).However,there are many scientific and practical reasons for deeper exploring it in this study.
Climate change may bring more frequently drought years or even turn many ecosystems from light limitation to water limitation(Bréda et al.2006;del Río et al.2017).As a consequence,the so far assumed size-asymmetric competition and over-proportional growth of tall trees compared with small trees may become more symmetric.The consequences would be far-reaching;they pertain to forest monitoring,modelling aswell as silviculture.
Forest monitoring and inventory is often concentrated or even restricted to dominant trees and assumes their behaviour(e.g.,growth reduction,vitality loss)to be representative for the growth of the whole stand.Suppose the pattern of inter-individual growth partitioning changes with environmental conditions in favour of small or tall trees,then scaling up from dominant trees to the behaviour of the stand growth may become flawed.
Change of growth allocation in favour of small or tall trees can modify the mode of mortality(i.e.the size distribution of the dying trees)and the stand structure.For thinning prescriptions it is important to know to what extent given social tree classes can be smoothly maintained or if they are at risk to become outcompeted.This is especially relevant when structural heterogeneity is among the silvicultural goals.
Modelling individual tree size growth and mortality is mostly based on competition indexes which quantify the local shading or stand density and assume that competition increases and growth decreases with shading and density(Pretzsch et al.2002).This concept assumes that mainly light is pre-empted but implies that other resources are over-proportionally exploited by taller neighbours as well.Suppose primarily taller trees suffer drought stress and smaller trees would even benefit from their subdominant position.Under such circumstances conventional competition indices would at least temporarily misjudge the competitive status,growth,and mortality.
Finally,for goal-oriented silvicultural stand treatment under climate change it is important to know whether drought stress is equal for all trees in a stand or depending on size and social position.Suppose small trees benefit from shading and reduced water consumption of their tall neighbours;thinning from below would be unreasonable as it would eliminate the stabilizing effect of the small trees to whole stand growth.
Various studies analysed the drought reaction at different levels of organisation and found less growth reduction at the level of the whole stand compared to the collective of the dominant trees only(Martín-Benito et al.2008;Jucker et al.2014,2016;Río et al.2017a,b;Wellhausen et al.2017).They suggest that trees of different social positions react differently and maybe small trees can partly compensate for the losses of tall trees and stabilise stand growth under drought.Wichmann(2001)provided evidence for this kind of behaviour on the basis of stem analyses in Sitka spruce.His finding that the relationship between tree size and size growth is steep in moist years and shallow in dry years(temporal variation)corroborates analogous findings on moist compared with dry sites(spatial variation)(Pretzsch 2010).However,previous studies mainly focussed on the tree level(effect on individuals).They hardly quantified the drought effect on the inter-individual growth partitioning and the share of different population fractions at total stand growth(effect on population structure).
This study isbased on an 18-years-lasting monitoring of annual growth by permanently installed girth tapes in mature mono-specific and mixed-species stands of Norway spruce(Picea abies(L.)Karst.)and European beech(Fagus sylvatica L.).As the monitoring period covers both,extremely dry and moist years it provides a rather unique dataset for answering the following three questions:
Q1:How does stand volume growth depend on the water availability?
Q2:How does growth partitioning among trees of different sizes in a stand depend on water availability?
Q3:How does water availability modify the growth dominance and representativeness of tall compared to small trees in a stand?
Methods
Study area and study perio d
The study area Kranzberg Forest is located in Southern Germany,about 35 km in the Northeast of Munich(longitude:11°39′42′′E,latitude:48°25′12′′N,altitude 490 m a.s.l).The average annual precipitation amounts to 750–800 mm per year and to 460–500 mm during the growing season(May–September),both observed in the period 1971–2000.For the same period,the average air temperature is 7.8 °C(annual mean)and 13.8 °C(May–September).The soil is a luvisol originating from loess over Tertiary sediments and provides high nutrient and water supply(Pretzsch et al.1998;G?ttlein et al.2012).Depending on soil depth the water holding capacity for plant available water ranged between 115 and 255 mm,while soil p HH2Ovaried between 4.1 and 5.1.
Field measurements
The 0.5 ha Kranzberg study site was established in 1992 in a 41–61 years old Norway spruce and European beech stand.For the purpose of this study,the Kranzberg site was subdivided into three plots;one plot represents both species growing in mixture,while the others represent monospecific stands of spruce and beech,respectively.The size of the pure Norway spruce and European beech plots was 0.07 and 0.03 ha,respectively,and of the mixed-species plot 0.08 ha.
We measured the stem diameters at breast height(1.3 m),tree heights,and heights to the crown base in 1994,1999,2005,and 2012 with a girth tape and a Vertex height measurement device.In addition,annual diameter growth at breast height was recorded since 1998 with permanent diameter tapes which were equipped with Vernier scales for circumferential recording with 1 mm resolution(UMS,Germany).For further details of measurement and stand characteristics see(Pretzsch et al.1998,2016;H?berle et al.2012;Goisser et al.2016).
In 2016 the tree age within the mixed stand plot was assessed for verification purposes and confirmed with 65±2 years for spruce and 85±4 years for beech.The stand structure has not been disturbed by silvicultural interference since the establishment of the experimental site.Thus,the growth partitioning between the trees represents the natural dynamics under self-thinning conditions.The results of this study can therefore be considered free of confounding effects due to interventions by forest management.
Table 1 shows that Norway spruce and European beech have similar sizes in the mono-specific and mixed stands.Although twenty years older than spruce,European beech is lacking behind in size growth because of its speciesspecific lower and later-culminating course of growth.The range between minimum and maximum values is much lower for Norway spruce than for European beech.While the mean size of beech is generally lower than that of spruce,their maximum values are rather similar.So,the beech population is much more heterogeneous in size including very small but also rather tall trees,whereas Norway spruce shows a much narrower sizerange.
The number of girth tapes mounted in 1998 in the mono-specific stands was n=56 for Norway spruce and n=34 for European beech.The sample size on the mixed-species plots was n=30 and n=45 for Norwayspruce and European beech,respectively.As some trees died in the period 1998–2016 the sample sizes were slightly lower in 2016(see Table 1).

Table 1 Sample sizes and tree dimensions in 2016(last survey)as well as mean annual tree volume growth in 1998–2016 for Norway spruce and European beech in mono-specific and mixed-species stands used for this study
Annual temperature,precipitation,and Martonne index in the study period
For characterizing the water supply for each year we calculated the de Martonne index M(de Martonne 1926)
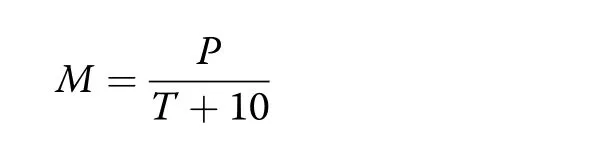
based on the precipitation P(in mm)and mean temperature T(in°C)of the whole year(resulting in an annual Martonne index,My).The same was done using precipitation and mean temperature for the growing season only(defined as 1 May-30 September),which resulted in a growing-season Martonne index Mgs.Because of its minimal data requirement and at the same time high explanative strength,the Martonne index has been widely used in modern studies to describe the drought conditions or aridity in a given region(R?tzer et al.2012;Pretzsch et al.2013;Quan et al.2013).The higher the M index,the better the water supply for plant growth.In the period from 1998 to 2016 Mgsvaried between 11.5–24.4 mm·°C?1during the period April–September and Mybetween 29.7–64.5 mm·°C?1at the Kranzberg site,indicating a broad variation of water availability(Fig.1).Hereby,the years 2001–2002 and 2005–2013 were rather moist years while 2003 and 2015 were extremely dry.
The meteorological data come from the nearby forest weather station Freising,which is part of the Bavarian Environmental Monitoring System(LWF 2017).
Applied dendrometrical methods Calculation of tree height,basal area,and volume growth
For hypothesis testing we calculated the annual stem volume growth at the three levels individual tree,species,and total stand.We based the calculation on the annual stem diameter records at 1.30 m height(permanent dendrometers read off each year in October)in the years 1998–2016 and the available height measurements in the years 1994,1999,2005,2012,and 2014.The sample size(nspand nbe)of the height measurements were for spruce and beech nsp=42 and nbe=41 in 1994,nsp=102 and nbe=64 in 1999,nsp=237 and nbe=112 in 2005,nsp=111 and nbe=62 in 2012,nsp=39 and nbe=41 in 2014,and nsp=531 and nbe=320 in total.
For all trees with recorded height and diameter values we fitted the following Michailov-based diameter-time tree height model(see Biber 2013)separately for both species with nonlinear regression: h=(a0+a1year)This yielded parameter estimates for a,a,b,010b1which allow to estimate the tree height h corresponding to a given stem diameter d in a given calendar year.Subsequently,we used this model for estimating realistic height values for each tree from 1998 to 2016.Using the individual trees’diameters dnand corresponding height estimates hnin year n(n=1998,1999,…,2016),and their form factors fn(Franz et al.1973),which depend from tree species and individual dnand hn,we were able to calculate each tree’s volumeAccordingly,the tree-specific annual volume increment ivnbetween the subsequent years could be easily obtained by subtracting volume values:ivn=(vn?vn?1).As the applied form factors depend on both,current stem diameter and current tree height,stem shape changes are taken into account by this procedure.
All stand characteristics such as mean diameters and heights for the total stand and dominant trees,stand basal area(BA),or standing volume stock per hectare(v)and stand volume growth(iv)for the surveys in 1998–2016 were evaluated following the DESER-Norm from 1993(Johann 1993;Pretzsch 2009).
For the subsequent evaluation the annual volume growth of all individual trees in the mono-specific and mixed species stands was most relevant.In addition we calculated the volume growth per hectare(m3·ha?1·yr?1)by dividing the sum of the tree volume growth of all trees by the actual plot area in ha.
Stand productivity of monospecific and mixed species stands
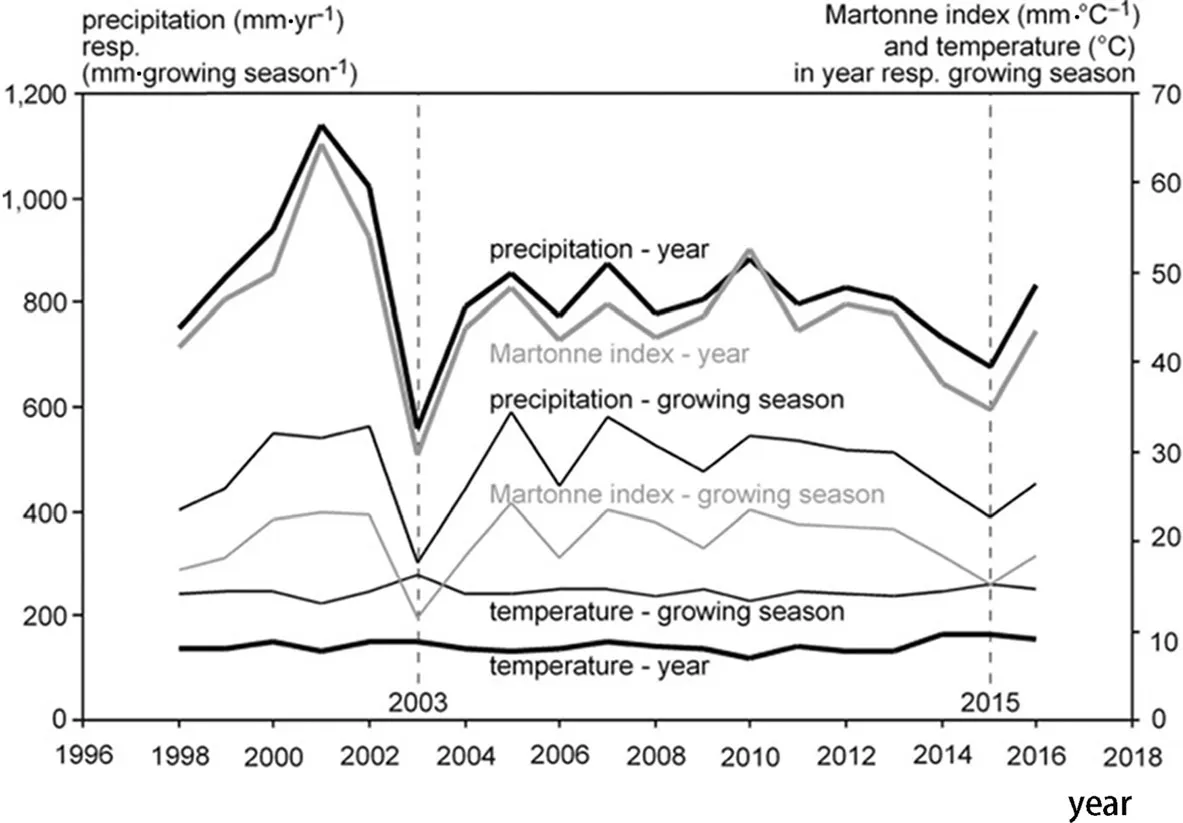
Fig.1 Course of the precipitation,mean temperature,and Martonne index from 1998 to 2016 in the whole year and in the growing season(May–September)for the Kranzberg Forest experimental site.In the years2003 and 2015 water availability waspronouncedly low
The comparison of the effect of water availability on the productivity of mixed versus monospecific stands was based on the course of annual stem volume productivity(abbrev. ‘iv’:increment of volume),of Norway spruce and European beech in the monospecific stands(ivN.sp.,ivE.be.),the species specific productivity of spruce and beech in the mixed stand(ivN.sp.,(E.be.),iv(N.sp.),E.be.)and the mixed stand as a whole(ivN.sp.,E.be.)(see Table 2).
As can be taken from Table 2,European beech is about 20 years older in both mono-specific and mixed species stands,i.e.,it had been established ahead of Norway spruce by advance planting.Mean and dominant tree sizes are rather similar on the monospecific and mixed-species plots.By dominant heights of more than 33 m at the age of 62 and 82 both species indicate top growing conditions,i.e.,site indexes of O 40 according to the yield table of(Assmann and Franz 1963)for Norway spruce(mean height of 37.4 m at age 100)and I.site class according to(Schober 1975)for European beech(mean height of 31.4 m at age 100).
Quantifying the relationship between tree growth(iv)and tree volume(v)
According to Prodan(1965,p 474–476)the interindividual relationship between tree volume growth(iv)within a year(or an otherwise defined growth period)and tree volume(v),at the beginning of the growth period can be described by a simple linear model.Fitting such a linear model iv=a+bv with parameters a and b through the iv-v data by OLS-regression yielded the intercept a and the slope b.The procedure was applied separately for each year from 1998 to 2016 and for Norway spruce and European beech in mono-specific and mixed-species stands separately.The resulting calendar year specific values for a and b(Additional file 1:Tables S1–S6)were used for analyzing whether and how the annual weather conditions and the species mixing modify the iv-v relationship.
In a preliminary analysis we also fitted the secondorder polynomial equation iv=a+bv+cv2in order to reveal any nonlinear trends in the annual interindividual relationship between volume growth and tree volume(plausibility verified by visual assessment of the fitted polynomials).As only in 24 of our 76 regressions the quadratic element,in terms of the regression parameter c was significantly different from zero,we based the analyses on the linear model shown above.
Calculating the growth dominance coefficient(GDC)
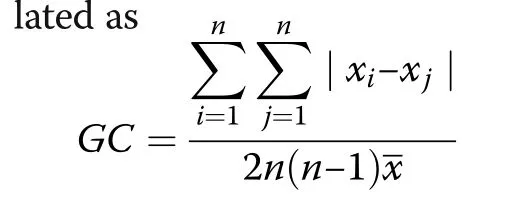
(see De Camino 1976;Kramer 1988).The variables xiand xjdenote size or growth (or other treecharacteristics)for the i’th and the j’th tree in a stand with n trees.If the curve of the cumulative distribution of tree growth over stem volume follows the bisectoral line the GDC equals zero.GDC is less than zero,if it runs above the bisectoral line,and if the curve lies below the bisector line,the GDC is greater than zero(see curves 3 and 1,respectively,in Fig.2).
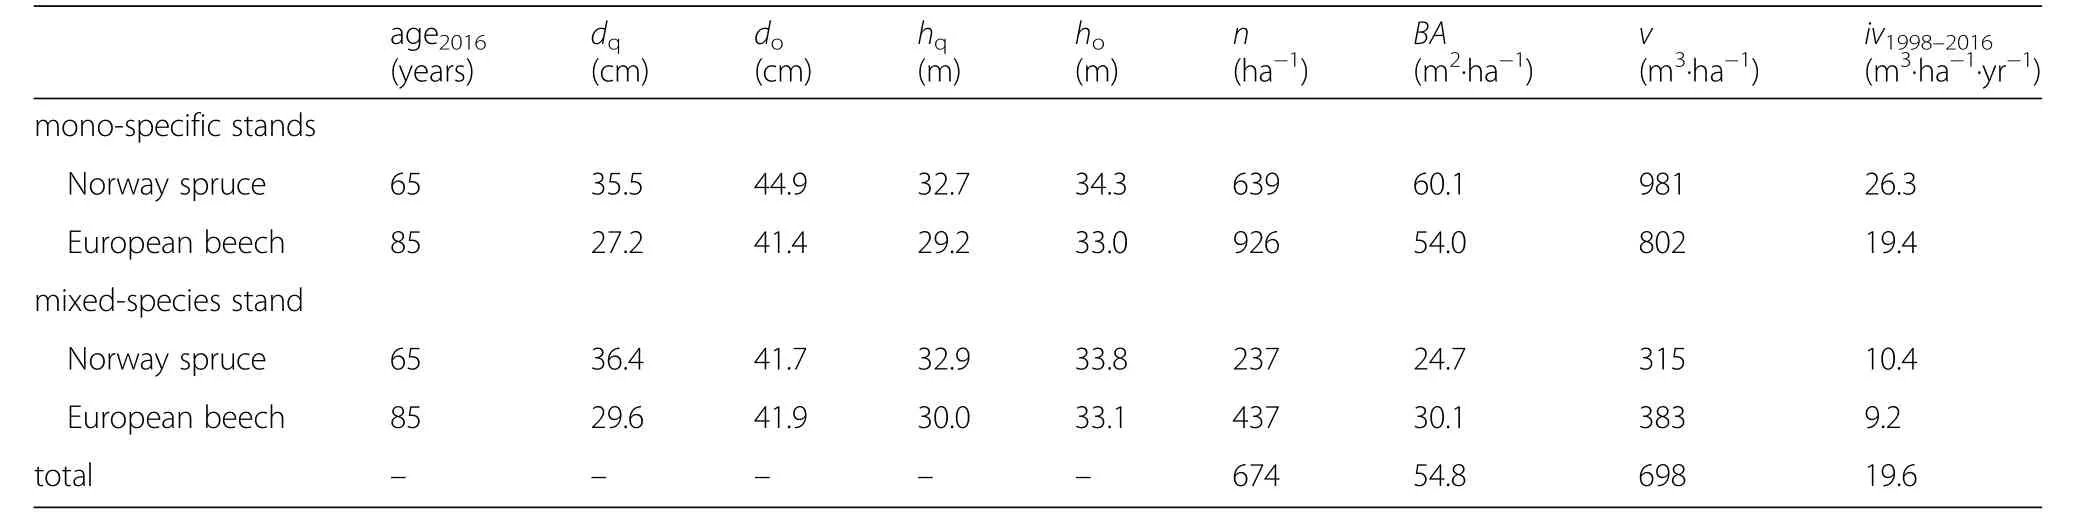
Table 2 Stand data of the monospecific and mixed species plots of Norway spruce and European beech for the last survey in 2016 and mean stand volume growth for the whole survey period from 1998 to 2016
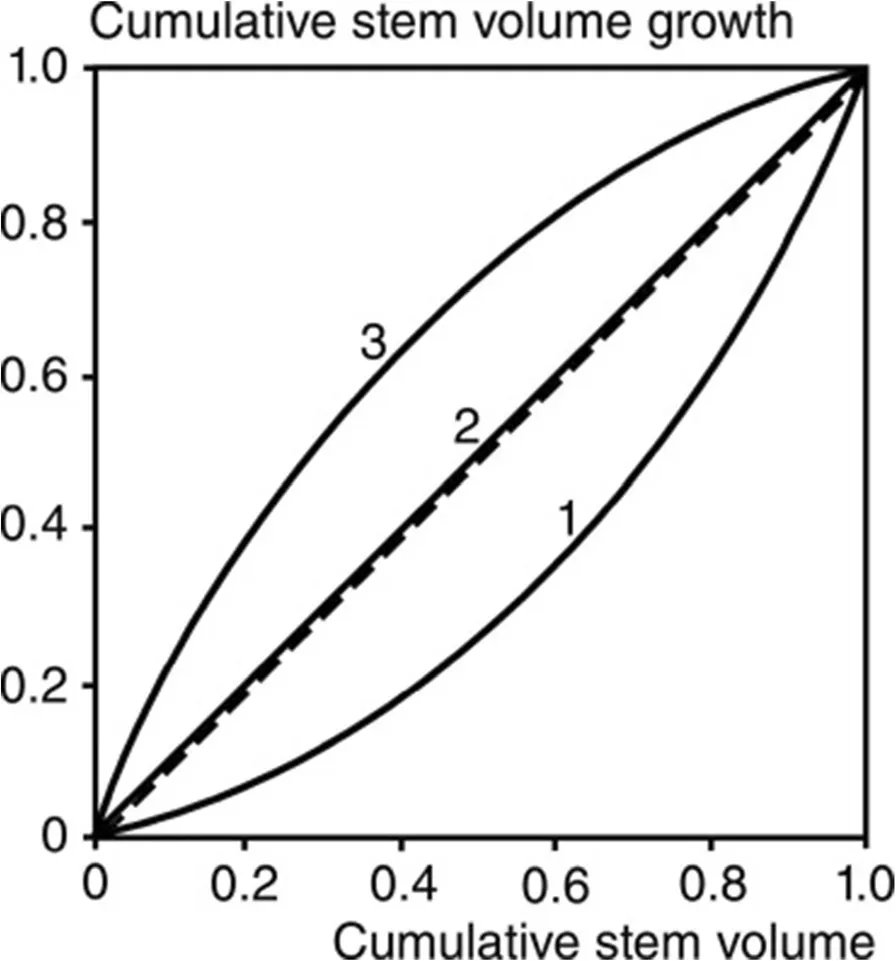
Fig.2 Schematic representation of the cumulative distribution of stem volume growth(ordinate)over stem volume(abscissa)for forest stands with different competitive status of small compared with tall trees.Curve 1 indicates a growth dominance of tall trees,curve 3 a growth dominance of small trees,and curve 2 indicates that all trees contribute to stand volume growth proportionally to their volume.Curves 1,2,and 3 result in GDC=0.17,0 and?0.12
Any changes of the GDC depending on the Martonne index indicatethat treesof different size react differently on the variation of water supply so that the growth partitioning pattern among the population changes.If water supply would affect the growth of all trees in a population in the same way,GDC would remain constant as only the absolute growth rate but not its partitioning among the trees changed.However,an increase of GDC would mean an increasing growth of the tall trees in relation to their share of the stand volume,i.e.,the growth efficiency(growth/standing stock)of the tall trees increases.In contrast,a decreasing GDC would indicate an increasing growth efficiency of thesmall treesin relation to their tall neighbours.
Growth share and drought resistance of different population strata
Despite the GDC is common in ecology but rather abstract,we calculated two additional measures for quantifying the effect of water availability on the growth dominance and representativeness of tall compared to small trees.
First,we isolated the collectives of the 10%smallest and the 10%tallest trees in our data based on the stem volume.For both groups and each year in the period 1998–2016 we calculated their shares of the total stand productivity.If drought would affect both collectives in the same way,the course of the shares over the years should be synchronous;i.e.,low and high shares should occur simultaneously for both groups,or the shares should not considerably change at all.
Second,we calculated the drought resistance,Rt,for the three strata 1)dominant trees(100 tallest trees per hectare),2)subdominant(100 smallest),and 3)all trees according to the concept by Lloret et al.(2011).Rt is the ratio between the relative volume growth in a drought year(2003 or 2015)and the mean volume growth in the 3 years before the drought,i.e.,in the pre-drought periods 2000–2002 and 2012–2014,respectively.Rt reflects the extent to which the tree growth of the different size strata decreased due to drought stress compared to the‘normal’level of growth.In case of equal drought reactions of all size strata,there would be no significant differences between their Rt values.
Statistical methods applied for answering the questions Q1–Q3
The data material prepared as described above was subsequently used for statistical scrutiny of the three research questions of this study.
Q1:How does stand volume growth depend on the water availability?
For answering how water stress affects stand growth of Norway spruce compared to European beech in monospecific and mixed-species stands(Q1)we used the annual stand volume growth records iv and the Martonne index for the growing season,Mgsas basic variables.We focused on Mgs,because preliminary analyses suggested this variable as a better predictor than its whole-year counterpart My.After visual data inspection we deemed the simple linear model iv=a+bMgsas sufficient for describing the relation between stand volume increment and the Martonne index.In order to be able to contrast different tree strata(e.g.Norway spruce in monospecific stands against European beech in monospecific stands)inside this concept,we formulated the following OLSregression model
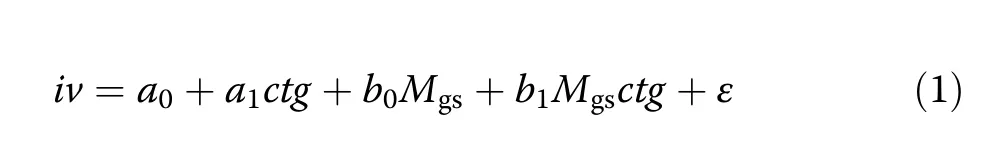
by introducing the predictor ctg,which is a two-level categorical variable used for the required comparisons(details below).Given the above-mentioned general Model iv=a+bMgs,the parameters a0,and a1are the components of its intercept a while b0and b1form together the slope b(a=a0+a1ctg,b=b0+b1ctg).Assume,the variable ctg is used for contrasting the category“Norway spruce in monospecific stands”(ctg=0)against“European beech in monospecific stands”(ctg=1).In this case,a0and b0represent the intercept and the slope for spruce,while a0+a1and b0+b1are the intercept and the slope for beech.Only if a1or b1differ significantly from 0,the assumption that the intercept or the slope is different for both species is justifiable.If this was the case,either for a1,b1or for both,we concluded that the linear relationships for the two categories under comparison were different.
In total,we made six two-category comparisons with corresponding coding of the variable ctg(Table 3).These comparisons were 1)beech in monospecific stands vs.spruce in monospecific stands,2)beech in mixed stands vs.spruce in mixed stands,3)beech in mixed stands vs.mixed stands in total,4)spruce in mixed stands vs.mixed stands in total,5)spruce in mixed stands vs.spruce in monospecific stands,and 6)beech in mixed stands vs.beech in monospecific stands.Before feeding them in this analysis,all volume increments(including those of single species in mixed stands)were extrapolated to an area of 1 ha in order to make them comparable.
Q2:How does growth partitioning among trees of different sizes in a stand depend on water availability?
For analysing how growth response to drought depends on the size of a tree in a stand(Q2)we first fitted the annual iv-v relationships by OLS regression which yielded the annual intercept a and slope b for all considered groups(see section‘Quantifying the relationshipbetween tree growth,iv,and tree volume,v and intercepts and slopes presented in Additional file 1:Tables S1–S6).Then the intercepts and slopes of the annual iv-v relationships at the individual tree level were set in relation to the Martonne index,Mgs.For this purpose we applied the two different OLSregression models:
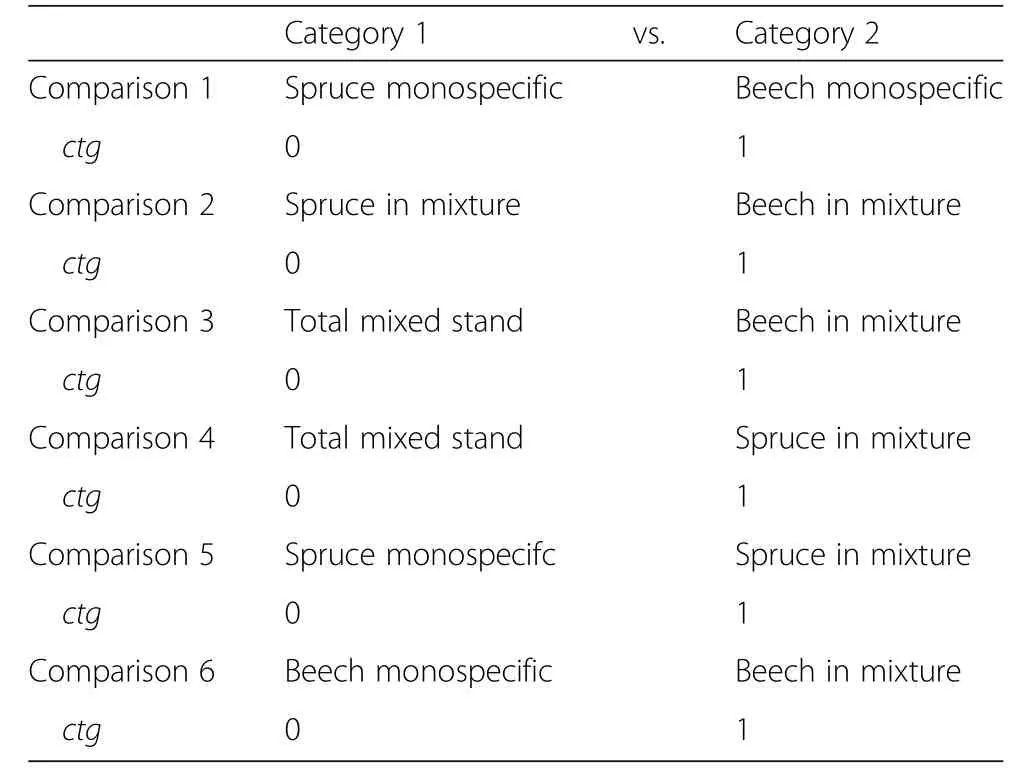
Table 3 Comparisons made with the regression models after Eq.1 and corresponding coding of the variable ctg
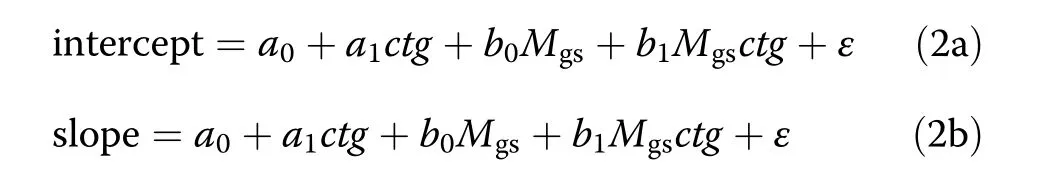
In these models the dependent variables “intercept”and “slope”are the intercepts and slopes previously obtained by fitting the annual iv-v relationships with OLS regression models for all categories of interest.While the parameters and variables are the same as explained along with Eq.1,the comparisons made and consequently the coding of the variable ctg used for Q2 are different(Table 4).The comparisons were 1)spruce altogether(in mixed and monospecific stands)vs.beech altogether,2)spruce in monospecific vs.spruce in mixed stands,3)beech in monospecific vs.beech in mixed stands.In the same way as for Q1,significances of the parameters a1and b1were taken as criteria for determining differences between the regression lines of two categories coded with the variable ctg.
Q3:How does the water availability modify the growth dominance and representativeness of tall compared to small trees in a stand?
For scrutiny whether there are effects of water availability on the growth dominance of trees(Q3)we related both variables GDC and Mgsby the model

with the analogous meanings of all variables and parameters as in Eqs.1,2a and 2b.The same categories were compared as for Q2(Table 4).
Based on autocorrelation function plots,the residuals of all models shown above(Eqs.1,2a,2b,3)were visually assessed for serial autocorrelation which was found to be negligible.All statistical evaluations were conducted with R 3.3.2(RCore Team 2016)and MSExcel.
Results
Q1:Stand volume growth depending on water availability
Figure 3a and b show the course of stand volume growth in the period 1998–2016 for(a)the monospecific stands of Norway spruce and European beech and(b)for the mixed stand in total and for both species’contributions to the mixed stand’s growth.Both figures illustrate that the growth of Norway spruce oscillates stronger than European beech with more pronounced growthreductions in dry years.The low growth years 2003 and 2015 are indicated in the Figure by broken vertical lines.
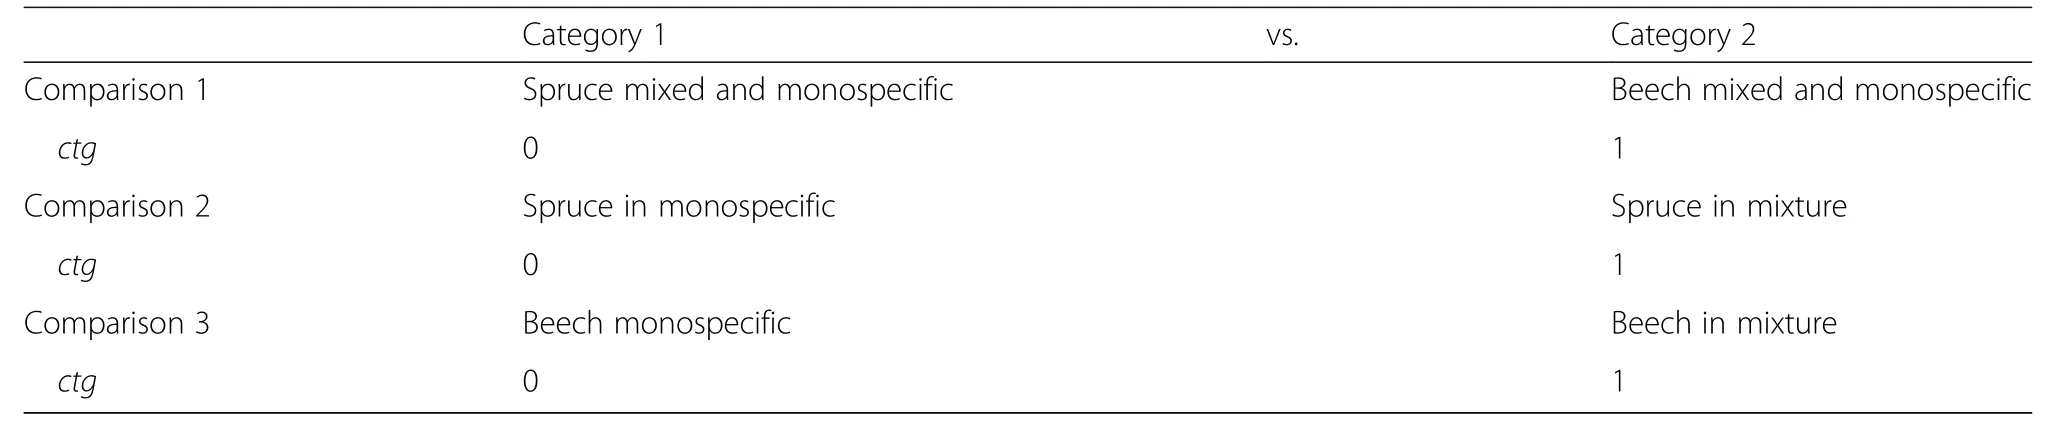
Table 4 Comparisonsmade with the regression modelsshown in Eqs.2a,2b,3 and corresponding coding of the variable ctg
Figures 3c and d show the annual stand volume growth in dependence on the Martonne index.It is shown for the mono-specific stands of Norway spruce and European beech(c)and for the total and the species stand volume growth in the mixed-species stand(d);here,both species’volume growth was converted into ha-related values by dividing it by their area shares in the mixed stand.The obvious differences in the relationship between water availability and growth were corroborated by the statistical analyses based on model Eq.1,as presented in the method section.This analysis resulted in the regression lines included in Fig.3c and d.The statistical analysis could be based on the absolute stand growth rates as there were no significant differences in the age trend between the considered groups.The model fit results are shown in detail in Table 5.
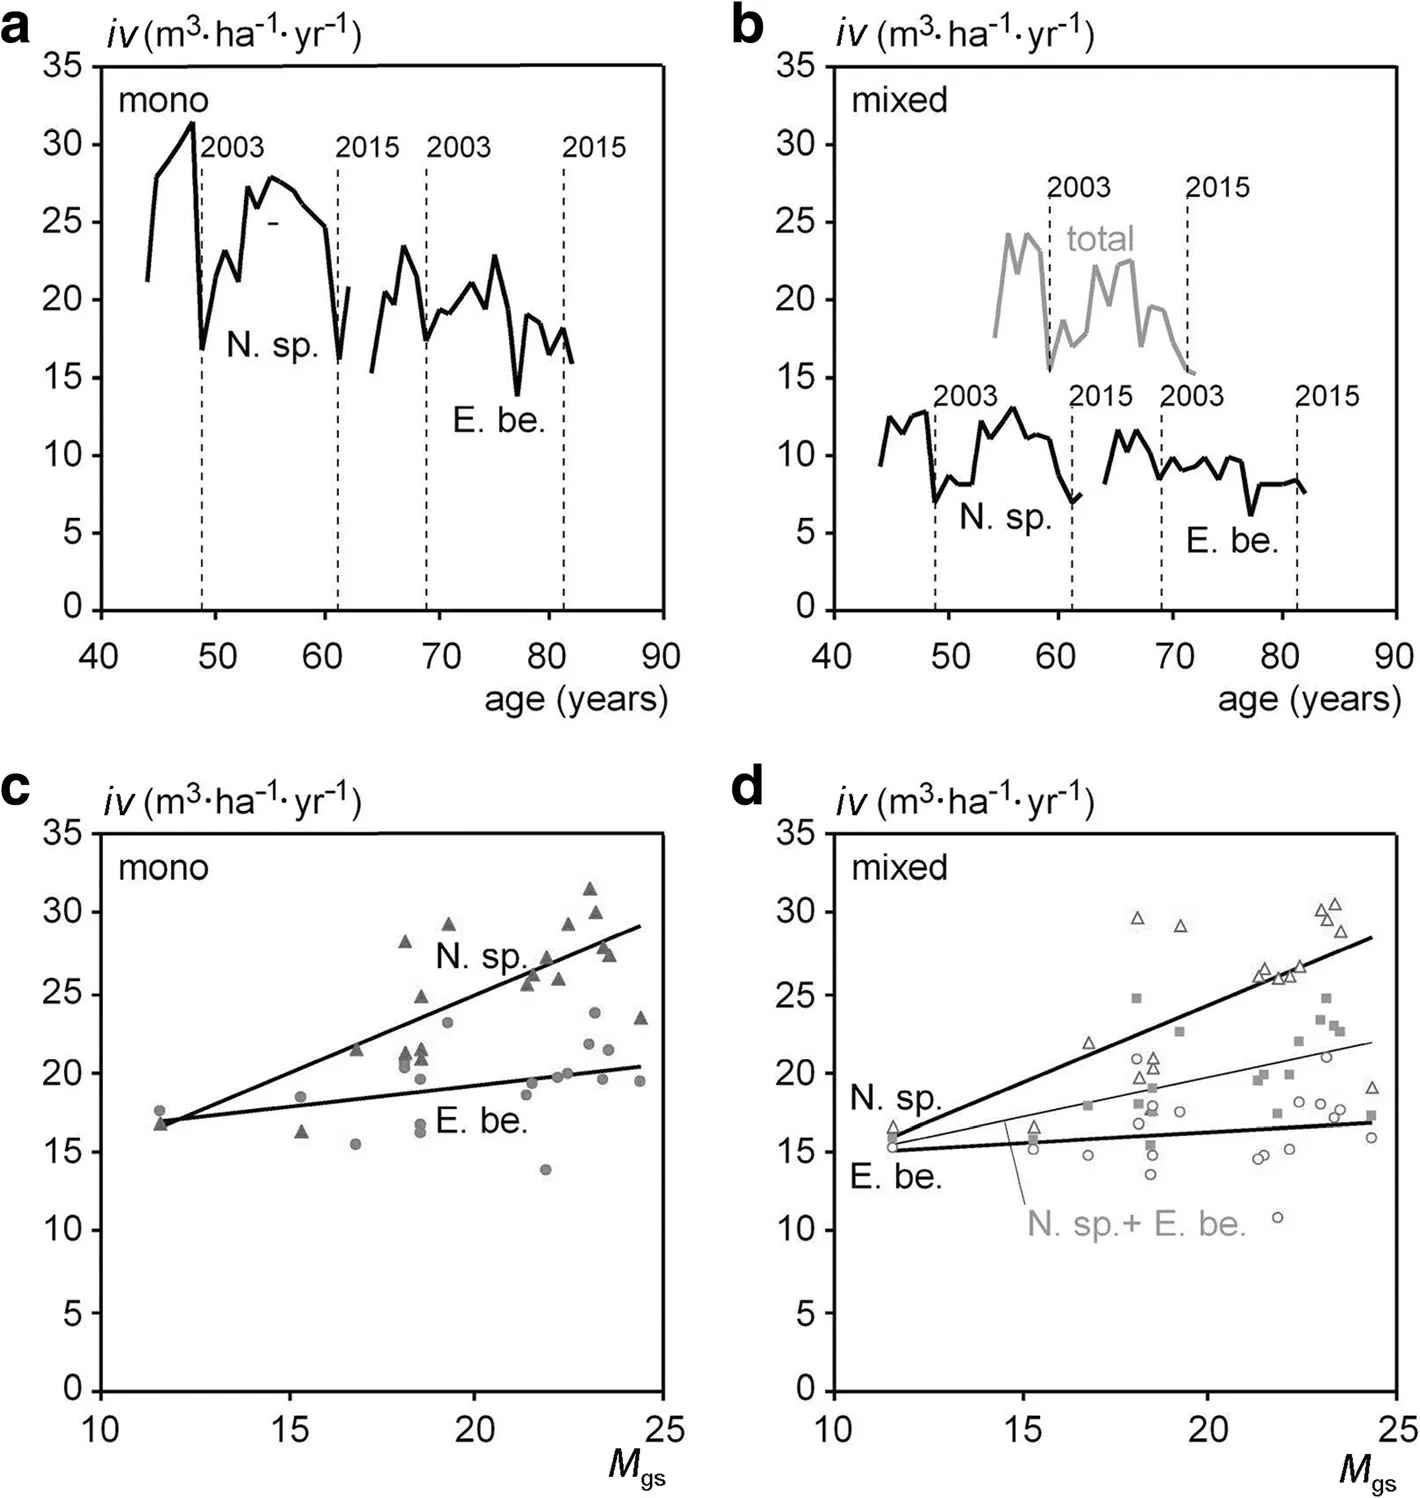
Fig.3 Stand volume growth in the monospecific and mixed-speciesstandsof Norway spruce and European beech of the Kranzberg forest experiment from 1998 to 2016 shown in relation to stand age and in relation to water availability(de Martonne index for the growing season,M gs).Upper panel:Annualstand volume growth of Norway spruce and European beech for(a)the mono-specific standsand(b)totaland speciesstand volume growth in the mixed-speciesstand.Lower panel:Annual stand volume growth dependent on the Martonne index shown for(c)the mono-specific standsof Norway spruce and European beech and(d)the total and speciesspecific stand volume growth in the mixed-speciesstands.Note that in(d)thespeciesspecific growth valueshave been converted into ha-valuesby dividing them by their areashare in the mixed stand
Table 5,in its upper part,reflects by the parameter b0of model Eq.1 that the growth rates always increase with increasing Martonne index values;in most of the cases the increase is significant.As explained in the methods section,the parameter for a0,a1,b0,b1are the components of the slope b and intercept a of a simple linear relationship between volume growth and the Martonne index.The values of these slopes and intercepts as calculated from the parameter estimates in the upper part of Table 5 are presented in the lower part the table.These slopes b range between 0.128 and 0.992.The increase of growth with increasing water availability(equivalent with the decrease of growth with decreasing water availability),is strongest in case of Norway spruce in pure stands(b=0.992)and just slightly lower for spruce in mixed stands(b=0.970).Stand growth of beech in monoculture(b=0.263)and mixture(b=0.128)is less water-dependent.The mixed stand as a whole lies in between(b=0.490).In monospecific as well as in mixed stands,the slope b of beech is significantly lower compared to spruce.
This means that the sensitivity to drought differs significantly between Norway spruce and European beech.However,Norway spruce and European beech do not differ in their behaviour in mixed compared with monospecific stands.These resultsare visualized in Fig.3c and d.The relationships of water availability and stand growth are steeper for spruce than for beech.Both species show a similar species specific behaviour in monospecific and mixed-species stands.The relationship between the relative growth and the Martonne index Mgsof the mixed-species stand in total lies between the two speciesspecific lines of Norway spruce and European beech(see Fig.3d,grey line).This underlines,that the behaviour of the mixed stand isjust an additive effect.
Q2:Growth partitioning among trees of different sizes depending on water availability
For illustrating the iv-v relationships for Norway spruce compared with European beech and the dependency of these relationships on water availability we selected the 2 years 2001 and 2007 with the highest Mgsindex(Mgs=23.2,23.6)and 2003 and 2015 with the lowest Mgsindex(Mgs=11.5,15.3)within the period 1998–2016.Figure 4a and b,show that the linear iv-v relationships for Norway spruce lie generally higher than for European beech.Furthermore,the figure shows for both species that these relationships are steeper in the moist years(2001,2007)compared with the dry years(2003,2015).This means that in moist years tall trees grow over-proportionally compared with small trees and competition is more sizeasymmetric.In dry years,in contrast,the advantage of tall trees decreases and competition becomes more size-symmetric.
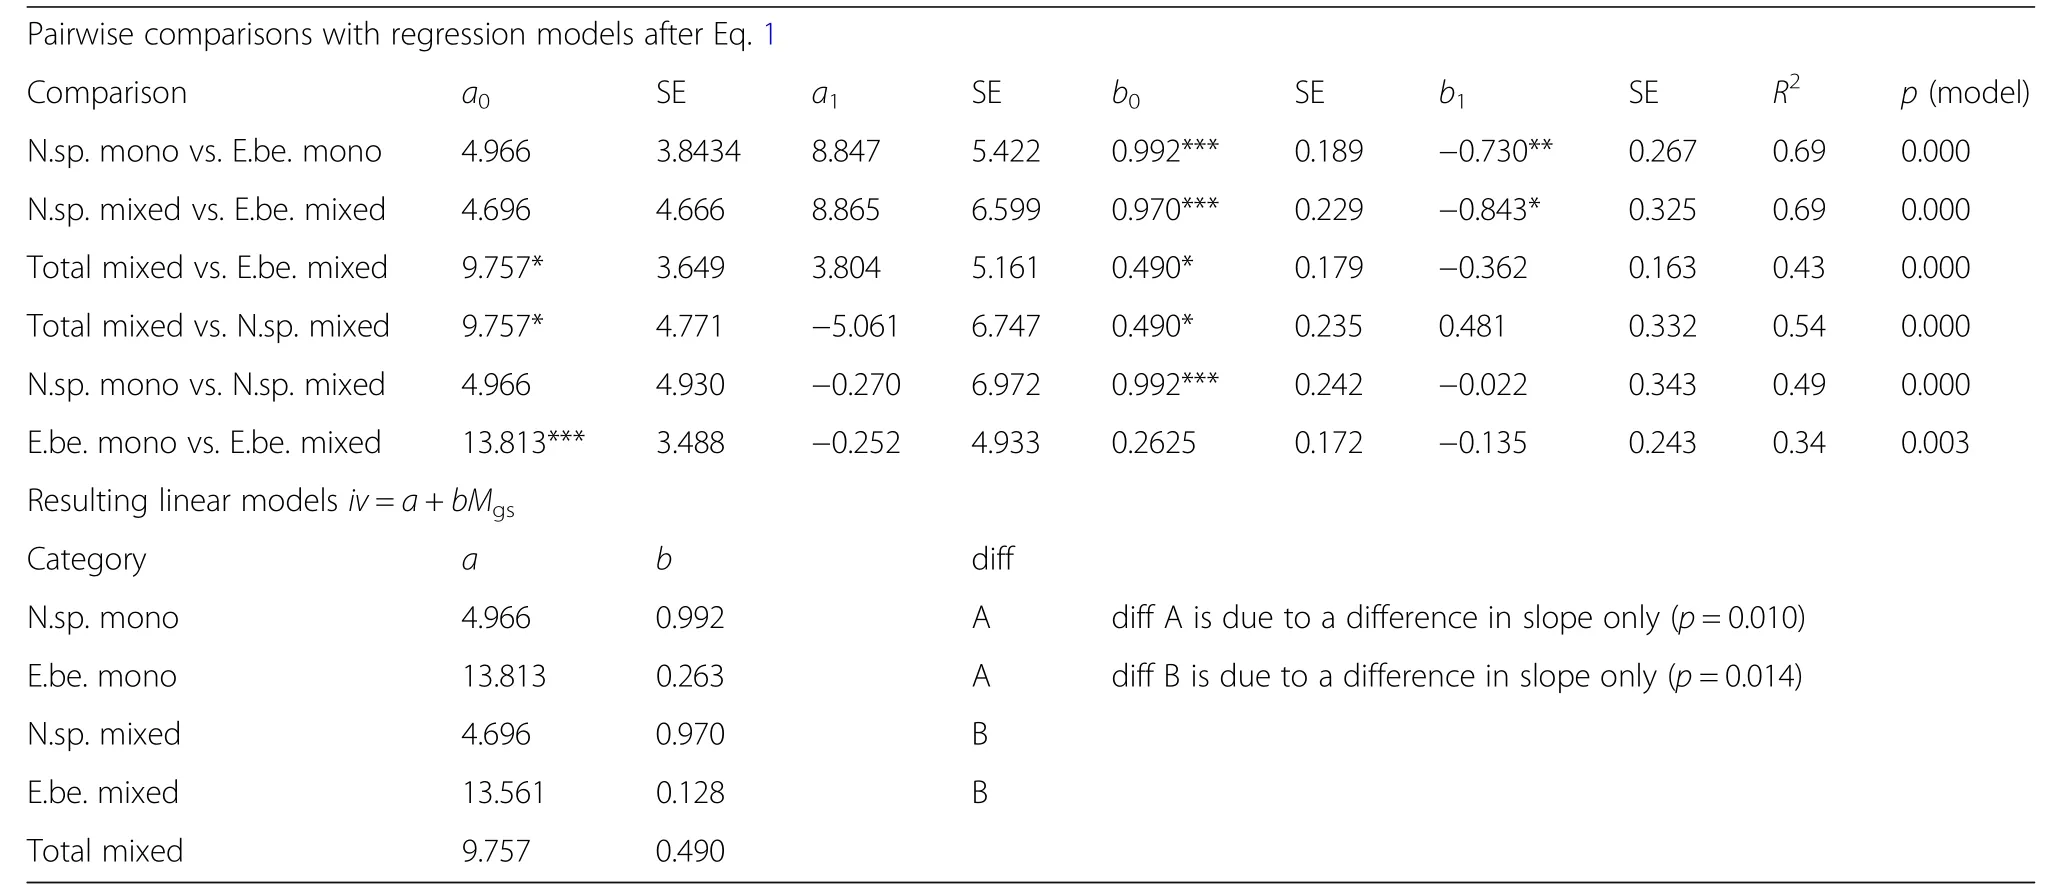
Table 5 Upper part:Results of the pairwise comparisons by fitting Eq.1(corresponding to Q1)

Fig.4 The relationship between tree volume growth(iv)and tree volume(v)represented by the iv-v line issteeper for(a)Norway spruce than for(b)European beech and for both species steeper in moist years(e.g.,2001,2007)than in dry years(e.g.,2003,2015).For thisevaluation we pooled the trees of the monospecific and mixed species plots
While Fig.4 just presents the linear model fits of iv=a+bv for selected years and spruce and beech without making a difference between mixed and monospecific stands,the model was fitted for each year and additional combinations of species and mixed/monospecific stand(see methods section,Table 4).Accordingly,Additional file 1:Tables S1 and S2 show the corresponding fit results for Norway spruce and European beech,respectively,in total(mixed and monospecific together).Additional file 1:Tables S3 and S4 show the same for monospecific stands,while Additional file 1:Tables S5 and S6 relate to both species in mixed stands.All regressions were significant at level p<0.001.
The parameters of these regressions were used for further analysis of any general dependency of the sizeasymmetry from the annual water availability(see methods section).The following analysis of growth partitioning among trees of different sizes depending on water availability were based on the intercepts a and slopes b of those regressions.
Table 6,upper part,shows that the intercept of the iv-v relationship mostly decreases and the slope increases with increasing Martonne index Mgs(see parameter estimates for b0and their significance in Table 6).The lower part of Table 6 presents the resulting linear relationships between intercept and slope and Mgsfor all investigated groups.Figure 5 shows these general findings exemplarily for Norway spruce and European beech,both without a distinction by mixed or monospecific stands.The trend lines in Fig.5a and b,resulting from the fitted modelsafter Eqs.2a,2b and Table 6 corroborate that higher water availability,indicated by high Mgsvalues,increases the slope and decreases the intercept of the iv-v relationship.This indicates a tendency towards more size-asymmetric growth partitioning between the trees of a population.Low water supply results in shallower slopes and higher intercepts of the iv-v relationships which means a general tendency towards a size-symmetric growth partitioning of the trees in the populations in dry years.However,except from the significantly higher intercept of Norway spruce compared with European beech we found no significant group differences(Table 6,lower part).Figure 6 illustrates this effect exemplarily for the model for all Norway spruces.With increasing Martonne index the asymmetry of competition increases,whereas water limitation equalizes the growth partitioning between different-sized.Notice that the iv-v relationshipsintersect and that small trees suffer lessfrom water limitation or even benefit compared with tall trees.If the iv-v relationships for different Martonne index values would all run through the origin of the coordinate system and just differ in their slopes,this would indicate the same relative growth loss for trees of different sizes.However,the finding that water limitation can change(increase)intercept and slope(decrease)revealsthe tendency to more symmetric resource and growth partitioning under drought and the partitioning in favour of small trees in especially in case of Norway spruce.
Q3:Growth dominance and representativeness of dominant trees depending on water availability
The resistance(Rt)values printed bold in Table 7 indicate a significant growth decrease below the pre-drought level.Except the subdominant trees in 2015 all spruces significantly reduced their growth due to drought in 2003 and 2015.Dominant spruces were significantly less drought resistant than their subdominant neighbours.In relation to the 3-year-period before drought dominantspruces reduced their stem volume growth in 2003 and 2015 by 50%and 46%,respectively(Rt=0.50 and 0.54).Compared to the mean tree(tree with the mean stem volume)in the stand,growth reduction of dominant spruces was about 8–17 percentage points stronger.
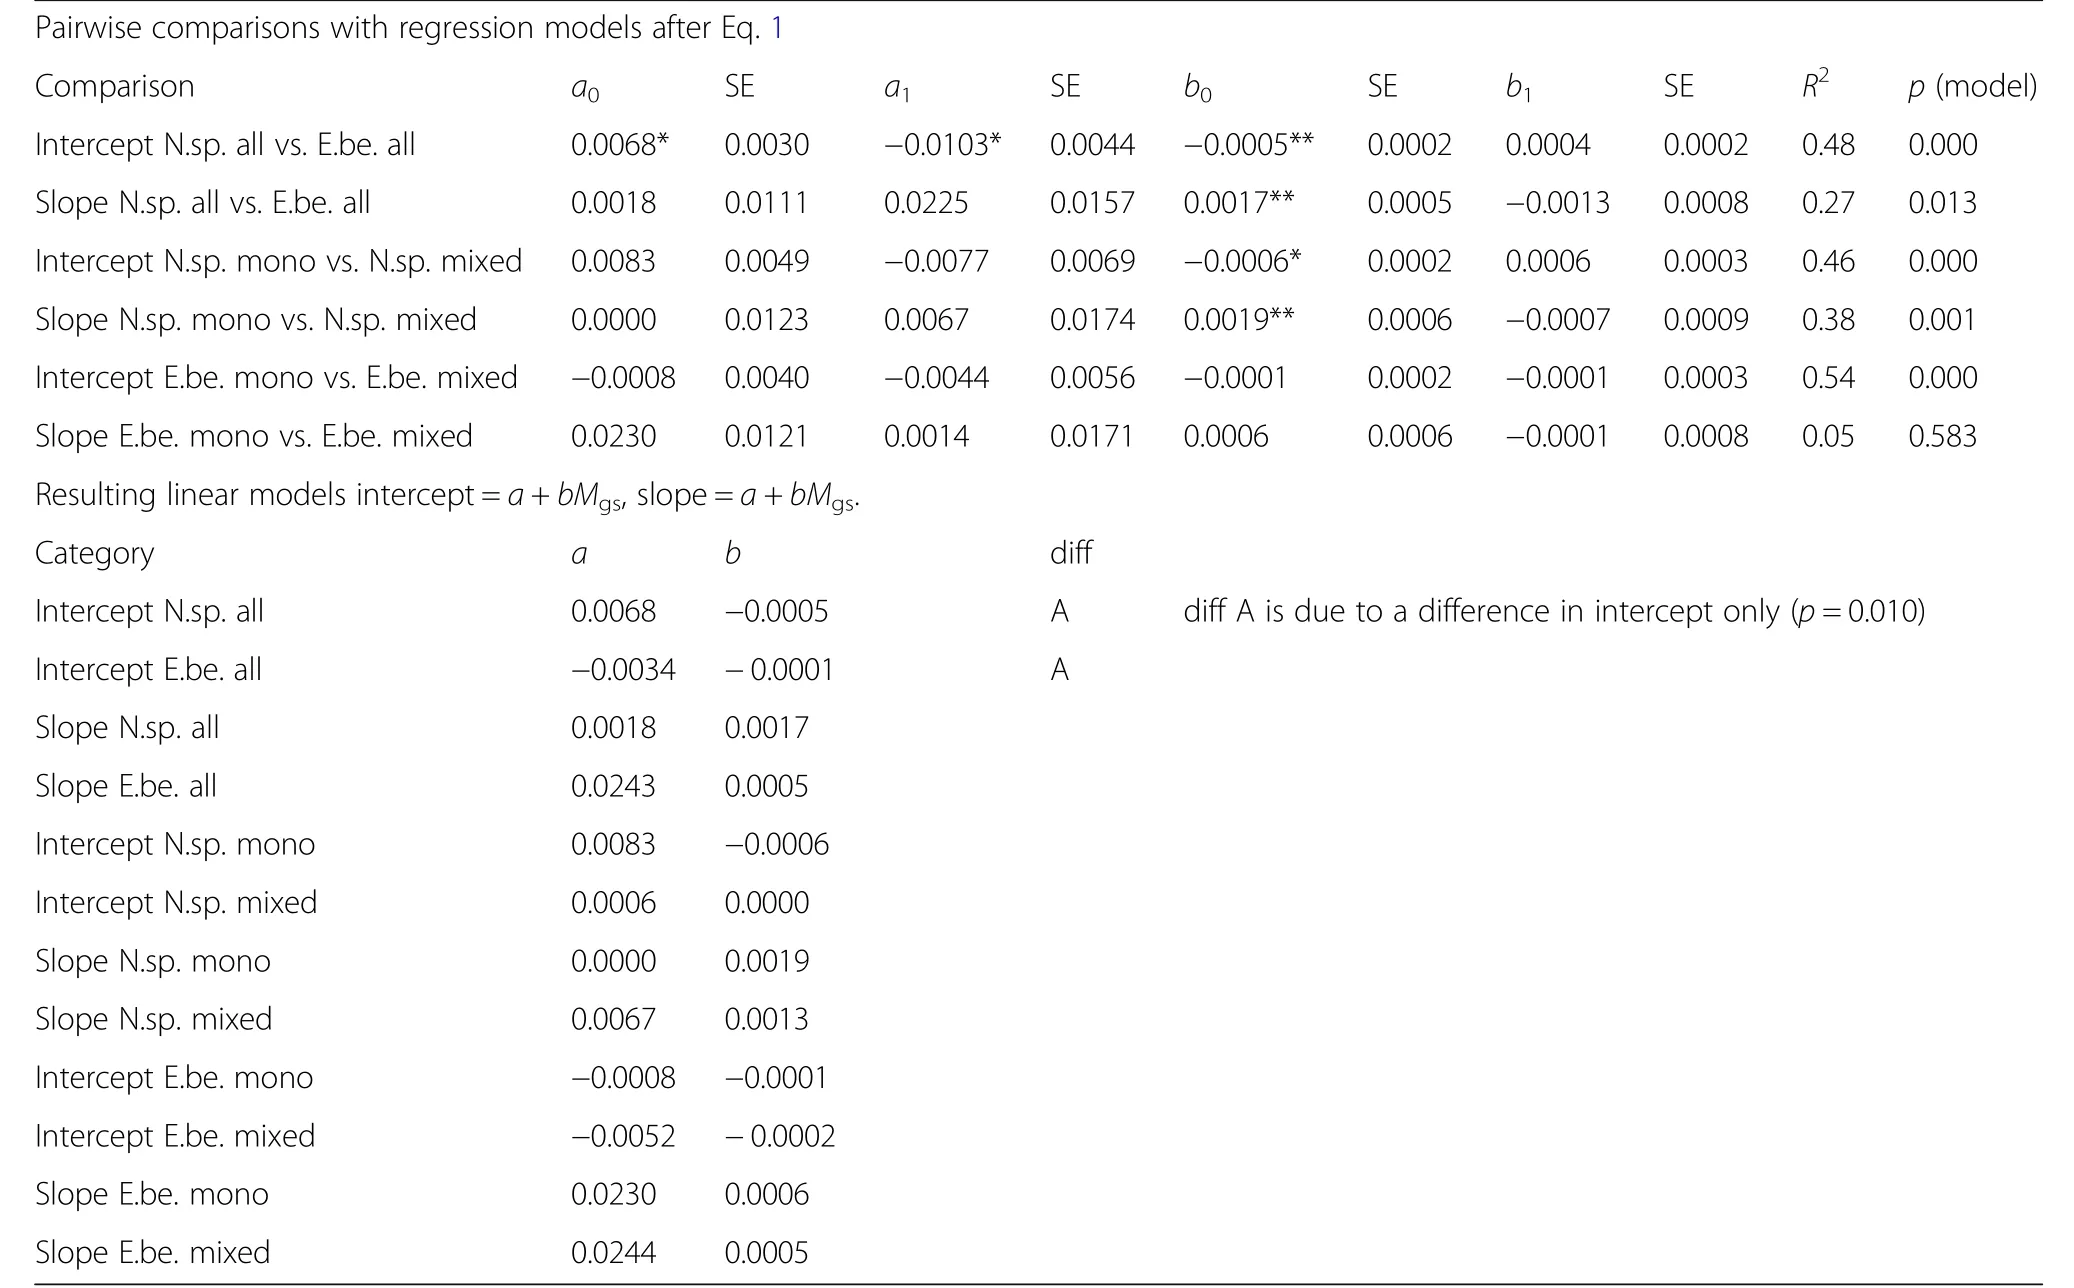
Table 6 Upper part:Resultsof the pairwise comparisons by fitting Eqs.2a,2b(corresponding to Q2)
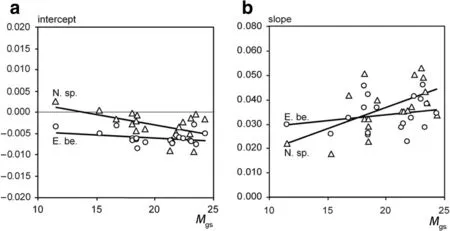
Fig.5 Dependency of(a)the intercept a,and(b)the slope b of the equation iv=a+bv on the growing-season Martonne index M gs fitted by linear models(Eqs.2aand 2b)for Norway spruce and European beech(see Table 6 for statisticalfit results).Water availability,M gs,mostly decreasesthe intercept and increasesthe slope of the annual and inter-individual iv-v relationship.Thisindicatesan increase of size-asymmmetric competition with increasing water availability and amore equal growth distribution between the treesin a stand in dry periods.For thisevaluation we pooled the trees of the monospecific and mixed speciesplots
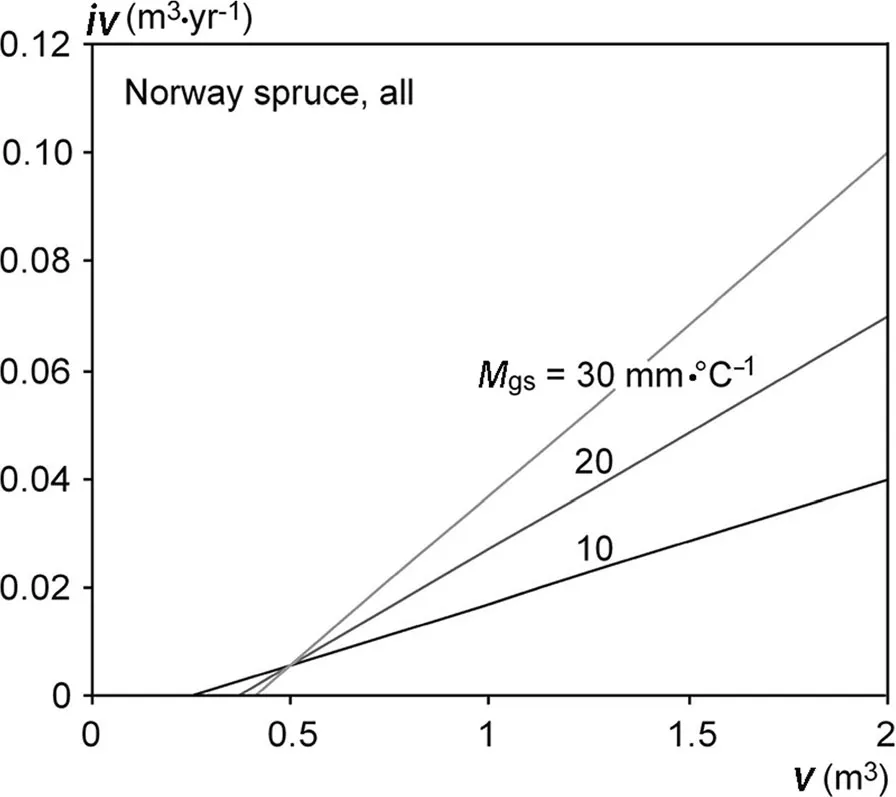
Fig.6 Relationship between stem volume growth,iv,and stem volume,v,according to the fitted intercept and slope modelsfor all Norway spruces(mixed and monospecific standstogether,see Table 6).Thegraph showsthe iv-v relationship for Norway spruce in dry,medium and moist years,characterised by Martonne index valuesin the growing season of M gs=10,20 and 30 mm·°C?1
Subdominant spruces,in contrast,were more resistant and reduced the growth lessor not at all in 2003 and 2015(Rt=0.64 and 1.01).Because of their higher resistance the drought-induced relative growth losses on stand level were lower than observed at the dominant treesonly.
In case of beech the average drought resistance in 2003 and 2015 was much higher(Rt=0.87 and 1.02)than for spruce,the growth losses being hardly relevant.The bold Rt values in Table 7 reveal a significant growth reduction due to drought just for the dominant beeches in 2003 and 2015(Rt=0.71,0.94)and the overall group mean in 2003(Rt=0.87).Subdominant beeches showed no significant growth reductions due to drought.Dominant beeches represent the mean stand reaction pattern on the severe droughts in 2003 and 2015 quite well.In case of beech we found no significant differences between the groups.
Figure 7a,and b,shows that the 10%tallest trees produce 20%–30%of the total stand volume growth in case of Norway spruce and 30%–40%in case of European beech.The 10%smallest trees contribute just 0.5%–3.0%and 0.5%–1.0%to the total stand volume in case of Norway spruce and European beech,respectively.So,the 10%small ones contribute about a tenth of the taller ones to the total stand volume growth.
In case of Norway spruce,dry years have an opposite effect on the relative shares which the small and tall trees have of the total stand volume growth(Fig.7a).While the share the 10%smallest trees have at the total stand volume growth increases in dry years,the share of the 10%tallest trees decreases.Drought obviously affects the volume growth share of tall trees in a stand stronger in terms of growth reduction than the small trees.In case of Norway spruce the series of dry years possibly triggers a continuous increase of the volume growth share of the small trees in the whole study period,while the share of the tall trees continuously decreases from 1998 to 2016.For European beech the trend of repartitioning in favour of the small trees,if any,is far less pronounced than for Norway spruce(Fig.7b).
The Growth Dominance Coefficient(GDC)values being smaller or–in case of Norway spruce-even below zero in dry years(e.g.,2003 and 2015)and greater in normal and wet years(e.g.,2001,2007)substantiate growth partitioning in favour of small trees when the stands suffer drought stress(Fig.8).Table 8 shows the results of the regression analysis that relates GDC with the de Martonne index(Eq.3)for all analysed strata.The by-trend increase of GDC with increasing Martonne Index in the growing season,Mgs,indicates that growth dominance,i.e.,the contribution of the dominant trees to the stand volume growth,increases with the water availability.The other way round the share the 10%small trees have of the total stand volume growth increases with shortage of water.This tendency is only significant for Norway spruce in a monospecificenvironment(parameter b0in Table 8,upper part),but it leads to a consistent positive slope of the relationship GDC=a+bMgsfor all analysed categories(parameter b in Table 8,lower part).Notice that the level of growth dominance,the intercept a in the equation above,was generally higher in European beech than in Norway spruce(Fig.8,parameter a in Table 8,lower part).There were significant differences in this level of growth dominance between Norway spruce and European beech and also between European beech in mixed versus pure stands(Table 8,lower part).Based on the parameters a and b shown in Table 8(lower part),Fig.8 shows the trend lines for the relationship between GDC and Mgsfor the various groups.
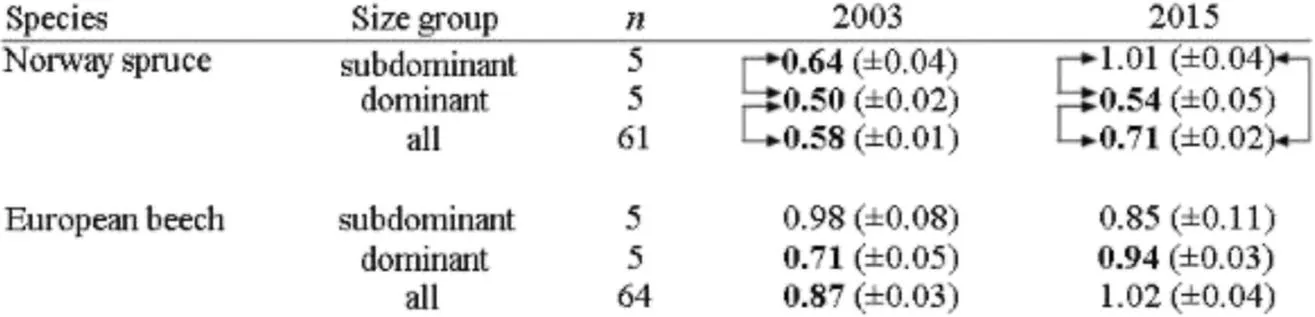
Table 7 Drought resistance,Rt,in terms of stem volume growth of trees in the drought years 2003 and 2015 in relation to the before-drought period(2000–2002 and 2012–2014,respectively).Group meansand standard errors(SE)for all trees,the 100 smallest(subdominant)and the 100 tallest(dominant)trees per hectare
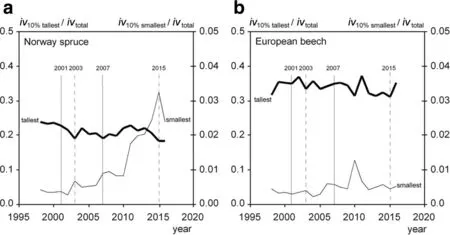
Fig.7 Shares of the 10%tallest and 10%smallest trees at stand volume growth(iv).Dry years(2003,2015)and wet years(2001,2007)are highlighted.a For Norway spruce the share of the 10%smallest treesof the total stand growth variesbetween 0.5%and 3.0%,and increasesin dry years as 2003 and 2015.The share of the 10%tallest varies between 20%and 30%and decreases in dry years.b For European beech the share of the 10%smallest trees of the total stand growth varies between 0.5%and 1.0%.The share of the 10%tallest trees varies between 30%and 40%,the reactions on drought are less pronounced than for spruce
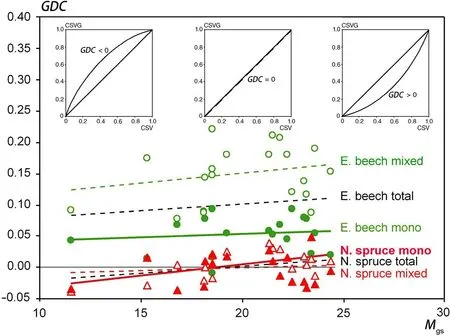
Fig.8 The increase of the growth dominance coefficient,GDC,with increasing water availability,M gs,indicatesthat under dry conditionssmall trees have a larger share of the total stand volume growth whereas under moist conditions the share of dominant trees increases.The insets in the upper part of the graph illustrate how the curve of cumulative stem volume growth over the cumulative stem volume changes with increasing water availability(from left to right)
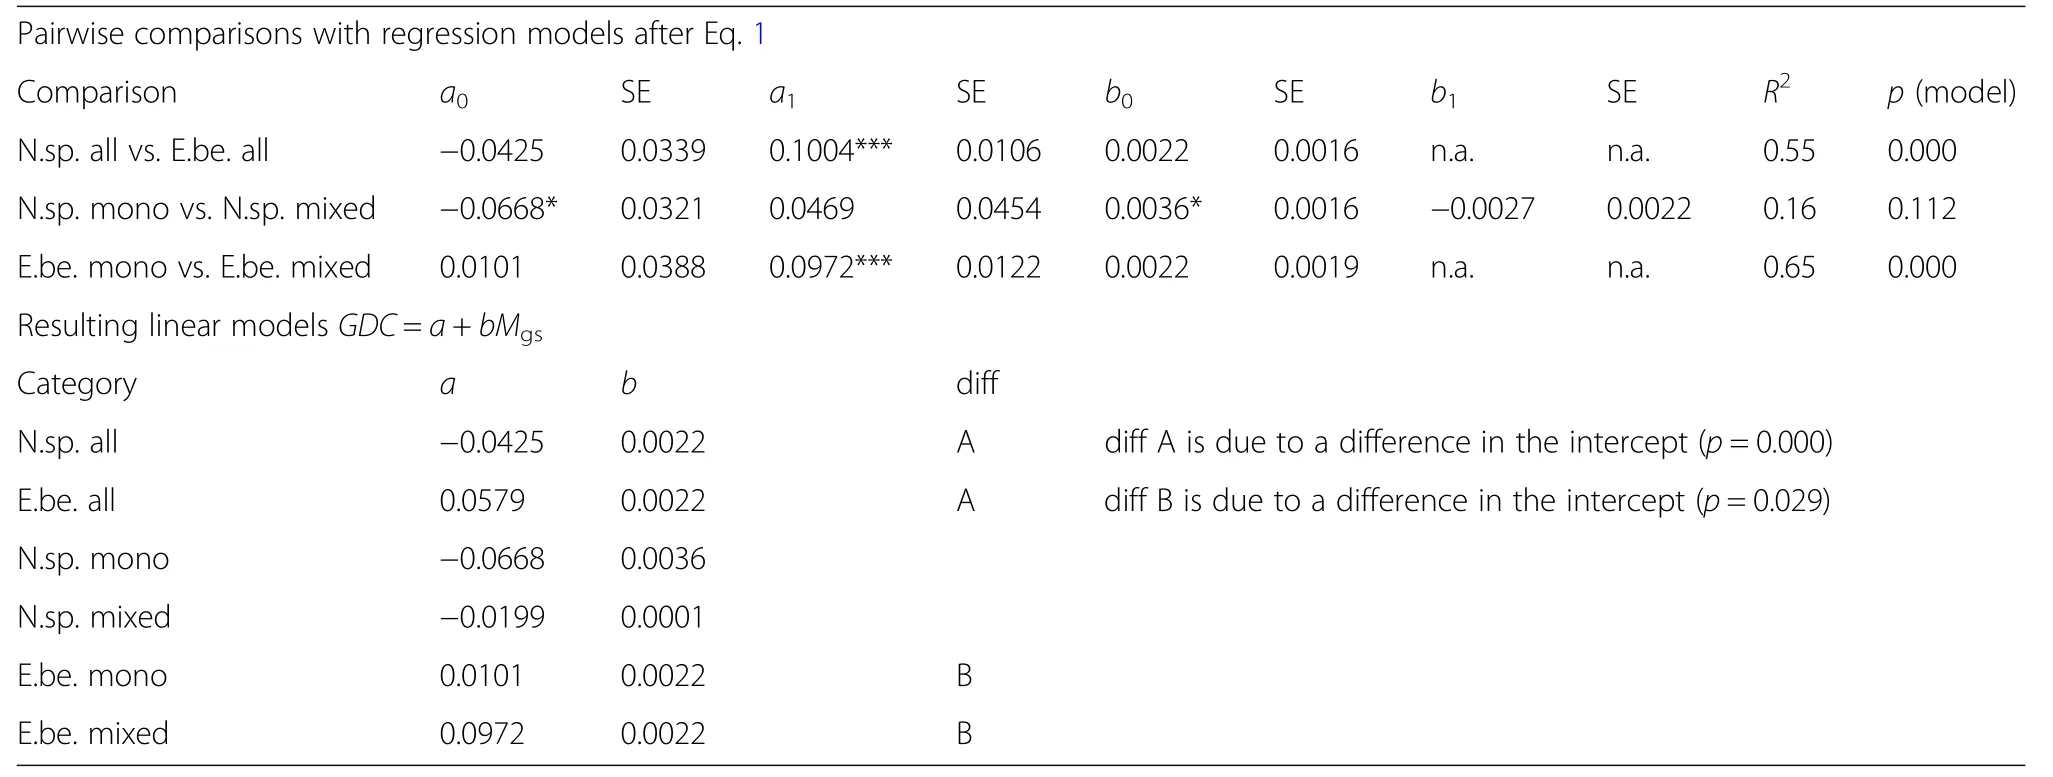
Table 8 Upper part:Results of the pairwise comparisons by fitting Eq.3(corresponding to Q3)
Discussion
This study was motivated by the lately increasing number of drought yearsand theneed to adapt forest management to climate change.However,beyond this aspect,the revealed dependency of growth partitioning from the water availability is of general interest.It helps to better understand and model the influence of water availability on forest stand structures and dynamics.In addition,our results could be of relevance for forest biomonitoring under changing climate conditions.Other factors such as fructification(Seifert and Müller-Starck 2009)or ozone(Pretzsch et al.2010)might also have contributed to the low growth in 2011 but were neither noticed nor measured.
Evidence and explanation of modified growth partitioning under drought stress
Climate change and especially recent drought events triggered many studies showing that trends and events of environmental conditions can reduce(Dobbertin 2005;Zang et al.2012)but also accelerate tree growth(Kauppi et al.2014;Pretzsch et al.2014).The studies show that drought resistance is very species specific(Friedrichs et al.2009;Pretzsch et al.2013;Zang et al.2014),especially that deep rooting species such as sessile oak or Scots pine(Abrams 1990;Irvine et al.1998)are more drought resistant than shallow rooting ones like Norway spruce or Douglas-fir(Bréda et al.2006).Isohydric species such as Norway spruce,Scots pine or silver-fir suffer more but recover quicker under short drought events,while anisohydric species such as European beech or sessile oak decrease less in growth but may suffer by longer lasting drought events(McDowell et al.2008;Hartmann 2011).Drought stress may decrease with increasing age and size as trees get better access to water in deeper soil layers by their extended root systems(Abrams 1990;Bréda et al.2006).Other works found that resilience and resistance may decrease with size due to longer xylem path and hydraulic and stomatal limitation(Ding et al.2017).
New and interesting is our finding that drought not only severely reduces tree and stand growth but also redistributes the growth in favour of smaller trees.Thus,while moist years enhance the dominance of large trees,the distribution turns in favour of smaller ones with decreasing water availability(Fig.9).This applies especially for Norway spruce.Beech loses less stand volume growth and keeps the growth distribution between tall and small trees more constant.
This species specific reaction pattern might be explained by the isohydric character(McDowell et al.2008;Hartmann 2011)of Norway spruce.On drought and strong exposition to heat and direct solar radiation tall spruces may react with stomata closure and reduction of transpiration and growth,while smaller neighbours might even benefit from both,their shade and their reduced water consumption.Beeches,in contrast,have an anisohydric character and go on transpiring and growing even under dry conditions in both the dominant and subdominant stand layer.So,growth differences between small and tall trees in moist and or dry years are less pronounced for European beech.

Fig.9 Inter-individual growth partitioning between trees of different social positions in a stand depending on the current water availability.a In moist years,dominant trees can benefit from their preferential access to light and achieve asymmetric competition and overproportional growth rates compared with smaller neighbours.b Drought favours the growth of smaller trees in a stand on the expense of the socially dominating neighbours.c The relationship between tree size and size growth can be steep and reflect size-asymmetric dominance of tall trees in moist years.It may become shallow and reflect more symmetric growth partitioning under drought.The light green envelopesof the schematic tree crowns represent the individual growth ratesof the trees
Hara(1993),Schwinning and Weiner(1998),and Wichmann(2001)hypothesize that under moist conditions the tall trees in a stand can pre-empt the light on the expense of their small neighbours due to their superior height.The tall trees intercept more light and grow disproportionally more than the small ones as due to their size they achieve both a higher share of light interception and,by shading and suppressing their smaller neighbours,a reduction of their resource consumption such as water and mineral nutrients.
In dry and warm years a superior size may turn into a disadvantage,as large trees are more exposed to heat and hydraulic stress than their smaller neighbours.When the growth of tall trees gets water limited they do no longer benefit from their advantageous access to light.When forced to close their stomata,they consume less water and mineral nutrients;both in turn improves the growing conditions of the small trees which may benefit in addition by being shaded.The analysed stands followed such reactions patterns,and our statistical analyses suggest the relationship between water and growth partitioning as the main cause.
Whereas there were clear species specific reaction patterns,we found just tendencies,but no significant differences between monospecific stands and mixed-species settings regarding the water dependency of growth partitioning.A larger sample of trees in both groups might have yielded clearer results.
Relevance for understanding and modelling stand dynamics
While most studies deal with dominant trees,the drought reaction of smaller trees is less well known.Trees with inferior social positions may on the one hand benefit from being shaded in dry years,from the reduced water consumption of tall neighbours with isohydric behaviour(Goisser et al.2016),or from their rooting closer to the surface which means better access to occasional rainwater in summer(Flanagan et al.1992).On the other hand,being subdominant may mean less access to water and less stemflow in favour of the roots,limited access to ground water,or less water availability when stocking beside anisohydric neighbours which are continuously exploiting the available water supply(Wullschleger et al.1998;Pretzsch et al.2014;Grote et al.2016).So far,there is no accepted general pattern of how subdominant trees come off under drought in relation to dominant and predominant trees.
Most growth models allocate the growth among the trees of a population in relation to the light availability.E.g.individual tree models use competition indices for quantifying light availability of individual trees and allocate exponentially more growth to tall than to small trees.The assumption of light-dependent growth partitioning does not apply to dry years when growth of dominant trees is reduced because of drought stress.Neglect of the water limitation of tall trees in dry years may result in too asymmetric growth partitioning and too heterogeneous forest structures when modelling stand dynamics(Seifert et al.2014).
The fact that drought years reduce the growth of tall trees more strongly than the growth of small trees has an effect on the structure of forest stands.If small trees gain in relation to tall trees,they stay in the game and can widen the size distribution and vertical structuring.In both,monospecific and mixed-species stands,drought years promote the small trees in relation to the dominant trees and generate wider size differentiation and vertical heterogeneity.Without water limitation,trees are mainly competing for light.Tall trees can pre-empt the light,exert size-asymmetric competition and may suppress and outcompete their smaller neighbours.This strongly asymmetric competition turns into a more balanced competition in drought years,as small trees are more favoured than in normal years and may impede the recovery of their tall neighbours.The effect is of course not strong enough to completely change the hierarchy between small and tall trees,however,it can contribute to an increased persistence of small trees in the understorey with the above-mentioned effects on stand structure.
This structuring effect of dry years is reflected by the generally richer size differentiation and vertical heterogeneity on dry compared to moist sites(Zeller et al.2018).The relative benefit of small trees by drought yearsmeansa reduction of their mortality and accumulation of such trees in the understorey.Their additional water consumption may have a negative effect on the recovery of the tall trees in the years after the drought stress.This reduction of the recovery of the tall trees may further result in a relative benefit of the small trees,size differentiation,and vertical structuring.
Methodological considerations
The study was based on volume growth derived from stem diameter,tree height and form factors;this implies the assumption that trees keep to their normal form and increment allocation pattern along the stem axis in dry years.However,the studies by(Mette et al.2015;Trouvé et al.2015)showed that trees can reduce their growth at the height of 1.30 m more than in higher stem parts and thus shift their stem shape pattern.This means that we may overestimate the growth reduction in dry years as trees might reduce their diameter growth in the lower stem but still grow proportionally better in higher stem sections.We also neglect any possible drought effects on wood density and total biomass.When including these aspects,the results in terms of absolute growth losses may slightly change,however,the revealed relations between the reaction of small and tall trees will probably still have the same trend as the above-mentioned effects will be similar for all trees of the stand.As annual records of stand growth over long times are rare we based our study on just one experiment.It is representative for sites which are rather well supplied with water and nutrients in normal years,but strongly water limited in drought years.The site conditions,stand age phase(50–70 years),and species composition of the experiment represent many monocultures and mixed species stands in Central Europe quite well.
Relevance for monitoring health and vitality in forest stands
In order to eliminate competition effects,measurements for monitoring growth responses on drought or other kind of stress are mostly based on dominant trees of forest stands(Rigling et al.2002;Rais et al.2014).The growth response of the dominant trees is supposed to reflect the relative growth reduction of the total stand.This is correct if the relative growth reduction is similar for trees of all sizes and if the stress does not change the partitioning.We found,however,that in the drought years 2003 and 2015 the growth of dominant Norway spruces decreased to 50%or 54%of the pre-drought period.The trees on average decreased just to 58%and 71%,respectively;the small trees decreased even less or not at all(64%and 101%).So,if quantifications of stress responses and growth losses would be based just on dominant trees,such losses would be considerably overestimated.For monitoring stress responses of tree populations also the small trees should be measured,cored,or equipped with permanent increment girth tapes.
Silvicultural implications
Many current silvicultural guidelines strive for more heterogeneous stands(Utschig et al.2011;Pretzsch and Zenner 2017)as they may provide many ecosystem goods and services(Biber et al.2015;Poorter et al.2015;Mensah et al.2016;Dieler et al.2017)better than monocultures.The finding that small trees benefit in relation to tall trees from dry years and on dry sites(see also Pretzsch and Biber 2010)means that structural heterogeneity,as aimed at by many modern silvicultural guidelines,is easier to maintain on poor dry sites.A partitioning in favour of small trees may mean that small trees keep in the play and compensate growth losses of the tall ones,thus buffering stand productivity in unfavourable years.From this point of view removing the small trees would mean a reduction of both,structural heterogeneity and buffer capacity at stand level.
On the other hand,silvicultural decisions should also take into account that small trees might exert undesired effects on dominant trees under drought stress conditions;i.e.in years with ample water supply or on continuously moist sites where tree growth is mainly limited by light,small trees may contribute to stand growth without disadvantageous effects on the dominant trees.So,their elimination may hardly improve the growth of the dominant trees but lower the total stand growth as described by Pretzsch(2005).In dry years or on dry sites,in contrast,those small trees may increase the competition for water and slow down the growth of the tall trees.As they use considerable amounts of water,they may aggravate the drought stress of their taller neighbours and their recovery.So,their removal by thinning might homogenize the stand structure but increase the growth of the valuable future crop trees under stress conditions(Aussenac and Granier 1988;Martín-Benito et al.2010).Consequently,on dry sites,the thinning of the small trees may increase the stand growth as described by the uni-modal stand density-growth relationship(Assmann 1970).In wet years and on moist sites small trees can still considerably contribute to stand growth;while their contribution to stand growth is greater in dry years and on dry sites,they can become serious competitors to the dominant trees under such conditions.Their elimination may reduce drought stress and bark beetle damage(Wermelinger 2004)and increase stand growth as their tall neighbours can use the water more efficiently(Sohn et al.2013;Gebhardt et al.2014).So,if dry years occur frequently,the elimination of small trees will be favourable for the future crop trees on the expense of stand structure.However,if the frequency of dry years is low,their elimination will homogenize stand structure without beneficial effects for the remaining trees.Of course,structural heterogeneity,habitat diversity,risk prevention,potential transformation to uneven-aged structures,are good reasons why small trees may be left in a stand(del Río et al.2017).However,in view of climate change,elimination of small trees may strengthen growth and resistance of tall trees under water limited conditions.
Conclusions
In mature monospecific and mixed stands of Norway spruce and European beech we found as a general pattern that drought can alter the growth partitioning in favour of small at the expense of tall trees.This can result in a more even growth distribution between trees of different sizes and more heterogeneous stand structures under water limitation compared with moist conditions.Whereas this behaviour was evident and more pronounced in Norway spruce than European beech,wefound just tendencies,but no significant differences between monospecific stands and mixed-species stands regarding this behaviour.Because of the far-reaching consequences of this water-dependent growth partitioning and population dynamics,future studies should further explore the relationship between water supply and inter-individual growth partitioning on a broader data base.The additional effect of stand density reduction and tree species selection would be of special interest for forestry.Whereas we studied the effect of episodic drought so far,ongoing water retention experiments and transect studies along gradients of water availability might reveal whether more frequent drought events and continuous drought stress may result in stand dynamics as known from permanently dry and continental areasof,e.g.,central Spain,southwest USA,and inner South Africa.
Additional file
Additional file 1:Electronical Supplement Tables S1–S6.(DOCX 44 kb)
Abbreviations
BA:Basal area;GC:Ginicoefficient;GDC:Growth dominance coefficient;iv:Stand volume growth;iv-v relationship:Inter-individual relationship between the tree volume and tree volume growth within a population;M:Aridity index after de Martonne(de Martonne 1926);Mgs:Martonne index based on the precipitation and temperature within the growing season;OLS:Ordinary least squares;Rt:Index of drought resistance;v:Standing volume stock
Acknowledgements
The authorsthank the European Union for funding of the project“Management of mixed-speciesstands.Optionsfor a low-risk forest management(REFORM)”(FKZ:2816ERA02S).We further thank the Bayerische Staatsforsten(BaySF)for providing the experimental plot,the Bavarian State Ministry for Nutrition,Agriculture,and Forestry for permanent support of the project W07“Long-term experimentalplotsfor forest growth and yield research”(#7831-22209-2013)and the German Science Foundation(DFG)for providing the funds for the project PR292/12-1“Treeand stand-levelgrowth reactionson drought in mixed versuspure forestsof Norway spruce and European beech”.Thanks are also due to Lothar Zimmermann for providing the meteorological datafrom the nearby forest climate station Kranzberg Forest/Freising,to Ulrich Kern for the graphicalartwork,and to two anonymousreviewersfor their constructive criticism.
Funding
– Funding Source:European Union;Award Number 281116ERA02S;Recipient:Hans Pretzsch;Project Title:“Management of mixedspecies stands.Options for a low-risk forest management(REFORM)”.
– Funding Source:Bayerisches Staatsministerium für Ern?hrung,Landwirtschaft und Forsten(Bavarian State Ministry for Nutrition,Agriculture,and Forestry);Award Number W07 7831–22209-2013;Recipient:Hans Pretzsch;Project Title:“Long-term experimental plots for forest growth and yield research”.
– Funding Source:Deutsche Forschungsgemeinschaft(German Science Foundation);Award Number PR 292/12–1;Recipient:Hans Pretzsch;Project Title:“Tree and stand-level growth reactions on drought in mixed versus pure forests of Norway spruce and European beech”.
Availability of data and materials
The materials described in the manuscript including all relevant raw data will be freely available upon request from the corresponding author.
Legal statement
All research work reported in this study was performed in accordance with all relevant legislation and guidelines.
Authors’contributions
HPinitiated the study,conceptualized the study design,and wrote the draft version of the manuscript.GSconducted the field work,the laboratory work,and data analysis.PBsupported the statistical analysis and revised the manuscript.All authors read and approved the final manuscript.
Ethics approval and consent to participate
Not applicable;this study does not involve human subjects,human material,or human data.
Consent for publication
Not applicable.
Competing interests
The authors declare that they have no competing interests.Received:8 January 2018 Accepted:14 March 2018


- Forest Ecosystems的其它文章
- Predicting the provisioning potential of forest ecosystem servicesusing airborne laser scanning data and forest resource maps
- Detecting treeline dynamics in response to climate warming using forest stand maps and Landsat data in a temperate forest
- Nutrient retention and release in coarse woody debris of three important central European tree species and the use of NIRS to determine deadwood chemical properties
- Species-specific,pan-European diameter increment models based on data of 2.3 million trees
- Forests,atmospheric water and an uncertain future:the new biology of the global water cycle
- Dendroclimatic analysis of white pine(Pinusstrobus L.)using long-term provenance test sites across eastern North America