
Response of North Pacific Eastern Subtropical Mode Water to Greenhouse Gas Versus Aerosol Forcing
2016-11-24 11:33:46XiangLIandYiyongLUOPhysicalOceanographyLaboratoryOceanUniversityofChinaQingdao266100
Advances in Atmospheric Sciences 2016年4期
Xiang LI and Yiyong LUOPhysical Oceanography Laboratory,Ocean University of China,Qingdao 266100
Response of North Pacific Eastern Subtropical Mode Water to Greenhouse Gas Versus Aerosol Forcing
Xiang LI and Yiyong LUO?
Physical Oceanography Laboratory,Ocean University of China,Qingdao 266100
Mode water is a distinct water mass characterized by a near vertical homogeneous layer or low potential vorticity,and is considered essential for understanding ocean climate variability.Based on the output of GFDL CM3,this study investigates the response of eastern subtropical mode water(ESTMW)in the North Pacific to two different single forcings:greenhouse gases(GHGs)and aerosol.Under GHG forcing,ESTMW is produced on lighter isopycnal surfaces and is decreased in volume.Under aerosol forcing,in sharp contrast,it is produced on denser isopycnal surfaces and is increased in volume. The main reason for the opposite response is because surface ocean-to-atmosphere latent heat flux change over the ESTMW formation region shoals the mixed layer and thus weakens the lateral induction under GHG forcing,but deepens the mixed layer and thus strengthens the lateral induction under aerosol forcing.In addition,local wind changes are also favorable to the opposite response of ESTMW production to GHG versus aerosol.
greenhouse gases,aerosol,mode water,lateral induction,North Pacific
1.Introduction
Mode water is a distinct water mass with vertical consistency of temperature,density and salinity,found in the permanent thermocline.The main feature of mode water is that it can carry low potential vorticity(PV)water from the mixed layer into the subsurface interior,which makes the upper ocean and the underlying layers connected.Formation regions of mode waters are of particular importance for issues of climate change,since they are areas where atmospheric variability is transmitted to large volumes of water that then penetrate,and are furthermore sequestered,below the surface layer.These regions therefore provide a link between the shorter time scales of the atmosphere and the longer time scales of the oceanic subsurface layers.Mode waters that are subducted in the northern region of the subtropical gyre impact the water-mass properties of the thermocline,and they are characterized by recirculation patterns with decadal time scales.Indeed,variability in these mode waters has been hypothesized to be an important part of midlatitude oceanatmosphere feedback scenarios of decadal variability(e.g., Latif and Barnett,1994).Variations in their properties,including temperature,salinity and PV,could impact decadal feedback directly by altering ocean temperature,and indirectly by altering the circulation.
The subduction of mode waters can be accomplished by Ekman pumping and lateral induction(Marshall et al.,1993), and the latter has been found to play a more important role in the formation of mode waters(Huang and Qiu,1994;Nakamura,1996).This is in agreement with the work of Inui et al. (1999),who found that the path of low-PV water(i.e.,mode water)on each isopycnal surface starts from points where the isopycnal outcropping line intersects the winter mixed layer depth(MLD)horizontal gradients(i.e.,MLD front).The overlap of deep mixed layer regions with isopycnal outcrops is critical in this process;the deep mixed layers provide the low PV water,whereas the layer outcrop sets the density and provides the pathways into the interior.Once the mode water has been isolated from surface forcing,horizontal advection spreads it and its evolution is well beyond the formation area.
In the North Pacific,three kinds of mode water have been identified.Western subtropical mode water(WSTMW) is formed to the south of the Kuroshio Extension and is distributed around the northwestern part of the subtropical gyre,and central mode water(CMW)is formed to the north of the Kuroshio Extension and is distributed in the central part of the northern subtropical gyre.The third one,eastern subtropical mode water(ESTMW),is formed in the eastern part of the subtropical gyre.ESTMW is centered at (30?N,140?W)with a temperature range of 16?C-22?C and a density range of 24.0-25.4 kg m?3(Hautala and Roemmich,1998).Despite it being weaker than WSTMW andCMW in terms of thickness and area of extent(Hanawa and Talley,2001),ESTMW is worthy of study because its formation region sits along an important conduit for the subtropical-tropical inter-gyre exchange in the North Pacific Ocean.
?Authors 2016
Recent studies have investigated the formation mechanism as well as the climate variability of ESTMW.For example,Toyoda et al.(2004)studied its climatological formation mechanismanddemonstratedtheimportanceofthepreconditioning of the mixed layer over the formation region.Further, Toyoda et al.(2011)examined the interannual variability of ESTMW by analyzing a 1990s ocean dataset from a 4D variational data assimilation experiment.Hu et al.(2011)investigated the mechanism of interannual-to-decadal variability of the subduction rate over the ESTMW formation area during 1958-2001 and found the variability of the wind stress curl plays a dominant role.To explore its response to global warming,Luo et al.(2009)compared solutions from a set of coupled climate models between a present-day climate and a futurewarmerclimateandfoundthatglobalwarminginduces a significant reduction in the volume of the ESTMW.This change is due to a more stratified upper ocean and a shoaling of the winter MLD,resulting mainly from a reduction of the ocean-to-atmosphere heat loss over the eastern subtropical North Pacific.
Of the human-caused changes to climate forcing,while greenhouse gases(GHGs)warm the planet,aerosols(tiny suspended particles or droplet in the atmosphere)tend to cool.Aerosols differ from GHGs in that their lifetime in the atmosphere is short(a few weeks),before they settle or wash out.Therefore,the cooling effect from aerosols is believed to be regional rather than global,like it is for GHGs(Mitchell et al.,1995).Based on GFDL CM3 output,Wang et al. (2013)recently evaluated both the warming effect of GHGs and the cooling effect of aerosols on WSTMW,as well as a closely related subtropical countercurrent in the North Pacific.Their results show that GHG(aerosol)forcing induces a weakening(strengthening)of WSTMW and thus a deceleration(acceleration)of the subtropical countercurrent,and the cooling effect of aerosols exceeds the warming effect of GHGs.
For this study,we pay particular attention to ESTMW and examine how the aerosol-induced cooling effect competed with the GHG-induced warming effect in the formation of ESTMW in the North Pacific during the past century.Our main finding is that the response of ESTMW to GHGs and aerosols is just the opposite.Under GHG forcing,ESTMW is decreased in volume and produced on lighter isopycnal surfaces,while it is produced on denser isopycnal surfaces and its volume is significantly increased under aerosol forcing.
This paper is organized as follows:Section 2 briefly describes the model and simulations.Section 3 examines the response of ESTMW in the North Pacific to GHG versus aerosol forcing.Section 4 discusses the formation mechanisms of the opposite response of ESTMW to GHG and aerosol,and a summary is given in section 5.
2.Model and data
We analyze simulations from the newest version of NOAA-GFDL's climate model,CM3.Compared with its earlier version,CM2.1,CM3 represents an evolutionary step with emphasis on improving formulational aspects and capabilities of the atmosphere and land components(Donner et al.,2011;Griffies et al.,2011).CM3 uses a flexible modeling system to couple the GFDL Atmospheric Model version 3(AM3)with the Modular Ocean Model version 4p1 (MOM4p1).AM3 employs a cubed-sphere implementation of the finite-volume dynamical core.Its horizontal resolution is approximately 200 km,and its vertical resolution ranges from approximately 70 m near the Earth's surface to 1-1.5 km near the tropopause and 3-4 km in much of the stratosphere.MOM4p1 employs a finite difference approach to solve the primitive equations.Its resolution is 1?in both latitude and longitude,with refined meridional resolution equatorward of 30?so that it reaches(1/3)?at the equator.The model has 50 levels in the vertical direction with 22 levels of 10-m thickness in the top 220 m.A tripolar horizontal grid with poles over Eurasia,North America and Antarctica is used to avoid polar filtering over the Arctic.Through experiments with historical radiative forcing,notable improvements are apparent in the CM3 climate simulation relative to CM2.1,including more realistic aerosol direct effects,a better shortwave cloud forcing,a modified SST bias pattern,and reduced biases in the Arctic SLP and sea-ice cover.
As a major U.S.climate model contributing to CMIP5,a number of experiments with CM3 have been performed following CMIP5 protocol(Taylor et al.,2012).These runs include pre-industrial control,historical all forcing,as well as single forcing simulations for the years 1860-2005.The historical all forcing runs enable evaluation of model performance against present climate and observed climate change, and the single forcing runs aim to attribute observed climate change to particular causes,in which two major experiments are performed to yield estimates of the contribution of GHG forcing(GHG-only simulation)and aerosol forcing(aerosolonly simulation)to climate change.
In this paper,we analyze solutions from the GHG-only, aerosol-only,and historical all forcing simulations.Three members of each simulation are selected and their ensemble means are obtained,which effectively remove natural variability from an individual simulation.The results presented below are through two types of analyses:trends are the linear least-squares regressions of each quantity over 1900-2005, and monthly climatology is averaged over 1950-2005.A note is that the pre-industrial control experiment is used as a reference,and the trend analysis is performed on the difference of the ensemble runs from the control run.
3.Results
3.1.Mixed layer depth and lateral induction
As mentioned previously the lateral induction process is more important in producing ESTMW in the North Pacific.Since the lateral induction,defined as horizontal advection across the sloping mixed layer base,becomes large during winter when the mixed layer deepens,in this section we examine both the winter MLD and lateral induction.
The MLD reaches its seasonal maximum during winter in the North Pacific.For the historical run(Fig.1c),a local maximum(~200 m)is found in the eastern subtropics centered at(30?N,140?W),corresponding to the formation region of ESTMW(Hosoda et al.,2001).While the maximum winter MLD appears to be deeper in the model,its spatial pattern is in good agreement with observations(Suga et al., 2004;Toyoda et al.,2011).
Comparing the GHG-only run(Fig.1a)with the historical all forcing run(Fig.1c),although the overall horizontal spatial structure of the winter MLD does not change much, it shoals in the eastern subtropics with its maximum approximately 40 m shallower near the center.Such a change in the mixed layer is associated with smaller MLD horizontal gradients,which in turn will result in weaker lateral induction and thus a decrease of ESTMW.Comparing the aerosol-only run (Fig.1b)with the historical all forcing run(Fig.1c),however,the local mixed layer in the eastern subtropics is seen to deepen,with its maximum approximately 20 m deeper around the center.This change in the mixed layer is associated with larger MLD horizontal gradients,which in turn will result in stronger lateral induction and thus an increase of ESTMW.Furthermore,in comparison with the historical all forcing run,the mixed layer density appears to be lighter in the GHG-only run but denser in the aerosol-only forcing run.
Over the eastern subtropical region of the North Pacific, therefore,we find that,in stark contrast to the GHG forcing, which produces a shallower mixed layer and thus a weaker MLD front,the aerosol forcing induces a deeper mixed layer and thus a stronger MLD front.The opposite response of the MLD to the GHG and aerosol forcing can be further verified by their trends.For the GHG run(Fig.1d),the MLD exhibits a falling trend over the entire eastern basin,with more significance close to the ESTMW formulation center where the maximum trend exceeds?60 m(100 yr)?1.This indicates that GHG forcing induces more shoaling in the maximum MLD area compared to its surrounding regions,resulting in a weaker MLD front and thus a decrease of lateral induction. For the aerosol run(Fig.1e),just the opposite occurs;the MLD exhibits a distinct rising trend[~60 m(100 yr)?1]in the deep MLD area but a falling trend[?40 m(100 yr)?1]to the southeast.Such a change in the MLD leads to a stronger MLD front and thus an increase of lateral induction.For the historical run(Fig.1f),as a result of the combination of the two forcings,the spatial pattern of the MLD trend is similar to that in the aerosol run,indicating that the aerosol effect exceeds the GHG effect on the MLD.
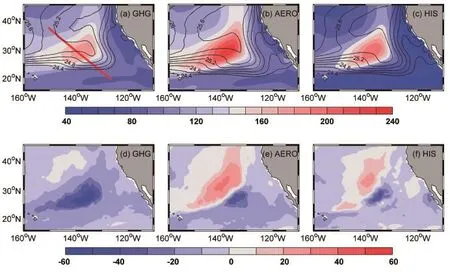
Fig.1.Mean depth(color shading;units:m)and density(contour interval=0.2 kg m?3)of the March mixed layer from the (a)GHG-only simulation,(b)aerosol-only simulation,and(c)historical all forcing simulation.Trends of March mixed layer depth[color shading;units:m(100 yr)?1]from the(d)GHG-only simulation,(e)aerosol-only simulation,and(f)historical all forcing simulation.In this and following figures,trends are the linear least-squares regressions of each quantity over 1900-2005.
Next we examine the lateral induction,which is believed to play an important role in producing the ESTMW in theNorth Pacific.The lateral induction is estimated by uuum·?hm, in which uuumis the horizontal velocity at the bottom of the mixed layer and hmis the MLD.Figure 2 compares the response of the lateral induction to GHG and aerosol forcing with the historical run.In the eastern part of the subtropical gyre,large lateral induction appears to the southeast of the deep MLD where the strong MLD front is located.For the historical run(Fig.2c),its maximum exceeds 130 m yr?1. While the area of the lateral induction is found to shrink due to GHG forcing,with its maximum being reduced to only about 100 m yr?1(Fig.2a),the area expends largely due to aerosol forcing,with its maximum being enhanced to 160 m yr?1(Fig.2b).The opposite response of the lateral induction is further confirmed by their linear trends,i.e.,to the southeast of the deep MLD area the GHG forcing induces a falling trend of?60 m yr?1(100 yr)?1(Fig.2d)but the aerosol forcing induces a rising trend of 100 m yr?1(100 yr)?1(Fig. 2e).In addition,the result of the historical run suggests that the cooling effect of aerosols exceeds the warming effect of GHGs on the lateral induction(Fig.2f),consistent with the findings above from the response of the MLD.
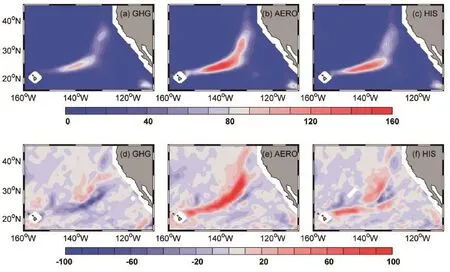
Fig.2.Mean lateral induction(color shading;units:m yr?1)in March from the(a)GHG-only simulation,(b)aerosol-only simulation,and(c)historical all forcing simulation.Trends of March lateral induction[color shading;units:m yr?1(100 yr)?1] from the(d)GHG-only simulation,(e)aerosol-only simulation,and(f)historical all forcing simulation.
3.2.Eastern subtropical mode water
Mode waters are characterized by the vertical homogeneity of their properties,which is quantitatively summarized by its PV.The PV is defined as(f/ρ)(Δρ/Δz),in which f is the Coriolis parameter,ρis seawater density,and Δρ/Δz is the vertical gradient of the density.After strong subduction during the winter season,the intensity of newly formed mode watercanbemeasuredbylow-PVwatervolumeinlatespring near the formation region.Figure 3a shows the volume of the low-PV water in May for each density class from 24.6 to 25.8 kg m?3between the layers defined by the adjacent isopycnals at 0.1 kg m?3interval within the region between 130?-160?W and 15?-25?N.
IftheESTMWisrepresentedbyPV<1.5×10?10m?1s?1, the core density classes are found to be 25.0-25.2 kg m?3in the GHG run,25.4-25.6 kg m?3in the aerosol run,and 25.3-25.5 kg m?3in the historical,respectively,i.e.,the ESTMW forms on lighter isopycnal surfaces due to GHG forcing but on denser isopycnal surfaces due to aerosol forcing.In addition,the ESTMW volume in the core density layers appears to be smallest in the GHG forcing run,largest in the aerosol forcing run,and somewhere in between in the historical all forcing run.To be more specific(Table 1),its volume is increased by 0.48×10¹⁴m3,or 17%,from 2.80×10¹⁴m3in the historical simulation to 3.28×10¹⁴m3in the aerosol-only simulation,while it is decreased by 1.46×10¹⁴m3,or 52%, to 1.34×10¹⁴m3in the GHG-only simulation.Figure 3b shows the linear trends of the low-PV water volume for each density class in the scenario runs.It is clear that the volume trend in the GHG run is falling for all density classes,with mostsignificancefrom25.2to25.4kgm?3,whilethevolume trend in the aerosol run is rising for all density classes,with most significance from 25.3 to 25.5 kg m?3.Additionally, the aerosol effect appears again to exceed the GHG effect, resulting in a rising trend of the ESTMW volume in the historical run.Note there is a trend in the control run(Fig.3b),which is the climate drift.In the absence of external forcing,climate models often exhibit long-term trends that cannot be attributed to natural variability.This so-called climate drift arises for various reasons,including perturbations to the climate system in the coupling together of component models,and deficiencies in model physics and numerics.Climate drift is common among the CMIP5 models(Sen Gupta et al., 2013).
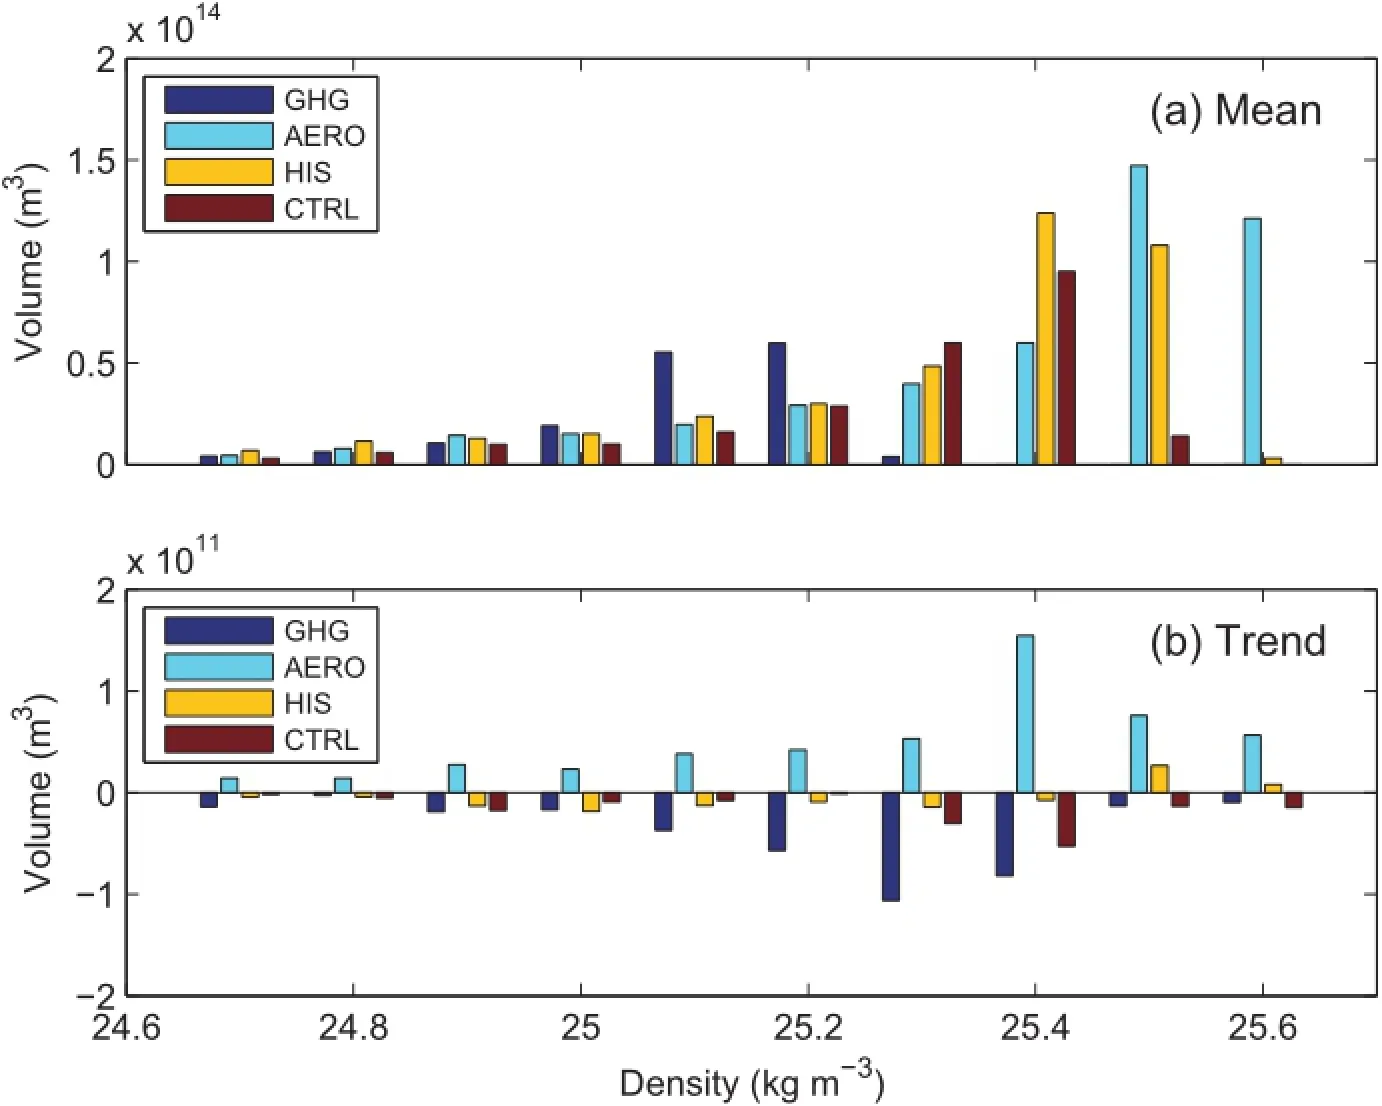
Fig.3.The(a)mean and(b)trend of May low-PV(<1.5×10?10m?1s?1)water volume for each density class within the region between 130?-160?W and 15?-25?N.
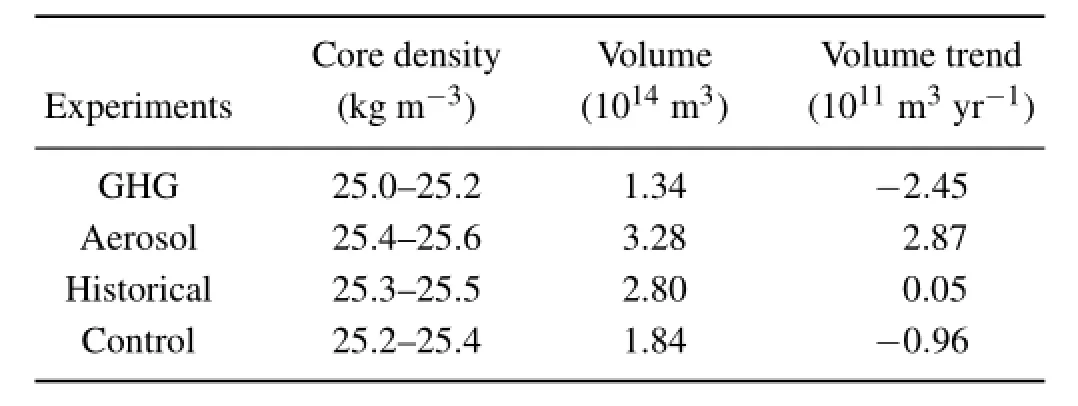
Table 1.Core density layers,mean and trend of the ESTMW volume from the experiments in this study.
The distributions of May PV are shown in Fig.4 on the core density isopycnal surfaces,as well as along latitudinal and longitudinal sections for the three simulations.Comparing the aerosol-only simulation with the historical simulation,it can be clearly seen that the region with low-PV water in the eastern subtropics is expanded both horizontally and vertically,indicating that the aerosol forcing induces a significant increase in volume of the ESTMW.Comparing the GHG-only simulation with the historical simulation,we see that the region with low-PV water is reduced both horizontally and vertically,indicating that the GHG forcing induces a reduction in volume of the ESTMW,which is in agreement with previous studies(Luo et al.,2009).
4.Formation mechanisms
As demonstrated above,a spatially non-uniform shoaling(deepening)of the mixed layer in the eastern subtropics is associated with a weakening(strengthening)of lateral induction,corresponding to the decreased(increased)ESTMW in the North Pacific under GHG(aerosol)forcing.Since the mixed layer change is typically related to the surface forcing change,here we examine the changes in the surface heat flux and wind stress in both the GHG-only and aerosol-only simulations.
Under GHG forcing,the ocean-to-atmosphere heat loss (Fig.5)is reduced around the center of the ESTMW formation area but increased to its southeast.Such a change in the heat flux results in decreased MLD horizontal gradients and thus reduced lateral induction,leading to less mode water formed in the eastern subtropical gyre.Under aerosol forcing,however,the heat loss over the region is significantly increased,with the maximum being more than 12 W m?2around the center.This change of the surface heat flux produces a less stratified upper ocean and a resultant deepening of the MLD.As a result,the lateral induction is increased and more mode water is produced in the eastern subtropics.For the historical run,similar to what happens under aerosol forcing,the heat loss is increased over the region and thus the formation of the ESTMW is intensified.Among the four physical components included in the heat flux(i.e.,shortwave radi-ation,longwave radiation,sensible heat flux,and latent heat flux),further analysis indicates that the contribution from the latent heat loss is predominant(not shown).
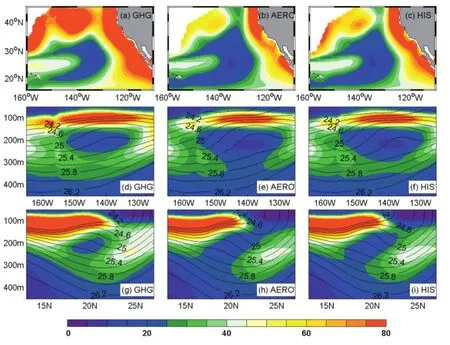
Fig.4.Potential vorticity(color shading;units:10?11m?1s?1)in May in the core density classes from the(a)GHG-only simulation,(b)aerosol-only simulation,and(c)historical all forcing simulation.Potential vorticity(color shading;units:10?11m?1s?1)and density(contour interval=0.2 kg m?3)in May along the 20.5?N section from the(d)GHG-only simulation,(e) aerosol-only simulation,and(f)historical all forcing simulation.Potential vorticity(color shading;units:10?11m?1s?1)and density(contour interval=0.2 kg m?3)in May along the 150?W section from the(g)GHG-only simulation,(h)aerosol-only simulation,and(i)historical all forcing simulation.
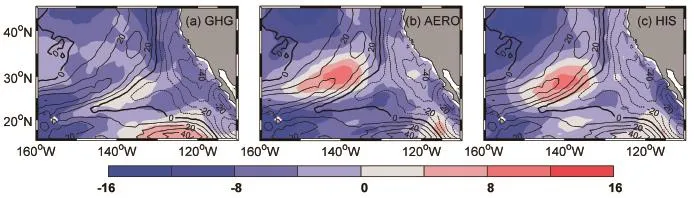
Fig.5.Ocean-to-atmosphere heat flux changes(color shading;units:W m?2)from the pre-industrial control experiment in the (a)GHG-only simulation,(b)aerosol-only simulation,and(c)historical all forcing simulation.Superimposed is the climatological ocean-to-atmosphere heat flux(contour interval=10 W m?2)in the control experiment.
As mentioned previously,the lateral induction is associated with the MLD front and the horizontal velocity across the sloping mixed layer base.Now that changes in the former have been found to play an important role in the response of the lateral induction to GHG and aerosol forcing,next we examine if changes in the latter also contribute to the lateral induction response.To examine this,we select a slanted sectionacross the ESTMW formation region from(38?N,150?W) to(20?N,128?W)(the thick red line in Fig.1a).Figure 6 shows the horizontal velocity changes in the GHG,aerosol and historical runs along the slanted section,respectively. For the mean velocity fields(contours in Fig.6),a southeastward current of~1 cm s?1appears over the large MLD front area,which is apparently favorable to the formation of the ESTMW.Under GHG(aerosol)forcing,this southeastward velocity is reduced(increased)by approximately 0.2 cm s?1, contributing to the lesser(greater)production of ESTMW. For the historical run,as a result of the combination of the two forcing effects,its change is similar to that for the aerosol run,demonstrating that the aerosol effect exceeds the GHG effect on the velocity fields.Therefore,the above analysis suggests that the response of lateral induction to GHG and aerosol forcing is a result of changes in both the strength of the MLD front and the horizontal velocity across the sloping mixed layer base over the ESTMW formation region.
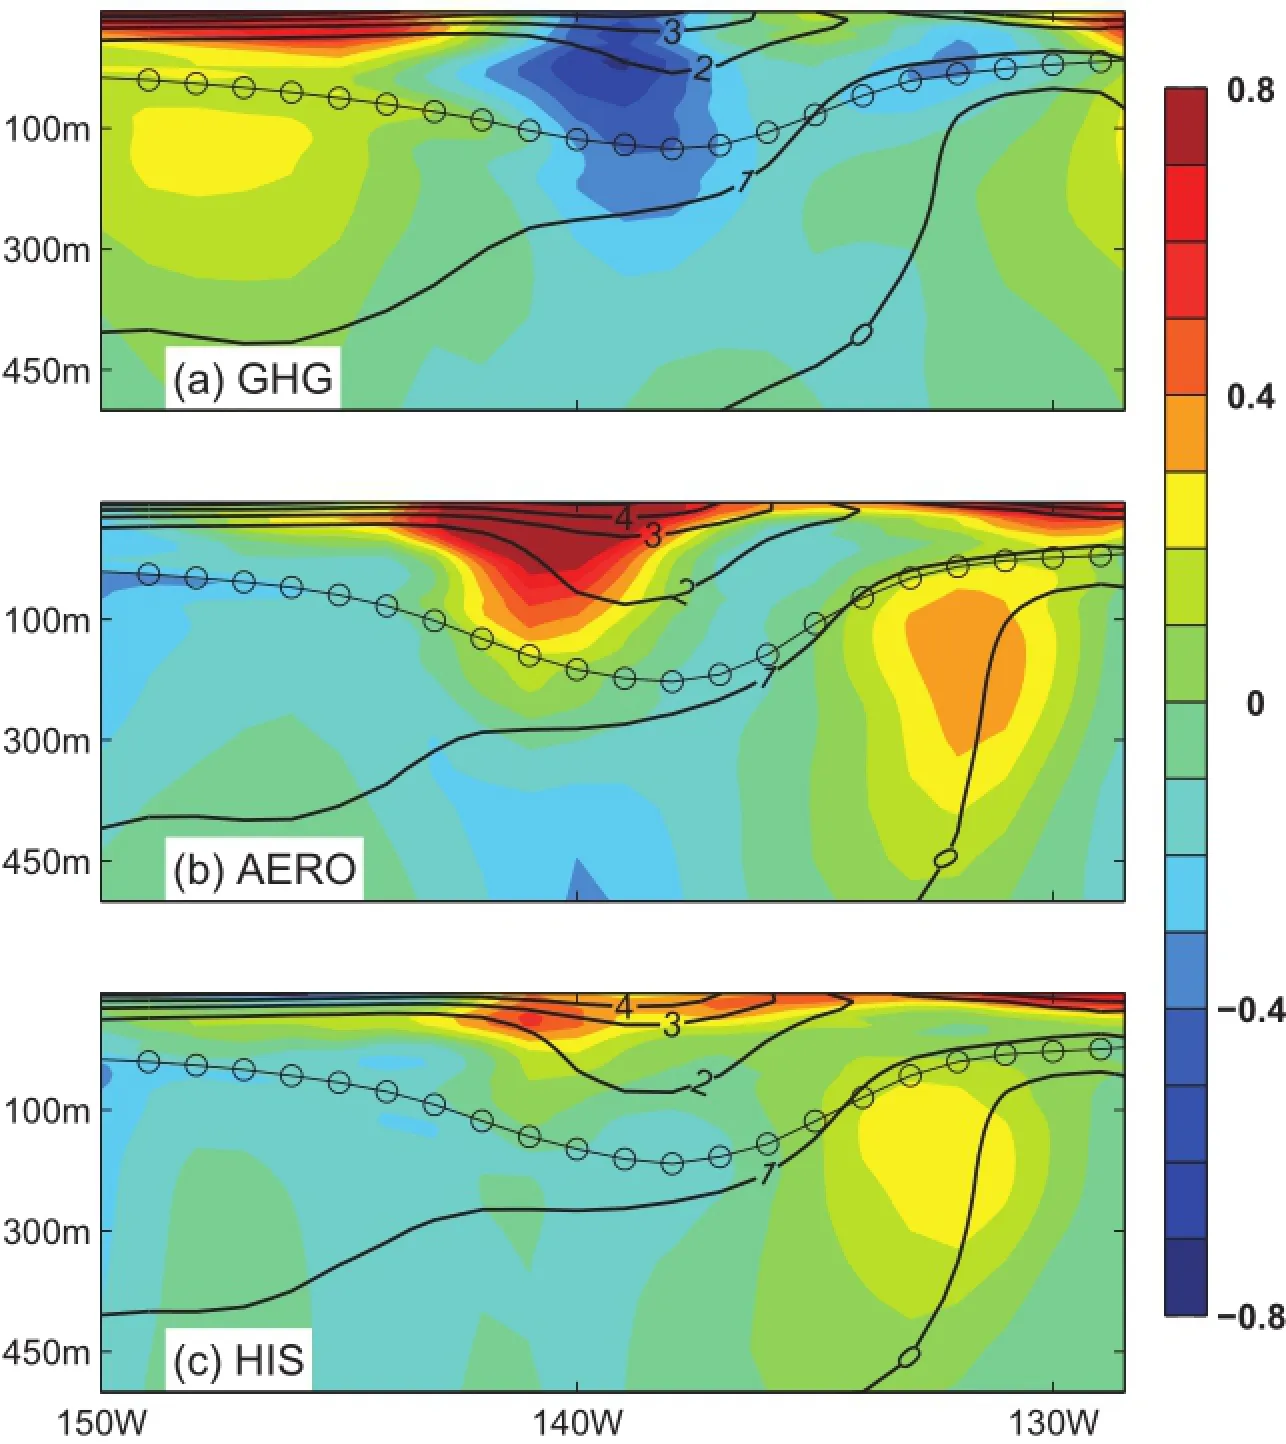
Fig.6.Trends of horizontal velocity[color shading;units:cm s?1(100 yr)?1]along the slanted section(thick red line in Fig.1a)from the(a)GHG-only simulation,(b) aerosol-only simulation,and(c)historical all forcing simulation.Superimposed are the climatological velocity(contour interval=1 cm s?1)and mixed layer depth(circled line)in each experiment.
To estimate the relative contribution from the changes in the MLD versus horizontal velocity to the lateral induction, wechooseasmallareawherethechangesinthelateralinduction reach their maxima under both GHG and aerosol forcing. It is found that the lateral induction is reduced by 30 m yr?1from 86 m yr?1in the control run to 56 m yr?1in the GHG run,with 80%of this reduction(i.e.,24 m yr?1)from the MLD change and 20%(i.e.,6 m yr?1)from the horizontal velocity change.Meanwhile,it is increased by 34 m yr?1from 86 m yr?1in the control run to 120 m yr?1in the aerosol run,with 68%of this increase(i.e.,23 m yr?1)from the MLD change and 32%(i.e.,11 m yr?1)from the horizontal velocity change.Therefore,the MLD change plays a dominant role in the change of ESTMW in the North Pacific under both GHG and aerosol forcing.
For the changes in wind stress(Fig.7),the northeast trade winds are weakened(intensified)under GHG(aerosol)forcing,leading directly to local mixed layer shoaling(deepening)due to weaker(stronger)wind stirring.Those changes in the latent heat flux described above can be caused by the weakened(intensified)northeast trade winds under GHG (aerosol)forcing,which promotes less(more)heat loss from theoceanintotheatmospherethroughthewind-evaporation-SST feedback mechanism(Xie et al.,2010).
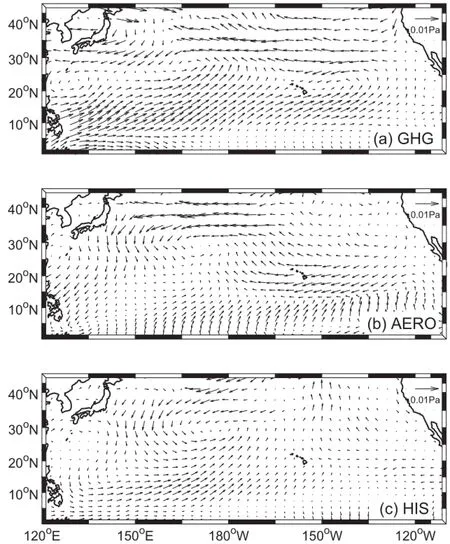
Fig.7.Wind stress changes from the pre-industrial control experiment in the(a)GHG-only simulation,(b)aerosol-only simulation,and(c)historical all forcing simulation.
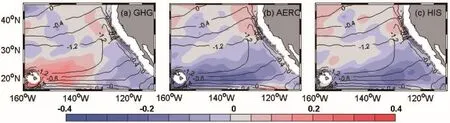
Fig.8.Ekman pumping changes(color shading;units:10?8m s?1)from the pre-industrial control experiment in the(a) GHG-only simulation,(b)aerosol-only simulation,and(c)historical all forcing simulation.Superimposed is the climatological Ekman pumping(contour interval=0.4×10?8m s?1)in the control experiment.
In addition to lateral induction,the subduction of ESTMW in the North Pacific can also be accomplished through Ekman pumping(e.g.,Huang and Qiu,1994).Under GHG forcing,the wind changes result in a reduced Ekman pumping(downward is negative)in the eastern subtropical North Pacific(Fig.8a),weakening the ESTMW formation.Under aerosol forcing,the Ekman pumping is significantly enhanced over the region(Fig.8b),strengthening the ESTMW formation.For the historical run,similar to what happens under aerosol forcing,the Ekman pumping over the region is increased and thus the formation of the ESTMW is intensified(Fig.8c).For the central area between 150?-130?W and 20?-35?N,the Ekman pumping is found to be 34 m yr?1in the GHG run,37 m yr?1in the aerosol run,and 35 m yr?1in the historical run.
Figure 9 shows the vertical distribution of temperature along the slanted section for the three scenario runs.It is interesting to see that there is a cold(warm)anomaly right beneath the mixed layer around the center of the ESTMW formation region under GHG(aerosol)forcing.Such a change in the temperature in the vertical direction results from the changes in the mixed layer depth and the thermocline,due to the changes in the surface heat flux and winds in response to the GHG and aerosol forcing.A vertical movement of the thermocline changes the subsurface temperature through Ekman pumping,directly forced by the wind stress curl change,which appears to be positive(negative)under the GHG(aerosol)forcing over the eastern subtropical North Pacific(Figs.8a and b).Note that positive(negative)wind stress curl anomalies shoal(deepen)the thermocline and produce cold upwelling(warm downwelling)in the North Hemisphere.This is in agreement with the findings of Han et al. (2006).Through an analysis of observed data and model solutions for the second half of the last century,they found that, while increased GHGs act to warm up the upper ocean by increasing downward surface heat flux,anomalous winds in the tropics cause upward Ekman pumping velocity and shoal the thermocline,resulting in an upper-thermocline cooling.For the historical run(Fig.9c),there a warm anomaly appears from the surface down to the thermocline,with more warming around the bottom of the mixed layer.This is a result of the combined forcing from GHGs and aerosols.
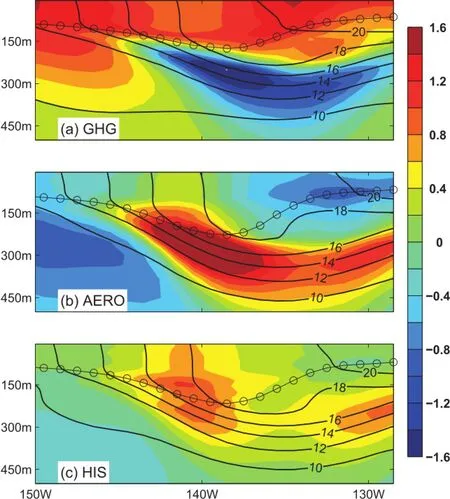
Fig.9.Trends of temperature[color shading;units:?C(100 yr)?1]along the slanted section(thick red line in Fig.1a)from the(a)GHG-only simulation,(b)aerosol-only simulation,and(c)historical all forcing simulation.Superimposed is the climatological temperature(contour interval=2?C)and mixed layer depth(circled line)in each experiment.
5.Summary and discussion
By comparing solutions between the single forcing simulations and historical all forcing simulation for the past century from GFDL CM3,this study examined the response of MLD,lateral induction,and mode water in the eastern subtropics of the North Pacific to GHG and aerosol forcing.Under GHG(aerosol)forcing,ESTMW is produced on lighter(denser)isopycnal surfaces and is significantly weak-ened(strengthened)in terms of its formation and evolution. The weakening(strengthening)of ESTMW is due mainly to a reduction(increase)in lateral induction,resulting from a weakening(strengthening)of both MLD horizontal gradients and horizontal velocity at the bottom of the mixed layer over the southeast of the deep MLD area.Further,the weakening(strengthening)of the MLD front arises from a reduction(increase)in local ocean-to-atmosphere latent heat loss, which tends to produce a more(less)stratified upper ocean and thus a shoaling(deepening)of the MLD over the formation region of the ESTMW in the North Pacific.In addition,reduced(enhanced)Ekman pumping resulting from GHG(aerosol)induced wind change contributes directly to a lesser(greater)production of ESTMW.As the aerosol effect exceeds the GHG effect,the spatial patterns of these above changes in the historical simulation are similar to those in the aerosol simulation.
To validate the response of the ESTMW to the warming effect of GHGs,we also analyzed the RCP4.5 and RCP8.5 simulations with GFDL CM3.The RCP simulations are future climate projections that resemble a stronger version of the GHG simulation.Results show that the production of ESTMW in the North Pacific is significantly reduced under both the RCP4.5 and RCP8.5 simulations,which is similar to the response to the GHG forcing and thus supports the findings of this study.
It is important to mention that,limited by the fact that our study relies on only one model,the results could be model-dependent.For example,large uncertainty has been found in the magnitude and spatial pattern of anthropogenic aerosol forcing among the CMIP5 models(e.g.,Rotstayn et al.,2012).Therefore,the response of ESTMW to aerosol forcing may feature large inter-model diversity.Using a range of climate models within the CMIP5 framework,further research is needed to better understand the mechanisms and the extent to which these findings from the present study are model-dependent.
Lastly,we would like to point out that GFDL CM3 is non-eddy-resolving,and that may be called into question for simulating the ESTMW in the North Pacific.In non-eddyresolving models,subduction on a given isopycnal surface is limited to the cross point between the MLD front and the outcrop line;whereas,in eddy-resolving models and observations,subduction takes place in a broader,zonally elongatedbandwithinthedeepmixedlayerregion.Arecentstudy found that mesoscale eddies significantly enhance the total subduction rate,helping create remarkable peaks in the volume histogram that correspond to the WSTMW and CMW in the North Pacific(Xu et al.,2014).
Acknowledgements.This work was supported by the National Basic Research Program of China(Grant No.2012CB955600),National Natural Science Foundation of China(Grant Nos.41376009 and 41176006),Strategic Priority Research Program of the Chinese Academy of Sciences(Grant Nos.XDA11010302 and XDA11010201),and the Joint Program of Shandong Province and National Natural Science Foundation of China(Grant No. U1406401).Y.Y.LUO would also like to acknowledge the support from the Zhufeng and Taishan Projects of the Ocean University of China.
Open Access This article is distributed under the terms of the Creative Commons Attribution 4.0 International License(http://creativecommons.org/licenses/by/4.0/),which permits unrestricted use,distribution,and reproductioninany medium,provided you give appropriate credit to the original author(s)and the source,provide a link to the Creative Commons license,and indicate if changes were made.
REFERENCES
Donner,L.J.,and Coauthors,2011:The dynamical core,physical parameterizations,and basic simulation characteristics of the atmospheric component AM3 of the GFDL global coupled model CM3.J.Climate,24,3484-3519,doi:10.1175/2011 JCLI3955.1.
Griffies,S.M.,and Coauthors,2011:The GFDL CM3 coupled climate model:Characteristics of the ocean and sea ice simulations.J.Climate,24,3520-3544,doi:10.1175/2011JCLI 3964.1.
Han,W.Q.,G.A.Meehl,and A.X.Hu,2006:Interpretation of tropical thermocline cooling in the Indian and Pacific oceans during recent decades.Geophys.Res.Lett.,33,L23615,doi: 10.1029/2006GL027982.
Hanawa,K.,and L.D.Talley,2001:Mode waters.Ocean Circulation and Climate,G.Siedler,J.Church,and J.Gould,Eds., International Geophysical Series,Vol.77,Academic Press, 373-400.
Hautala,S.L.,and D.H.Roemmich,1998:Subtropical mode water in the northeast Pacific Basin.Journal of Geophysical Research:Oceans,103,13 055-13 066.
Hosoda,S.,S.P.Xie,K.Takeuchi,and M.Nonaka,2001:Eastern North Pacific subtropical mode water in a general circulation model:Formation mechanism and salinity effects.J. Geophys.Res.,106,19 671-19 681.
Hu,H.B.,Q.Y.Liu,Y.Zhang,and W.Liu,2011:Variability of subductionratesofthesubtropicalNorthPacificmodewaters. Chinese Journal of Oceanology and Limnology,29,1131-1141.
Huang,R.X.,and B.Qiu,1994:Three-dimensional structure of the wind-driven circulation in the subtropical North Pacific. J.Phys.Oceanogr.,24,1608-1622.
Inui,T.,K.Takeuchi,and K.Hanawa,1999:A numerical investigation of the subduction process in response to an abrupt intensification of the westerlies.J.Phys.Oceanogr.,29,1993-2015.
Latif,M.,and T.P.Barnett,1994:Causes of decadal climate variability over the North Pacific and North America.Science, 266,634-637.
Luo,Y.Y.,Q.Y.Liu,and L.M.Rothstein,2009:Simulated responseofNorthPacificModeWaterstoglobalwarming.Geophys.Res.Lett.,36,L23609,doi:10.1029/2009GL040906.
Marshall,J.C.,R.G.Williams,and A.J.G.Nurser,1993:Inferring the subduction rate and period over the North Atlantic.J. Phys.Oceanogr.,23,1315-1329.
Mitchell,J.F.B.,T.C.Johns,J.M.Gregory,and S.F.B.Tett, 1995:Climate response to increasing levels of greenhousegases and sulphate aerosols.Nature,376,501-504.
Nakamura,H.,1996:A pycnostad on the bottom of the ventilated portion in the central subtropical North Pacific:Its distribution and formation.Journal of Oceanography,52,171-188.
Rotstayn,L.D.,S.J.Jeffrey,M.A.Collier,S.M.Dravitzki,A.C. Hirst,J.I.Syktus,and K.K.Wong,2012:Aerosol-induced changes in summer rainfall and circulation in the Australasian region:A study using single-forcing climate simulations.Atmospheric Chemistry&Physics,12,5107-6377.
Sen Gupta,S.A.,N.C.Jourdain,J.N.Brown,and D.Monselesan,2013:Climate drift in the CMIP5 models.J.Climate,26, 8597-8615.
Suga,T.,K.Motoki,Y.Aoki,and A.M.Macdonald,2004:The North Pacific climatology of winter mixed layer and mode waters.J.Phys.Oceanogr.,34,3-22,doi:10.1175/1520-0485.
Taylor,K.E.,R.J.Stouffer,and G.A.Meehl,2012:An overview of CMIP5 and the experiment design.Bull.Amer.Meteor. Soc.,93,485-498,doi:10.1175/BAMS-D-11-00094.1.
Toyoda,T.,T.Awaji,Y.Ishikawa,and T.Nakamura,2004:Preconditioning of winter mixed layer in the formation of North Pacific eastern subtropical mode water.Geophys.Res.Lett., 31,L17206,doi:10.1029/2004GL020677.
Toyoda,T.,T.Awaji,S.Masuda,N.Sugiura,H.Igarashi,T. Mochizuki,and Y.Ishikawa,2011:Interannual variability of North Pacific eastern subtropical mode water formation in the 1990s derived from a 4-dimensional variational ocean data assimilation experiment.Dyn.Atmos.Oceans,51,1-25.
Wang,L.Y.,Q.Y.Liu,L.X.Xu,and S.-P.Xie,2013:Response of mode water and subtropical countercurrent to greenhouse gas and aerosol forcing in the North Pacific.Journal of Ocean University of China,12,222-229,doi:10.1007/s11802-013-2193-x.
Xie,S.-P.,C.Deser,G.A.Vecchi,J.Ma,H.Y.Teng,and A.T. Wittenberg,2010:Global warming pattern formation:Sea surface temperature and rainfall.J.Climate,23,966-986.
Xu,L.X.,S.-P.Xie,J.L.McClean,Q.Y.Liu,and H.Sasaki, 2014:Mesoscale eddy effects on the subduction of North Pacific mode waters.J.Geophys.Res.,119,4867-4886,doi: 10.1002/2014JC009861.
Li,X.,and Y.Y.Luo,2016:Response of North Pacific eastern subtropical mode water to greenhouse gas versus aerosol forcing.Adv.Atmos.Sci.,33(4),522-532,
10.1007/s00376-015-5092-9.
13 April 2015;revised 25 September 2015;accepted 5 November 2015)
?Yiyong LUO
Email:yiyongluo@ouc.edu.cn
 Advances in Atmospheric Sciences2016年4期
- Advances in Atmospheric Sciences的其它文章
- Impact of the Pacific-Japan Teleconnection Pattern on July Sea Fog over the Northwestern Pacific:Interannual Variations and Global Warming Effect
- Change of Tropical Cyclone Heat Potential in Response to Global Warming
- The Southwest Indian Ocean Thermocline Dome in CMIP5 Models: Historical Simulation and Future Projection
- The Positive Indian Ocean Dipole-like Response in the Tropical Indian Ocean to Global Warming
- Historical Change and Future Scenarios of Sea Level Rise in Macau and Adjacent Waters
- Changes in Mixed Layer Depth and Spring Bloom in the Kuroshio Extension under Global Warming