
Changes in Mixed Layer Depth and Spring Bloom in the Kuroshio Extension under Global Warming
2016-11-24 11:33:29RuosiZHANGShangPingXIELixiaoXUandQinyuLIU
Advances in Atmospheric Sciences 2016年4期
Ruosi ZHANG,Shang-Ping XIE?2,,Lixiao XU,and Qinyu LIU
1Physical Oceanography Laboratory/Qingdao Collaborative Innovation Center of Marine Science and Technology, Key Laboratory of Ocean-Atmosphere Interaction and Climate in Universities of Shandong,Ocean University of China,Qingdao 266100
2Scripps Institution of Oceanography,University of California San Diego,La Jolla,California,92093,USA
Changes in Mixed Layer Depth and Spring Bloom in the Kuroshio Extension under Global Warming
Ruosi ZHANG1,Shang-Ping XIE?2,1,Lixiao XU1,and Qinyu LIU1
1Physical Oceanography Laboratory/Qingdao Collaborative Innovation Center of Marine Science and Technology, Key Laboratory of Ocean-Atmosphere Interaction and Climate in Universities of Shandong,Ocean University of China,Qingdao 266100
2Scripps Institution of Oceanography,University of California San Diego,La Jolla,California,92093,USA
The mixed layer is deep in January-April in the Kuroshio Extension region.This paper investigates the response in this region of mixed layer depth(MLD)and the spring bloom initiation to global warming using the output of 15 models from CMIP5.The models indicate that in the late 21st century the mixed layer will shoal,and the MLD reduction will be most pronounced in spring at about 33?N on the southern edge of the present deep-MLD region.The advection of temperature change in the upper 100 m by the mean eastward flow explains the spatial pattern of MLD shoaling in the models.Associated withtheshoalingmixedlayer,theonsetofspringbloominceptionisprojectedtoadvanceduetothestrengthenedstratification in the warming climate.
mixed layer depth,global warming,temperature advection,spring bloom
1.Introduction
The ocean mixed layer is a surface layer of vertically uniform temperature,salinity,and density,as a result of direct interaction with the atmosphere.The mixed layer depth (MLD)is determined by wind stirring,surface buoyancy forcing(i.e.,freshwater and heat flux),and ocean circulation changes(Kraus and Businger,1967).MLD is one of the most important quantities of the upper ocean,crucial to the substance exchange across the air-sea interface(e.g.,heat flux, surface wave propagation,and ocean biological processes). Variability in oceanic uptake of atmospheric CO2and SST is influenced by the mixed layer changes(Kraus and Businger, 1995).The mixed layer also controls the ocean's absorption of light and utilization of nutrients,two important factors affecting phytoplankton dynamics,and consequently,biological productivity in the ocean(Sverdrup,1953;Yentsch, 1990).
Much attention has been given to the seasonal cycle of MLD.Kara et al.(2003)described the general features of the seasonal variation of MLD over the world.In the Kuroshio extension(KE)region,MLD is deep from January to April, shoals in summer,and deepens again in winter.Qiu and Kelly (1993)used a three-dimensional bulk mixed layer model of Kraus and Turner(1967)and studied the heat balance of the mixed layer over the KE.They showed that the variability of the heat flux drives the seasonal cycle of MLD.The model uses an assumption that the MLD can be estimated by the heat flux,freshwater flux,and wind stress at the air-sea interface,but neglects horizontal advection.Ocean dynamics plays a critical role in the KE system(Wu et al.,2003;Qiu et al.,2007;Taguchi et al.,2007;Xu et al.,2014).The western boundary currents carry warm water to the midlatitudes,releasing a great quantity of heat and moisture there to heat the atmosphere(Wu et al.,2012).In the KE there is warm temperature advection throughout the year.Since the warm advectionmakestheoceanloseheattotheatmosphere,itcauses the surface density to increase and deepen the MLD.In the heat budget of the mixed layer,ocean heat Ekman transport and geostrophic advection plays a prominent role(Yim et al., 2013).As the ocean circulation changes under global warming,it most likely impacts the spatial distributions of SST and MLD,especially in the Kuroshio current and its extension(Sakamoto et al.,2005;Sato et al.,2006).
MLD change also affects ocean biological process. Spring bloom refers to the rapid increase in phytoplankton abundance that commonly occurs in the early spring.During winter,wind-driven turbulence and surface cooling allow vertical mixing to replenish nutrients from depth to the mixed layer.Phytoplankton uses these nutrients for photosynthesis. Yet vertical mixing also causes high phytoplankton losseswhen phytoplankton's respiration exceeds primary production below the euphotic zone.For this reason,reduced illumination during winter limits phytoplankton's growth rates.In the spring,more light becomes available and stratification of the water column strengthens.As a result,vertical mixing is suppressed and phytoplankton and nutrients are kept near the surface,which promotes primary production.The definition and mechanism of spring bloom are discussed in Mann and Lazier(2005).The increasing primary production causes a strong growth of phytoplankton in spring.Sverdrup(1953) showed that there must exist a critical depth that blooming can only occur if the depth of mixed layer is less than the critical value.The critical depth was defined as a hypothetical surface mixing depth at which the integrated net growth rate over the water column becomes zero.Recently,studies (Behrenfeld,2010;Boss and Behrenfeld,2010;Taylor and Ferrari,2011;Chiswell et al.,2015)have called this classic work into question,as the spring bloom is not solely caused bytheshoalingmixedlayer.Chiswell(2011)statedthatSverdrup's assumption of an evenly mixed phytoplankton layer was not applicable in most cases.Huisman et al.(1999)used observationaldatatoputforwardacriticalturbulencehypothesis that phytoplankton can bloom near the surface within a deep mixed layer if vertical mixing is low enough.Chiswell (2011)proposed an onset of stratification hypothesis that the spring bloom develops in weakly stratified layers.The initiation of spring bloom will be examined with observations in the context of these hypotheses.
?Institute of Atmospheric Physics/Chinese Academy of Sciences,and Science Press and Springer-Verlag Berlin Heidelberg 2016
Under global warming,ocean and atmospheric circulations are projected to change significantly(Vecchi and Soden,2007;Xie et al.,2010).MLD would also change because of circulation changes and increased thermal stratification.The winter MLD is generally projected to decrease (Luo et al.,2009).The MLD shoals as the anthropogenic warming is surface intensified,affecting mode waters in the North Pacific Ocean(Luo et al.,2009;Xu et al.,2012).Xie et al.(2010)showed that the circulation change due to weakened mode water formation is more important than local atmospheric heat flux for SST variations in the subtropical gyre of the North Pacific.
GCMs are an important tool to investigate the changes of MLD and the impact on biological processes under global warming.Most previous results were based on only one single coupled model and need to be verified in other models. Here,we take a multi-model approach to address the following questions:How does the MLD change under global warming?How do the CMIP5 results compare with previous studies?Besides a general shoaling under global warming,does the seasonal cycle of MLD also change?Does the inception of spring bloom start earlier?We will show that under global warming,MLD shoals and changes its seasonal cycle.This study considers both atmospheric and oceanic variables in the KE and examines the dominant mechanisms fortheMLDchanges.Wediagnosethestarttimeofthespring bloom in the KE and investigate how it changes in response to global warming.As the mixed layer shoals under global warming,the ability of the ocean to draw nutrient-rich water to the surface is reduced.
The rest of the paper is arranged as follows:Section 2 describes the data and methods.Section 3 investigates the MLD changes under global warming,while section 4 diagnoses which variable is more important for the MLD change. Section 5 discusses the relationship between the mixed layer change and the spring bloom.Section 6 is a summary with discussion.
2.Data and methods
2.1.Data
This paper uses the output from 15 CMIP5 coupled climate models(Table 1),which offer a multimodel perspective of simulated climate change and variability(Taylor et al.,2012).Both the historical(20th century with all forcing) simulation and the RCP4.5 scenario run(radiative forcing of~4.5 W m?2by the year 2100,relative to preindustrial conditions)are used.The model output was obtained from the PCMDI at the Lawrence Livermore national laboratory.
The resolution of atmospheric and oceanic variables is different within the same model and varies between models. We interpolated them on a 1?×1?grid.Both the ensemble mean and the differences among models are investigated in the paper.We focus on the MLD variability and oceanic dynamics.The present-day climatology is based on the time average from 1951 to 2000 in the historical run,while the future mean state is calculated from 2051 to 2100 in the RCP4.5 run.A 50-year period is believed to be long enough to filter out the interannual variability.The change due to global warming is defined as the future mean state(RCP4.5 run,2051-2100)minus the present-day climatology(historical run,1951-2000).We only examine one member run of each model.The average of all models is defined as the ensemble mean.For example,we first calculate the MLD in each model,and then average for 15 models.The methods used here to process the data are the same as those employed by Xu et al.(2012).
For studying the spring bloom,we use the MODIS ocean color data(available from http://oceancolor.gsfc.nasa.gov/), including the daily chlorophyll-a and the photosynthetically active radiation,mapped at a resolution of 9 km,from 2004 to 2009.The daily net heat flux data from 2004 to 2009 is derived from the WHOI's OAFlux project(Yu et al.,2006). The weekly temperature and salinity data were downloaded from the China Argo real-time data center(http://www.argo. org.cn/).All the observational results presented in this paper are the mean state from 2004 to 2009.Only four models (CanESM2,GFDL-ESM2M,IPSL-CM5A-LR,MPI-ESMLR)out of the 15 have both chlorophyll-a data and daily data of MLD and radiation.We use these four models in the study of the spring bloom.
2.2.Methods
There are various methods for determining MLD.Here, we regard both salinity and temperature as having effects onstratification.We use a fixed density criterion to calculate MLD.The MLD is defined as the depth where the increase in density from the surface value equals 0.03 kg m?3(Xu et al., 2012).The vertical structure of the upper ocean in the KE was examined by 30 randomly selected profiles(not shown here),and it was found that this density criterion of 0.03 kg m?3is suitable for defining the MLD.
The net heat flux is the sum of longwave radiation,shortwave radiation,latent heat flux,and sensible heat flux at the surface.The temperature advection,u(?T/?x)+v(?T/?y), in the mixed layer is calculated as the temperature advection at a depth of 50 m.In this formula,u,v are the horizontal velocity components,T is the SST,?/?x+?/?y is the horizontal gradient operators.
Table 1.The 15 models from CMIP5 analyzed in this study.
3.Seasonal change of MLD
This section studies changes in the seasonal cycle of MLD in response to global warming.The analysis region is (25?-45?N,131?E-160?W).Figure 1a shows the present-day winter(January-March)climatological MLD(1951-2000). The MLD in the KE is deep and its maximum exceeds 200 m. According to Xu et al.(2014),the deep mixed layer near the KE shows significant differences between observations and current climate models.In observations,there are two MLD maxima deeper than 150 m to the north and south of the KE, respectively.Sandwiched between is a shallower mixed layer along the KE jet.By contrast,CMIP5 models do not capture this feature,with one single broad pool of deep MLD and a sharp MLD front to the south that slants northeastward.The present study will only focus on the deep MLD changes as a whole,ignoring its detailed structures.
Figure 1b shows the seasonal cycle of the zonal mean (135?-175?E)MLD for the present-day climatology and its change under global warming.The seasonal cycle of MLD in present-day climatology is obvious:the mixed layer is deep in January-April,and the deepest MLD(about 250 m)is located at about 33?N;the MLD shoals after April,to less than 50 m,and then deepens again in November-December.
The MLD change under global warming shows seasonal variability.The biggest change,almost?40 m,takes place in April.The maximum change of MLD under global warming is collocated with the maximum MLD in the present-day climatology in April at 33?N.The MLD change in March is less than that in April.The pattern of the MLD change is different between March and April:the MLD change in March peaks near the northeast-slanted MLD front of the present-day climatology,while the April change is flatter(Figs.1c and d). While the ensemble mean results show a clear seasonality in MLD change in response to global warming,different models may have different characteristics.Figure 2 shows the inter-model standard deviation of winter mean MLD among the 15 models.Large inter-model bias(>25 m)appears between 25?N and 30?N,to the south of the winter deep mixed layer front.But the difference is relatively small(<15 m) in the deep mixed layer region,where it shows a significant seasonal change of MLD(>30 m).
All of the 15 models show a shoaling MLD in response to global warming.Ten models(BCC CSM1.1,CanESM2, CCSM4,HadGEM2-CC,MIROC5,MIROC-ESM,MPIESM-LR,CMCC-CM,CSIRO Mk3.6.0,NorESM1-M)have similar results as the ensemble mean,but the other five (ACCESS1.3,GFDL-CM3,GFDL-ESM2M,IPSL-CM5ALR,MRI-CGCM3)do not show similar MLD changes.In these five models,the maximum change of MLD under global warming is collocated with the maximum MLD in the present-day climatology in both March and April.The MLDchange in March is more than that in April.The reason why these five models do not have the same characteristics needs further research but will not be discussed in this paper.We focus on the ensemble mean results in the following sections.
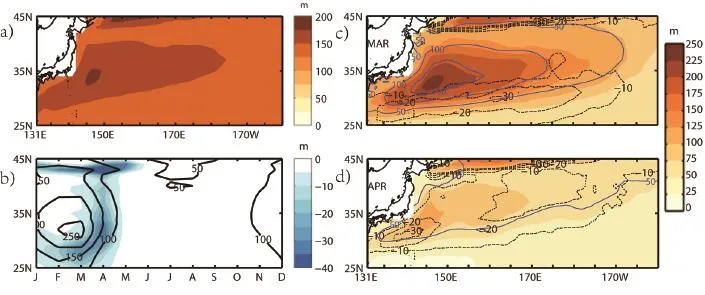
Fig.1.(a)Present-day winter(January-March)climatology(1951-2000)of MLD(colored scale bar;units:m).(b)Seasonal cycle of the MLD for present-day climatology(1951-2000)and its change[RCP4.5 run(2051-2100)minus historical run(1951-2000)]. The zonal mean(135?-175?E)MLD is shown by black contours in intervals of 50 m,and the MLD change is shown by the coloring in units of m.(c,d)Historical mean MLD(1951-2000;colored scale bar)and 21st century mean MLD(2051-2100;blue contours) in(c)March and(d)April[MLD change is superimposed(black dotted contours at 10 m intervals)].
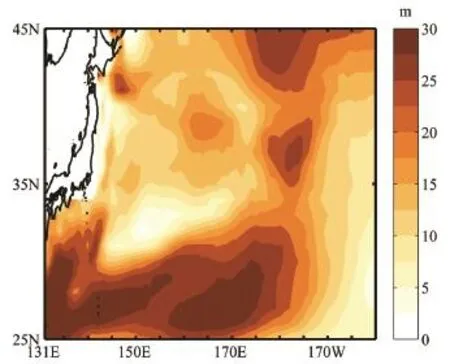
Fig.2.Inter-model standard deviation(colored scale bar;units: m)of the winter mean MLD for January-March.
4.Atmospheric and oceanic effects on MLD change
This section investigates why MLD changes under global warming.Following Qiu and Kelly(1993),we diagnose atmospheric and oceanic factors influencing MLD,including the important role of the western boundary currents in the KE.
4.1.Atmospheric variables and MLD
Figure 3 shows the changes of MLD and heat flux in March and April in response to global warming,with positive meaning the ocean is absorbing more heat.The heat flux change varies from?15 W m?2to 15 W m?2.In March,the ocean tends to release more heat in most of the area,but it absorbs more heat in a long and narrow strip between 25?N and 30?N(Fig.3a).In April,the ocean absorbs more heat from the atmosphere,and the area of negative heat flux becomes smaller(Fig.3b).The ocean absorbing more heat from the atmosphere in April than March explains why the MLD shoals more in April under global warming.However,the heat flux change under global warming in March and April cannot explain the spatial pattern of the MLD change.
4.2.Oceanic variables and MLD
IntheKE,oceancurrentsarestrongandplayanimportant role in the formation of the deep mixed layer(Wu et al.,2012; Yim et al.,2013).The western boundary currents carry warm water to the midlatitudes.The warm advection makes the ocean lose a large quantity of heat to the atmosphere,causing a deep MLD.Figure 4 shows the change of temperature advection in the mixed layer in March and April in response to global warming.The shoaling MLD seems spatially well correlated with the warm advection in the mixed layer both in March and April.A warm mixed layer temperature advection shoals the MLD because it enhances stratification.
We further investigate which term dominates the temperature advection:changes in potential temperature,or ocean currents?By dividing velocity and potential temperature into climatology and anomalies,andwe decompose the temperature advection intothe following components:
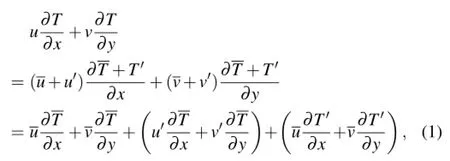
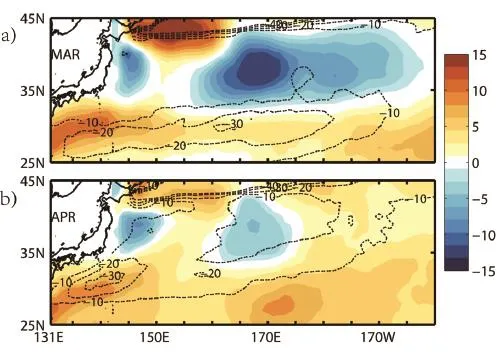
Fig.3.Change in net heat flux(future flux minus present-day flux;colored scale bar;units: W m?2),where positive means increased heat into the ocean,for(a)March and(b)April. MLD change is superimposed(black dotted contours at 10 m intervals).
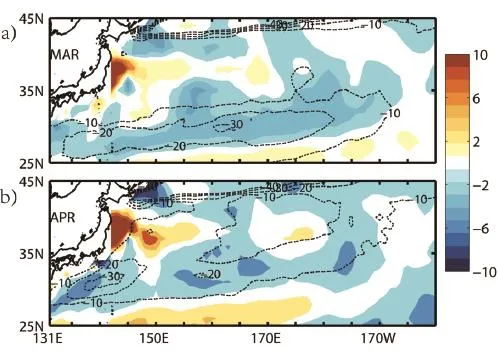
Fig.4.Future minus present-day change in temperature advection(colored scale bar;units: 10?8?C s?1)in(a)March and(b)April.Negative values mean warm advection.MLD change is superimposed(black dotted contours in 10 m intervals).
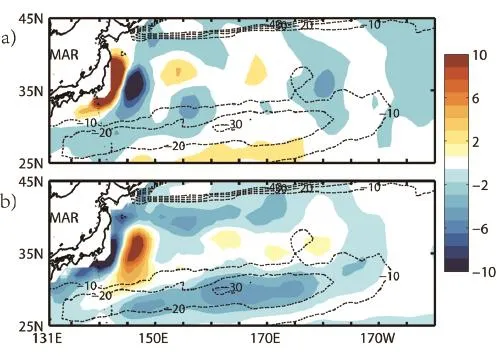
Fig.5.Temperature advection in March(colored scale bar;units:10?8?C s?1)(a)by holding potential temperature constant in the present day and changing ocean currents under global warming,and(b)by holding ocean currents constant in the present day and changing potential temperature under global warming.MLD change is superimposed(black contours at 10 m intervals).
Figure 6 shows the longitude-depth section of temperature advection change and potential temperature change under global warming,averaged in 25?-30?N in March.The maximum warm advection is in the 100 m upper layer,with a maximum from 150?E to 180?E.The maximum increase of potential temperature is in the 100 m upper layer,with a maximum near 150?E.East of 150?E,temperature warming decreases gradually,but the eastward background currents cause a warm advection.At 170?E,where both the anomalous temperature gradient and mean currents are strong,the mixed layer shoals the most.The distribution of potential temperature change below 100 m is small.
5.Spring blooms under global warming
The shoaling mixed layer under global warming has an important influence on the ecosystem.Many variables,such as organic carbon,nitrate,nitrite,and chlorophyll,can affect phytoplankton production(Yentsch,1990).This section investigates the spring blooms under global warming,based on the CMIP5 models.Having examined various observational indicators of spring bloom,we focus here on surface chlorophyll,for which satellite data are readily available.
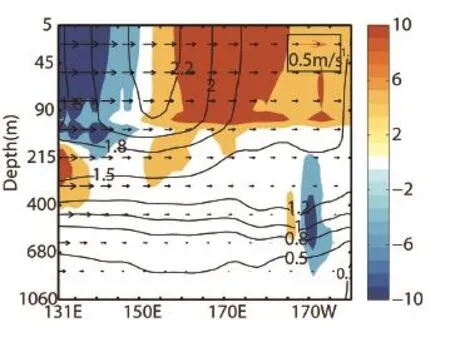
Fig.6.Longitude-depth section of the meridional mean(25?-30?N)change in temperature advection(colored scale bar; units:10?8?Cs?1)inMarch.Temperaturechange(blacklines; units:?C)and currents(black arrows;m s?1)of present-day climatology(1951-2000)are superimposed.
From autumn to winter,the ocean loses heat to the atmosphere,and the mixed layer gradually deepens.Strong mixing happens throughout the whole depth of the mixed layer, entraining new nutrients into the mixed layer and leading to an increase in production.In winter,the MLD reaches its deepest value at t1and the convective overturn is strong(Fig. 7a).At the end of winter,the slow convective overturn cannotmaintain a deep mixed layer,with reduced turbulence;the mixed layer begins to shoal slightly,lightly increasing phytoplankton concentrations at the surface.The transition from strong mixing to low turbulence occurs at about t1(Fig.7a), the time(t1)after the mixed layer reaches its deepest point. Aftert1,thenetheatfluxbeginstorise(Fig.7b),whichmeans that the ocean loses less heat to atmosphere,and after t2it starts to absorb heat from the atmosphere.Meanwhile,the MLD starts to shoal sharply and the rate of increase in surface chlorophyll begins to accelerate.Figure 7c shows the buoyancy frequency,defined as N=[?g(?ρ/?z)/ρ]1/2,where g is the gravitational acceleration,z denotes geometric height andρis the potential density.The sharp increase in N acts as a barrier for the downward turbulence generated in the surface mixed layer by atmospheric disturbances(Gill,1982). At the time of t1,the MLD starts to shoal and surface chlorophyll begins to increase,but the net heat flux at the surface remains negative(upward).A weak stratification supports a weak spring bloom at the surface.At the time of t2,surface chlorophyll increases to the second peak and the net heat flux turns positive,while MLD has already shoaled sharply with N continuing to increase.A strong stratification supports an intense bloom.The net heat flux is not the only determinant of MLD in the KE(Qiu et al.,2007;Taguchi et al.,2007), so there is a 60-day lag between t1and t2.Thus,overall,the MLD shoaling is a good indicator for the timing of the spring bloom,and the time of zero net heat flux is a sign to expedite the spring bloom in the KE.
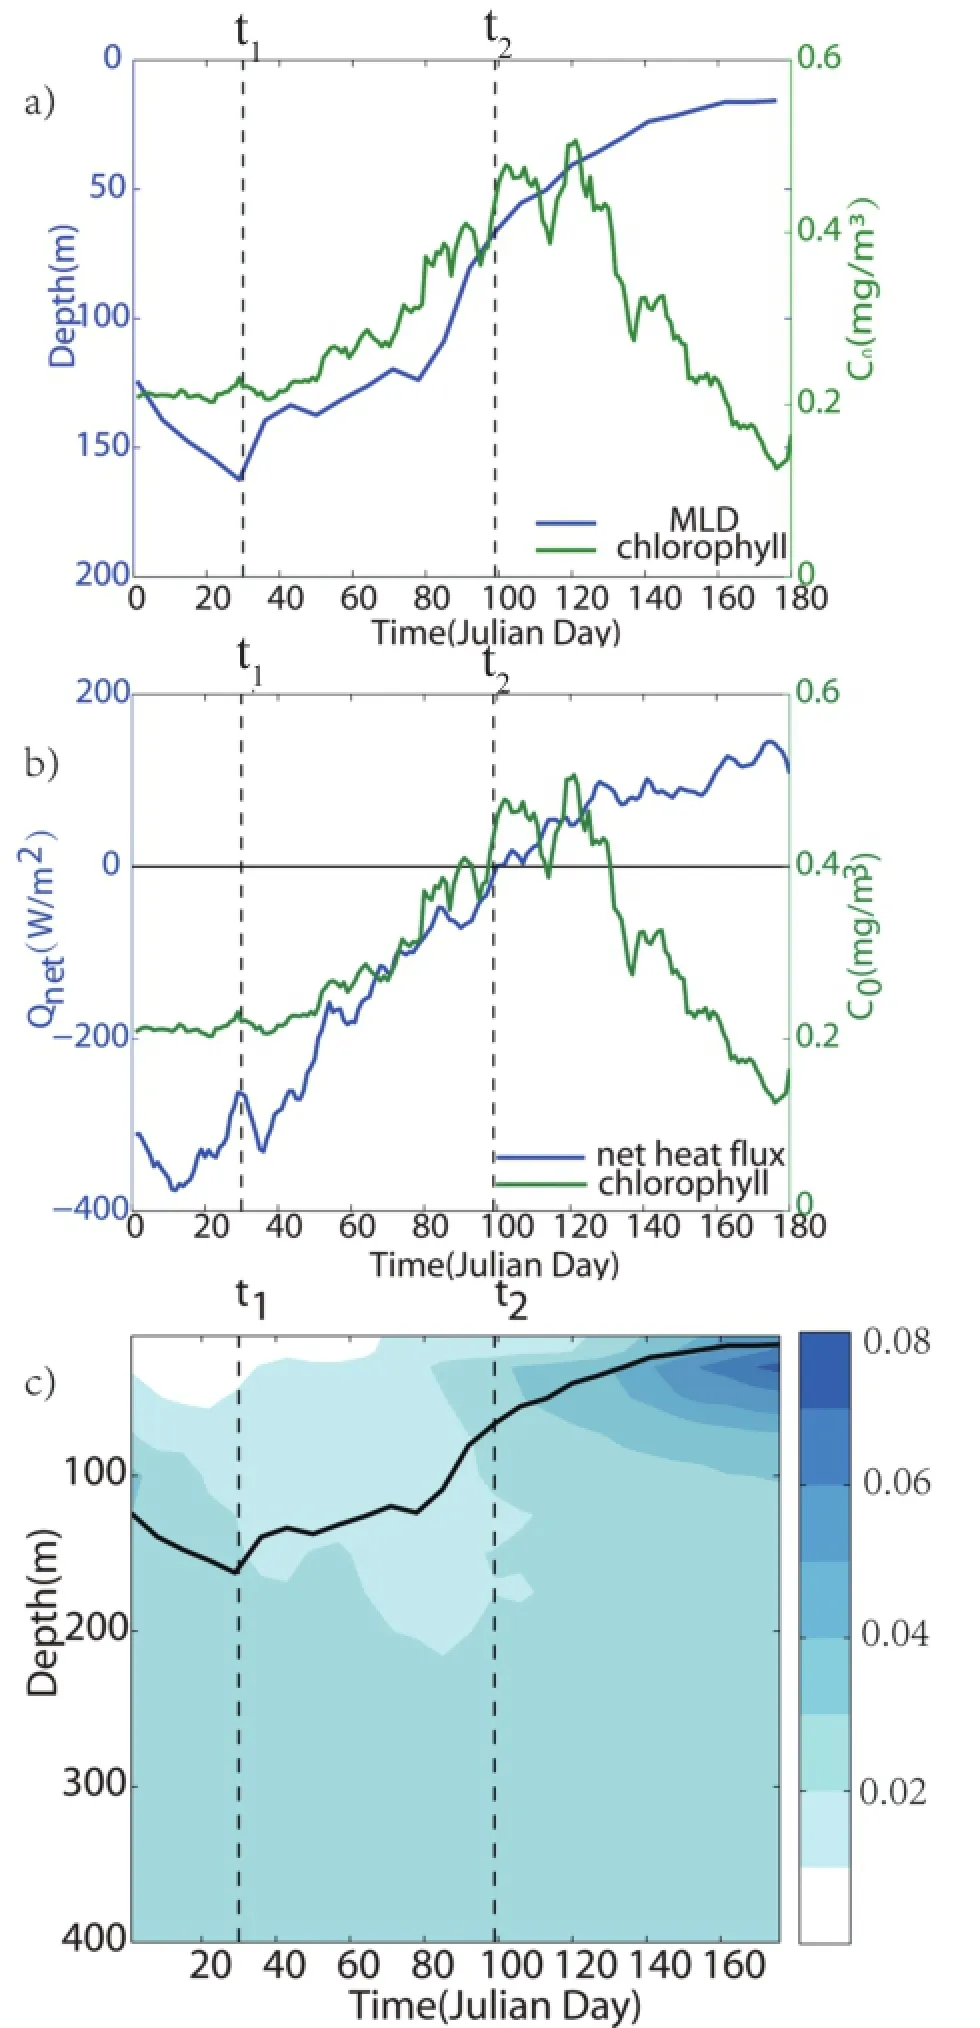
Fig.7.Regional average(30?-40?N,140?-160?E)of(a)MLD (blue line;units:m)and surface chlorophyll concentration (green line;units:mg m?3)from satellite data,(b)net heat flux from OAFlux(blue line;units:W m?2;negative means ocean is losing heat)and chlorophyll concentration(green line; units:mg m?3),and(c)buoyancy frequency(s?1)from Argo. The dashed vertical lines mark the first and second chlorophyll blooms.The time axis starts on 1 January.
Figure 8 compares the climatological distribution of surface chlorophyll concentration between observations and the models.The model simulations capture the overall spatial pattern but are biased(too high)in terms of surface chlorophyll concentration,especially in the midlatitudes(35?-45?N).
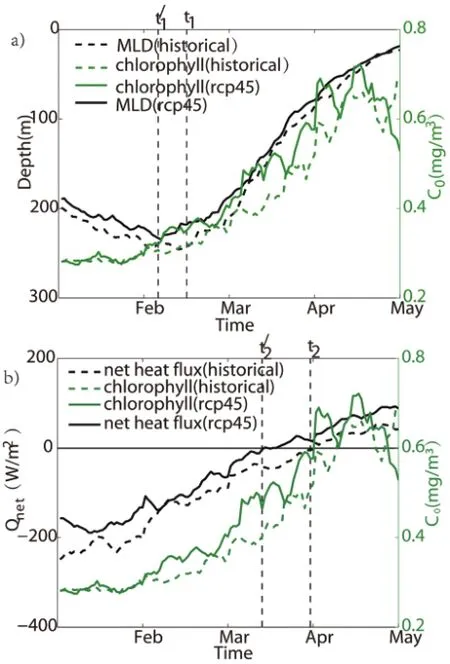
Figure 9 compares the daily variation of surface chlorophyll concentration at present and under global warming. Compared to the current climatology,the spring increase in chlorophyll shows a tendency to start earlier by about 10 days under global warming in the KE,accompanied by a decrease in MLD due to the surface warming trend(Fig 9a).In Fig. 9b,surface chlorophyll increases to the second peak earlier by about 15 days under global warming,with the net heat flux turning positive ahead of time(Fig.9b).In the CMIP5 models,the shoaling trend of MLD is consistent with the early onset of the spring bloom under global warming.
6.Summary and discussion
This paper examines the change in the seasonal cycle of MLD in the KE in response to global warming,based on the output of 15 CMIP5 models.The MLD becomes shallower, especially in March and April.Under global warming,the MLD in April shoals mostly in the region where the MLD is presently large;while in March,it shoals the most in the region of the steep mean MLD gradient.This characteristic of MLD change varies somewhat among models and further studies are needed to determine the factors responsible for the different model behavior.
Changes in both surface heat flux and ocean warm temperature advection contribute to the spring shoaling of the mixed layer.The advection of temperature change in the upper 100 m by the mean eastward current explains the spatialpattern of MLD change in spring.The spatial distribution of mixed layer temperature change-large in the west and reduced in the east-is the main reason for temperature advection change under global warming.This result highlights the importance of the ocean surface warming pattern(Xie et al.,2010).It also raises another question as to what causes this spatial distribution of potential temperature change.In the extra-tropics,wind stress forcing and ocean heat transport may be important.Diagnostic methods based on the mixed layer heat budget need to be developed to investigate the underlying mechanism of the temperature pattern formation.
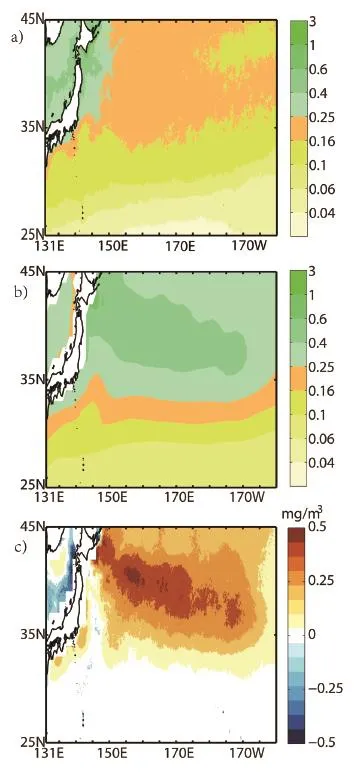
Fig.8.(a)Satellite-derived chlorophyll distribution(units:mg m?3)obtained from MODIS for 2004-09.(b)Simulated climatological distribution of chlorophyll(units:mg m?3)in the historical simulation.(c)Differences in chlorophyll concentration(units:mg m?3;simulated minus observation).
The triggering mechanisms for spring bloom in the KE were examined using satellite data,and it was found that the strengthened stratification and mixed layer shoaling can cause a surface bloom of chlorophyll,and the net heat flux turning to positive from negative also causes a second peak of chlorophyll in the current climate.Under global warming, model projections suggest an early onset of the spring phytoplankton bloom-a change that is consistent with the shoaling of the mixed layer in the warming climate.This result still needs to be tested with observations and model output of the vertical dimension of chlorophyll concentration lacking of liability data.Hashioka et al.(2009)obtained a similar result that the spring bloom initiates earlier by about 10 to 20 days under global warming,although the physical processes were not investigated in detail.The chlorophyll concentra-tion can alter solar penetration through the ocean(Nakamoto et al.,2001;Murtugudde et al.,2002).Thus,there may be feedback between physical and biological changes.
The total radiative forcing begins to stabilize around 2070 under RCP4.5(Taylor et al.,2012).The ocean response comprises a fast response of the mixed layer warming(10-year timescale,approximately)and a slow response involving the deeper ocean(Held et al.,2010).The fast response dominates as the radiative forcing increases,while the slow response takes over after the radiative forcing has stabilized.The fast response is associated with increased upper-ocean stratification and shoaling of the mixed layer,as discussed here.The slow response is associated with a slightly reduced upper ocean stratification(Long et al.,2014)and a weak increase in MLD in the KE(Xu et al.,2013),despite the continued increase in surface temperature.In future work,we intend to investigate the distinct fast and slow responses in the spring bloom.
Acknowledgements.This work was supported by the National Basic Research Program of China(Grant No.2012CB955602), the National Natural Science Foundation of China(Grant Nos. 41476002,41490643,41176006 and 41221063),and the Fundamental Research Funds for the Central Universities(Grant No. 201503029).
REFERENCES
Behrenfeld,M.J.,2010:Abandoning Sverdrup's critical depth hypothesis on phytoplankton blooms.Ecology,91(4),977-989.
Boss,E.,and M.Behrenfeld,2010:In situ evaluation of the initiation of the North Atlantic phytoplankton bloom.Geophys. Res.Lett.,37,L18603,doi:10.1029/2010GL044174.
Chiswell,S.M.,2011:Annual cycles and spring blooms in phytoplankton:Don't abandon Sverdrup completely.Marine Ecology Progress Series,443,39-50.
Chiswell,S.M.,P.H.R.Calil,and P.W.Boyd,2015:Spring blooms and annual cycles of phytoplankton:a unified perspective.Journal of Plankton Research,37(3),500-508.
Gill,A.E.,1982:Atmosphere-Ocean Dynamics.Academic press, 662 pp.
Hashioka,T.,T.T.Sakamoto,and Y.Yamanaka,2009:Potential impact of global warming on north Pacific spring blooms projected by an eddy-permitting 3-D ocean ecosystem model. Geophys.Res.Lett.,36,L20604.
Held,I.M.,M.Winton,K.Takahashi,T.Delworth,F.R.Zeng,and G.K.Vallis,2010:Probing the fast and slow components of global warming by returning abruptly to preindustrial forcing. J.Climate,23(9),2418-2427.
Huisman,J.E.F.,P.van Oostveen,and F.J.Weissing,1999:Critical depth and critical turbulence:Two different mechanisms forthedevelopmentofphytoplanktonblooms.Limnologyand Oceanography,44(7),1781-1787.
Kara,A.B.,P.A.Rochford,and H.E.Hurlburt,2003:Mixed layer depth variability over the global ocean.J.Geophys.Res.,108, 3079,doi:10.1029/2000C000736.
Kraus,E.B.,and J.S.Turner,1967:A one-dimensional model of the seasonal thermocline II.The general theory and its consequences.Tellus,19(1),98-106.
Kraus,E.B.,and J.A.Businger,1995:Atmosphere-Ocean Interaction,2nd ed.,Oxford University Press,362 pp.
Long,S.-M.,S.-P.Xie,X.-T.Zheng,and Q.Y.Liu,2014:Fast and slow responses to global warming:Sea surface temperature and precipitation patterns.J.Climate,27(1),285-299.
Luo,Y.Y.,Q.Y.Liu,and L.M.Rothstein,2009:Simulated response of north Pacific mode waters to global warming.Geophys.Res.Lett.,36,L23609,doi:10.1029/2009GL040906.
Mann,K.,and J.Lazier,2005:Dynamics of Marine Ecosystems:Biological-Physical Interactions in the Oceans.Wiley-Blackwell,496 pp.
Murtugudde,R.,J.Beauchamp,C.R.McClain,M.Lewis,and A. J.Busalacchi,2002:Effects of penetrative radiation on the upper tropical Ocean circulation.J.Climate,15(5),470-486.
Nakamoto,S.,S.P.Kumar,J.M.Oberhuber,J.Ishizaka,K. Muneyama,and R.Frouin,2001:Response of the equatorial Pacific to chlorophyll pigment in a mixed layer isopycnal ocean general circulation model.Geophys.Res.Lett.,28(10), 2021-2024.
Qiu,B.,and K.A.Kelly,1993:Upper-ocean heat balance in the Kuroshio extension region.J.Phys.Oceanogr.,23(9),2027-2041.
Qiu,B.,N.Schneider,and S.M.Chen,2007:Coupled decadal variability in the north pacific:An observationally constrained idealized model.J.Climate,20(14),3602-3620.
Sakamoto,T.T.,H.Hasumi,M.Ishii,S.Emori,T.Suzuki,T. Nishimura,and A.Sumi,2005:Responses of the Kuroshio and the Kuroshio extension to global warming in a highresolution climate model.Geophys.Res.Lett.,32,L14617, doi:10.1029/2005GL023384.
Sato,Y.,S.Yukimoto,H.Tsujino,H.Ishizaki,and A.Noda,2006: Response of North Pacific Ocean circulation in a Kuroshioresolving ocean model to an Arctic Oscillation(AO)-like change in Northern Hemisphere atmospheric circulation due to greenhouse-gas forcing.J.Meteor.Soc.Japan,84,295-309.
Sverdrup,H.U.,1953:On conditions for the vernal blooming of phytoplankton.Journal du Conseil International Pour l'Exploration de la Mer,18(3),287-295.
Taguchi,B.,S.-P.Xie,N.Schneider,M.Nonaka,H.Sasaki,and Y.Sasai,2007:Decadal variability of the Kuroshio extension:observations and an eddy-resolving model hindcast.J. Climate,20(11),2357-2377.
Taylor,J.R.,and R.Ferrari,2011:Shutdown of turbulent convection as a new criterion for the onset of spring phytoplankton blooms.Limnology and Oceanography,56(6),2293-2307.
Taylor,K.E.,R.J.Stouffer,and G.A.Meehl,2012:An overview of CMIP5 and the experiment design.Bull.Amer.Meteor. Soc.,93(4),485-498.
Vecchi,G.A.,and B.J.Soden,2007:Global warming and the weakening of the tropical circulation.J.Climate,20(17), 4316-4340.
Wu,L.,Z.Liu,R.Gallimore,R.Jacob,D.Lee,and Y.Zhong, 2003:Pacific decadal variability:The tropical Pacific mode and the north Pacific mode.J.Climate,16(8),1101-1120.
Wu,L.X.,and Coauthors,2012:Enhanced warming over the global subtropical western boundary currents.Nature Climate Change,2(3),161-166.
Xie,S.-P.,C.Deser,G.A.Vecchi,J.Ma,H.Y.Teng,and A.T. Wittenberg,2010:Global warming pattern formation:Sea surface temperature and rainfall.J.Climate,23(4),966-986.
Xu,L.X.,S.-P.Xie,and Q.Y.Liu,2012:Mode water ventila-tion and subtropical countercurrent over the north Pacific in CMIP5 simulations and future projections.J.Geophys.Res.-Oceans,117,C12009,doi:10.1029/2012JC008377.
Xu,L.X.,S.-P.Xie,and Q.Y.Liu,2013:Fast and slow responses of the north Pacific mode water and subtropical countercurrenttoglobalwarming.JournalofOceanUniversityofChina, 12(2),216-221.
Xu,L.X.,S.-P.Xie,J.L.McClean,Q.Y.Liu,and H.Sasaki, 2014:Mesoscale eddy effects on the subduction of north Pacific mode waters.J.Geophys.Res.,119,4867-4886,doi: 10.1002/2014JC009861.
Yentsch,C.S.,1990:Estimates of‘new production'in the Mid-North Atlantic.Journal of Plankton Research,12,717-734.
Yim,B.Y.,Y.Noh,S.W.Yeh,J.S.Kug,H.S.Min,and B.Qiu, 2013:Ocean mixed layer processes in the Pacific decadal oscillation in coupled general circulation models.Climate Dyn., 41(5-6),1407-1417.
Yu,L.,X.Jin,and R.A.Weller,2006:Role of net surface heat flux in seasonal variations of sea surface temperature in the tropical Atlantic Ocean.J.Climate,19(23),6153-6169.
Zhang,R.S.,S.-P.Xie,L.X.Xu,and Q.Y.Liu,2016:Changes in mixed layer depth and spring bloom in the Kuroshio extension under global warming.Adv.Atmos.Sci.,33(4),452-461,
10.1007/s00376-015-5113-8.
30 April 2015;revised 16 October 2015;accepted 27 October 2015)
?Shang-Ping XIE
Email:sxie@ucsd.edu
 Advances in Atmospheric Sciences2016年4期
- Advances in Atmospheric Sciences的其它文章
- Response of North Pacific Eastern Subtropical Mode Water to Greenhouse Gas Versus Aerosol Forcing
- Impact of the Pacific-Japan Teleconnection Pattern on July Sea Fog over the Northwestern Pacific:Interannual Variations and Global Warming Effect
- Change of Tropical Cyclone Heat Potential in Response to Global Warming
- The Southwest Indian Ocean Thermocline Dome in CMIP5 Models: Historical Simulation and Future Projection
- The Positive Indian Ocean Dipole-like Response in the Tropical Indian Ocean to Global Warming
- Historical Change and Future Scenarios of Sea Level Rise in Macau and Adjacent Waters