
The Positive Indian Ocean Dipole-like Response in the Tropical Indian Ocean to Global Warming
2016-11-24 11:33:34YiyongLUOJianLUFukaiLIUandXiuquanWAN
Advances in Atmospheric Sciences 2016年4期
Yiyong LUO,Jian LU,Fukai LIU,and Xiuquan WAN
1Physical Oceanography Laboratory,Ocean University of China,Qingdao 266100
2Atmospheric Sciences&Global Change Division,Pacific Northwest National Laboratory,WA 99352,USA
The Positive Indian Ocean Dipole-like Response in the Tropical Indian Ocean to Global Warming
Yiyong LUO?1,Jian LU2,Fukai LIU1,and Xiuquan WAN1
1Physical Oceanography Laboratory,Ocean University of China,Qingdao 266100
2Atmospheric Sciences&Global Change Division,Pacific Northwest National Laboratory,WA 99352,USA
Climate models project a positive Indian Ocean Dipole(pIOD)-like SST response in the tropical Indian Ocean to global warming.By employing the Community Earth System Model and applying an overriding technique to its ocean component (version 2 of the Parallel Ocean Program),this study investigates the similarities and differences of the formation mechanisms for the changes in the tropical Indian Ocean during the pIOD versus global warming.Results show that their formation processes and related seasonality are quite similar;in particular,wind-thermocline-SST feedback is the leading mechanism in producing the anomalous cooling over the eastern tropics in both cases.Some differences are also found,including the fact that the cooling effect of the vertical advection over the eastern tropical Indian Ocean is dominated by the anomalous vertical velocity during the pIOD but by the anomalous upper-ocean stratification under global warming.These findings are further examined through an analysis of the mixed layer heat budget.
Indian Ocean Dipole,positive Indian Ocean Dipole-like response,global warming,Bjerknes feedback
1.Introduction
The Indian Ocean Dipole(IOD)is the dominant mode of interannual variability over the tropical Indian Ocean(e.g., Saji et al.,1999;Murtugudde et al.,2000).The IOD usually peaks in austral spring,and its positive phase(pIOD)event is characterized by a decrease of SST and rainfall in the eastern tropical Indian Ocean(ETIO)but an increase of SST and rainfall in the western tropical Indian Ocean(WTIO),accompanying easterly anomalies of surface winds along the equatorialIndianOceanwhereweakwesterliesprevailinanormal spring season.The IOD is an air-sea coupled mode and can develop with or without the presence of El Ni?no-Southern Oscillation(ENSO)(e.g.,Baquero-Bernal et al.,2002;Li et al.,2002,2003;Saji and Yamagata,2003;Lau and Nath, 2004;Yu and Lau,2004;Zhong et al.,2005;Behera et al., 2006).Among the many feedbacks associated with the IOD, the positive wind-thermocline-SST feedback is believed to be the most important(Bjerknes,1969).
Recent studies have shown that mean climate conditions in the tropical Indian Ocean shift towards a pIOD-like state under global warming(GW),with features such as anomalous easterlies along the equator,stronger warming in the WTIO,and weaker warming in the ETIO accompanied by thermocline shoaling(Zheng et al.,2010,2013;Cai et al., 2013).These oceanic changes are generally interpreted as a direct response to a weakening of easterly wind anomalies in the equatorial Indian Ocean associated with the slowdown of the Walker circulation,a robust signature of the atmospheric response to GW(e.g.,Vecchi and Soden,2007).The mean state changes will have profound impacts on the future climate variability in the tropical Indian Ocean.For example, the thermocline-SST feedback(i.e.,the Bjerknes feedback) intensifies because of the shallower thermocline in the ETIO, resulting in a reduction of the negative skewness in the ETIO SST(Zheng et al.,2010,2013).The future pIOD event will develop and terminate earlier than the canonical pIOD due to an earlier onset of the Asian summer monsoon associated with the weakened Indian Ocean Walker circulation(Cai et al.,2013).The frequency of extreme pIOD events will also increase significantly due to climatologically stronger westminus-east SST gradients and easterly winds along the equatorial Indian Ocean(Cai et al.,2014).
To date,there has been no reporting,in terms of formation processes,of the similarities and differences with respect to the changes in the tropical Indian Ocean between a pIOD event and the pIOD-like mean state under GW.For its counterpart in the Pacific where GW induces an El Ni?no-like condition,it was found that the physical mechanisms that drive tropical Pacific climate change depart substantially from the ENSO analogy that is often invoked for interpreting futureclimate change(e.g.,DiNezio et al.,2010);while being a major player in the positive feedback loop during El Ni?no, the weakening of the equatorial easterlies contribute only marginally to the El Ni?no-like SST pattern formation under GW(Luo et al.,2014).In addition,our recent model experiments also revealed distinct mechanisms for the El Ni?no-like Pacific warming under greenhouse gas forcing from El Ni?no (Luo et al.,2014).
?Authors 2016
The central goal of this study is to examine the similarities and differences of the formation mechanisms for the changes in the tropical Indian Ocean between the pIOD and GW.Our main finding is that,quite similar to the situation during the pIOD,the wind-thermocline-SST feedback plays the leading role in decreasing the warming in the ETIO under GW.This result is in stark contrast to what happens in the tropical Pacific where the wind stress change plays only a secondary role in the El Ni?no-like warming pattern.In addition,a heat budget analysis is performed to diagnose the mechanisms of the pattern formation under pIOD versus GW and to further confirm the above finding.
The rest of the paper is structured as follows:Section 2 describes the model and numerical experiments.Section 3 introduces the methodology.Section 4 compares the oceanic and atmospheric changes between pIOD and GW.Section 5 analyzes the heat budget.A summary and discussion of our findings is then presented in section 6.
2.Model and simulations
The main modeling tool for this study is CESM1.1,which is comprised of the Community Atmospheric Model version 5(CAM5),the Community Land Model version 4(CLM4) and the POP2 ocean component.
From the end of the historical experiment that is available at NCAR,a 94-year projection run under the Representative Concentration Pathway 8.5 scenario(RCP8.5)from 2006 to 2099 is first performed with CESM1.1,and its daily outputs of various oceanic and atmospheric variables are saved.This experiment is labeled“CPL85”(Table 1).Using this experiment,GW-induced trends are derived from least-squares linear fitting towards a straight line.In addition,the data from the CPL85 simulation are also used to construct a pIOD composite,theprocessofwhich isexplained in detailin section 3.
Applying the daily surface atmospheric forcing fields from CPL85,the ocean model(POP2)is then integrated for 94 years from 2006 to 2099,and this experiment is called“FULL”(Table 1).Note that in POP2 bulk formulae are used to calculate evaporation as well as latent and sensible heat fluxes.A comparison of the SST trend in the tropics between the coupled and ocean-alone model runs reveals that the signature of the SST response is reproduced well by the ocean-alone model,including an El Ni?no-like response over the tropical Pacific Ocean and a pIOD-like warming pattern over the tropical Indian Ocean.
Inordertoisolatetheeffectofchangingwindstress(wind speed),experiment STRS(SPED)is performed with the wind stress(wind speed)fixed at repeating annual cycle of year 2006 while all other fields being the same as FULL.The wind stress contribution to the oceanic changes can be derived by subtracting STRS from FULL,and the wind speed contribution by subtracting SPED from FULL.The former reflectsthe effect of wind stress change on the ocean circulation and then the thermal structure(referred to as the effect of wind stress change on SST through the Bjerknes feedback).The latter reflects the effect of wind speed change on the latent heat flux through evaporation(referred to as Wind-Evaporation-SST or WES effect hereafter).It should be stressed that this WES effect only accounts for the direct thermal effect on ocean of the changing wind speed,not including the indirect feedbacks through the atmospheric processes as the WES in the fully coupled model(Lu and Zhao,2012).The experiment WIND with both wind stress and wind speed fixed at year 2006 values is conducted to assess the linearity of the oceanic response to the two aspects to wind forcing,which turns out to hold accurately.In addition,another experiment is performed with POP2 driven repeatedly by the same atmospheric fields from 2006 for 94 years to serve as the control run for the overriding experiments,and this experiment is referred to as CTRL(Table 1).
Table 1.Experiments with CESM1.1 and POP2.
In brief,the wind stress effect(WS)can be deduced from FULL-STRS,the wind speed effect(WES)from FULLSPED,and the effect in the absence of wind stress and wind speed changes(w/o WS&WES)from WIND-CTRL,respectively.FULL-CTRL mimics the full response in the coupled CESM1.1,encompassing all the effects above.It should be noted that all these effects gleaned from the ocean-alone experiments could differ from those found in coupled model simulations.
3.Methods
3.1.Temperature budget equation
A temperature budget analysis is performed to diagnose the leading maintenance mechanism for the SST anomalies revealed by the experiments.Since the 0-55 m layer temper-ature,mixed layer temperature,and SST have very similar interannual variability(not shown),a fixed bottom at 55 m is chosen for the heat budget to avoid entrainment terms.Reducing the number of terms eases interpretation but also reduces potential error sources in the computation(Alory and Meyers,2009).Thetemperaturebudgetequationisexpressed as:
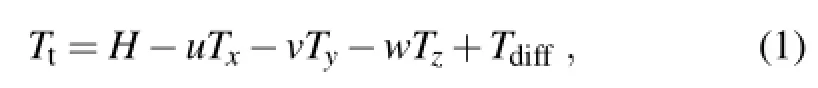
where Ttrepresents the tendency of the mixed layer temperature(MLT);H=(Q0?Qh)/(ρ0cph)is the net surface heat flux,in which Q0and Qhare the heat fluxes at the surface and heat penetration through 55 m,respectively,andρand cpare the density and specific heat of sea water;?uTx,?vTy, and?wTzare the zonal,meridional,and vertical advection of temperature,respectively;and Tdiffrepresents the sum of contributions from the horizontal and vertical diffusion,and the convergence of heat by the transient eddies.For brevity,it is referred to as the diffusion term hereafter.Since the diffusion and eddy terms are not stored as part of the model's outputs, we can only infer the values of Tdiffas the residual of Eq.(1). A positive(negative)Tdiffindicates a heating(cooling)effect by diffusion.
3.2.Temperature budget balance
In this section we evaluate the MLT change from one year to the next and assess which mechanisms,by the terms in Eq.(1),control the change.The annual values of heat budget terms(Fig.1)are computed from the outputs from CPL85,depicting the mean balance as well as the interannual variability.It is found that all heat budget terms are important,with the residual term(i.e.,diffusion)being positive and working to warm the mixed layer in the tropical Indian Ocean.On average over the ETIO(WTIO),the warming from the net surface heat flux of 2.0?C yr?1(2.0?C yr?1), meridional advection of 1.7?C yr?1(1.9?C yr?1)and diffusion of 2.1?C yr?1(0.6?C yr?1)is balanced by cooling from the vertical advection of?5.4?C yr?1(?3.4?C yr?1)and zonal advection of?0.4?C yr?1(?1.1?C yr?1).
The annual temperature change simulated by the model (dT;expressedasblack linesin Fig.1)and theannualchange reconstituted from the sum of the atmospheric and advective heat terms[d(H?uTx?vTy?wTz);expressed as gray lines in Fig.1]are highly correlated(r≈0.70 in the ETIO and r≈0.93 in the WTIO),suggesting that this heat budget formulation without resolving explicitly the diffusion term can accountforconsiderableinterannualvariabilityoftheMLTin the tropical Indian Ocean.The difference between the simulated and reconstituted temperature change(Fig.1)is an estimate of the importance of the total diffusion-eddy processes. It warms the tropical Indian Ocean,with a larger contribution in the east than west(average warming of 2.1?C yr?1for the ETIO but only 0.6?C yr?1for the WTIO).At the interannual scale,its variation is comparable to the net surface heat flux for the ETIO but is much less for the WTIO,suggesting that the diffusion and subgrid-scale mixing processes due to unresolved processes are more important for the closure of the interannual heat budget in the ETIO than in the WTIO.
Fig.1.Interannual variations of temperature simulated(Tt;black)and reconstituted(ReTt;gray)from the heat budget,defined as the sum of net surface heat flux(H;green),zonal(?uTx;red),meridional(?vTy;yellow), and vertical(?wTz;blue)advection heat terms,as well as the difference between the temperature simulated and reconstituted from this heat budget(Tdiff;purple),for the top 55 m of(a)the WTIO and(b)the ETIO.
3.3.Composite of pIOD
We construct the pIOD composite following the procedure of Huang et al.(2012),who constructed an El Ni?no composite based upon 60-year daily outputs from a coupled simulation with the Climate Forecast System.To formulate the pIOD composite,the simulated time series from 2006-99 in CPL85 are first detrended to remove the GW signal. Then,we obtain the difference in the MLT anomaly between the WTIO(10?S-10?N,50?-70?E)and the ETIO(10?S-0?, 90?-110?E)in Fig.2.In this analysis,a criterion of 2.2?C of the difference is chosen to define a pIOD event,and 17 pIOD events are identified during the 94-year simulation period.As in the observations,the peak amplitudes for these events are all phase-locked with austral spring.The year in which the pIOD events develop and mature are referred to as year 0.As such,we refer to May-July of year 0,August-October of year 0,November of year 0 to January of year 1, and February-April of year 1 as the development,peak,decay,and demise phases of pIOD,respectively.As we show in section 4,the composite pIOD captures the major character-istics of an observed pIOD event well.
As the experiment FULL-CTRL successfully reproduces the interannual variability of CPL8.5,we use the same times of occurrence of the 17 events as in CPL85 for the pIOD composite for the overriding experiments.We find that the evolution of the pIOD composite in CPL85(Fig.3a)is reproduced well by FULL-CTRL(Fig.3b),but with slightly larger amplitude,likely due to the lack of higher-than-dailyfrequency air-sea fluxes in the ocean-alone experiments.The wind stress change plays a dominant role for the pIOD evolution(Fig.3c),while the contribution from the wind speed change is negligible(Fig.3d).Interestingly,in the absence of the wind stress and wind speed changes,WIND-CTRL can also produce weak pIOD events(Fig.3e),hinting at possible formation mechanisms for IOD other than Bjerknes feedback (e.g.,Clement et al.,2011).
The analysis in the following sections is based primarily on the CPL85 simulation,and the overriding experiments are used to further isolate the role of individual feedbacks in the formation of pIOD and GW.Due to the high similarities between CPL85 and FULL-CTRL,all discussion related to the CPL85 run can be carried over to FULL-CTRL.Besides, since the magnitude of the modeled WES-induced oceanic change is negligible(Fig.3d),we do not show the results of FULL-SPED(WES feedback)in the rest of the paper.
In addition,to facilitate the comparison of the MLT patterns between pIOD and GW,the basin mean(averaged over 20?S-20?N in the Indian Ocean)of its response to GW has been removed.
4.Oceanic and atmospheric changes in the tropical Indian Ocean
4.1.Spatial patterns during the peak season
Various features of the pIOD composite during the peak season are shown in Fig.4.In comparison with observations(e.g.,Murtugudde et al.,2000;Vinayachandran et al., 2002),CESM does a decent job in simulating the pIOD spatial distributions over the tropical Indian Ocean.Cold MLT anomalies appear in the ETIO,with the maximum cooling exceeding 3?centered at(100?E,5?S)(Fig.4a),accompanying lower sea surface height(not shown)and reduced rainfall in the ETIO(not shown)as well as easterly wind anomalies along the equator(Fig.5c).The oceanic changes also include a reverse of the eastward flow(not shown)and upwelling into the mixed layer(Fig.4e)along the equator.In addition,over the ETIO,the stratification below the mixed layer appears to be increased(Fig.4g)due to a shallower thermocline there.
GW-induced changes are also shown in Fig.4.The MLT exhibitsaclearpIOD-likepatterninthetropicalIndianOcean (Fig.4b),with a cooling(i.e.,reduced warming)over the ETIO and a warming(i.e.,enhanced warming)over the WTIO.Despite sharing a number of similarities,a distinction from what happens during the pIOD appears in the southeast tropics around(95?E,15?S),in which an anomalous cooling is found under GW(Fig.4b).A comparison of the surface heat flux suggests that this is likely because the regional large positive anomalous atmospheric heat flux,which warms the surface ocean during the pIOD(Fig.4i),is significantly reduced under GW(Fig.4j).
It is also clear that under a warming climate there is a remarkable westward shift of the anomalous easterlies compared to the situation during the pIOD(compare Fig.4d to Fig.4c).In response to this shift,both the eastward flow(not shown)and upwelling(Fig.4f)along the equator are weaker compared to those associated with the pIOD(Figs.4e).However,it is important to note that the upper-layer stratification under GW(Fig.4h)is more intensified around the equator, especially over the ETIO,in spite of the wind shift.This is due mainly to the GW-induced warming generally decreasing with depth,leading to an increased temperature gradient of the upper ocean(e.g.,Luo et al.,2009).
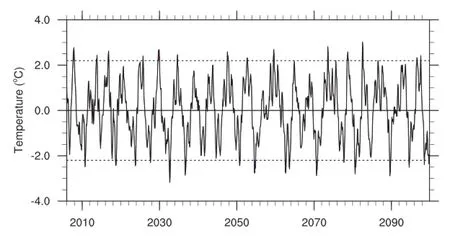
Fig.2.Difference in the MLT anomaly between the WTIO(10?S-10?N,50?-70?E)andtheETIO(10?S-0?,90?-110?E).Thehorizontaldashed lineat2.2?C is used as the criterion to define the IOD events,and 17 pIOD events are identified during the 94-year simulation period.
4.2.Seasonal evolution
The seasonal evolution of the variables along 5?S during the pIOD and GW is shown in Fig.5.As in the observations(e.g.,Saji et al.,1999),cold MLT anomalies firstappear in the ETIO in May-June(Fig.5a),accompanied by moderate southeasterly wind anomalies(Figs.5c and e).In the following months,the cold anomalies intensify while the WTIO begins to warm up,and zonal wind anomalies around the equator intensify together with the temperature dipole.A dramatically rapid peak of these features occurs in September,followed by a quick decay.Previous studies have shown the importance of wind stress change during a pIOD event, which is confirmed by the results of our overriding experiments(Fig.6a),i.e.,the wind stress effect contributes to the magnitude as well as seasonal evolution over both the ETIO and WTIO,while the effect in the absence of wind stress and wind speed changes merely contributes a small part to the anomalous warming and does not have much influence on the evolution of pIOD.
The GW-induced seasonal evolution of MLT and wind anomalies in the tropical Indian Ocean is very similar to that during the pIOD.However,a striking difference is found in the seasonal evolution of the upper-layer stratification over the ETIO.For the pIOD,the local stratification is weakest during July-September(Fig.5i)when the cooling there reaches a peak(Fig.5a),suggesting that the vertical cooling is dominated by the change in the vertical velocity rather than stratification.Further,the overriding experiments reveal that the weak stratification is due to the effect of the absence of wind stress and wind speed changes(Fig.6c).Without the WS&WES effect,the stratification is significantly reduced during austral winter,which partially offsets the enhanced stratification induced by the wind stress change(Fig. 6c).On the other hand,under a warming climate,the stratification over the ETIO(Fig.5j)appears strongest during the peak cooling season(Fig.5b),suggesting that the vertical cooling is dominated by the change in the stratification rather than upwelling.In addition,it is found from the overriding experiments that the GW-induced strong stratification during austral winter is due to a superposition of positive changes from both the wind stress effect and the w/o WS&WES effect(Fig.6d),in contrast to what happens during the pIOD. Furthermore,the seasonal evolution of MLT under GW is controlled by the wind stress effect(Fig.6b).
It is interesting to note that there is an increase in the amplitude of the seasonal cycle of MLT under both pIOD and GW,expressed as greater cooling in low temperature months for the ETIO but more warming in high temperature months for the WTIO(Figs.5a and b).For example,the maximum anomalous cooling in the ETIO is found in September when the climatological temperature there is lowest,while the warming in the WTIO is highest around January-February when it is the warmest season there.The increase of the seasonal cycle can also be found for the upwelling over the ETIO under both pIOD and GW(Figs.5g and h),i.e.,the induced upwelling reaches a maximum during July-August(about 1-2 months earlier than the cooling peak there)when the climatological vertical velocity happens to be largest in the upward direction.
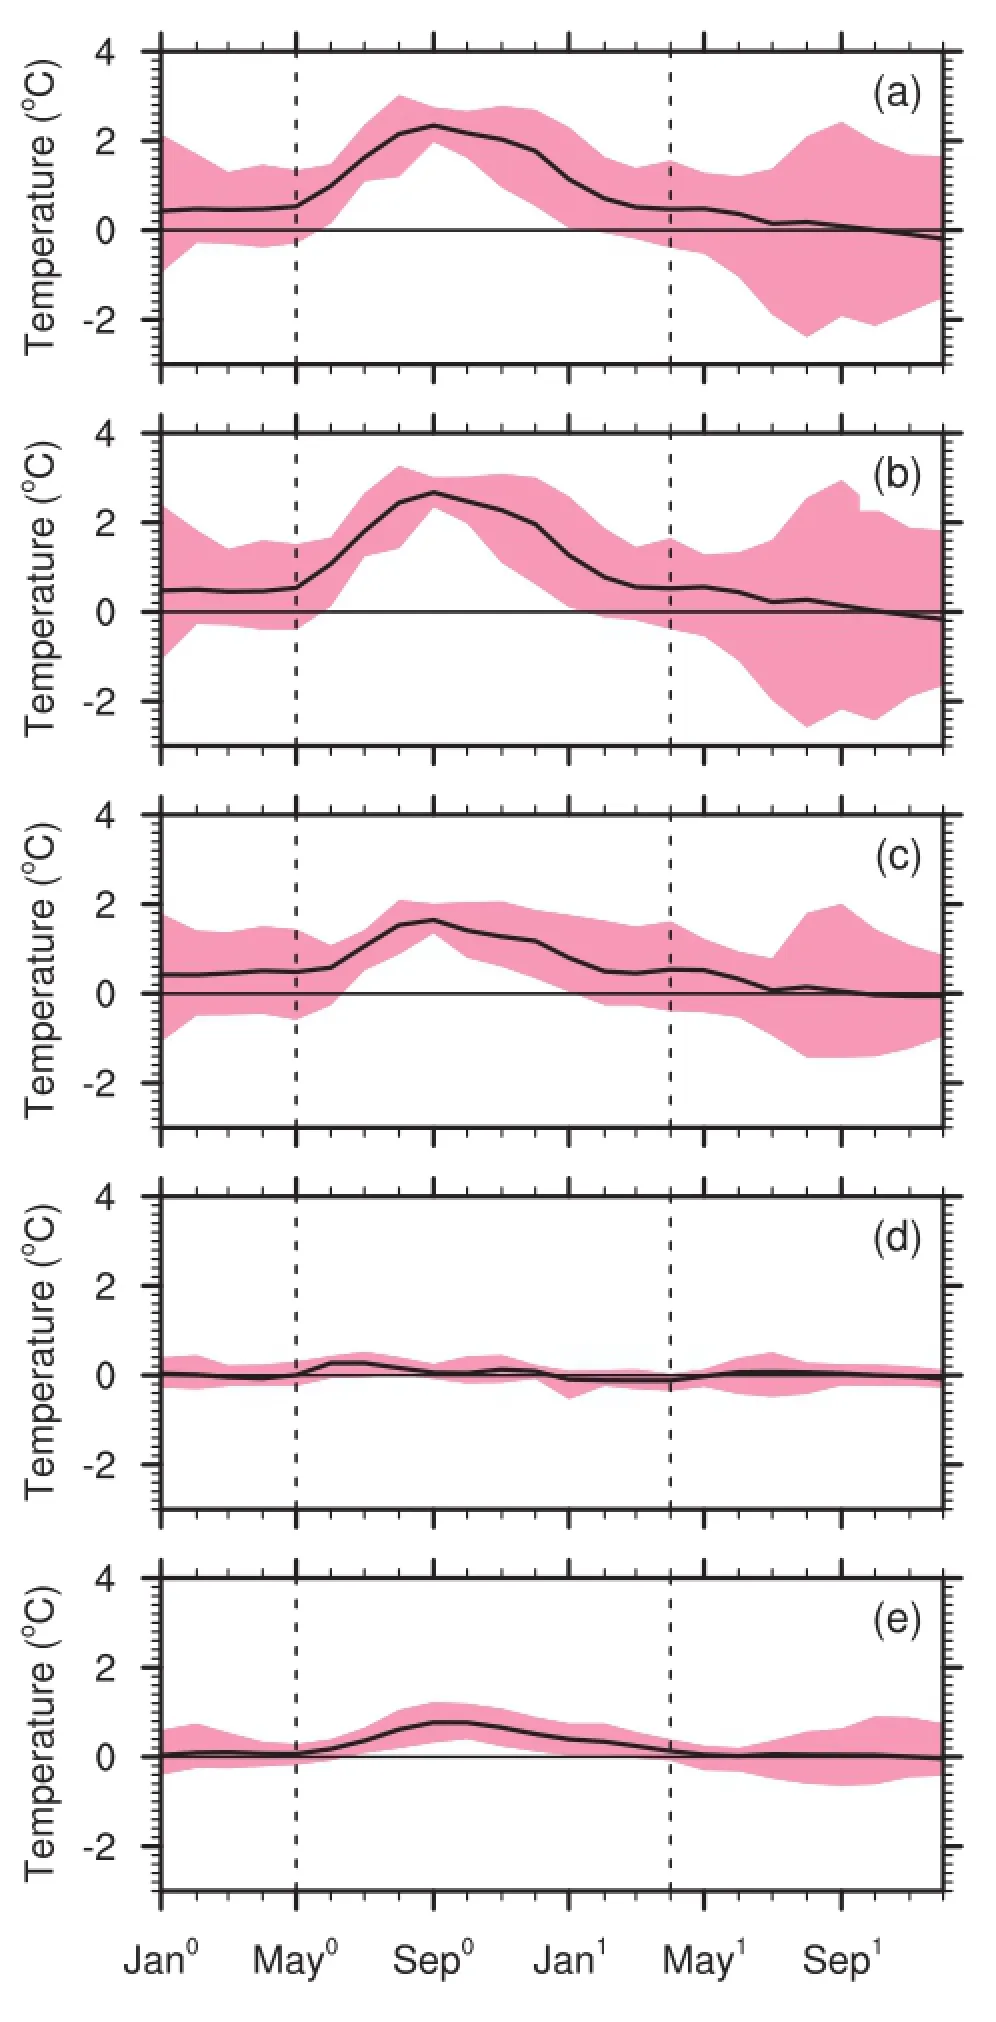
Fig.3.Seasonal evolution of the pIOD composite in the(a) CPL85 simulation,(b)full response(FULL-CTRL),(c)wind stress effect(FULL-STRS),(d)wind speed effect(FULLSPED),and(e)the effect in the absence of wind stress and wind speed changes(WIND-CTRL).The pink area denotes the upper and lower limits of the 17 composite members.Superscripts 0 and 1 in Jan,May and Sep denote year 0 and year 1,respectively.
4.3.Subsurface changes
Figure 7 shows the subsurface changes in temperature and thermocline depth along 5?S for both the pIOD and GW cases.The model reproduces well the major features of the thermocline changes in the tropical Indian Ocean during the pIOD(e.g.,Vinayachandran et al.,2002;Iskandar et al., 2014).The subsurface temperature anomalies caused by the vertical movement of the isotherms are much larger than theirsurface counterpart,and the dipole pattern is present down to adepthofabout200 m,verifyingtheimportanceof ocean dynamics during the pIOD.The subsurface temperature anomalies are largest during November-January,a delay of one season compared to the surface dipole peak.Corresponding to the subsurface temperature changes,the thermocline shoals in the east but deepens in the west.The overriding experiments confirm that the wind stress change is responsible for the subsurface changes discussed above(not shown).Under GW,similar to what happens during the pIOD,the subsurface temperatures changes are much more significant than the surface changes,and reach a maximum during November-January.Also,it is found from the overriding experiments that the changes in the thermocline and the associated temperature are due mainly to the wind stress effect(not shown).
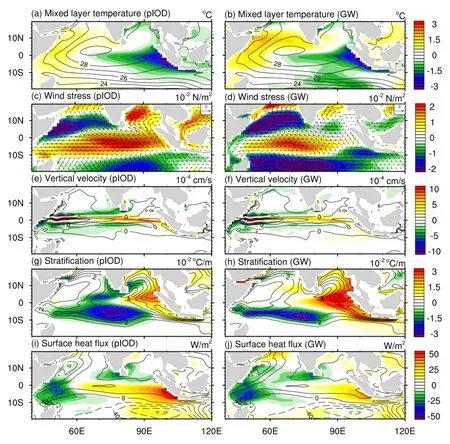
Fig.4.The pIOD-(left)and GW-induced(right)changes during August-October:(a,b)MLT;(c,d)wind stress and its magnitude;(e,f)vertical velocity at a depth of 55 m;(g,h)stratification at a depth of 75 m;(i,j)surface heat flux. The GW-induced changes are their trends over 2006-99,normalized by multiplying 100 years,and the MLT in(b)is further normalized by subtracting the mean value of the field over 20?S-20?N in the Indian Ocean.Superimposed are their climatological fields of the corresponding variables in CPL85.
5.Analysis of the mixed layer heat budget
In this section we focus on analyzing each term of the temperature heat budget and examining their response to pIOD and GW,separately.It turns out from our analysis that their response to both scenarios are very close,though not exactly the same.
5.1.Vertical advection
The vertical advection is the major cooling term over the ETIO region(Figs.8a),resulting from both wind-induced strong upwelling(Fig.4e)and large vertical temperature gradients(Fig.4g).UnderboththepIODandGWcases,thecold vertical advection is significantly enhanced(Figs.9a and b), due to increased vertical velocity(Figs.6e and f)and inten-
sified stratification(Figs.6c and d)resulting from anomalous easterlies along the equator.The anomalous cooling reaches a maximum in July for both pIOD and GW(Figs.9a and b), about two months earlier than the cooling peak of the MLT. In spite of the above similarities,the overriding experiments reveal a distinction between the two scenarios:the effect in the absence of wind stress and wind speed changes produces a warming anomaly during the pIOD(Fig.9a)but brings a cooling anomaly under GW(Fig.9b).This distinction is caused by the opposite response of the stratification to pIOD and GW without the wind-related changes:the upper ocean is less stratified in the former(Fig.6c)but more stratified in the latter(Fig.6d).

Fig.5.Seasonal evolution of anomalies during the pIOD composite(left)and GW(right)along 5?S(between 6.5?S and 3.5?S): (a,b)MLT;(c,d)zonal wind stress;(e,f)meridional wind stress;(g,h)vertical velocity at a depth of 55 m;(i,j)stratification at a depth of 75 m.The anomalies under GW are their trends over 2006-99,normalized by multiplying 100 years,and the MLT in(b)is further normalized by subtracting the mean value of the field over 20?S-20?N in the Indian Ocean.Superimposed are their climatological fields of the corresponding variables in CPL85.
On the contrary,over the WTIO region,the cold vertical advection is weakened and the warming anomaly reaches a maximum in November for both pIOD and GW(Figs.9a and b).However,the overriding experiments reveal that the w/o WS&WES effect acts to cool the surface layer,with the cooling being more significant in the case of GW than pIOD (Figs.9a and b).
5.2.Zonal advection
The zonal advection is a cooling resource to the surface layer around the equator,but not the far eastern and west-ern tropical regions where it is a warming term(Fig.8c). Under the pIOD,the change in the zonal advection tends to have a pattern of cold-getting-colder and warm-gettingwarmer(Fig.8c),i.e.,its contribution is to further cool the central equator and further warm both the far eastern and western tropical regions.The GW-induced zonal advection bearsasimilarpatternofchange,althoughthecooling around thecentralequatorisnotsosignificantasforthecaseofpIOD (Fig.8d)because of weaker anomalous easterlies under GW (compare Fig.4d to Fig.4c).For the ETIO as a whole,the response of the zonal advection to pIOD is a cooling during its peak season and then a warming afterwards(Fig.9c), while the response to GW tends to warm the region during September-December(Fig.9d).Over the WTIO,the change in the zonal advection is similar between the pIOD and GW, i.e.,a warming anomaly during May-November and cooling afterwards(Figs.9c and d).The overriding experiments indicate that the above changes for both cases are due to the wind stress effect(Figs.9c and d).
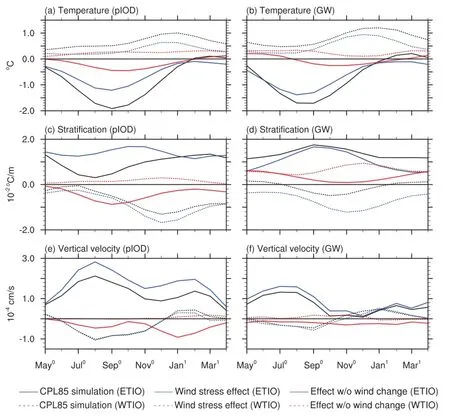
Fig.6.The pIOD-(left)and GW-induced(right)changes in(a,b)MLT,(c,d)stratification at a depth of 75 m,and(e,f)vertical velocity at a depth of 55 m over the ETIO(10?S-0?,90?-110?E)(solid lines)and the WTIO(10?S-10?N,50?-70?E)(dashed lines)in the CPL85 simulation(black),wind stress effect(FULL-STRS)(blue),and the effect in the absence of wind stress and wind speed changes(WIND-CTRL)(red).
5.3.Meridional advection
The meridional advection overall is a warming term in the tropical Indian Ocean(Fig.8e).Under both the pIOD and GW,its warming effect is enhanced north of the equator but reduced south of the equator(Figs.8e and f).Over the ETIO, the reduction appears to be most significant during the pIOD peak season,due to the wind stress change for both pIOD and GW(Figs.9e and f).Over the WTIO,the change in the meridional advection appears to be secondary in both cases (Figs.9e and f).
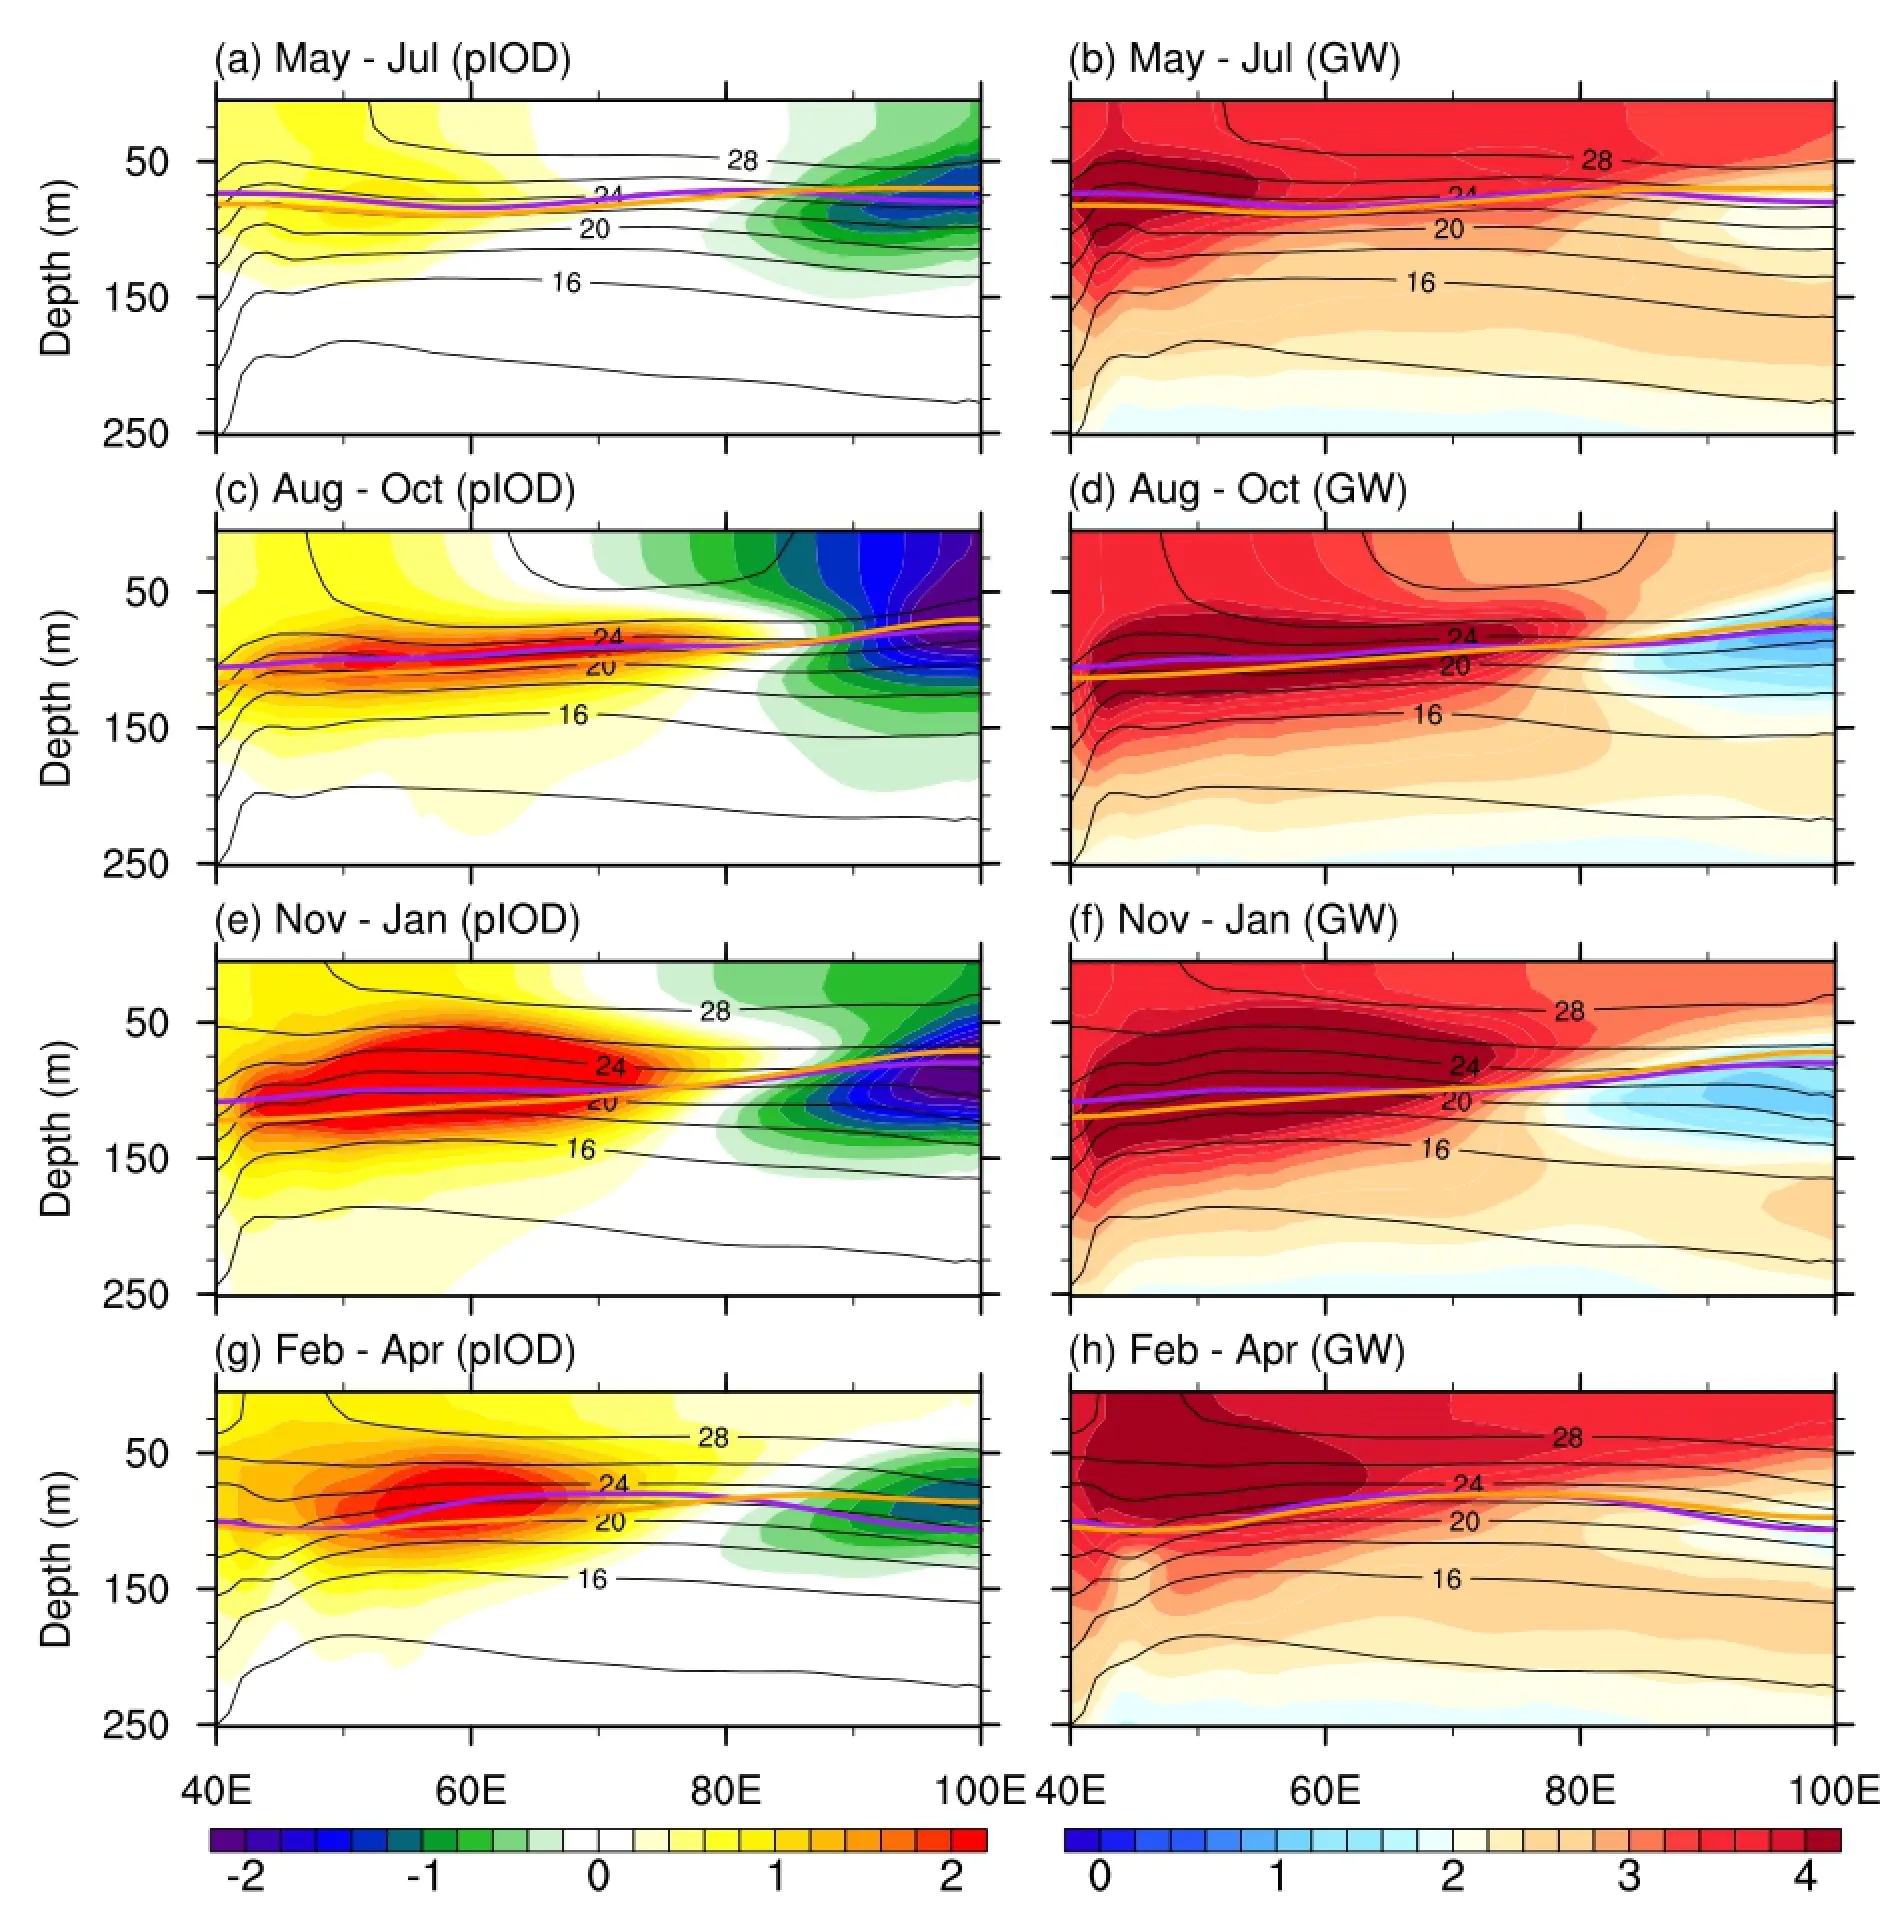
Fig.7.Seasonal evolution of temperature anomalies along 5?S(averaged between 6.5?S and 3.5?S)during the pIOD composite(left)and GW(right).Superimposed are the thermocline depth(thick purple lines from an average of 2006-25;thick yellow lines in the left-hand side panels from an average of the 17 pIOD composite members;and thick yellow lines in the right-hand side panels from an average of 2080-99)and the climatological temperature in CPL85(black contours).The thermocline depth is identified as the location of the maximum vertical gradient of temperature.
5.4.Net surface heat flux
The net surface heat flux H is the major heating term for the tropical Indian Ocean(Fig.8g).During the pIOD, the heating increases over the ETIO but decreases over the WTIO,i.e.,its change tends to damp the formation of pIOD (Figs.8g and 9g).Under GW(Fig.8h and 9h),its changing pattern is similar to that during the pIOD,except the weaker heating anomaly over the ETIO.In addition,the overriding experiments reveal that it is the wind stress effect that plays a dominant role for its seasonal evolution(Figs.9g and h),verifying that the Bjerknes feedback is at work in both the pIOD and GW cases.
5.5.Diffusion
Derived as the residual of the thermodynamic equation, the diffusion term is a heating effect at the equatorial Indian Ocean,with a maximum over the ETIO(Fig.8i).In both the pIOD and GW cases,the diffusive heating is enhanced in the ETIO,compensating the vertical advective cooling there (Figs.9i and j).This change may be explained as follows: The pattern of temperature change indicates that the ocean stability in the upper layer of the ETIO is increased(Fig.7). This suppresses the vertical diffusivity through a Richardson number-dependent parameterization of the vertical diffusivity(Pacanowski and Philander,1981)and,in turn,the colddiffusive flux and entrainment,resulting in an anomalous diffusive warming(e.g.,Yang et al.,2009).Seasonally,the diffusive heating reaches a maximum during July and this variation is due mainly to the wind stress effect for both pIOD and GW(Figs.9i and j).
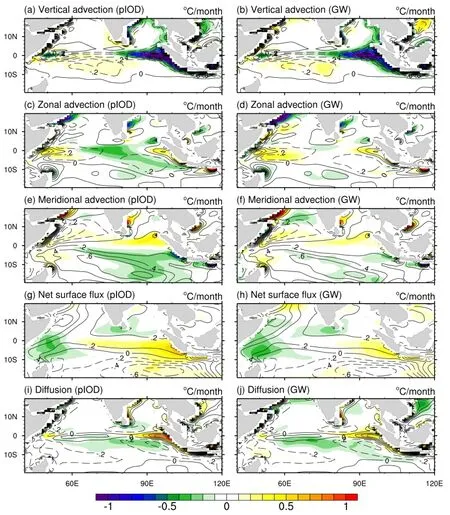
Fig.8.ThepIOD-(left)andGW-induced(right)changesintheheatbudgettermsduringAugust-October:(a,b)vertical advection;(c,d)zonal advection;(e,f)meridional advection;(g,h)net surface heat flux;(i,j)diffusion.Superimposed are their climatological fields of the corresponding variables in CPL85.
6.Conclusions and discussion
It has been reported that GW induces a pIOD-like response in the tropical Indian Ocean,with features such as reduction in the strength of equatorial winds,increased warming in the WTIO,and decreased warming in the ETIO accompanied by a shoaling of the thermocline.By employing the coupled CESM and the ocean-alone POP2,this study investigates the similarity and difference of the formation mechanisms for the changes in the tropical Indian Ocean during the pIOD versus GW.In addition,an overriding technique is employed as a diagnostic tool to isolate and evaluate the role of wind changes in the robust features of the tropical Indian Ocean.The overriding technique enables an isolation of individual feedbacks(e.g.,the wind-thermocline-SST feedback)from other factors(Lu and Zhao,2012;Luo et al.,2014).
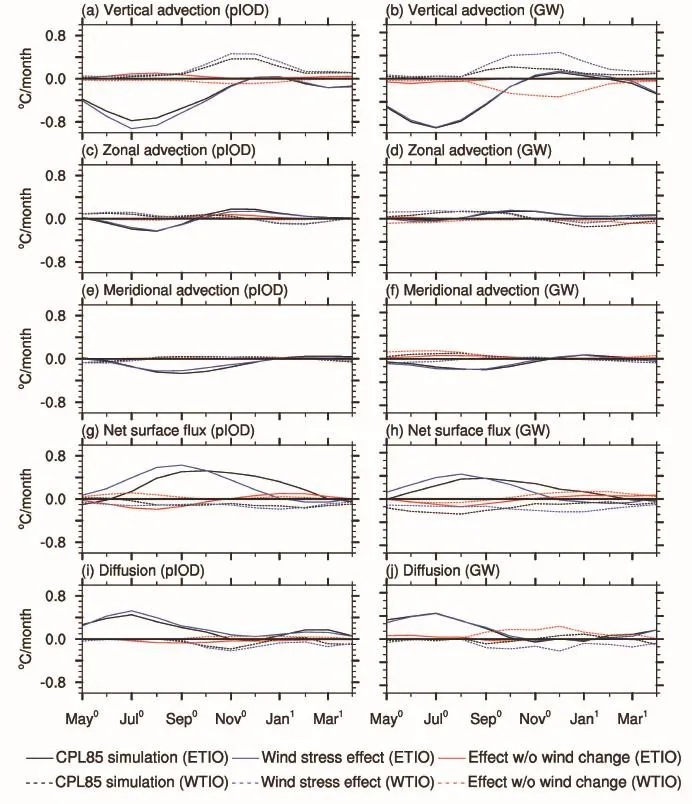
Fig.9.The pIOD-(left)and GW-induced(right)changes in(a,b)vertical advection,(c,d)zonal advection,(e,f)meridional advection,(g,h)net surface heat flux,and(i,j)diffusion over the ETIO(10?S-0?,90?-110?E)(solid lines)and the WTIO (10?S-10?N,50?-70?E)(dashed lines)in the CPL85 simulation(black),wind stress effect(FULL-STRS)(blue),and the effect in the absence of wind stress and wind speed changes(WIND-CTRL)(red).
Results show that the formation processes and the related seasonality are quite similar between the internal pIOD and GW.Inparticular,thewind-thermocline-SSTfeedback is the leading mechanism in producing the anomalous cooling over the ETIO in both cases.Nevertheless,some differences are found between them and are summarized as follows:
?Although the total effect of vertical advection is a cooling over the ETIO during both pIOD and GW,the cooling in the pIOD is dominated by the vertical velocity change while the cooling in the GW is dominated by the stratification change.
?The overriding experiments reveal that,over the ETIO, the contribution from the effect without the wind changes tothe stratification is opposite:the upper ocean is less stratified and thus has a warming effect during the pIOD,but it is more stratified and thus has a cooling effect under GW.
?GW induces a regional surface cooling(i.e.,a minimum warming)over the southeast tropics.This is because the anomalous atmospheric heat flux,which warms the surface ocean during the pIOD,is significantly reduced under GW.
To validate the robustness of the results presented from our local CESM run(i.e.,CPL85),three members of RCP8.5 simulations with CESM are obtained from NCAR.A comparison of the surface and subsurface maps of various variables(not shown)reveals that GW-induced features over the tropical Indian Ocean from the ensemble simulations are reproduced well by the local run,suggesting that our modeling approach is reliable for examining the oceanic response in the tropical Indian Ocean to GW.
The result that the WES feedback on the changes in the tropical Indian Ocean is negligible should be taken with caution,since prescribing the atmospheric conditions in the ocean-alone model compromises the full WES effect,which can in turn feed back to the atmosphere.Further experiments with CESM in partially coupled settings are underway to tease out the specific effects of WES in the SST response of the tropical Indian Ocean to GW.
Acknowledgements.This work is supported by the National Basic Research Program of China(Grant No.2012CB955600),the“Strategic Priority Research Program”of the Chinese Academy of Sciences(Grant No.XDA11010302),the National Natural Science Foundation of China(Grant No.41376009),the Joint Program of Shandong Province and National Natural Science Foundation of China(Grant No.U1406401),and the National Science Foundation (Grant No.AGS-1249173).Y.LUO would also like to acknowledge the support from the Zhufeng and Taishan Projects of the Ocean University of China.J.LU is supported by the Office of Science of the U.S.Department of Energy as part of the Regional and Global Climate Modeling program.
Open Access This article is distributed under the terms of the Creative Commons Attribution 4.0 International License(http://creativecommons.org/licenses/by/4.0/),which permitsunrestricted use,distribution,and reproduction in any medium,provided you give appropriate credit to the original author(s)and the source,provide a link to the Creative Commons license,and indicate if changes were made.
REFERENCES
Alory,G.,and G.Meyers,2009:Warming of the upper equatorial Indian Ocean and changes in the heat budget(1960-99).J. Climate,22,93-113.
Baquero-Bernal,A.,M.Latif,and S.Legutke,2002:On dipolelike variability of sea surface temperature in the tropical Indian Ocean.J.Climate,15,1358-1368.
Behera,S.K.,J.J.Luo,S.Masson,S.A.Rao,H.Sakuma,and T. Yamagata,2006:A CGCM study on the interaction between IOD and ENSO.J.Climate,19,1688-1705.
Bjerknes,J.,1969:Atmospheric teleconnections from the equatorial Pacific.Mon.Wea.Rev.,97,163-172.
Cai,W.,X.T.Zheng,E.Weller,M.Collins,T.Cowan,M. Lengaigne,W.D.Yu,and T.Yamagata,2013:Projected response of the Indian Ocean Dipole to greenhouse warming. Nature Geoscience,6,999-1007.
Cai,W.,A.Santoso,G.J.Wang,E.Weller,X.L.Wu,K.Ashok, Y.Masumoto,and T.Yamagata,2014:Increased frequency of extremeIndianOceanDipoleeventsduetogreenhousewarming.Nature,510,254-258.
Clement,A.,P.DiNezio,and C.Deser,2011:Rethinking the Ocean's role in the Southern Oscillation.J.Climate,24, 4056-4072,doi:10.1175/2011JCLI3973.1.
DiNezio,P.N.,A.C.Clement,and G.A.Vecchi,2010:Reconciling differing views of tropical Pacific climate change.Eos, Trans.Amer.Geophys.Union,91,141-142.
Huang,P.Y.,Y.Xue,H.Wang,W.Q.Wang,and A.Kumar,2012: Mixed layer heat budget of the El Ni?no in NCEP climate forecast system.Climate Dyn.,39,365-381.
Iskandar,I.,W.Mardiansyah,D.Setiabudidaya,A.K.Affandi,and F.Syamsuddin,2014:Surface and subsurface oceanic variability observed in the eastern equatorial Indian Ocean during three consecutive Indian Ocean dipole events:2006-2008.AIP Conference Proceedings 1617,48, doi:10.1063/1.4897101.
Lau,N.C.,and M.J.Nath,2004:Coupled GCM simulation of atmosphere-ocean variability associated with zonally asymmetric SST changes in the tropical Indian Ocean.J.Climate, 17,245-265.
Li,T.,Y.S.Zhang,E.Lu,and D.L.Wang,2002:Relative role of dynamic and thermodynamic processes in the development of theIndianOceandipole:AnOGCMdiagnosis.Geophys.Res. Lett.,29,2110,doi:10.1029/2002GL015789.
Li,T.,B.Wang,C.P.Chang,and Y.S.Zhang,2003:A theory for the Indian Ocean dipole-zonal mode.J.Atmos.Sci.,60, 2119-2135.
Lu,J.,and B.Zhao,2012:The role of oceanic feedback in the climate response to doubling CO2.J.Climate,25,7544-7563.
Luo,Y.Y.,Q.Y.Liu,and L.M.Rothstein,2009:Simulated responseofNorthPacificModeWaterstoglobalwarming.Geophys.Res.Lett.,36,L23609,doi:10.1029/2009GL040906.
Luo,Y.Y.,J.Lu,F.K.Liu,and W.Liu,2014:Understanding the El Ni?no-like oceanic response in the tropical Pacific to global warming.Climate Dyn.,doi:10.1007/s00382-014-2448-2.
Murtugudde,R.,J.P.McCreary,and A.J.Busalacchi,2000: Oceanic processes associated with anomalous events in the Indian Ocean with relevance to 1997-1998.J.Geophys.Res., 105,3295-3306.
Pacanowski,R.C.,and S.G.H.Philander,1981:Parameterization of vertical mixing in numerical models of tropical oceans.J. Phys.Oceanogr.,11,1443-1451.
Saji,N.H.,and T.Yamagata,2003:Structure of SST and surface wind variability during Indian Ocean dipole mode events: COADS observations.J.Climate,16,2735-2751.
Saji,N.H.,B.N.Goswami,P.N.Vinayachandran,and T.Yamagata,1999:A dipole mode in the tropical Indian Ocean. Nature,401,360-363.
Vecchi,G.A.,and B.J.Soden,2007:Global Warming and the Weakening of the Tropical Circulation.J.Climate,20,4316-4340.
Vinayachandran,P.N.,S.Iizuka,and T.Yamagata,2002:IndianOcean dipole mode events in an ocean general circulation model.Deep-Sea Res.,49,1573-1596.
Yang,H.J.,F.Y.Wang,and A.D.Sun,2009:Understanding the ocean temperature change in global warming:The tropical Pacific.Tellus A,61,371-380.
Yu,J.Y.,and K.M.Lau,2004:Contrasting Indian Ocean SST variability with and without ENSO influence:A coupled atmosphere-ocean study.Meteor.Atmos.Phys.,90,179-191, doi:10.1007/s00703-004-0094-7.
Zheng,X.T.,S.P.Xie,G.A.Vecchi,Q.Y.Liu,and J.Hafner, 2010:IndianOceandipoleresponsetoglobalwarming:Analysis of ocean-atmospheric feedbacks in a coupled model.J. Climate,23,1240-1253.
Zheng,X.T.,S.P.Xie,Y.Du,L.Liu,G.Huang,and Q.Y.Liu, 2013:Indian Ocean dipole response to global warming in the CMIP5 multimodel ensemble.J.Climate,26,6067-6080.
Zhong,A.H.,H.H.Hendon,and O.Alves,2005:Indian Ocean variability and its association with ENSO in a global coupled model.J.Climate,18,3634-3649.
Luo,Y.Y.,J.Lu,F.K.Liu,and X.Q.Wan,2016:The positive Indian Ocean Dipole-like response in the tropical Indian Ocean to global warming.Adv.Atmos.Sci.,33(4),476-488,
10.1007/s00376-015-5027-5.
25 January 2015;revised 3 June 2015;accepted 9 July 2015)
?Yiyong LUO
Email:yiyongluo@ouc.edu.cn
 Advances in Atmospheric Sciences2016年4期
- Advances in Atmospheric Sciences的其它文章
- Response of North Pacific Eastern Subtropical Mode Water to Greenhouse Gas Versus Aerosol Forcing
- Impact of the Pacific-Japan Teleconnection Pattern on July Sea Fog over the Northwestern Pacific:Interannual Variations and Global Warming Effect
- Change of Tropical Cyclone Heat Potential in Response to Global Warming
- The Southwest Indian Ocean Thermocline Dome in CMIP5 Models: Historical Simulation and Future Projection
- Historical Change and Future Scenarios of Sea Level Rise in Macau and Adjacent Waters
- Changes in Mixed Layer Depth and Spring Bloom in the Kuroshio Extension under Global Warming