
Matrix effect suppressing in the element analysis of soils by laser-induced breakdown spectroscopy with acoustic correction
2023-12-18 03:54:50ZhiquanHE何智權(quán)LiLIU劉莉ZhongqiHAO郝中騏ZhishuaiXU徐智帥QiWANG王奇YingLU盧穎ZiyiZHAO趙梓屹JiulinSHI史久林andXingdaoHE何興道
Plasma Science and Technology 2023年12期
Zhiquan HE (何智權(quán)) ,Li LIU (劉莉),2 ,Zhongqi HAO (郝中騏),2,3,* ,Zhishuai XU (徐智帥) ,Qi WANG (王奇) ,Ying LU (盧穎) ,Ziyi ZHAO (趙梓屹),Jiulin SHI (史久林),2,3 and Xingdao HE (何興道),2,3
1 Key Laboratory of Opto-electronic Information Science and Technology of Jiangxi Province,Nanchang Hangkong University,Nanchang 330063,People’s Republic of China
2 Jiangxi Engineering Laboratory for Optoelectronics Testing Technology,Nanchang Hangkong University,Nanchang 330063,People’s Republic of China
3 Key Laboratory of Nondestructive Testing (Nanchang Hangkong University),Ministry of Education,Nanchang 330063,People’s Republic of China
Abstract Laser-induced breakdown spectroscopy (LIBS) has been used for soil analysis,but its measurement accuracy is often influenced by matrix effects of different kinds of soils.In this work,a method for matrix effect suppressing was developed using laser-induced plasma acoustic signals to correct the original spectrum,thereby improving the analysis accuracy of the soil elements.A good linear relationship was investigated firstly between the original spectral intensity and the acoustic signals.The relative standard deviations(RSDs)of Mg,Ca,Sr,and Ba elements were then calculated for both the original spectrum and the spectrum with the acoustic correction,and the RSDs were significantly reduced with the acoustic correction.Finally,calibration curves of Mg I 285.213 nm,Ca I 422.673 nm,Sr I 460.733 nm and Ba II 455.403 nm were established to assess the analytical performance of the proposed acoustic correction method.The values of the determination coefficient(R2)of the calibration curves for Mg,Ca,Sr,and Ba elements,corrected by the acoustic amplitude,are improved from 0.9845,0.9588,0.6165,and 0.6490 to 0.9876,0.9677,0.8768,and 0.8209,respectively.The values of R2 of the calibration curves corrected by the acoustic energy are further improved to 0.9917,0.9827,0.8835,and 0.8694,respectively.These results suggest that the matrix effect of LIBS on soils can be clearly improved by using acoustic correction,and acoustic energy correction works more efficiently than acoustic amplitude correction.This work provides a simple and efficient method for correcting matrix effects in the element analysis of soils by acoustic signals.
Keywords: laser-induced breakdown spectroscopy,acoustic correction,matrix effect,calibration curve,relative standard deviation
1.Introduction
It is of great significance to measure quantitatively the concentration of various elements in soil in different areas,such as agriculture,environmental protection,geological exploration and so on [1].Laser-induced breakdown spectroscopy(LIBS) is an atomic emission spectroscopy technique based on the interaction between high-power lasers and matter,which generates a transient plasma and analyzes the composition information of a sample through the emission spectra of the atoms or ions splashed from the plasma[2].Compared to traditional chemical analysis methods,LIBS has some unique advantages,such as rapid measurement,multi-elemental detection,and little or no sample preparation [3].Due to the aforementioned advantages,LIBS has become an attractive technique for soil elements analysis in the past decade [4-7],where the concentration of metal element(such as Mg,Ca,Sr and Ba) is of great importance for geochemical studies and mineral resources.
The measurement of soil elements by LIBS is heavily influenced by matrix effects,which arise from the complex chemical composition and structure of different soils [8].Matrix effects originate from changes in the physical or chemical properties of the sample matrix that affect the measurement signal.Consequently,when measuring a certain element in samples with different matrices,even if the content of the measured element is the same,different measurement signals will be obtained [9].Therefore,it is critical to suppress the impact of matrix effects for the element analysis of soils by LIBS.
The main method to eliminate matrix effects is data processing,where the original spectral intensity after data processing can more accurately reflect the concentration information of the measured element in the sample [10].Internal standard analysis [11-13] is a common data processing method.The internal standard method involves selecting an element from the sample as the internal standard element,which can be artificially added to the sample or can be a main element with similar content in various samples.However,since a diverse range of the elements in soil,it is difficult to find a main element with similar content in the soil,making the application of the internal standard method less effective in improving matrix effects in soil analysis by LIBS [14].In addition,normalization is also a common data processing method in LIBS,which utilizes the correlation between a reference signal and the original spectral intensity to suppress the effects of matrix effects and experimental parameter fluctuations,such as using the electric current [15,16],ablated mass [17,18],and plasma emission images [19-21]for normalization.
For external signal normalization,the acoustic wave generated by the plasma has been proven to be an effective reference signal[22].During the process of laser ablation,the expansion of material particles leads to collisions between the ablated particles and ambient gas molecules,generating plasma acoustic waves [23].The acoustic waves exhibit a favorable linear correlation with ablation mass and can thus be utilized to normalize spectral signals,reducing the impact of pulse-to-pulse ablation mass fluctuations and inter-sample variations in ablation mass [24-27].
Popov et al investigated the effect of compression force,moisture,and total content of easily ionized elements on plasma parameters and intensity of analytical signals for different types of geomaterials [28].Labutin et al proposed the first and the eighth minima of the OA signal and an AE signal originating from the solid sample matrix(aluminum)at k=396.1 nm as reference signals [29].Li et al proposed adaptive weighted normalization-LWNet (AWN-LWNet)framework to reduce the matrix effect in two soil types [30].Sun et al used machine learning algorithms,specifically a back-propagation neural network,to develop a multivariate model that incorporates the concept of generalized spectrum to explicitly include information about the soil matrix [31].Wang et al used external normalization strategies based on plasma acoustic signals,plasma images,and the acousticimage combination to improve the stability of underwater LIBS for oceanic applications [32].
Analyzing the alkali-earth metal elements (Mg,Ca,Sr,and Ba) provides important information about soil quality,plant growth and development,and ecological risks.These elements affect soil pH,plant nutrition,and quality,and their analysis can assist in adjusting fertilization techniques and improving crop yields.In addition,they can provide insight into soil suitability for certain plants and the potential ecological threats posed by the elements [33].These elements in soils can also be easily detected by LIBS systems.Therefore,the improvement effect of using audio correction on the measured concentrations of magnesium,calcium,strontium and barium elements in soil by LIBS will be investigated.
To our knowledge,there has been very little investigation into the use of acoustic correction for suppressing the matrix effect in soils.In this work,a method for correcting the spectrum using acoustic signals obtained from a condenser microphone near the induction plasma was proposed.Initially,features of acoustic signals and their relationship to the LIBS spectrum will be presented.The effectiveness of acoustic correction on reducing signal fluctuations and enhancing quantitative analysis will then be assessed.Our focus will be on comparing the results of the calibration curves obtained from the original LIBS signal,the LIBS signal corrected with acoustic amplitude,and the LIBS signal corrected with acoustic energy.
2.Experimental setup
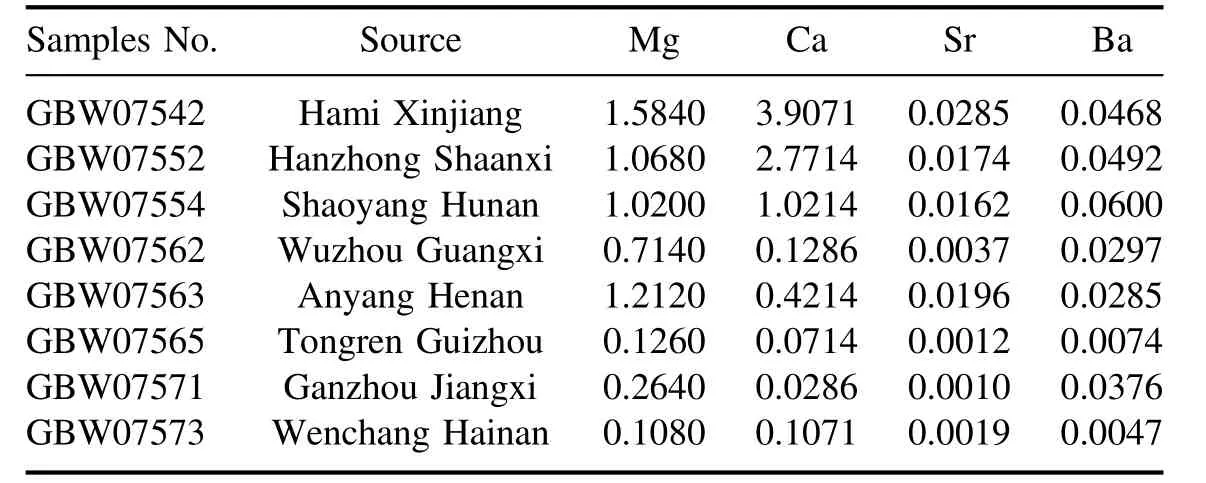
Table 1.Concentrations of Mg,Ca,Sr and Ba in the 8 soils samples (wt%).
Figure 1 shows the experimental setup for the acoustic correction LIBS system.The Nd:YAG laser (Continuum,Precision II)with a wavelength of 532 nm,a frequency of 10 Hz,and a pulse duration of 10 ns is used.The three-channel fiber spectrometer (Avantes,AvaSpec-ULS4096CL-3-EVO) has a maximum resolution of 0.05 nm,the integration time ranges from 1.1 ms to 10 min,and the detectable wavelength range is 200-450 nm.The CCD converts the collected optical signals into electrical signals,and the spectral data is obtained by computer software processing.The microphone (Superlux,ECM999) is a capacitance microphone with a frequency response range of 20-20 kHz and a sensitivity of-43 dBV Pa-1.The acoustic signals detected by the microphone are displayed on an oscilloscope,which can output the acoustic information to the computer.The oscilloscope(Pico,3203D) has a working bandwidth of 50 MHz and a sampling rate of 1 GS s-1.To prevent the sample from being damaged by continuous laser pulses at the same point,the soil sample is placed on a motorized XYZ translation stage.To measure the LIBS spectra and the corresponding acoustic signals simultaneously,the spectrometer collects the spectral data without averaging,and each set of spectral signals is repeated 20 times.The acoustic acquisition system is set to a length of 200 ms per grid (20 acoustic signals are collected per acquisition cycle of 2 s).Each sample is measured six times,and then the acoustic signals corresponding to the spectral signals can be obtained in this way.
Those samples used in the experiment were national standard plow layer soil samples from eight different provinces in China.The soil samples were air-dried and cleaned of debris,then ball-milled for 4-6 h using a high-alumina ceramic ball mill and sieved through a 20-mesh nylon screen.After mixing,the samples were dried at 105°C for 24 h,and then discharged after being mixed again using the ball mill.
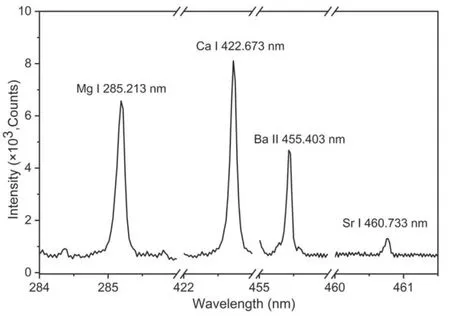
Figure2.Measured elemental spectrum from GSS-61 soil sample.
The concentrations of Mg,Ca,Sr and Ba elements in the soil samples are shown in table 1.To prevent splashing of the samples when the laser pulse hits them,the soil powder was pressed into pellets under 16 MPa pressure.Based on the NIST database,Mg I 285.213 nm,Ca I 422.673 nm,Sr I 460.733 nm,and Ba II 455.403 nm were determined as the elemental spectral lines for experimental analysis,the measured elemental spectrum is shown in figure 2.
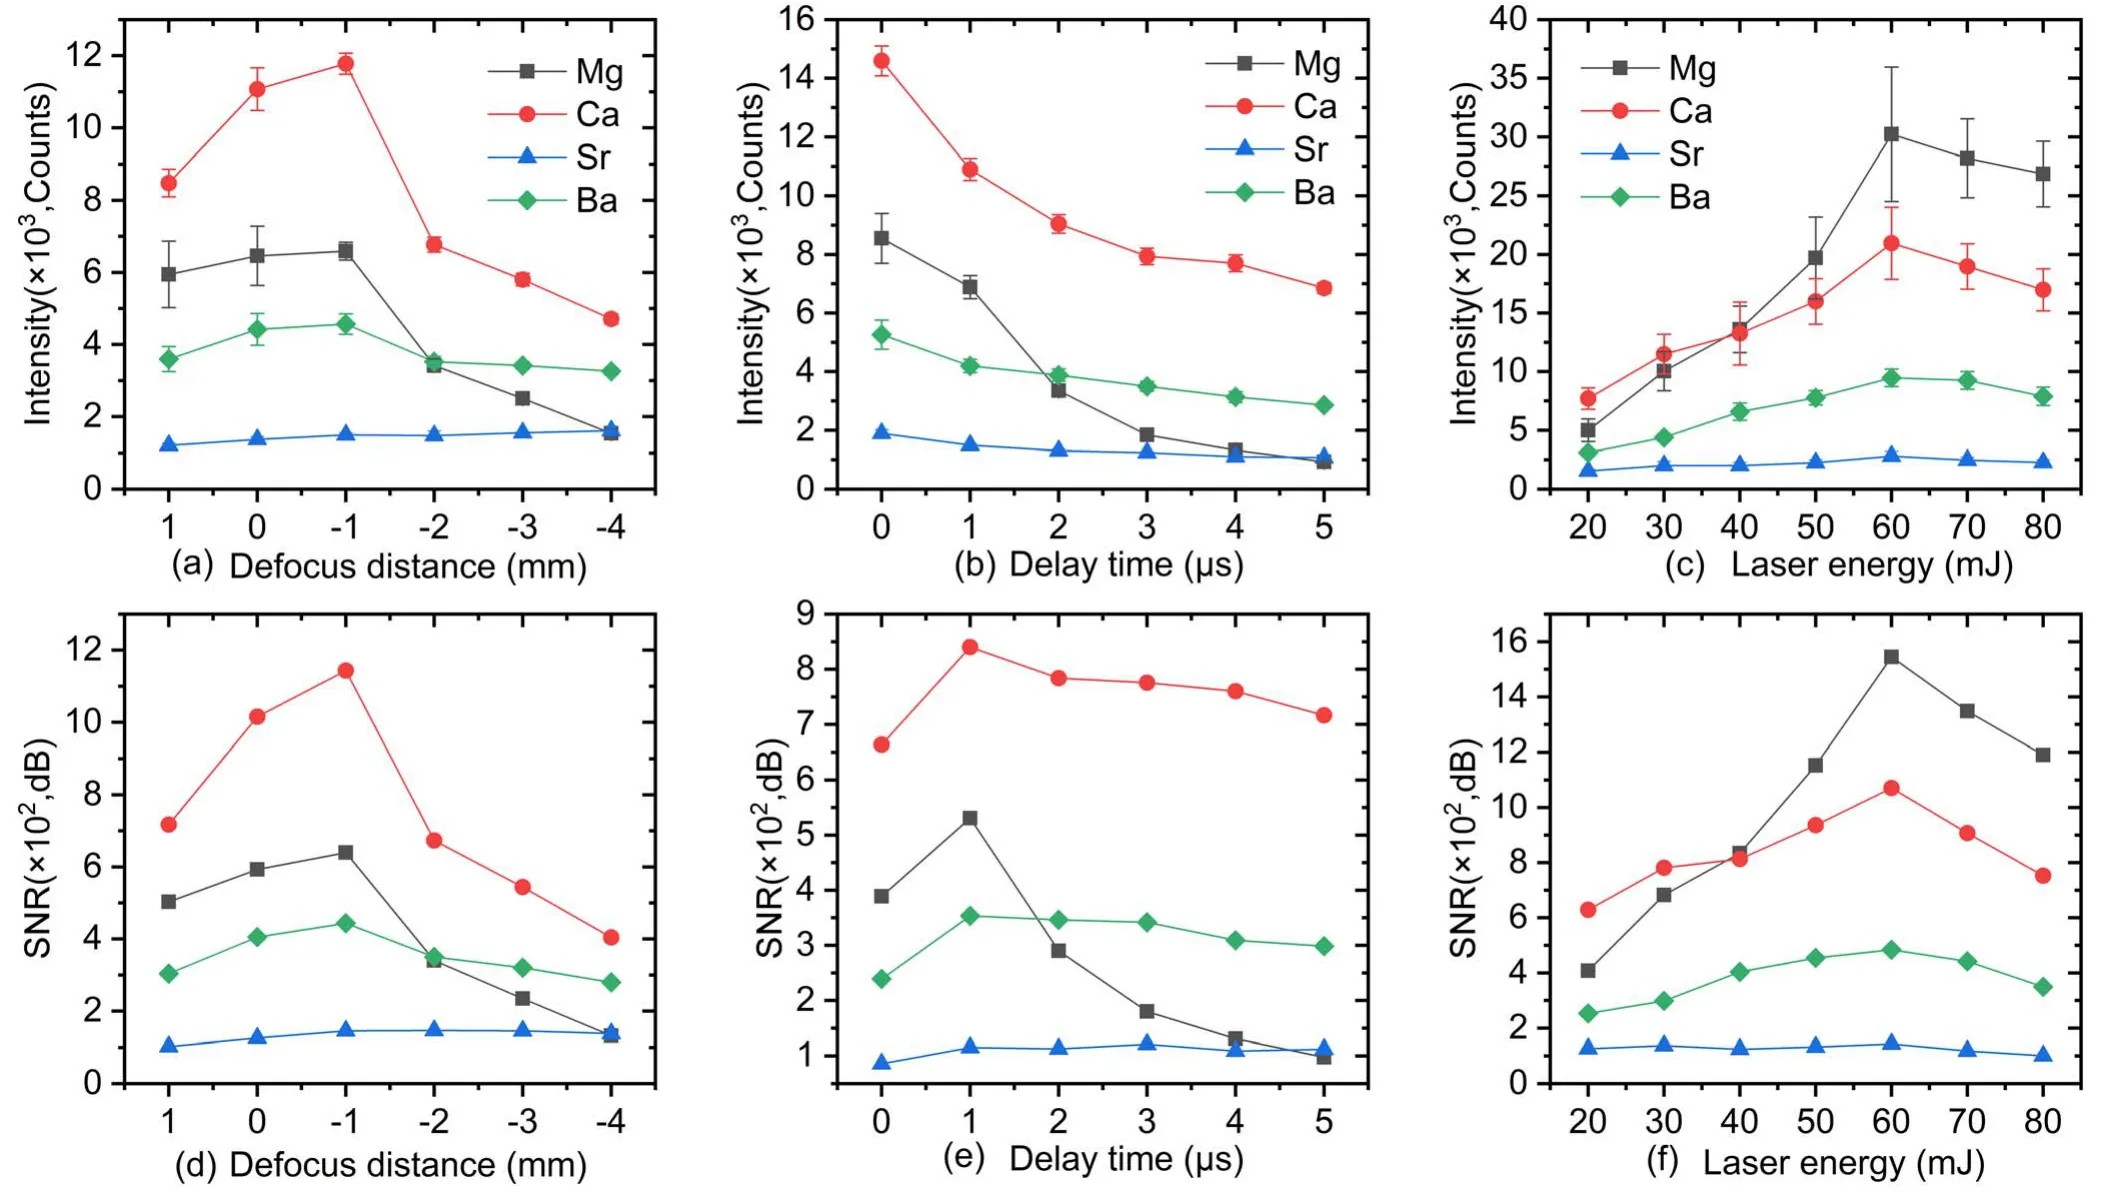
Figure3.Variation in intensity and SNR with defocus distance(a),(d),delay time(b),(e),and laser energy(c),(f)for Mg I 285.213 nm,Ca I 422.673 nm,Sr I 460.733 nm,and Ba II 455.403 nm.
3.Results and discussion
3.1.Optimization of experimental parameters
It is necessary to collect both the spectral signal of the laserinduced plasma and its corresponding audio signal for acoustic correction.During the data collection process,various experimental factors may affect the accuracy of the results.For collecting the spectral signal,the factors include defocus distance,delay time,and laser energy.For collecting the audio signal,the factors include laser energy and the acoustic distance which represents the distance from the microphone to the sample.Therefore,it is essential to optimize these five main experimental parameters to obtain the best results for quantitative analysis,which is crucial for meaningful research and analysis.
To determine a suitable defocus distance,delay time and laser energy for quantitative analysis of Mg,Ca,Sr and Ba elements in soils’ sample,the intensity and signal-to-noise(SNR) of Mg I 285.213 nm,Ca I 422.673 nm,Sr I 460.733 nm,and Ba II 455.403 nm as a function of defocus distance,delay time and laser energy was studied.As shown in figure 3(a),decreasing defocus distance gradually from 1 to-4 mm with a gate width of 1 mm,the intensities increased gradually with the increasing of defocus distance from 1 to-1 mm,whereas the intensities decreased dramatically with the increasing of defocus distance after -1 mm.From figure 3(d),the SNRs have a similar variation rule with intensities.As shown in figures 3(b)and(e),increasing delay time gradually from 0 to 5 μs with a gate width of 1 μs,the intensities decreased gradually with the increasing of defocus distance from 1 to-1 mm,while the SNRs are first increased to 1 μs as the maximum,and then decreased.As shown in figures 3(c)and(f),increasing laser energy gradually from 20 to 80 mJ with a gate width of 10 mJ,the intensities increased with the increasing of laser energy from 20 to 60 mJ,however the intensities decreased gradually with the increasing of laser energy after 60 mJ and figure 3(d) also shows a similar variation rule with intensities.A higher SNR indicates that the environmental background has less of an impact on the experimental results.Therefore,the defocus distance,delay time and laser energy were fixed to-1 mm,1 μs and 60 mJ in this experiment,respectively.
To determine a suitable laser energy and acoustic distance for audio signal acquisition,the acoustic amplitude as a function of laser energy and acoustic distance was studied.The acoustic intensity as represented by the amplitude of the first acoustic peak is depicted in figure 4(a),with a laser energy range of 40-100 mJ.The results indicate a strong relationship between the acoustic signal and laser energy,as evidenced by the high determination coefficient R2of 0.9760 obtained through quadratic polynomial fitting.This suggests that the acoustic signal is likely to follow a quadratic function in relation to laser energy,rather than a linear function,which could be attributed to the plasma shielding effect observed at high laser energies.Figure 4(b) shows the dependence of the acoustic intensity on the acoustic distance in the range of 20-50 cm.We can also see a very good correlation between the acoustic signal and the acoustic distance.The determination coefficient R2is 0.9885,obtained from a quadratic polynomial fitting.It also indicates that the close acoustic distance may lead to the distorted audio signal.To avoid distortion of the audio signal and to make the audio signal work in the linear area,the laser energy and acoustic distance were fixed to 60 mJ and 40 cm,respectively.The final experimental parameter optimization results are shown in table 2.
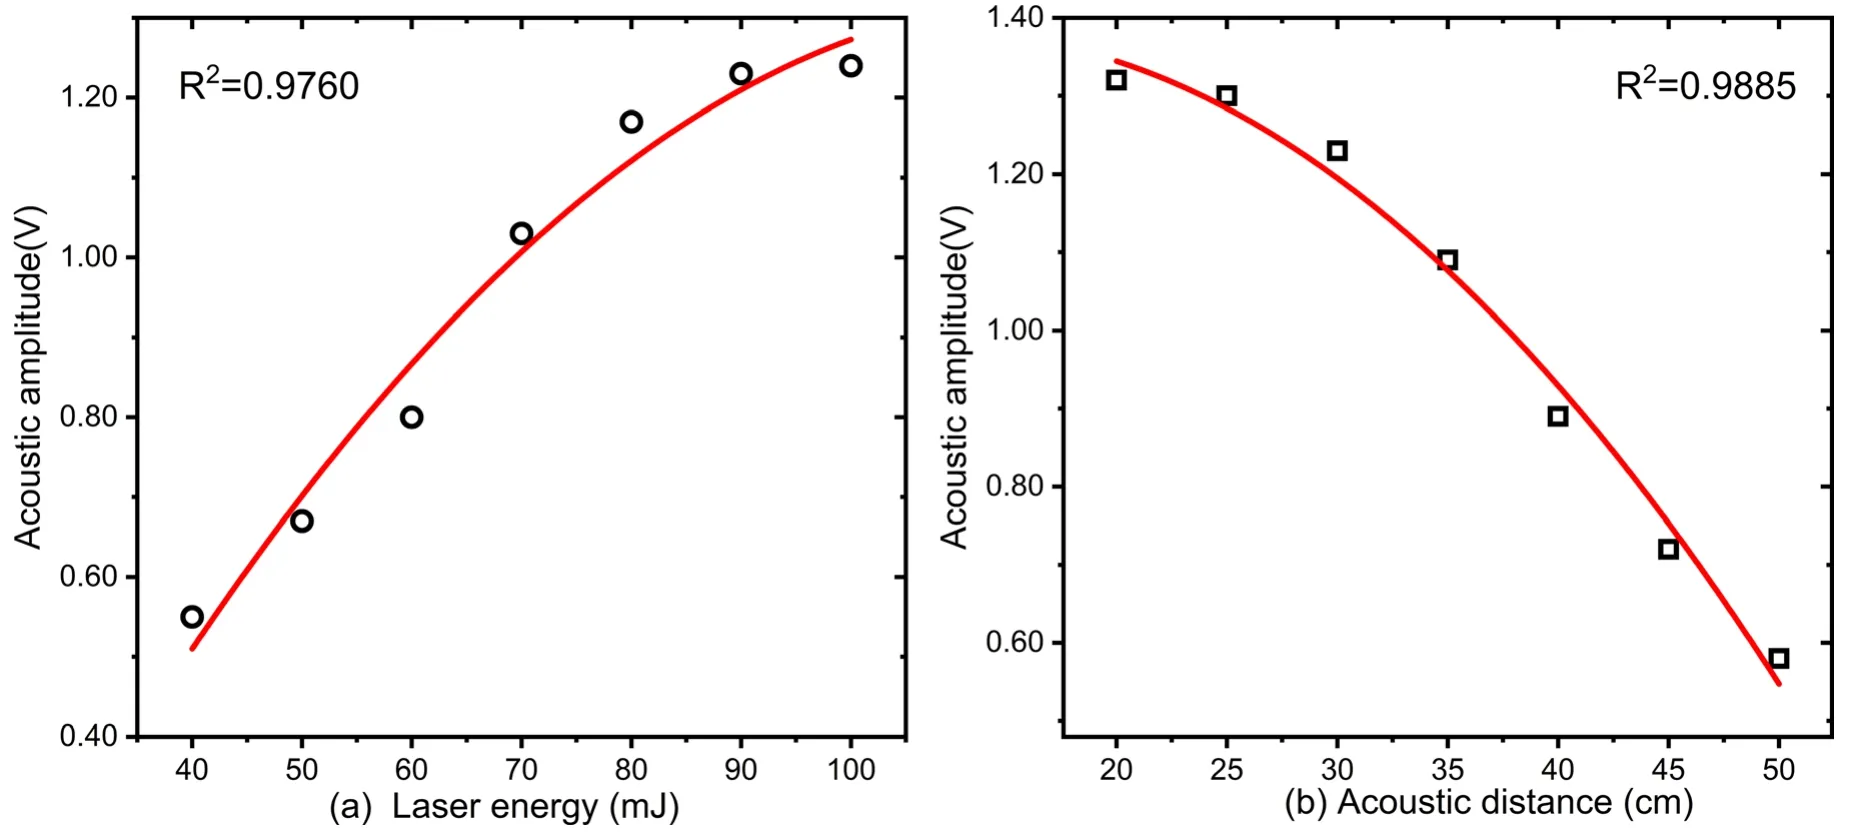
Figure4.Variation in acoustic amplitude with laser energy (a) and acoustic distance (b).
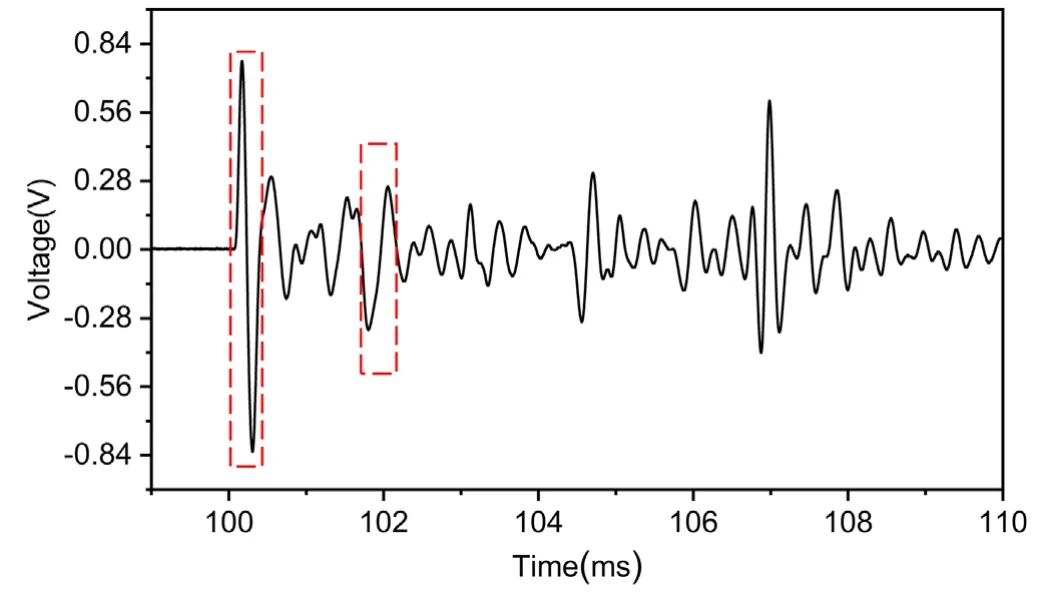
Figure5.Acoustic signal time-domain feature diagram.
3.2.Relationship between acoustic signals and spectrum intensity
The acoustic signal captured through a microphone was shown in figure 5,with two strong signals appearing at the beginning of the signal and about 2 ms after signal generation,respectively (marked in the figure).The first strong acoustic peak is caused by laser-induced optical breakdown,while the formation of the second one may be due to surface collapse of the sample [34].Apart from these two peaks,other peaks are actually caused by continuous reflection of the acoustic signal by the surrounding objects,and do not make sense to the laser breakdown process.In this experiment,the first strong signal(i.e.the first sine wave signal) was extracted,andcharacteristic parameters related to the acoustic signal were extracted to correct the original spectral intensity.
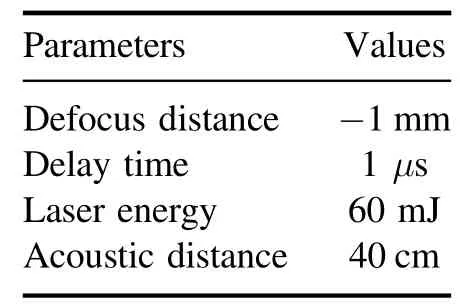
Table 2.Experimental parameter optimization results.
For acoustic signals,the first peak value is a suitable reference signal for correction because it varies in amplitude each time,allowing for the extraction of peak values of each signal segment for correction processing [22].Besides,the energy(E)of the first signal segment can also be extracted as a reference signal to discuss its effect on improving the matrix effects.The calculated formula of E is as follows:
where x(t) is the acoustic signal amplitude varies with time t,t1and t2are the integration times of 100.1 and 100.5 ms.Then,other signal segments were extracted from acoustic signal bands and integrated,respectively.
Figure 6 shows spectral intensity of Mg I 285.213 nm,Ca I 422.673 nm,Sr I 460.733 nm,and Ba II 455.403 nm as a function of (a) first acoustic peak amplitude and (b) laser energy.The solid lines represent the linear fitting of the data,and the Pearson correlation coefficients r are calculated and shown in each figure.The values of r between the first peak amplitude and the spectral intensity are close to or greater than 0.5 in absolute values,and negatively correlated.This is mainly due to the complex chemical composition of soil,where the amplitude of the acoustic signal generated by laserinduced breakdown plasma correlates with certain specific elements in the soil [35].Higher content of Mg,Ca,Sr,and Ba elements leads to lower acoustic signal amplitude during laser-induced breakdown,which indicates a negative correlation between these elements and acoustic amplitude.Comparison between figures 6(a) and (b) shows a stronger correlation between acoustic energy and spectral line intensity,where the absolute values of r for Mg,Ca,Sr,and Ba elements are increased from 0.4821,0.6087,0.5335,and 0.6490 to 0.5074,0.6319,and 0.7166,respectively.The improvement in correlation is the most significant for Ba element,while the absolute values of r for Ca element decrease contrarily,possibly due to the high content of Ca element in soil samples causing noticeable self-absorption,resulting in less obvious regularities in fitting with acoustic energy [36].
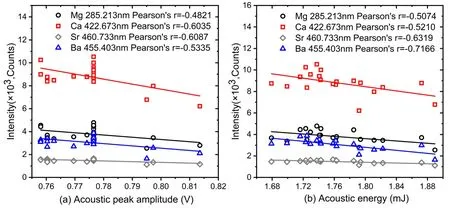
Figure6.Acoustic amplitude (a) and the acoustic energy (b) vary with the original spectral intensity.
3.3.Matrix effects suppressing with acoustic correction
The acoustic correction is a normalization method that uses an audio signal as a reference signal for the characteristic spectral lines of the detected element and is similar to the internal standard method in LIBS analysis [37].When the laser pulse hits the surface of the soil samples,the acquisition of acoustic signals will not be affected by matrix effects,and therefore acoustic signals can be used to correct the original spectral intensity[38].The formulas of acoustic amplitude and energy corrections are as follows:
where,I0represents the original spectral intensity,A represents the acoustic amplitude,and IArepresents the spectral intensity corrected by acoustic amplitude;E represents the acoustic energy,IErepresents the spectral intensity corrected by acoustic energy.

Figure7.RSDs of the original spectra line and spectra lines with acoustic amplitude correction and acoustic energy correction (AP:acoustic amplitude;AE: acoustic energy).
Different correction methods were employed to assess and compare the stability of LIBS signals.Figure 7 shows the relative standard deviations (RSDs) of the spectral intensities of Mg I 285.213 nm,Ca I 422.673 nm,Sr I 460.733 nm,and Ba II 455.403 nm without correction and with acoustic amplitude and energy corrections.The formulas of the RSDs of Mg,Ca,Sr and Ba elements are as follows:
where,Xiis the data measured by LIBS;n is the measurement time;M refers to the average of this set of data;S is the standard deviation of the measurement precision to be evaluated.
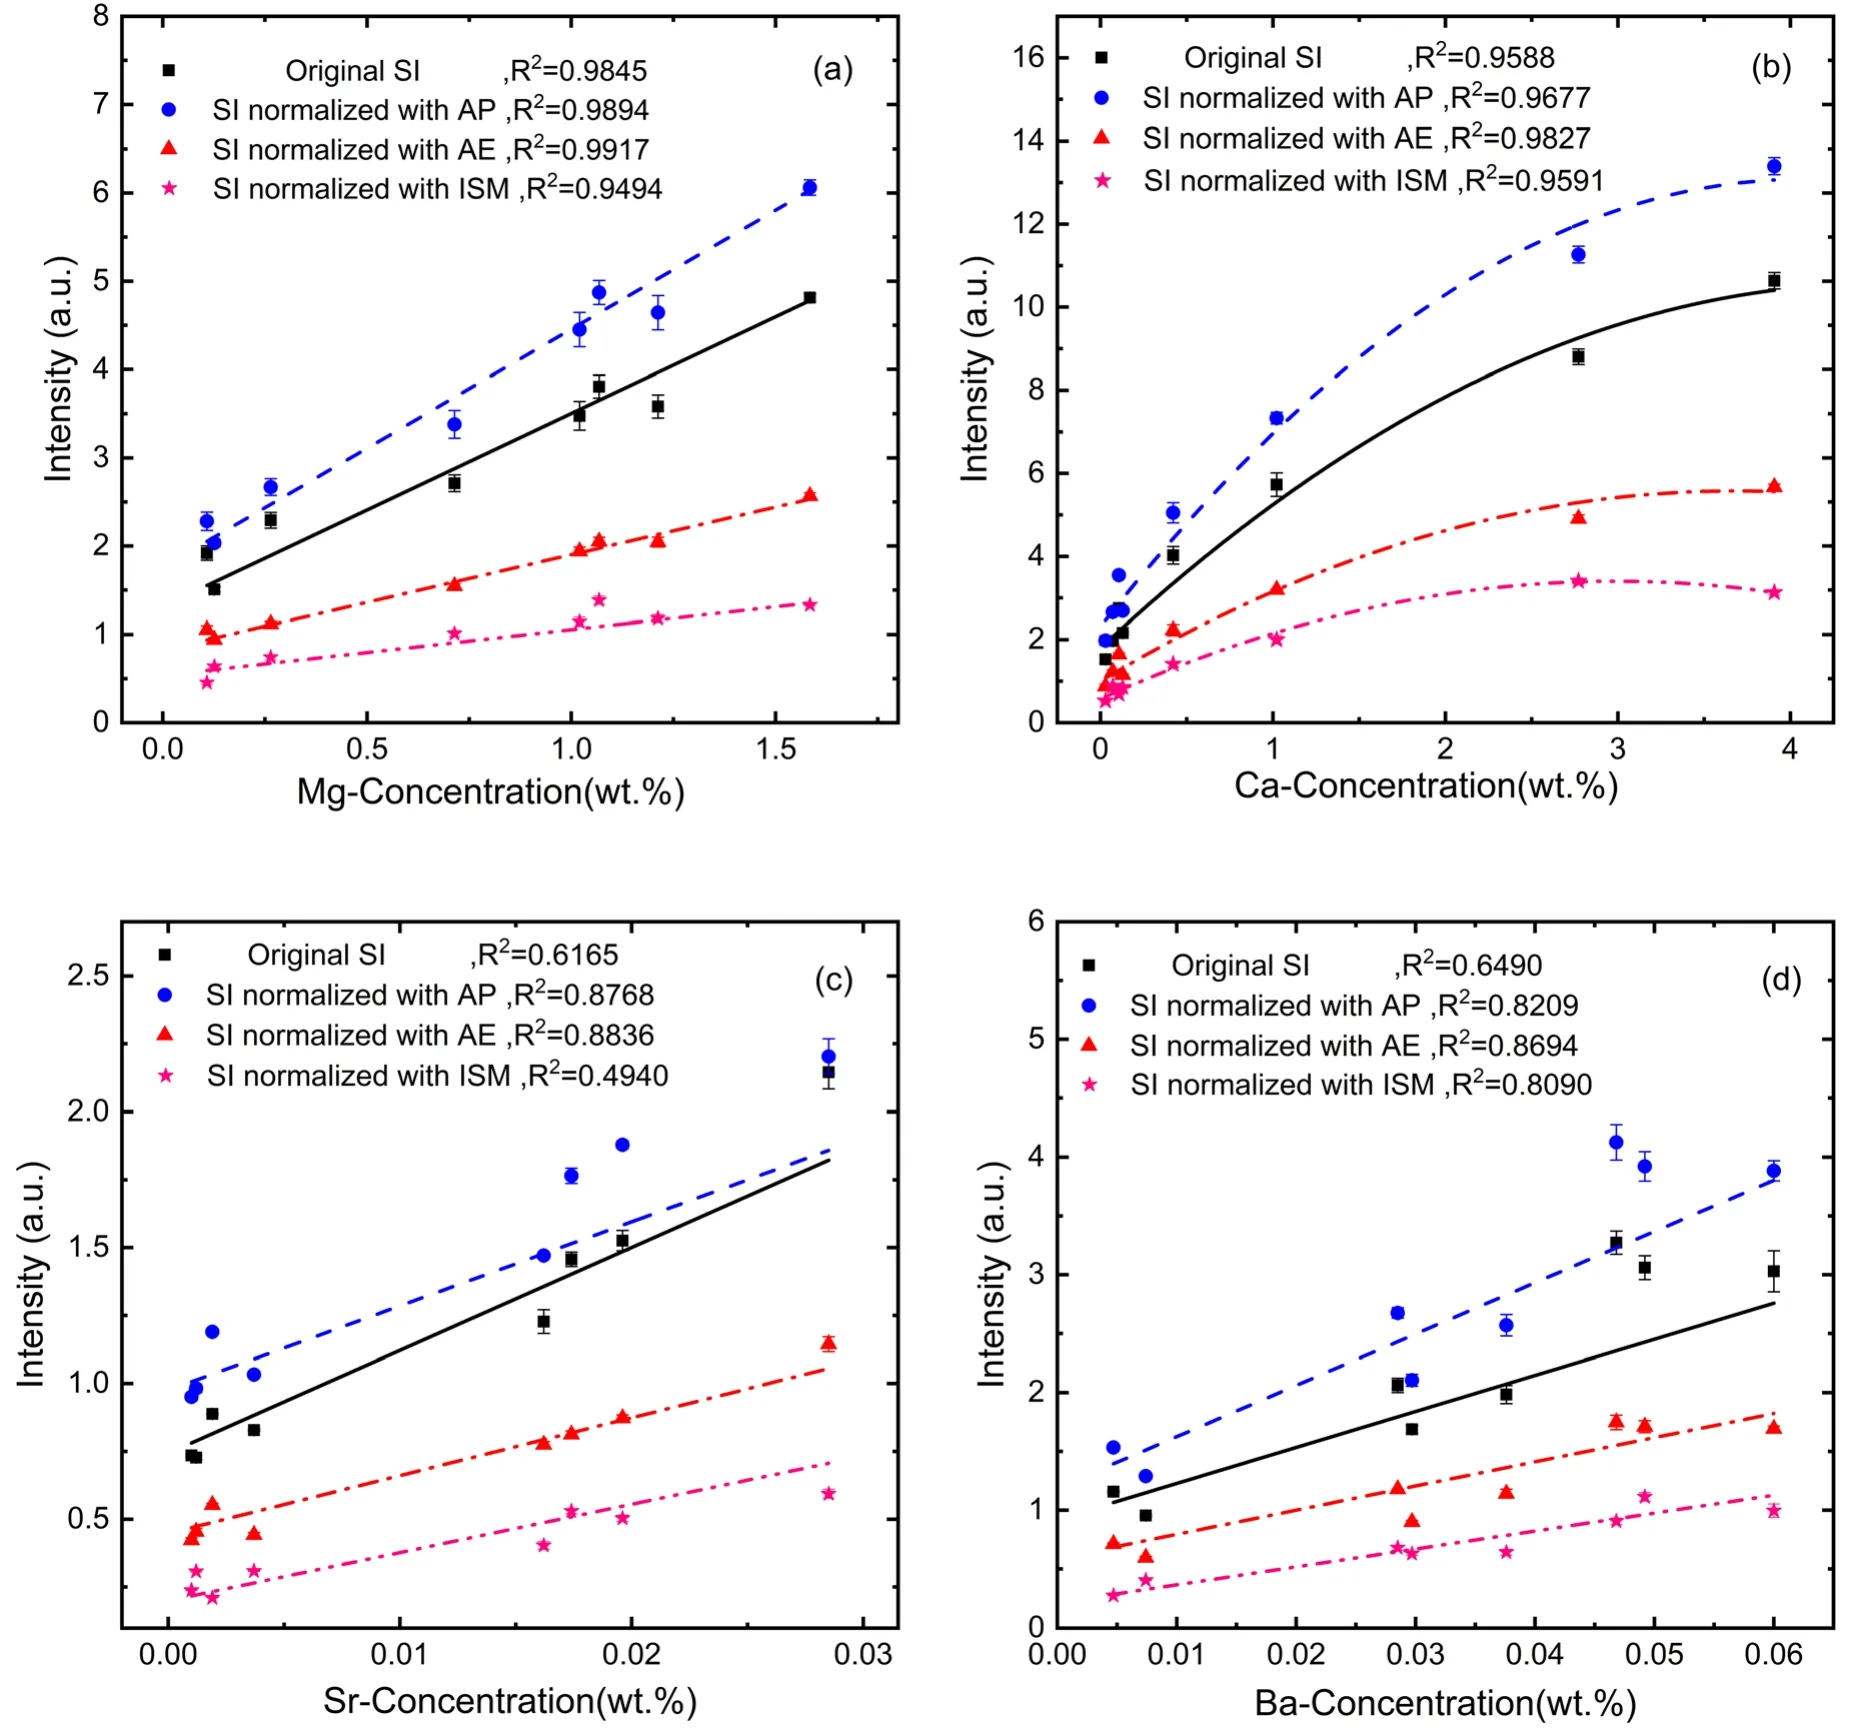
Figure8.Calibration curves of Mg(a),Ca(b),Sr(c)and Ba(d)obtained with the original spectral intensity,the spectral intensity corrected with acoustic amplitude,the spectral intensity corrected with acoustic energy,and the spectral intensity corrected with internal standard method.
Each RSD is calculated from 20 replicate spectra.As can be seen from figure 7,after correcting with acoustic amplitude,the RSDs for Mg,Ca,Sr,and Ba elements decreased from 3.26%,3.37%,1.59%,and 2.78% to 3.12%,2.82%,1.38%,and 2.3%,respectively.Furthermore,the RSDs were further reduced to 2.58%,2.76%,1.18%,and 1.96%by using acoustic energy correction.These results suggest that the stability of soils LIBS can be improved by using acoustic correction.Meanwhile,the acoustic energy correction had a better effect on reducing the LIBS signal fluctuation than acoustic amplitude correction.These results are consistent with the conclusion in figure 6 that the spectral line has a higher connection with the acoustic energy than with the acoustic amplitude.
Finally,calibration curves of Mg I 285.213 nm,Ca I 422.673 nm,Sr I 460.733 nm,and Ba II 455.403 nm were then established to assess the analytical performance of the proposed acoustic correction method.Figure 8 shows four calibration curves: solid for original lines,dotted for lines corrected by acoustic amplitude,dashed for lines corrected by acoustic energy,and double dash for lines corrected by internal standard method.The silicon content in 8 soil samples is similar,so silicon was selected as the internal standard element to correct the original spectra.The error bars correspond to RSDs of 6 sets of data obtained by averaging 20 replicate spectra.R2is the determination coefficient of the calibration curves that represents the degree of correlation between the experimental data and element concentration.The formulas of the R2of the calibration curves are as follows:
As shown in figure 8,after correction with acoustic amplitude,the values of R2for Mg,Ca,Sr,and Ba elements can be improved from 0.9845,0.9588,0.6165,and 0.6490 to 0.9876,0.9677,0.8768,and 0.8209,respectively.Moreover,after correction with acoustic energy,the values of R2can be further risen to 0.9917,0.9827,0.8835,and 0.8694,respectively.However,after correcting with the internal standard method,although the values of R2of Ca and Ba elements have been improved from 0.9588 and 0.6490 to 0.9591 and 0.8090,the effect is still weaker than that of acoustic correction,and the values of R2for correcting Mg and Sr elements using the internal standard method are decreased from 0.9845 and 0.6165 to 0.9494 and 0.4940.It should be noted that the calibration curves of Ca element were fitted quadratically while the others were fitted linearly.This is due to the self-absorption effects of Ca element,even whose concentration reaches a maximum of 3.91% in these soil samples [39].
According to the above results,it can be concluded that both acoustic energy correction and acoustic amplitude correction can suppress the matrix effects in soil analysis,and the correction effect is better than that of the internal standard method.These findings are consistent with the conclusions drawn from figure 6,which suggests that the spectral line has a higher correlation with the acoustic energy than with the acoustic amplitude,and from figure 7,which indicates that the use of acoustic energy is more effective in reducing the fluctuation of LIBS signals than acoustic amplitude.From the calibration curves of Sr and Ba elements in figures 8(c)and(d),the original calibration curves have low R2values (less than 0.65),while the values of R2of the calibration curves can be significantly improved after correcting with acoustic signals.It refers that the acoustic correction works very efficiently when the matrix effect has a great effect on the soil analysis by LIBS.
4.Conclusion
Serious matrix effects can affect the quantitative analysis accuracy of LIBS.In this work,a method was proposed to suppress the matrix effect by using the acoustic signals to correct the spectrum intensity.The acoustic amplitude and its energy were extracted and fitted with the original spectral intensity,which showed a linear negative correlation between them.In addition,the influence of the correction by using acoustic amplitude and acoustic energy on the RSDs of spectral intensity was studied which showed that acoustic correction can improve the stability of LIBS for soil analysis,and the acoustic energy has a better correction effect.The calibration curves of Mg I 285.213 nm,Ca I 422.673 nm,Sr I 460.733 nm,and Ba II 455.403 nm were then established before and after using acoustic correction.The determination coefficients (R2) were compared to assess the analytical performance of the proposed acoustic correction method.After correction with acoustic amplitude,the values of R2for Mg,Ca,Sr,and Ba elements can be improved from 0.9845,0.9588,0.6165,and 0.6490 to 0.9876,0.9677,0.8768,and 0.8209,respectively.Moreover,after correction with acoustic energy,the values of R2can be further risen to 0.9917,0.9827,0.8835,and 0.8694,respectively.Compared with the internal standard method,the acoustic signal correction has a much better effect on matrix effects.These results suggest that the matrix effect of LIBS on soils can be improved by using acoustic correction,and acoustic energy correction works more efficiently than acoustic peak amplitude correction.This work provides a simple and efficient method for correcting matrix effects in the element analysis of soils by acoustic signals.
Acknowledgments
This research was financially supported by National Natural Science Foundation of China (No.12064029),by Jiangxi Provincial Natural Science Foundation (No.20202BABL202024),and by the Open project program of Key Laboratory of Opto-Electronic Information Science and Technology of Jiangxi Province (No.ED202208094).
猜你喜歡
小讀者·閱世界(2023年8期)2023-08-29 07:36:35
知音(月末版)(2023年4期)2023-07-05 02:27:20
中國(guó)應(yīng)急管理科學(xué)(2022年2期)2022-05-23 05:51:18
湖北教育·綜合資訊(2022年4期)2022-05-06 22:54:06
大眾文藝(2021年13期)2021-07-31 11:04:34
小學(xué)生優(yōu)秀作文(低年級(jí))(2020年9期)2020-10-26 09:10:40
陜西檔案(2019年5期)2019-01-09 21:58:02
小學(xué)生作文·小學(xué)中高年級(jí)適用(2018年4期)2018-08-15 23:51:04
小學(xué)生作文·小學(xué)低年級(jí)適用(2017年7期)2017-09-23 06:35:30
女子世界(2017年8期)2017-08-07 23:45:39
 Plasma Science and Technology2023年12期
- Plasma Science and Technology的其它文章
- Automatic recognition of defects in plasmafacing material using image processingtechnology
- Physics design of 14 MeV neutron generator facility at the Institute for Plasma Research
- Numerical simulation of ultrashort-pulse reflectometry (USPR) on EAST
- Minimum inhibitory but maximum nonhemolytic concentration of plasma-treated catheters coated with L.tridentata and O.vulgare extracts
- Plasma synthesis of various polymorphs of tungsten trioxide nanoparticles using gliding electric discharge in humid air:characterization and photocatalytic properties
- Effect of different process conditions on the physicochemical and antimicrobial properties of plasma-activated water