
Characteristics of plasma in a novel laserassisted pulsed plasma thruster
2022-08-01 11:33:28YuanzhengZHAO趙元政YuZHANG張宇JianjunWU吳建軍YangOU歐陽(yáng)andPengZHENG鄭鵬
Plasma Science and Technology 2022年7期
Yuanzheng ZHAO(趙元政),Yu ZHANG(張宇),Jianjun WU(吳建軍),Yang OU(歐陽(yáng))and Peng ZHENG(鄭鵬)
College of Aerospace Science and Engineering,National University of Defense Technology,Changsha 410073,People’s Republic of China
Abstract A novel laser-assisted pulsed plasma thruster(LA-PPT)is proposed as an electric propulsion thruster,which separates laser ablation and electromagnetic acceleration.It aims for a higher specific impulse than that achieved with conventional LA-PPTs.Owing to the short-time discharge and the novel configuration,the physical mechanism of the discharge is unclear.Time and spatial-resolved optical emission spectroscopy was applied to investigate the variation in the plasma properties in the thruster discharge channel.The plasma species,electron temperature,and electron density were obtained and discussed.Our investigation revealed that there were Hα,Hβ,Hγ,Hε atoms,C I,C II,C III,C IV,Cl I,Cl II particles,and a small amount of CH,C3,C2,H2 neutral molecular groups in the plasma.The electron temperature of the discharge channel of the thruster was within 0.6–4.9 eV,and the electron density was within(1.1–3.0)′1018 cm?3,which shows that the optical emission spectroscopy method is to measure the electron excitation temperature and electron density in heavy particles.But the Langmuir probe method is to measure the temperature and density of free electrons.The use of laser instead of spark plug as the ignition mode significantly changed the plasma distribution in the discharge channel.Unlike the conventional PPT,which has high electron density near the thruster surface,LAPPT showed relatively large electron density at the thruster outlet,which increased the thruster specific impulse.In addition,the change in the ignition mode enabled the electron density in the LA-PPT discharge channel to be higher than that in the conventional PPT.This proves that the ignition mode with laser replacing the spark plug effectively optimised the PPT performance.
Keywords:laser-assisted pulsed plasma thruster,plasma properties,time and spatial-resolved optical emission spectroscopy
1.Introduction
The electric propulsion system has several advantages such as high specific impulse,long lifetime,repeatable start,low thrust,and high control accuracy.It can significantly increase the payload of spacecraft,extend their service life,and reduce their launch costs,it is therefore widely employed in microsatellites[1–5].Regarding electric propulsion systems,the pulsed plasma thruster(PPT)is considered suitable for microsatellites owing to its simple structure,low cost,high specific impulse at low power and precise thrust.Figure 1 shows the typical structure of the PPT.The capacitor,as an energy storage element,is charged to a high voltage.Initial plasma is generated by the ignition of a spark plug,which triggers breakdown between the anode and cathode.Then the capacitor produces the main discharge,and the arc is generated between the parallel plates,ablating and ionizing the propellant,which produces plasma ejected by Lorentz force,generating thrust.
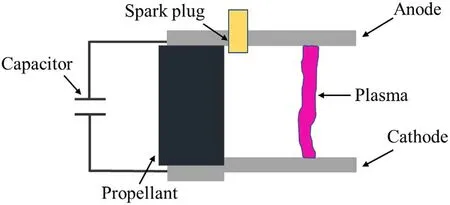
Figure 1.The schematic of PPT.
However,owing to the ‘late-time ablation’ phenomenon of the PPT,part of the propellant cannot be effectively used.No more than 40%–60%of the propellant ablated by a single pulse of the PPT can be effectively ionized and accelerated to generate an effective thrust[6].Moreover,owing to incomplete ionization and carbonisation of the propellant in the thruster discharge channel,the PPT suffers from the problem of carbon deposits in the ignition spark plug,which might lead to ignition failure.In order to solve the problem of‘late-time ablation’ and carbon deposits in the spark plug,a novel configuration of a laser-assisted pulsed plasma thruster(LA-PPT)is proposed as an electric propulsion thruster,which separates the laser ablation and electromagnetic acceleration processes.Figure 2 shows the structure of LAPPT.The propellant ablated by the laser,generates plasma between the cathode and anode,inducing the arc.The arc heats and further ionizes the plasma which is ejected under the Lorentz force and aerodynamic force,generating thrust.Since the laser plasma with a certain initial velocity is further accelerated by the Lorentz force and aerodynamic force,it is expected to further improve the propulsion performance.
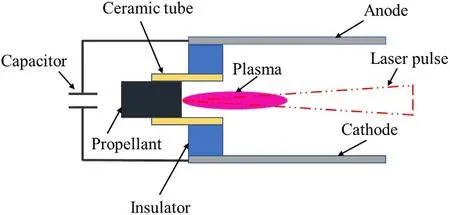
Figure 2.The schematic of LA-PPT.
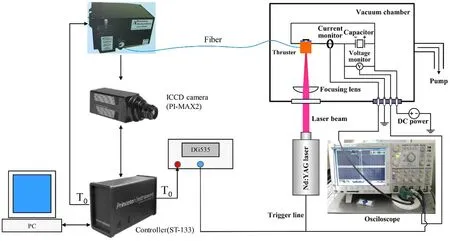
Figure 3.Schematic diagram of the spectral measurement system of the LA-PPT.
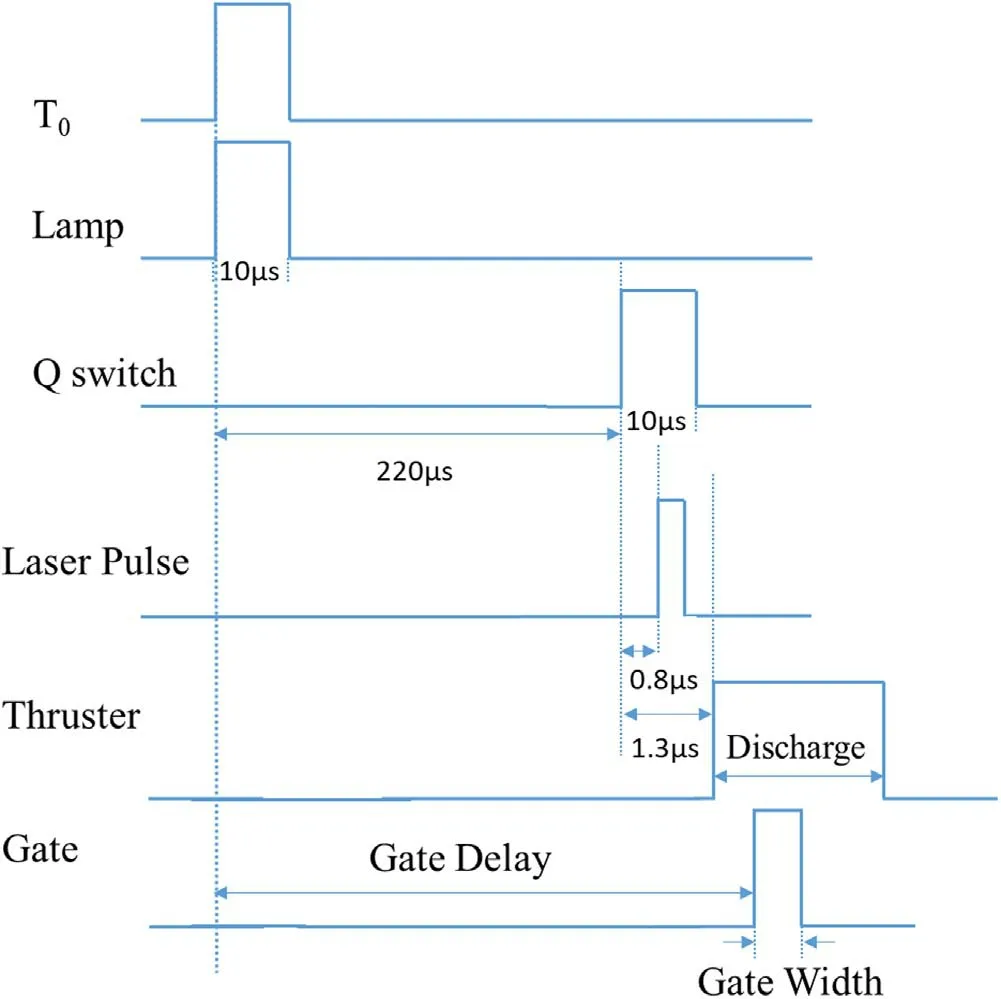
Figure 4.Time sequence of the measurement system.
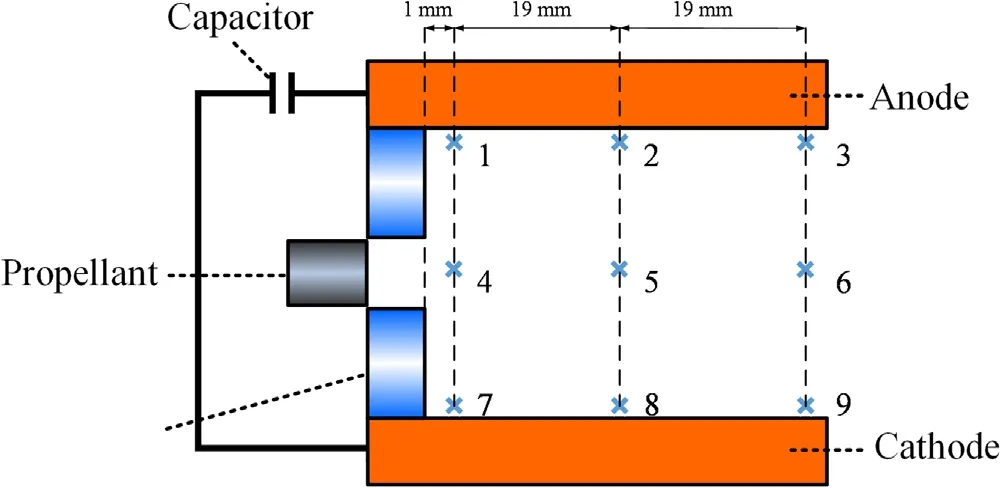
Figure 5.Schematic of the LA-PPT structure and locations of the measurement points.
The propulsion performance parameters of the LA-PPT have already been experimentally investigated,but its plasma parameters have not been studied yet.The study of the plasma parameters can help to optimise the thruster configuration and improve the thruster propulsion performance.For example,obtaining information on the plasma composition can help in selecting the appropriate propellant dopants[7],and the study of the plasma distribution in the discharge channel can guide the optimisation of the thruster electrode configuration[8].Further,the experimental study of the plasma parameters can help validate the accuracy of the numerical simulations and modelling.In our study,we experimentally investigated the LA-PPT by using time and spatial-resolved optical emission spectroscopy(OES)and obtained the plasma properties.
Owing to the similarities between LA-PPT and PPT,we can use the plasma emission spectroscopy diagnostic technique applied to PPT in the experimental investigation of LA-PPT.In 1997,Markusicet alperformed an emission spectroscopy diagnostic technique of XPPT-1,and detected carbon ions,fluorine ions and C2neutral molecules.With the increasing input energy,the thruster will not produce new particles[9].In 2007,Koizumiet alused optical emission spectroscopy to perform plasma diagnosis of an ablative pulsed plasma thruster,and discovered a swan-band spectrum system of C2neutral molecules with wavelengths within 450–550 nm[10].The results showed that ions were present along the entire path between the electrodes,whereas there are neutral molecules only on the propulsion surface.In 2008,Liuet alemployed the Stark broadening effect to measure the electron density between the electrodes of PPT[11].It was found that the electron density in the discharge channel was 2.534×1016cm?3,and the electron temperature between the PPT electrodes plates with discharge energy of 5 J was 18000 K.They also found that as the discharge energy increased,the increase in the electron density in the discharge channel was very small.In 2013,Sch?nherret alinvestigated the evolution of the plasma properties between the electrodes of PPT[12].The distribution of plasma between the electrodes of PPT was uneven and unsymmetric and as time increased,the temperature of the cathode decreased,whereas the temperature on the centre line increased.The electron temperature in the discharge channel was between 1.7 and 3.1 eV.The electron density was approximately 1017cm?3,and was higher near the electrodes.In comparison with the electron temperature distribution,the electron density between the electrodes changed little,which suggests that the plasma diffusion in the cross section was slower than the plasma motion.In 2017,Wuet almeasured the plasma properties between the PPT electrodes using optical emission spectroscopy[13].It was found that the electron temperature and the electron density were approximately 1.5 eV,1.3×1017–1.46×1017cm?3respectively.In 2019,Linget alstudied the effects of asymmetric PPT with different lengths of the anode on the plasma[14].The different anode lengths have little effect on electron temperature which was within 1 eV.The maximum electron density of the symmetric plates(length ratio of the cathode and anode plates was 1:1)and the 15 mm anode(length ratio of the cathode and anode plates was 1:0.75)was approximately 1017–1018cm?3.The maximum electron density with the anode length of less than 10 mm reached 1021cm?3.The optimal anode plate length was then speculated to be between 5 and 10 mm.In 2020,Zhouet alinvestigated the PPT by using optical emission spectroscopy[15].Their results showed that as the plasma moved downstream,the intensities of the C II,C III,C IV,and F II spectral lines decreased,whereas the intensities of the C I and F I spectral lines increased,which indicates the occurrence of ion recombination in the PPT discharge channel.Near the propellant surface,ions of various valences were generated simultaneously,and as the plasma moved downstream,the density of high-valent ions decreased,whereas the density of low-valent ions increased.The electron temperature at the centre of the discharge path was approximately 10000 K,and the electron density was approximately 1017cm?3.The highest electron temperature that appeared in the first half-cycle of discharge was 13750 K,and the maximum electron density that appeared in the second half-cycle of discharge was 2.3×1017cm?3.In 2020,Zhanget alproposed a diagnostic method to measure the velocity of electrons in the plasma plume through the injection of neutral gas[16].By using optical emission spectroscopy,the emission signal of the tracer gas(argon)was used to identify the plasma diffusion process.The electron velocity could be estimated by the ionisation of the argon gas,and it was found that the electron discharge velocity exceeded 200 km s?1.The spectral data were also used to identify the electronic deceleration in the plasma plume.
In summary,the diagnostic technology of optical emission spectroscopy can obtain plasma parameters such as the plasma composition in the PPT discharge channel,electron temperature,and electron density.In addition,the working mode of the PPT is a pulsed mode(in the order of microseconds),which means that the plasma parameters in the discharge channel change drastically both in time and space.Owing to the similarities in the working modes of LA-PPT and PPT,it can be speculated that the plasma parameters in the LA-PPT discharge channel also change significantly in time and space.Therefore,to fully understand the evolution process of the plasma parameters in the discharge channel in both time and space,we performed an experimental study of the LA-PPT discharge channel by using time and spatialresolved optical emission spectroscopy.This work fills in the gap in the study of plasma parameters in LA-PPT.The identification of the plasma composition in LA-PPT discharge channel gives the final form of ablated and ionized PVC as the preferred propellant in LA-PPT.It is significant for improving propellant and establishing propellant ionization model in discharge channel.The electron density distribution in discharge channel helps to optimize and improve the electrode configuration of LA-PPT.The measurement results of electron temperature and electron density help to verify the numerical simulation of LA-PPT.
2.Experiment
The experimental setup is shown in figure 3.In the experiment,the laser beam was generated by a Nd:YAG laser(Nimma-900,Beijing Leibao Optoelectronics Technology Co.,Ltd.,China).The laser wavelength was 1064 nm,and the pulse width(full width at half maximum,FWHM)was approximately 8 ns.The laser was focused through a focusing lens(focal length of 400 mm)and radiated to the working medium of the LA-PPT.The LA-PPT and the focusing lens were installed in a vacuum chamber.An Acton SP2300i grating spectrometer from Princeton Instruments(PI)was used in the experiment,and an intensified charge-coupled device(ICCD)camera(PI-MAX2)was used to record the spectrometer signal.The spectrometer was equipped with three gratings with grain densities of 1200 g mm?1,1200 g mm?1,and 600 g mm?1.The corresponding blaze wavelengths of the three gratings were 500 nm,300 nm,and 500 nm,respectively.In this experiment,only the grating with grain density of 1200 g mm?1and blaze wavelength of 500 nm was used.
The software WinSpec/32 equipped with the PI grating spectrometer was used to collect the spectrum.An optical fibre and its collimating optical element were used to transmit the optical signals emitted by the LA-PPT discharge channel in the vacuum chamber to the spectrometer outside.In order to output the laser stably and measure the spectrum normally,a reliable time sequence must be given to the spectrum measurement system.The spectrometer(Acton SP2300i)has a precise ICCD timing controller(ST-133)which gives the T0trigger signal through the spectrometer control software(WinSpec v2.6).The internal trigger mode is set in the spectrometer control software for the spectrum measurement system.The trigger cycle is 1 Hz,which means a trigger signal T0will be generated in one second,as shown in figure 4.
After being triggered by T0signal,the digital delay pulse generator(DG535,Stanford Research Systems,USA),as shown in figure 4,outputs two signals,lamp and Q swich.In order to ensure the optical pumping time to achieve reliable laser output for Nd:YAG laser(Nimma-900),the delay time of the lamp trigger signal relative to the trigger signal of Q swich is set to 220 μs.Both the duration of lamp and Q swich trigger signals are set to 10 μs.The T0signal triggers the laser rather than the discharge capacitor of LA-PPT in the experiment.The output time of laser pulse has a 0.8 μs delay relative to the Q swich trigger signal.Meanwhile,we found that the main discharge time of LA-PPT has a 1.3 μs delay relative to the Q swich trigger signal in the experiment.Since the spectrometer works in the Gate mode,we can adjust the opening time of the shutter by setting the ‘Gate Delay’ relative to T0and adjust the exposure time of the ICCD by setting the ‘Gate Width’.In order to make the 0 point of spectral measurement and the 0 point of discharge current coincide,according to the main discharge situation of LA-PPT in each experiment,we adjust the delay time of the shutter[17].
In the LA-PPT,four capacitors(1.5 μF per capacitor)are connected in parallel to form a 6 μF electric source.The maximum voltage of each capacitance is 4000 V.The corresponding discharge energy can range from 0 to 48 J depending on the selected voltage.The initial discharge voltage is 3000 V,that is,the discharge energy is 27 J.The length of the electrode plate is 40 mm and the spacing between electrode plates is 30 mm.The propellant used in LA-PPT is polyvinyl chloride(PVC).In the LA-PPT discharge channel,9 measurements points were selected for the spectral measurement,as shown in figure 5.In the vacuum chamber,two vertically arranged electric displacement platforms were used to control the positions of the measurement points.During the test,the fiber did not immerse in the plasma.As shown in figure 6,the fiber is on the side of the thruster discharge channel.Meanwhile,in order to prevent plasma from polluting the collimating lens of fiber,quartz glass(transmittable wavelength range 300–700 nm)for protection is installed in front of the collimating lens.A current monitor(Model 5046,Pearson Electronic Inc.,USA)was used to measure the discharge current.The vacuum chamber pressure was maintained below 5×10?3Pa throughout the experiment.
3.Results and discussions
3.1.Discharge current and timings for spectral measurements
Figure 7 shows the discharge current of the LA-PPT and the selected timings for the spectral measurements acquired during the discharge.The 0 point of the time axis was the main discharge trigger time point,and the initial discharge voltage of the LA-PPT was 3000 V(27 J).It was found during the experiment that the spectral intensity became relatively weak after 13 μs of discharge;therefore,only the first three half-cycles of the discharge were measured.The spectral measurement timings were selected to be between 0.7 μs and 12.7 μs,with the time interval for each measurement as 1 μs.As can be seen from the figure,the peak discharge current was 11.6 kA,and the total discharge time was 20.5 μs.Because the discharge of the LA-PPT is a transient process,the magnitude of the current between the electrodes varied with time.
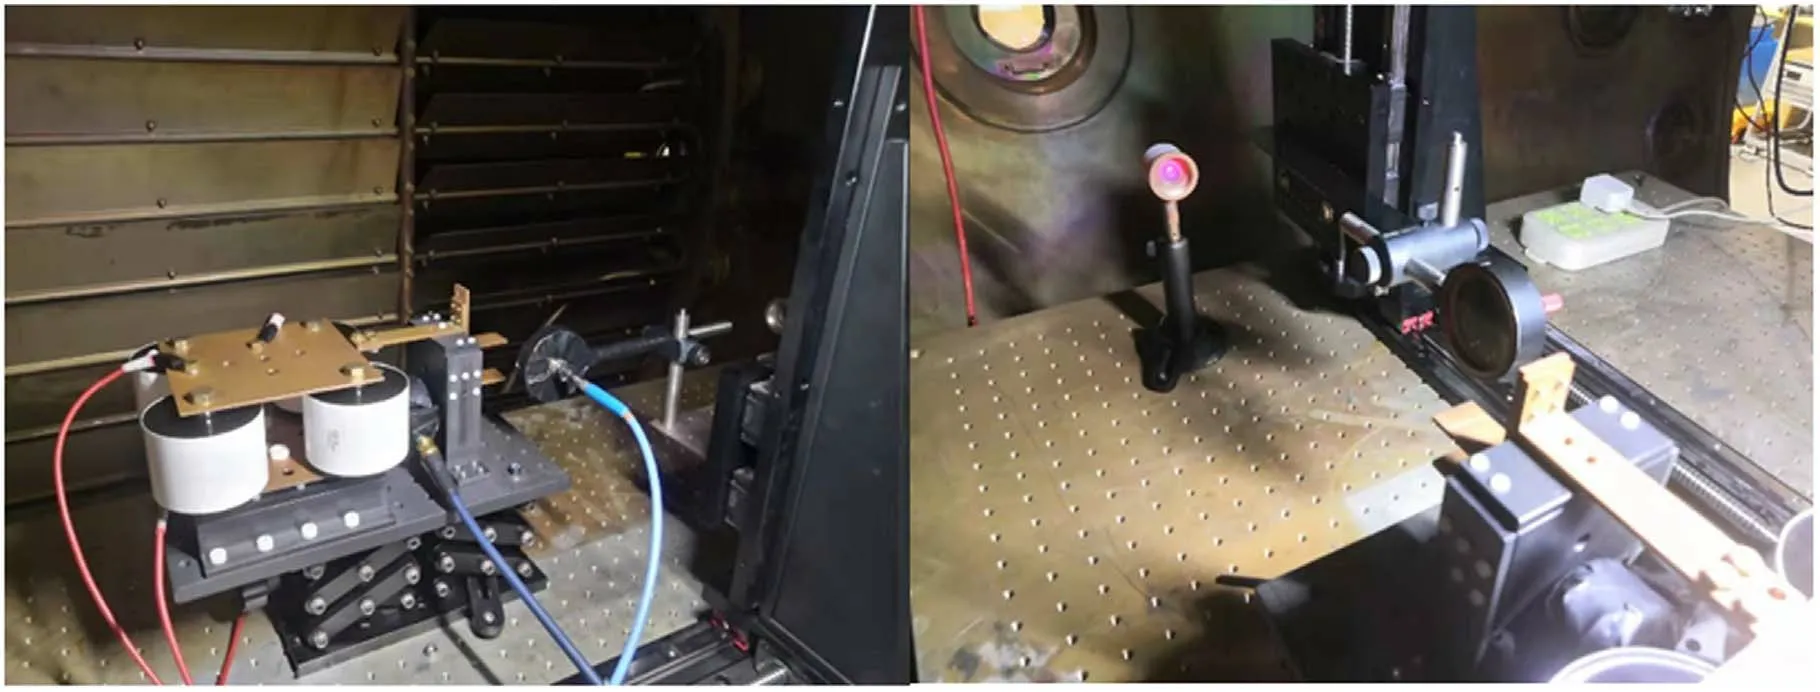
Figure 6.Experimental setup.
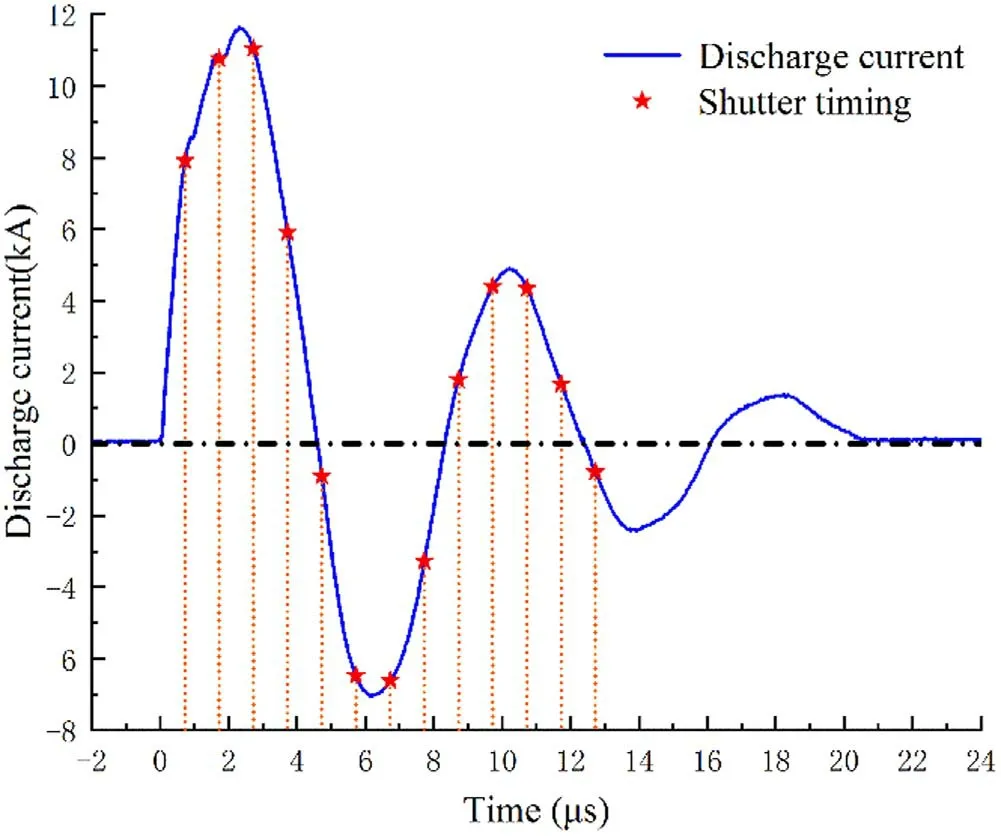
Figure 7.Discharge current of LA-PPT and timings for spectral measurement.
3.2.Plasma composition
The collected wavelength range of the spectrum in the experiment was 370–660 nm.At each measurement point,the emission spectra were collected for the discharge time ranging between 0.7 and 12.7 μs(mainly the first three half-cycles of discharge).The time interval for each acquisition was 1 μs.As shown in figures 8–10,for each measurement point,the spectra collected at different times were stacked to show all the plasma components during the first three half-cycles of the discharge at the nine different positions in the discharge channel.In the experiment,the propellant of the LA-PPT was polyvinyl chloride(PVC).The chemical formula is(C2H3Cl)n,with the main elements being C,H,and Cl.The atomic spectral lines in the experiment were identified according to the spectral database of the National Institute of Standards and Technology(NIST).The molecular systems were identified by referring to[18].
Figures 8(a)–(c)show the emission spectra at the measurement points 1,2,and 3 near the anode plate in the LAPPT discharge channel,respectively.The measurement points 1,2,and 3 were close to the anode plate and were located upstream,midstream,and downstream of the discharge channel,respectively.The plasma composition mainly included particles such as C I,C II,C III,C IV,Cl I,and Cl II,Hα,Hβ,Hδatoms,and a small amount of CH,C3,C2,and H2groups.From upstream to downstream,the main plasma composition near the anode plate showed little change,which suggests that the discharge phenomenon on the anode side of the thruster discharge channel was relatively stable.However,the intensity of the spectrum at different positions showed relatively large variations.At the upstream measurement point 1,the intensity of the Cl II spectral line was relatively high,followed by that of the C IV and Hε spectra lines in the ultraviolet band.At the midstream measurement point 2 and downstream measurement point 3,the C IV and Hε spectral lines in the ultraviolet band showed the highest intensity.Because the spectral line intensity is a function of the concentration,under local thermal equilibrium(LTE),the atomic concentration has a linear relationship with the spectral line intensity.In our experiment,the intensity of the emission spectra gradually increased from upstream to downstream,indicating a gradual increase in the plasma density.In addition,the maximum spectral line intensity along the discharge channel was observed at the downstream measurement point 3,which suggests that the plasma density was the highest downstream near the anode side.In addition,the Cu II spectral line was also observed at the downstream measurement point 3,which originated from the copper ions sputtered by the plasma downstream of the anode and colliding with the anode plate.The appearance of copper ions further indicates that a strong discharge phenomenon occurred downstream of the anode,which subsequently generated plasma of high density.
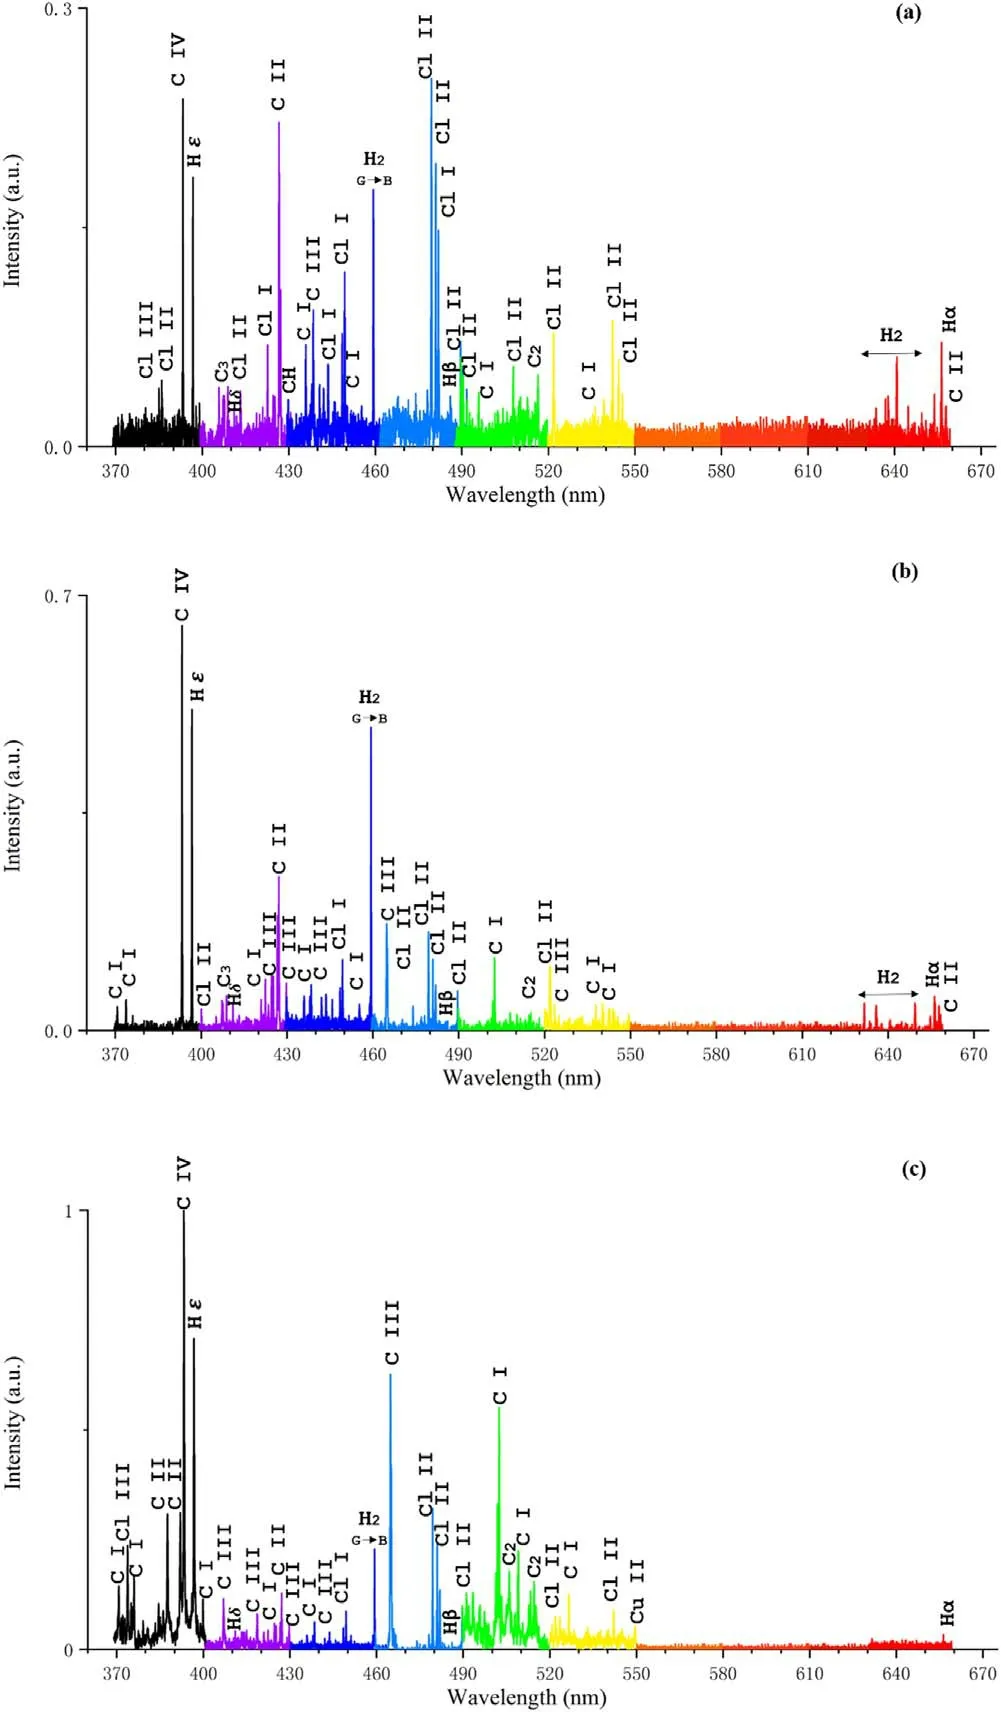
Figure 8.Emission spectra at positions(a)1,(b)2,and(c)3 near the anode plate.
Similar to the studies on the emission spectra of PPT[10,12],the swan system spectral band of the C2neutral molecules,ranging from 512.9 to 516.5 nm,was identified in this study.The difference is that in the previous PPT discharge channel,the C II spectral line(426.726 nm)showed the highest intensity,whereas in our study,the C IV spectral line(393.428 nm)within the ultraviolet band showed the highest intensity.The reason behind this difference is that a part of the energy in the PPT discharge channel was needed to ablate the propellant surface for plasma generation,whereas in the LA-PPT,the plasma generated by the laser was already in the plasma state when entering the discharge channel.Therefore,all energy within the discharge channel could be used to ionise the plasma,causing extensive ionisation of the laser plasma.As a result,the C atoms lost more electrons,thus driving the C ions to a higher valence state.
Figures 9(a)–(c)show the emission spectra of the measurement points 4,5,and 6,respectively,at the centre of the LA-PPT discharge channel.The measurement points 4,5,and 6 were located upstream,midstream,and downstream of the centre of the discharge channel,respectively.The main plasma composition was similar to that near the anode plate,whereas fewer spectral lines were observed within the band of 400–430 nm.From upstream to downstream,the main plasma composition at the centre of the discharge channel showed little change,which indicates that the discharge phenomenon at the centre of the thruster discharge channel was relatively stable.A change was mainly observed in the spectral line intensity.The intensities of the spectral lines upstream and midstream of the centre of the discharge channel were relatively high,whereas the intensity of the downstream spectral line was lower.This suggests that the plasma density was higher upstream and midstream of the centre of the discharge channel,and lower downstream.In addition,the C IV spectral line(393.428 nm)had the highest intensity upstream and midstream,whereas at the downstream measurement point 6,the spectral line corresponding to the H2neutral molecule showed the highest intensity.This indicates that as the plasma moved from upstream to downstream,the H atoms were reneutralised into H2neutral molecules,and became neutral at the thruster outlet.Compared with the plasma density downstream of the anode plate,the plasma density at the centre of the discharge channel was lower and asymmetric.
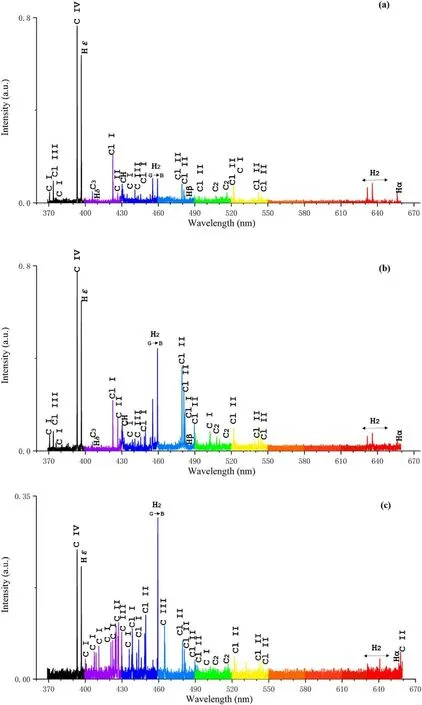
Figure 9.Emission spectra at positions(a)4,(b)5,and(c)6 at the centre of the discharge channel.
Figures 10(a)–(c)show the emission spectra of the measurement points 7,8,and 9 near the cathode plate in the LA-PPT discharge channel,respectively.The measurement points 7,8,and 9 were located close to the cathode plate and at the upstream,midstream,and downstream of the discharge channel,respectively.The main plasma composition was similar to that near the anode plate and at the centre of the discharge channel.From upstream to downstream,the main plasma composition near the cathode plate showed little change,which suggests that the discharge phenomenon in the entire thruster discharge channel was relatively stable.The variation pattern of the spectral intensity near the cathode plate was similar to that at the centre of the discharge channel.The spectral line intensity upstream and midstream of the discharge channel near the cathode plate was relatively high,whereas that downstream was lower.This indicates that the plasma density was higher upstream and midstream of the discharge channel near the cathode plate,and lower downstream.The C IV spectral line showed the highest intensity(393.428 nm)upstream and midstream,whereas at the downstream measurement point 9,the spectral line corresponding to the H2neutral molecule had the highest intensity.This suggests that as the plasma moved from upstream to downstream,the H atoms turned into H2neutral molecules,and became neutral at the thruster outlet.Similar to the plasma density downstream of the centre of the discharge channel,the plasma density near the cathode plate was lower.The plasma density over the entire discharge channel was uneven and asymmetric.This also indicates that the LA-PPT discharge channel needs to be optimised to eliminate the inhomogeneity and asymmetry of the plasma density.
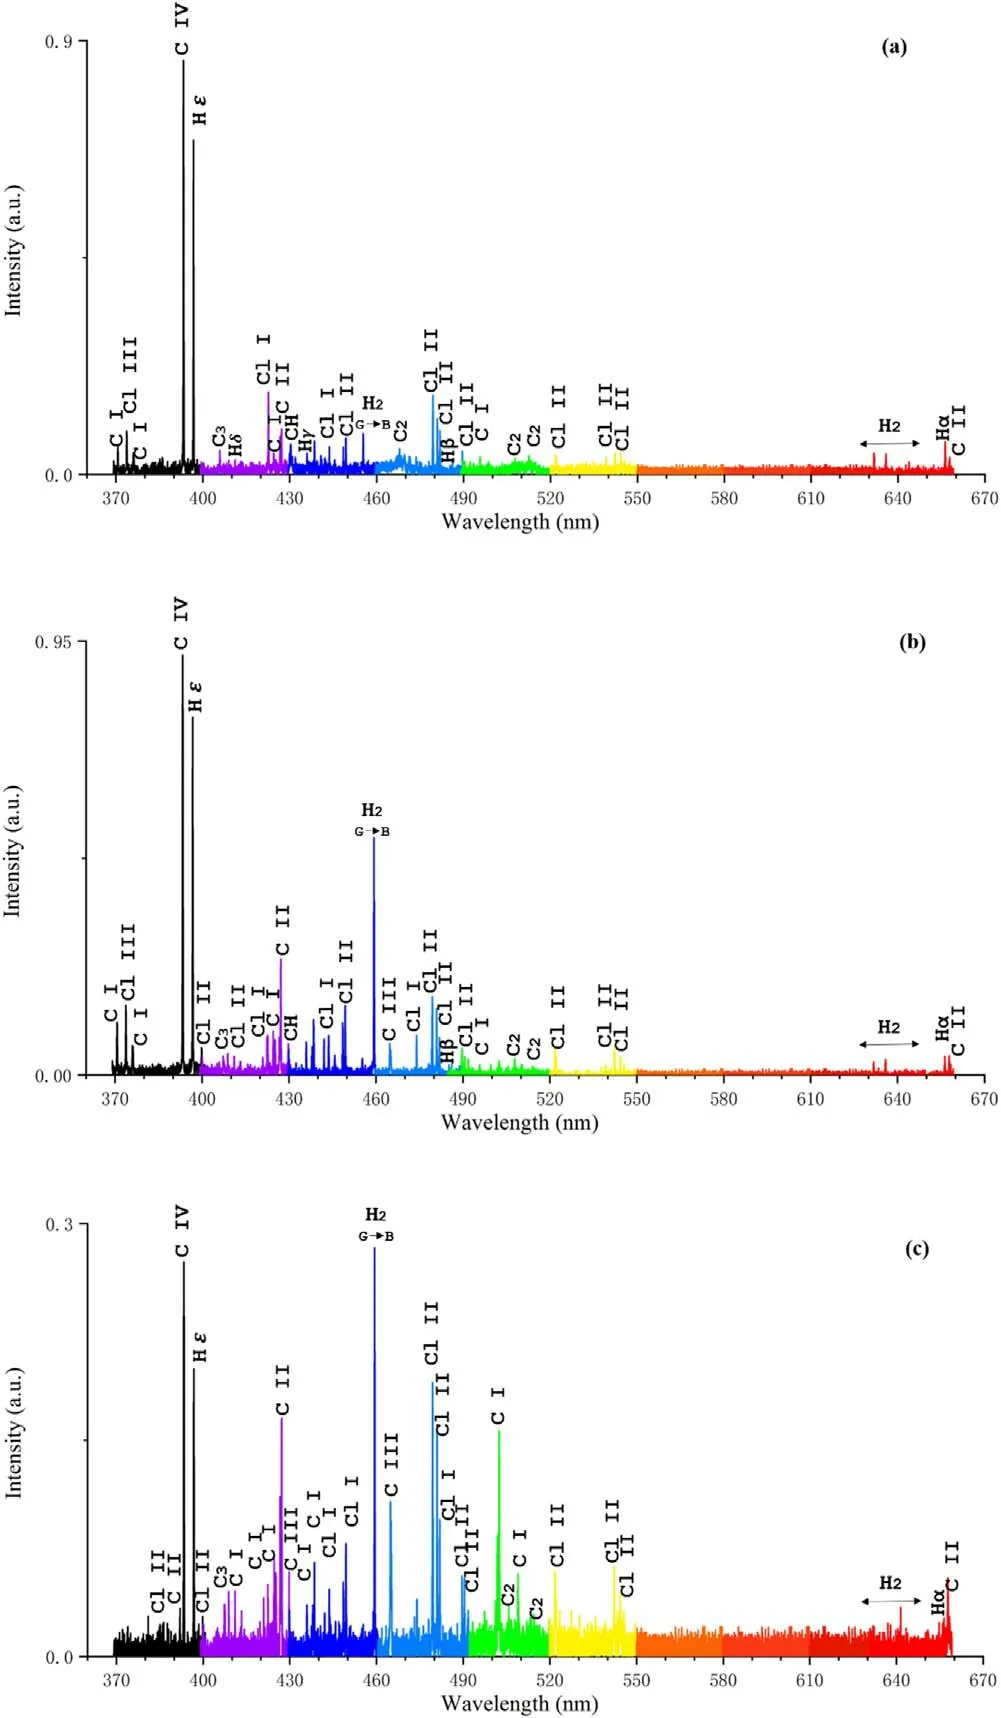
Figure 10.Emission spectra at positions(a)7,(b)8,and(c)9 near the cathode plate.
3.3.Electron temperature and electron density
The electron temperature was calculated under the assumption of LTE.The associated calculation theory has already been introduced in detail in[19].Here we report the variation in electron temperature for the first three discharge cycles for the nine measurement points in the discharge channel.Figures 11–13 show the changes in the electron temperature at different positions near the anode plate,at the centre of the discharge channel,and near the cathode plate,respectively.
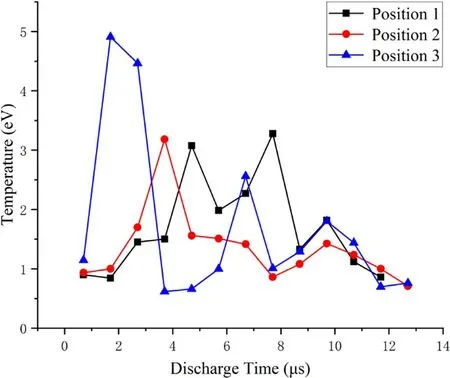
Figure 11.Changes in electron temperature at different positions near the anode plate.
Figure 11 shows the changes in the electron temperature at the upstream measurement point 1,midstream measurement point 2,and downstream measurement point 3 near the anode plate.The changes in the electron temperature at the measurement points 1 and 2 ranged within 0.8–3.3 eV.The electron temperature at the measurement point 3 changed more significantly,between 0.6 and 4.9 eV.This large change in the electron temperature further indicates stronger discharge phenomenon downstream of the discharge channel near the anode plate,which led to relatively large energy exchange.In addition,it can be seen by comparing with figures 12 and 13 that the highest electron temperature in the discharge channel of 4.9 eV was observed at the measurement point 3.Between 0 and 9 μs,the electron temperature at points 1 and 3 fluctuated,whereas that at point 2 increased first and then decreased.After 9 μs,the electron temperature at all three points tended to stabilise.Considering the changes in the discharge current in figure 7,it can be seen that in the first two half-cycles of the discharge,the discharge phenomenon was significant and energy exchange occurred frequently,which led to fluctuations in the electron temperature.In the third half-cycle of the discharge,the discharge phenomenon weakened along with the energy transfer;thus,the electron temperature tended to stabilise at each point.
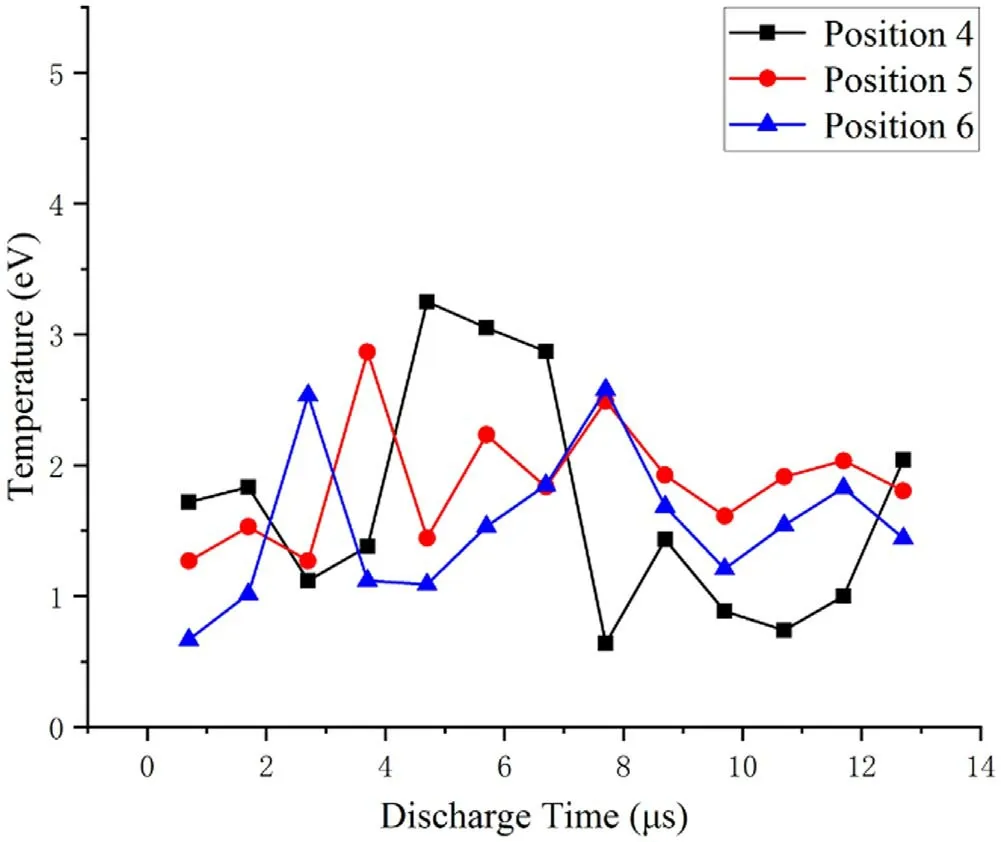
Figure 12.Changes in electron temperature at different positions at the centre of the discharge channel.
In addition,previous studies on the emission spectra of PPT[6,20]have shown that the electron temperature upstream near the propellant surface was higher.However,in the LA-PPT discharge channel,the electron temperature was higher downstream farther from the propellant surface.This was due to the different ignition methods of the PPT and LAPPT.The LA-PPT discharge is induced by the laser ablated plasma of the expanding cathode and anode plates,and the initial discharge occurs almost simultaneously in the entire discharge channel.Therefore,during the LA-PPT discharge process,the electron temperature will not be higher closer to the propellant,unlike in the case of PPT.
Figure 12 shows the changes in the electron temperature at the upstream measurement point 4,midstream measurement point 5,and downstream measurement point 6 along the centre of the discharge channel.The changes in the electron temperature at the measurement points 4,5,and 6 were within 0.6–3.2 eV.The change in electron temperature at the measurement point 4 was relatively large,indicating a comparatively more significant discharge phenomenon upstream of the centre of the discharge channel.Between 0 and 9 μs,the electron temperature fluctuated at points 4,5,and 6.After 9 μs,the electron temperature at points 4,5,and 6 tended to balance.As in the case near the anode plate,within the first two half-cycles of discharge,the discharge phenomenon became more significant and energy exchange occurred more frequently.In the third half-cycle of discharge,the discharge phenomenon weakened.By further combining these results with those depicted in figure 11,we found that near the anode plate and at the centre of the discharge channel,the peak electron temperature occurred earlier with increasing distance from the propellant surface.This further confirms that in LAPPT,the initial discharge occurred almost simultaneously across the entire discharge channel,and the entire discharge channel was filled with plasma in the initial discharge state.
Figure 13 shows the changes in electron temperature at the upstream measurement point 7,midstream measurement point 8,and downstream measurement point 9 near the cathode plate.The changes in the electron temperature at the measurement points 7,8,and 9 were within 0.6–3.6 eV.The change in the electron temperature at measurement point 9 was relatively strong,which indicates stronger discharge downstream of the discharge channel near the cathode plate.Between 0 and 9 μs,the electron temperature at points 7 and 9 fluctuated,whereas that at point 8 increased first and then decreased.After 9 μs,the electron temperature at points 7,8,and 9 tended to stabilise and increase gradually.This indicates that in the entire discharge channel,the discharge phenomena were more significant in the first two half-cycles of discharge,and the energy exchange occurred more frequently,whereas in the third half-cycle,the discharge near the cathode plate increased gradually.
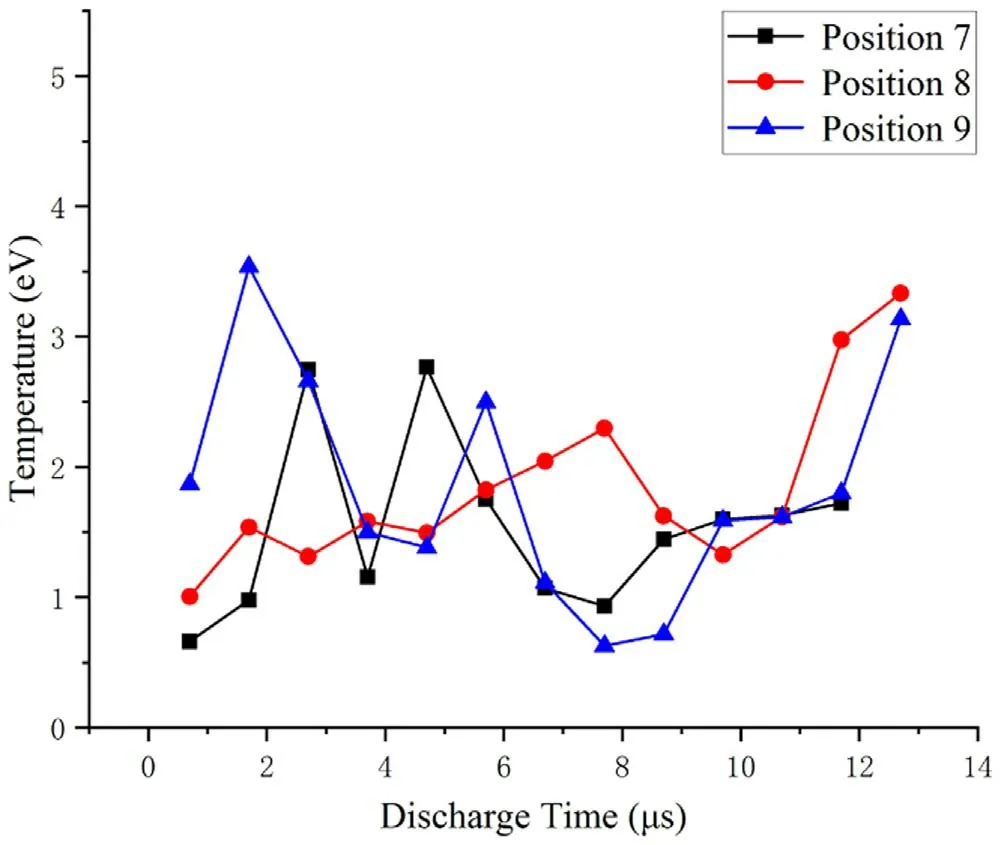
Figure 13.Changes in electron temperature at different positions near the cathode plate.
The electron density was calculated using the Stark broadening effect of the spectral line.In this study,we employed the Stark broadening of the Cl II(497.4 nm)spectral line to calculate the electron density.The relevant calculation theory of Stark broadening has already been introduced in detail in previous studies[11,14,21].For neutral atoms and primary ionised ions,the formula to calculate the electron density using the Stark broadening effect is as follows:
whereωeis the electron collision coefficient,αeis the ion broadening parameter,Teis the electron temperature,neis theelectron density,and DλStarkis the Stark broadening of the spectrum.The electron collision coefficient and ion broadening parameter can be referred from Table 4.5 in the paper by Griem[22].Figures 14–16 show the changes in the electron density at different positions near the anode plate,at the centre of the discharge channel,and near the cathode plate,respectively.
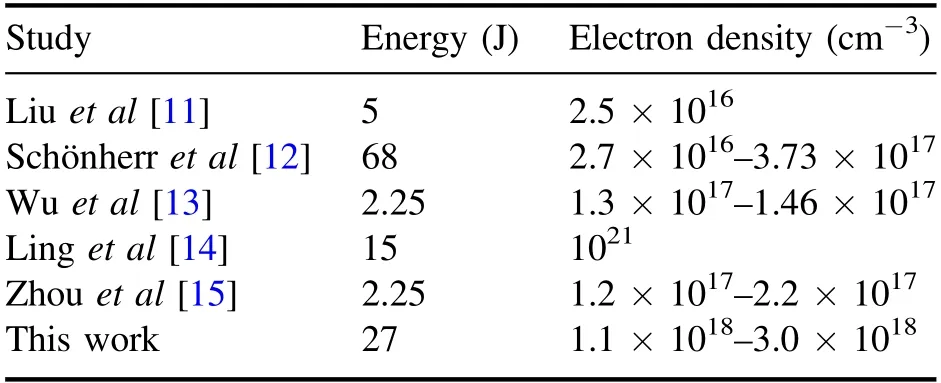
Table 1.Comparison of electron densities.
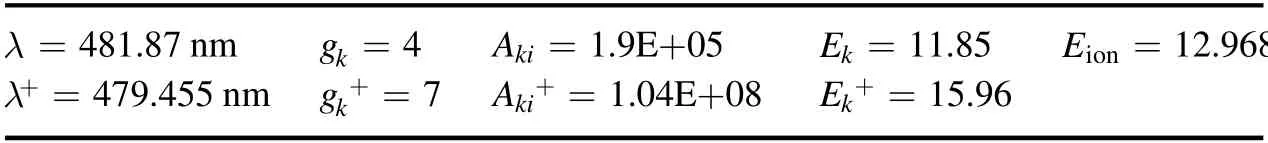
Table 2.Parameters of chlorine ion and chlorine atom.
Figure 14 shows the changes in the electron density at the upstream measurement point 1,midstream measurement point 2,and downstream measurement point 3.The changes in the electron density at the measurement points 1,2,and 3 ranged between 1.2×10¹⁸and 3.0×1018cm?3.At measurement point 2,the electron density near the anode plate showed little change with time,except that a peak of the electron density appeared at 10.7 μs.It is worth noting that this time point corresponded with the occurrence of the maximum current value in the third half-cycle of discharge.After 6 μs of discharge time,the electron density at measurement point 1 was relatively large.

Figure 14.Changes in electron density at different positions near the anode plate.
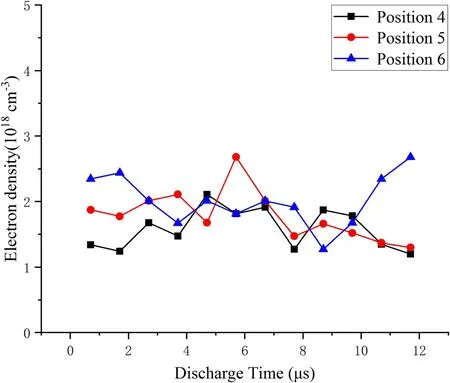
Figure 15.Changes in electron density at different positions at the centre of the discharge channel.
Figure 15 shows the changes in the electron density at the upstream measurement point 4,midstream measurement point 5,and downstream measurement point 6 at the centre of the discharge channel.The changes in electron density at the measurement points 4,5,and 6 ranged within 1.2×10¹⁸–2.68×1018cm?3.The electron density at the measurement points 4 and 5 first increased and then decreased,whereas the reverse trend was observed at measurement point 6.After 9 μs of discharge time,the electron density at measurement point 6 increased gradually,indicating a relatively high electron density at the outlet of the discharge channel.This is different from the results reported in a previous study on the PPT[12].In the PPT discharge channel,the electron density increased closer to the thruster surface.At measurement point 5,the electron density peaked at 5.7 μs,which corresponded to the occurrence of the maximum current value in the second half-cycle of discharge.
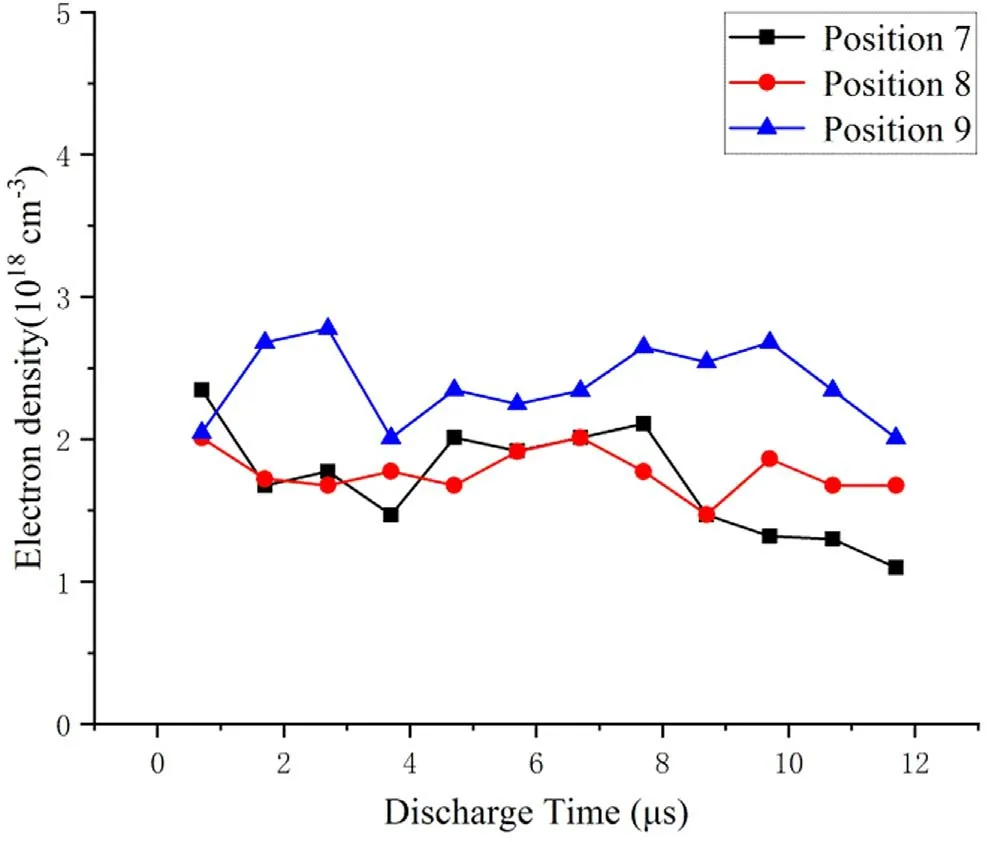
Figure 16.Changes in electron density at different positions near the cathode plate.
Figure 16 shows the changes in electron density at the upstream measurement point 7,midstream measurement point 8,and downstream measurement point 9 near the cathode plate.The changes in electron density at the measurement points 7,8,and 9 ranged within 1.1×10¹⁸–2.8×1018cm?3.The electron density at measurement point 7 decreased first,then increased,and then decreased again,whereas that at measurement point 8 remained almost constant.At measurement point 9,the electron density increased first and then decreased,and tended to balance after 4 μs.At measurement point 9,the electron density peaked at 2.7 μs,which corresponded to the occurrence of the maximum current value in the first half-cycle of discharge.
Within the discharge cycle,the electron density downstream of the discharge channel near the cathode plate was higher than that upstream and midstream,which indicates a higher electron density at the discharge channel outlet.This was consistent with the observation at the centre of the discharge channel.
By combining the results shown in figures 14–16,the electron density at the LA-PPT discharge channel outlet wasfound to be relatively high.This shows that the plasma parameters of the discharge channel were relatively strongly influenced by the change in the ignition method from spark plug to laser,and the plasma distribution of the discharge channel was changed.The higher electron density at the outlet indicates a higher plasma flow,which increases the specific impulse of the thruster.At different moments,all measurement points that were near the measurement point 9 downstream of the discharge channel near the cathode plate often had the maximum electron density,that is,the electron density near the outlet and near the cathode plate was larger,which indicates that the electron density distribution in the LA-PPT discharge channel was not uniform.Similar to the conventional PPT,the discharge from the LA-PPT appeared to be asymmetric.In addition,a correspondence between the peak electron density and peak current was found near the anode plate,at the centre of the discharge channel,and near the cathode plate.This is because an increase in the electron densitynewill increase the plasma conductivityσ.The conductivity can be expressed as

wheremeis the electron mass,veis the electron collision frequency,andeis the basic charge.The discharge current increases with increase in the plasma conductivity,resulting in a peak current.
The measured electron density results were compared with those reported in previous studies,as shown in table 1.
Table 1 shows that the electron density in the LA-PPT was higher than that in the conventional PPT.In[11–15],the results in[11,12,15]refer to the conventional PPT.The results in[13]refer to the double discharge pulsed plasma thruster.The results in[14]refer to PPT with asymmetric electrodes.The results in[11–15]all come from using the OES method.In[14],as asymmetry is introduced in the electrode configuration of PPT,the electrode configuration can enhance the current density of the arc on the propellant surface,so as to enhance the ablation and ionization rate of the PPT,and then improve the electron density.
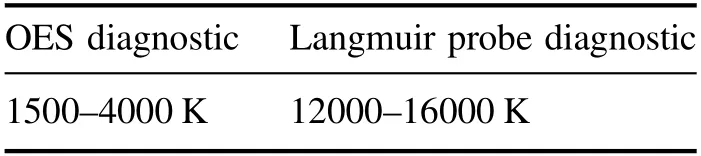
Table 3.The electron temperature of arcjet.
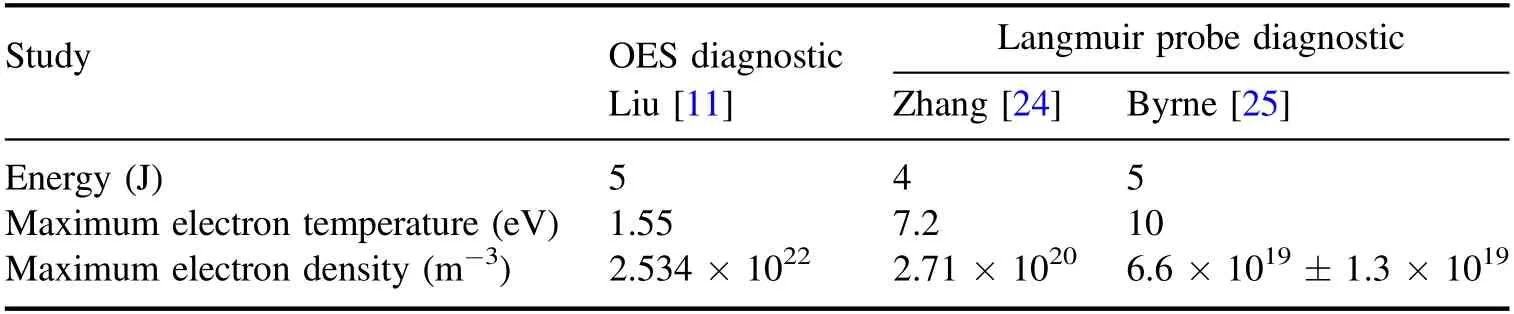
Table 4.The plasma diagnostic results of PPT.
This suggests that the combined effect of laser and electromagnetic acceleration had a better ionisation effect on the propellant,demonstrating the superiority of the LA-PPT,which used laser instead of spark plug for ignition.However,the electron density in the LA-PPT was lower than that in the PPT with asymmetric electrodes.This was because the electron density distribution in the LA-PPT discharge channel was not uniform,and asymmetric discharge was present.Therefore,the LA-PPT electrodes should be optimised to obtain higher electron density in the discharge channel and higher specific impulse.
The electron temperature and electron density results derived from the optical method are seemed very different with the results from the Langmuir probe for the PPT.The accuracy of the immersed optical emission spectroscopy method has been discussed.
The degree of freedom associated with the emission of plasma linear spectrum is the electronic excitation in heavy particles.Therefore,the temperature measured by spectral line intensity method is the electron excitation temperature in heavy particles,not the temperature of free electrons.In thermodynamic equilibrium and local thermodynamic equilibrium states,the electron excitation temperature in heavy particles is equal to free electron temperature.But under the condition of thermodynamic nonequilibrium,they are not equal.
Under the model of local thermodynamic equilibrium,combined with Saha equation and Boltzmann distribution law,only the contribution of atomic ionization to electrons in plasma is considered.The electron density can be determined by using an atomic spectral line and an ion spectral line according to the following formula(3):
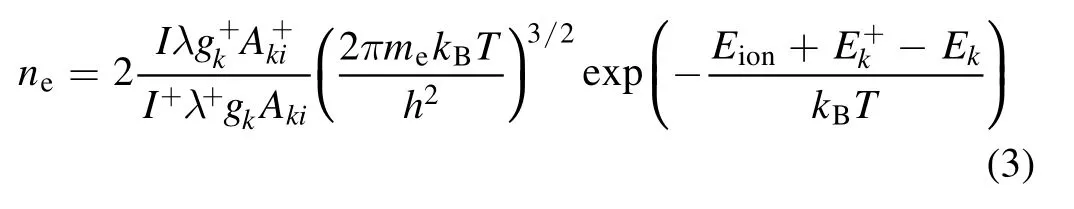
Iis the spectral line intensity,neis the electron density,gkis the degeneracy of the upper level,Akiis the transition probability,merepresents electronic quality,kBis the Boltzmann constant,Tis the electron excitation temperature,his the Planck constant,Eionis the ionization energy of chlorine atom,Ekis the high energy state excitation energy.The symbol with superscript+indicates the data corresponding to monovalent chloride ion(Cl II 479.455 nm).The symbol without superscript indicates the data corresponding to chloride atom(Cl I 481.87 nm).Parameters of chlorine ion and chlorine atom are given in table 2.
The calculated electron density of the plasma ranges from 1016to 1022cm?3.The electron density measured by Stark broadening method is 1018cm?3.The results of the two methods are quite different.It shows that the plasma in the discharge channel of LA-PPT is in a non-equilibrium state and not in the local thermodynamic hypothesis.Therefore,in LA-PPT,the temperature measured by spectral line intensity method is the excitation temperature of electrons in heavy particles,not the temperature of free electrons.
Since there is no Langmuir probe diagnostic for LA-PPT.To compare OES method with Langmuir probe method,we analyze the plasma diagnostic of PPT and arcjet using OES and Langmuir probe methods.Zhaoet al[23]used both OES method and Langmuir probe method to diagnose the plume of arcjet.The excitation temperature measured by OES method is 1500–4000 K,while the electron temperature measured by Langmuir probe method is 12000–16000 K,as shown in the table 3.It proves that what is measured by the OES method is not the electron temperature,but the electron excitation temperature in the heavy particles.
As shown in the table 4,the plasma diagnostic results of PPT using OES method and Langmuir probe method are given.OES method mainly measures the excitation temperature of electrons in heavy particles,not the free electron temperature.Therefore,compared with Langmuir probe method,the electron temperature obtained by OES method is lower,i.e.,the plasma in PPT is not in the local thermodynamic equilibrium.Also the electron density obtained by spectral method is higher than that by probe method.This is because the measurement theories of the two methods are different.In OES diagnostic,the Stark broadening of neutral atoms and primary ionized ions are mainly caused by electrons colliding with radiation particles.The effective electron collision is the electron in the Debye sphere space(radiusr=LD,LDis Debye radius.)with the radiation particle as the center.The electron density should be the electron density in the heavy particles.The Langmuir probe method is based on the sheath theory to collect plasma.The electron density should be the free electron density.
In conclusion,the OES method is to measure the electron excitation temperature and electron density in heavy particles.But the Langmuir probe method is to measure the temperature and density of free electrons.Therefore,the results of the two methods are different in the plasma diagnostic of PPT.
4.Conclusions
In this work,the LA-PPT was researched using time and spatial-resolved optical emission spectroscopy to investigate the changes in plasma characteristics in the thruster discharge channel.The main conclusions are as follows:
(1)When PVC was used as the working medium of the LA-PPT,the main plasma components in the discharge channel included Hα,Hβ,Hγ,Hε atoms,particles such as C I,C II,C III,C IV,Cl I,and Cl II,and a small amount of CH,C3,C2,and H2neutral molecular groups.
(2)The electron temperature of the discharge channel ranged between 0.6 and 4.9 eV,and the electron density was within(1.1–3.0)×1018cm?3.The change in the ignition mode showed a clear effect on the plasma distribution in the thruster discharge channel,which led to higher electron temperature and electron density at the thruster outlet.The higher electron density at the outlet enhanced the specific impulse of the thruster.All measurement results of the spectral intensity,electron temperature,and electron density showed that asymmetric discharge occurred in the LA-PPT.
(3)Compared with the conventional PPT,the change in ignition mode improved the thruster electron density.However,the electron density in the LA-PPT was lower than that in the PPT with asymmetric electrodes.In addition,asymmetric discharge occurred in the LAPPT.Therefore,the LA-PPT with asymmetric electrodes is expected to achieve larger electron density and thus higher specific impulse.
(4)Compared with the Langmuir probe method,the OES method is used to measure the electron excitation temperature and electron density in heavy particles.But the Langmuir probe method is used to measure the temperature and density of free electrons.Therefore,the results of the two methods are different.
Acknowledgments
This research was supported by National Natural Science Foundation of China(No.11772354).
猜你喜歡
環(huán)球時(shí)報(bào)(2022-08-02)2022-08-02 22:41:57
Chinese Physics B(2022年3期)2022-03-12 07:44:22
知音海外版(下半月)(2021年1期)2021-03-25 10:51:49
Plasma Science and Technology(2021年2期)2021-02-27 09:16:58
作文大王·低年級(jí)(2020年12期)2020-12-31 07:28:22
七彩語(yǔ)文·寫字與書(shū)法(2020年11期)2020-12-31 00:00:00
Plasma Science and Technology(2020年9期)2020-09-14 01:13:20
當(dāng)代人(2020年4期)2020-05-08 08:18:04
中華詩(shī)詞(2019年9期)2019-05-21 03:05:18
美與時(shí)代·城市版(2016年9期)2016-05-14 08:05:32
 Plasma Science and Technology2022年7期
- Plasma Science and Technology的其它文章
- Special issue on selected papers from CEPC 2021
- Highly efficient γ-ray generation by 10 PWclass lasers irradiating heavy-ion plasmas
- Surface properties of Al-doped ZnO thin film before and after CF4/Ar plasma etching
- Photoexcited carrier dynamics in a GaAs photoconductive switch under nJ excitation
- Molecular mechanism study of Astragalus adsurgens Pall synergistically induced by plasma and plasma-activated water
- Microwave method based on curve fitting method for high-precision collision frequency diagnosis