
Modeling the dynamics of firms’technological impact?
2021-12-22 06:51:54ShuqiXu徐舒琪ManuelSebastianMarianiandLinyuan呂琳媛
Chinese Physics B 2021年12期
Shuqi Xu(徐舒琪) Manuel Sebastian Mariani and Linyuan L¨u(呂琳媛)
1Yangtze Delta Region Institute(Huzhou)&Institute of Fundamental and Frontier Sciences,University of Electronic Science and Technology of China,Huzhou 313001,China
2University Research Priority Program on Social Networks,University of Zurich,CH-8050 Zurich,Switzerland
3Beijing Computational Science Research Center,Beijing 100193,China
Keywords: firm technological impact,patent analysis,impact dynamics
1. Introduction
Complexity science methods have been recently applied to understand the dynamics of impact along creative careers.[1–7]In particular, researchers have unveiled remarkable regularities through the quantitative analysis of individuals’ creative works (such as scientists’ articles and directors’ movies). These works found that the career trajectories of scientists,[1,8]artists,[8]directors,[6,8]and best-seller authors,[6,9]among others, are determined by a uniform pattern called random-impact rule: the most important works occur randomly within an individual’s work sequence. Sinatraet al.emphasized that the ability of an individual to produce high-impact works is independent of his/her career stage,[1]based on which they developed theQmodel,where the impact of an individual’s works is determined by a random factor,reflecting the potential of the idea,and a parameterQ,representing the individual’s capability to improve the work.According to the model,high-impact discoveries require a combination of an excellent idea and highQ. These methods and findings are mainly focused on individuals’creative careers,and they have not been extended to model the impact of organizations,such as firms.
Existing evidence for firms suggests discrepancies among the impact dynamics of firms and individuals. Vast management literature acknowledged that firm age is an essential determinant of a firm’s impact.[10,11]And it is commonly recognized that young firms tend to present higher capability of innovation.[12,13]As a consequence, firm age might be negatively related to the impact of its technology. Recently,Xuet al.[14]provided initial evidence for systematic differences between temporal patterns of the highest-impact works in scientists’careers and firms’lifecycles.However,this work focused on the empirical evidence,and it did not propose a dynamical model to describe firms’impact evolution. How to modify existing impact dynamical models to accurately reproduce the observed firms’impact patterns?
To answer this question, we analyze the patent licensing histories of worldwide firms from the U.S. Patent and Trademark Office(USPTO)and the European Patent Office(EPO).We propose a new dynamical model to capture the observed dynamic regularities. Specifically,by analyzing the evolution of average patent impact within firms’lifecycles, we observe a constantly decreasing trend, which indicates that firms tend to receive diminishing returns from their patents as they are issued more patents.We show that theQmodel is unable to capture firms’empirical impact patterns. Motivated by this finding,we generalize theQmodel by incorporating the property that patents’impact depends not only on the firm’s capability and the potential of the patent idea, but also on the patent’s position within the firm’s lifecycle. Therefore, we propose a time-varying returns model to reproduce the observed patterns of the dynamics of firms’impact. We show that for both two analyzed datasets, the proposed model matches the empirical results more accurately than the state-of-art random-impact model andQmodel. Our study sheds light on modeling the patterns of firms’impact dynamics,which can provide useful insights for managerial practices.
2. Method
2.1. Patent data of firms
Patent activity is usually considered as a rich source to reflect firms’impact in terms of technology.[15–17]In this study,we investigate two large patent datasets: (i) The record of the patents granted by the EPO to 163565 firms from 1978 to 2016,covering 772127 patents. Note that the original data involves all types of applicants which are not limited to firms.In the analysis, we identify firm applicants by specific name identifiers, see Appendix A for details. (ii) The patent data from the USPTO to 7440 firms from 1926 to 2017,amounting to 2458402 patents.[18,19]Only patents whose applicant is a listed firm on the US stock market are included in the data.For each patent, the two datasets both include patent number,issuance date,names and ids of applicant firms,and a list of patent references. Therefore,we can identify the applicant firms of each patent, and based on the reference information,we can calculate the citation count of each patent at any given time. We summarize the main properties of the two studied datasets in Table 1.
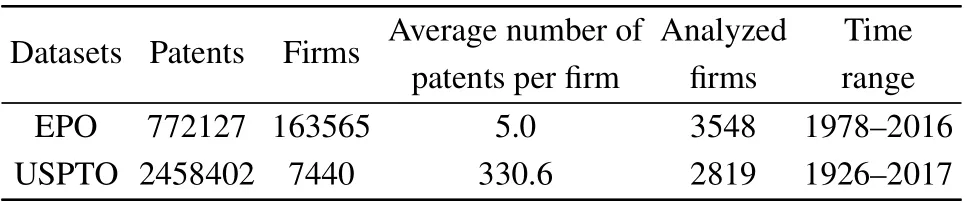
Table 1. Datasets description.
EPO and USPTO are regarded as the most representative and highly reliable databases for patent analysis and have been used in many information science and cross-disciplinary studies.[20–23]Table 1 demonstrates that at the patent level,USPTO contains more patents than EPO. Kimet al.[20]argued that the United States is considered as one of the world’s largest commercial and technological markets,and for this reason, international firms tend to file patents in the USPTO to claim their rights to protect the innovation in the US. As for the EPO data, it contains rich information on technological innovations mostly related to firms located in European countries. At the firm level, the USPTO data involves fewer firms than the EPO data, because all firms in the USPTO data are limited to listed firms,whereas there is no such restriction for firms in the EPO data.
We further show the cumulative distribution of the number of issued patents for firms in the two datasets in Fig.1(a).We observe that firms’ patenting activities is heavier in the USPTO than in the EPO. In the EPO data, 61.5% of firms have been issued only one patent, 93.9% of firms have been issued no more than 10 patents. For the USPTO data,there are only 13.44%of firms that have been issued one patent in total,82.34% of firms have been issued no more than 100 patents.One of the main reasons for this difference is that the listed firms usually have an advantage over ordinary firms in terms of resource and strength(for example,in terms of finance and innovation),which allows them to issue more patents.
Table 2 reports the top five firms issued the largest number of patents in the two datasets. In the EPO data, the top firms are mostly from Japan,the United States,and European countries; as for the USPTO data, most of the top firms are from the United States and Japan.
In the following, we only consider patents issued up to 2006. In this way, we have at least a 10-year time window to observe their impact. Furthermore, the research subjects of this study are firms, we need to focus on firms with sufficiently active patenting activities. For this reason, we limit our firm-level analysis to firms that have been issued at least 20 patents for the EPO data,which refers to 3548 firms,and at least 15 patents for the USPTO data,which filters 2819 firms(see Table 1). Our conclusions are robust with respect to alternative choices of the filter standard of analyzed firms (see Appendix C for the results of filtering firms based on their number of years of patenting activities).
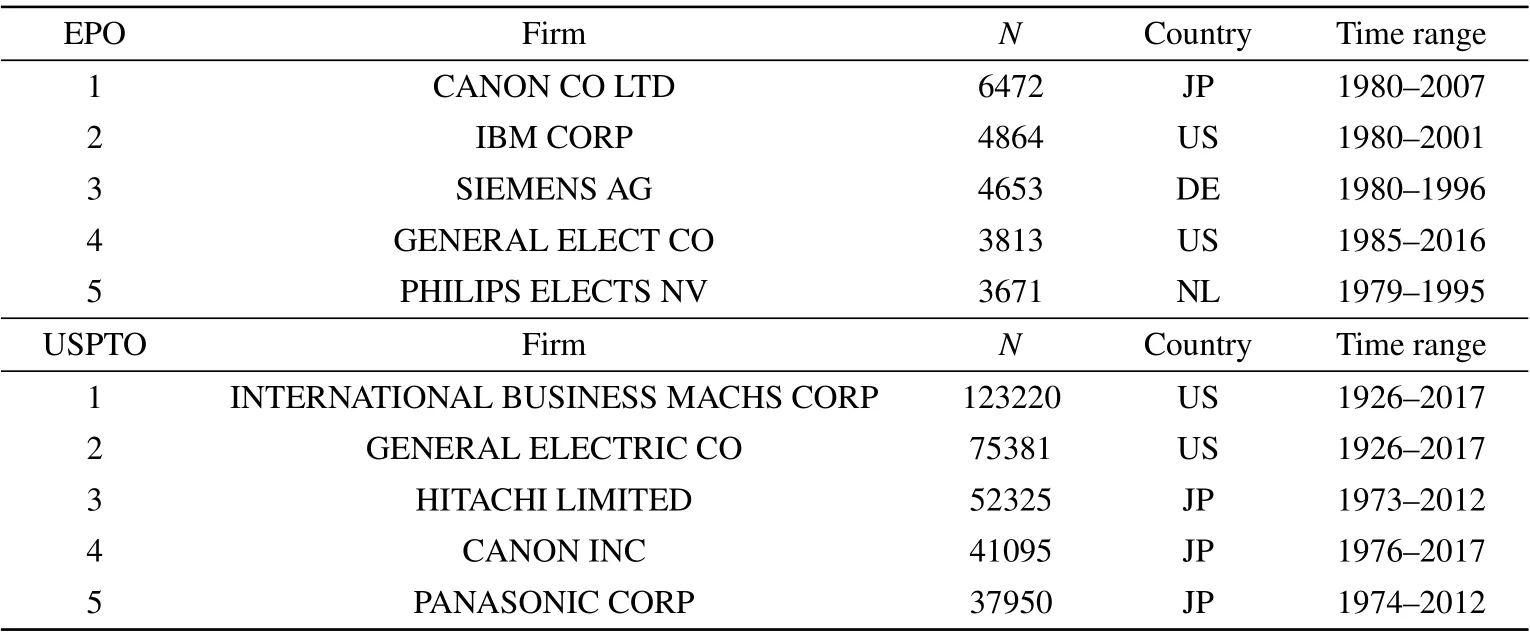
Table 2. Top firms by the number of issued patents. Time range refers to the first and last patent issuance year.
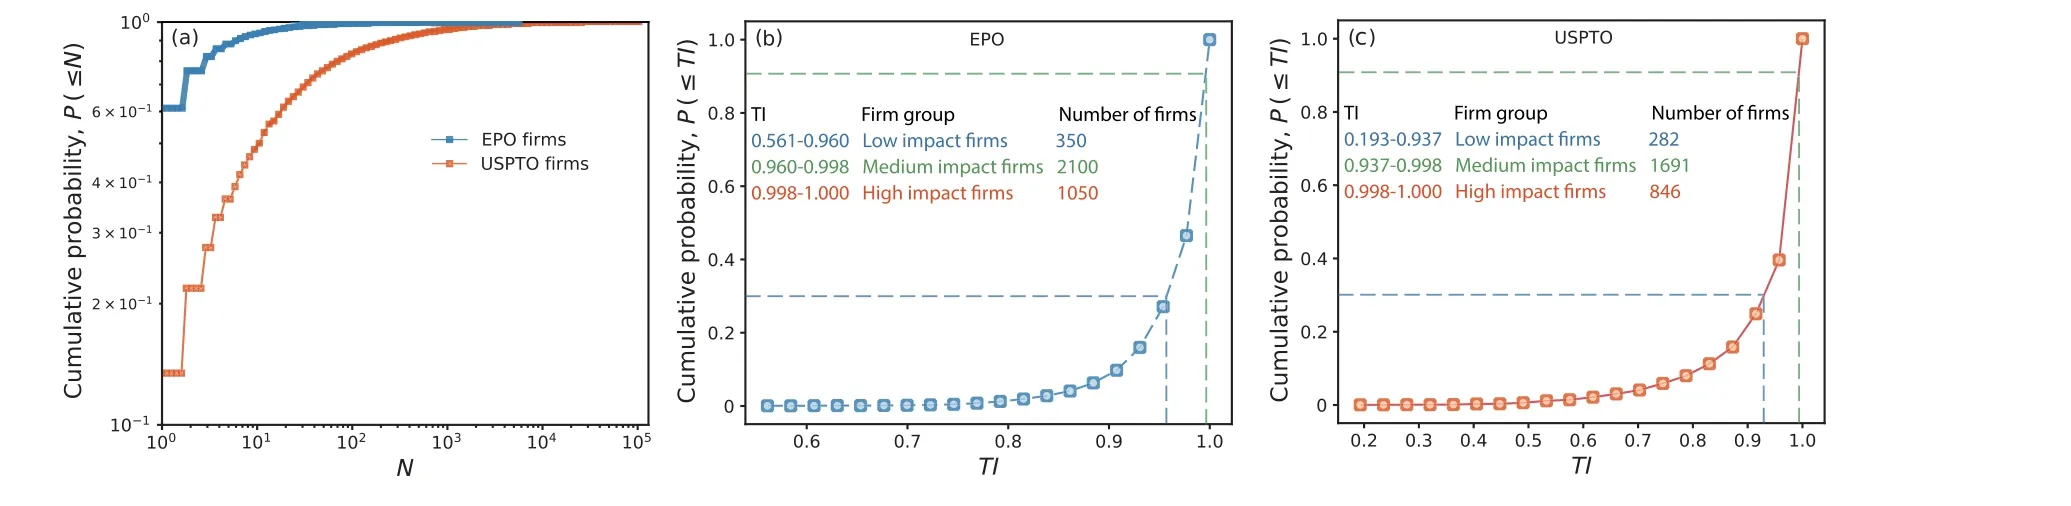
Fig.1. Cumulative distribution of firms’patent number and technological impact. (a) Cumulative distribution of the number of issued patents for firms in the EPO and USPTO data. (b)–(c)Cumulative distribution of TI for firms in EPO(b)and USPTO(c)data,as well as the impact thresholds that distinguish the three firm groups of impact.
2.2. Quantifying technological impact
Patent’s technological impact. To evaluate the novelty of the innovation seeking patent protection, patent applicants are required to disclose the prior knowledge on which they relied,[24]represented by citations to prior patents. Citations are proposed by the patent applicant, and subsequently checked and corrected by the patent examiner.[25,26]Because of this, patents’ citation count is the most used metric for patents’ technological impact.[23,27]Despite its wide use, citation count suffers from a serious age bias by favoring older patents over more recent ones.[28–30]The main reason is that it takes time for a patent to accumulate citations, and the preferential attachment (also known as the “rich-get-richer”mechanism)[31]further amplifies discrepancies in the citation count of patents issued at different times.[32,33]The age bias makes it unreliable to directly compare the citation count of patents issued in different years.[34]To overcome this issue,following Ref. [14], we measure a given patent’s technological impact in terms of its normalized citation count (NC),which corresponds to its ranking by citation count when compared against all patents issued in the same year. In this way,NC ∈[0,1)close to one(zero)corresponds to high(low)impact. Normalized citation count can effectively suppress the age bias held by citation count,[14]thus allowing us to compare on the same scale the impact of patents of different ages.

Fig.2. An illustration of two firms’lifecycles. Each dot represents a patent,and the x-axis refers to the issuance year of patents,y-axis refers to the technological impact(NC)of each patent,red dots denote breakthrough patents(patents with the highest NC). (a) Firm CANON’s lifecycle from the EPO data. (b)Firm APPLE’s lifecycle from the USPTO data.
Firm’s technological impact and classification. Motivated by previous works,[14,35,36]a firm’s lifecycle is defined as a time-ordered sequence of its issued patents (see Fig. 2).And we define a given firm’s technological impact(TI)as the impact of its highest-impact patent, which we refer to as the firm’s “breakthrough”. Based on the technological impact of all analyzed firms,we classify firms into three groups:we consider the top 10%firms as high-impact firms,the bottom 30%firms as low-impact firms, and the remaining 60% firms as medium-impact firms, see Figs.1(b)and 1(c)for the classification details.
2.3. Modeling impact dynamics
To describe the temporal dynamics of the technological impact in firms’ patenting lifecycles, we resort to three models to reproduce patents’impact.
State-of-the-art models and their shortcomings. We consider two models from previous works:[1]the randomimpact model and theQ-model. The random-impact model assumes that the impact of each of a firm’s issued patents is a random variable. Specifically,the model keeps a given firm’s total patent number unchanged, and it extracts the impact of each of the firm’s patents from the impact values of patents issued in that issuance year(without replacement). According to the random-impact model,the only difference between two firms is their patent productivity: a productive firm is more likely to have a breakthrough patent with high technological impact merely because of a larger number of attempts with the same likelihood to have high impact.
TheQmodel assumes that each firm has an capability valueQ,which is unique to the firm and stable throughout the firm’s lifecycle.Qcaptures the capability of firms to improve(Q>1)or reduce(Q<1)the impact of a patent. Specifically,in the model, a firmαrandomly chooses a patent ideaiwith potential impactri, and it modulates the idea according to itsQ,resulting in a patent of impact,

whereriis a patent-dependent random factor which is lognormal distributed with mean 1,identical for all firms.
The above two models were both motivated by the empirical findings on scientists’careers,[1]in which the highestimpact works are randomly distributed among individuals’careers. For firms, the validity of the two models has not been examined.
Time-varying returns model. In theQmodel, a firm’s early and late patents have the same probability to be the breakthrough patents, and the potential impact(r)of a patent idea itself and the firm’s capability (Q) are the only two factors that determine the impact of a patent,independently of the patent’s order within the applicant firm’s lifecycle. However,in management literature,many studies[12,13,37]have also uncovered the role of age played in firms’technological quality.These works argued that as firms become more experienced,the cost and benefits brought by innovation change,which suggests that firms may receive time-varying returns from their patents depending on the stage in their lifecycles. Inspired by these findings, based on theQmodel, we propose a timevarying returns model which assumes that a firm will enhance or diminish the potential impact of a patent based on its inherent ability combined with its age,quantified by its number of previously issued patents. In formulas, the impact of patentifrom firmαis modeled as

whereΦis a time-varying function representing the influence of firm age on patent impact,ni ∈{1,...,Nα}is the position of patentiwithin the time-ordered sequence of firmα’s patents,andNαis the total patent number issued to firmα. In the next section,we will show that a monotonously decreasing function exhibits an accurate fit to the empirical data,which we refer to as a diminishing returns effect.
3. Results
3.1. Productivity and impact dynamics in firms’patenting lifecycles


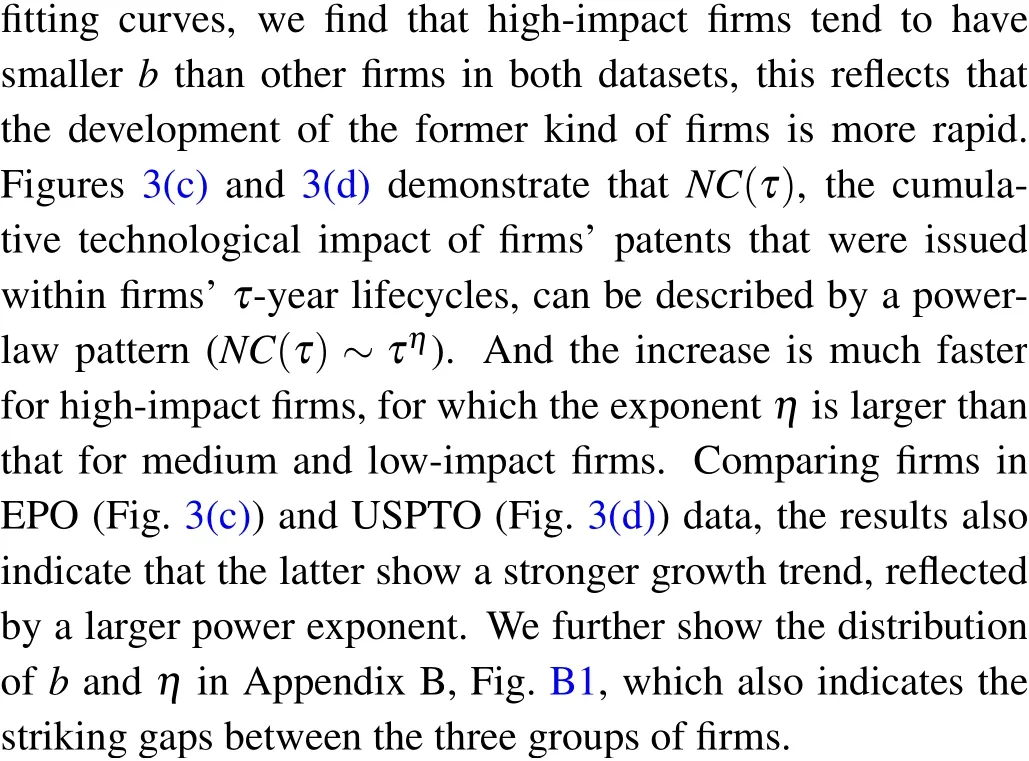
Fig. 3. Temporal dynamics of patent productivity and technological impact during firms’ lifecycles. The panels show the temporal trends of the total number of issued patents(a),(b)and cumulative technological impact(c),(d)for the three different groups of firms. Only firms with at least 20-year lifetime are involved in this analysis. Error bars refer to the standard error of the mean. The results show that there are sustained differences across the three impact groups of firms,and the growing trends of productivity and impact are well-described by sigmoidal and power-law functions,respectively,for both datasets. The fitting parameters are shown along the curves.
3.2. Timing pattern of the firms’breakthrough patents
We focus here on the recent finding uncovered by the recent study[14]that breakthrough patents (highest-impact patents)tend to occur early within a firm’s patenting lifecycle.This finding is revealed by the ratioN?/Nbetween the relative position of a firm’breakthrough patent,N?, and the total number of patents issued to the firm,N; a low (high) value of this ratio indicates that the breakthrough tends to be among the early(late)patents by the firm.[14]The results on the EPO and USPTO data are shown in Fig. 4. We find that the probability that a firm is issued its breakthrough patent is indeed not constant over time. A firm’s technological breakthrough is more likely to be among the firm’s earliest patents, regardless of firm’s group of impact,represented by an early peak ofP(N?/N). This is true for both the EPO and USPTO datasets;the same is not true for reshuffled lifecycles constructed from the original data by randomizing the temporal order of each firm’s patents (see the light lines in Fig. 4). These findings are consistent with the previous findings by Xuet al..[14]In addition, Fig. 4 reports that the peak for high-impact firms is slightly higher than that for the medium and low-impact firms.While through statistical tests,we find only the difference between the high-impact and low-impact firms in the USPTO data is significant,which demonstrates that the timing pattern of top-impact firms’breakthrough patents is similar to that of ordinary firms’ breakthroughs. So in the following, we will construct a unified model for all analyzed firms. In Table 3,we further provide specific impact values(TI)and relative positions of breakthrough patents(N?/N)for a few high-impact firms that are involved in both the EPO and USPTO data. For some of them,such as MOTOROLA MOBILITY and INTERNATIONAL BUSINESS MACHS, the breakthrough patents in the two datasets exhibit similar temporal positions. While there also exist firms that demonstrate gaps in terms of the timing of their breakthrough patents in the EPO and USPTO data,such as EASTMAN KODAK and EXXON MOBIL.This difference confirms firms’heterogeneity in terms of patenting activities in different patent offices, under which the uniform early timing has more credibility.
The observed early peak ofP(N?/N) can find explanations from previous management literature which claimed that young firms tend to present a higher probability of innovation than mature ones.[12,13]The underlying reason could be that as firms age, benefits from technological progress diminish,[13]and therefore, patents from old firms are more likely to be the extension and improvement of their established technologies,[39]which tend to hold relatively less impact compared with those from new entrants.The result proves that patent impact is correlated with the patent’s temporal order among the applicant firm’s lifecycle, and provides initial evidence in favor of a time-varying mechanism,i.e.,firms will obtain varying returns from patents at different stages in their lifecycles. This is radically different from the random-impact phenomenon in scientific and artistic careers, for which the return is stable.
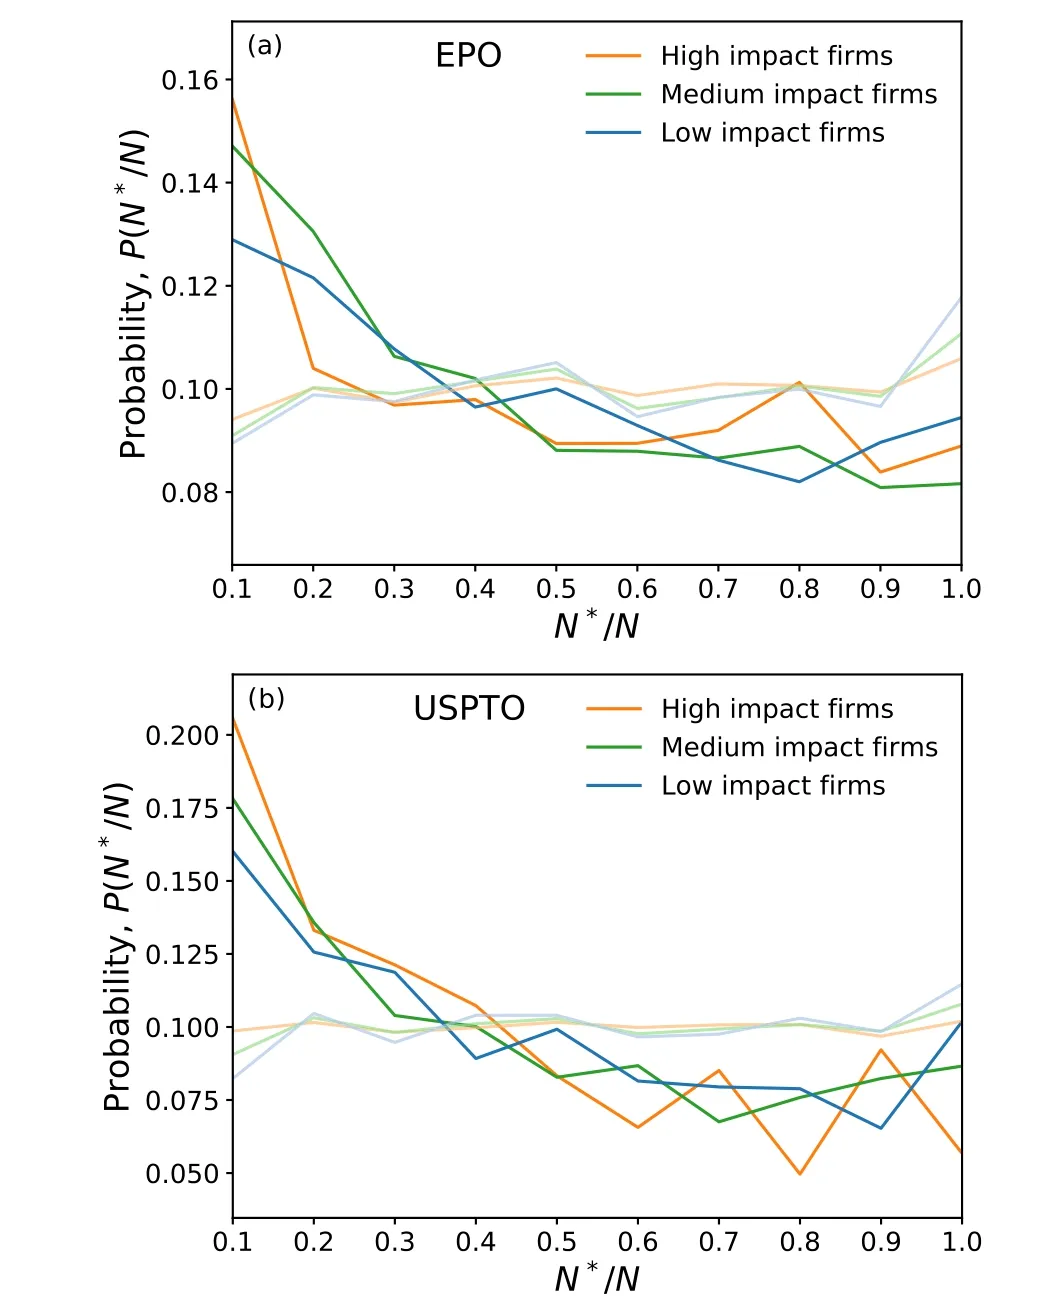
Fig.4. Distribution of the temporal order of firms’highest-impact patents.We show the probability distribution of the relative order(N?/N)of firms’technological breakthroughs, and the same distribution for randomized patenting lifecycles (denoted by the light lines) for high-, medium-, and low-impact firms, for the EPO and USPTO data, respectively. The results represent the average of 200 times statistics(to take the“paralleling”breakthroughs with the same impact value into consideration) and randomized firms’ lifecycles. The early-stage peak of the distributions for all three groups of firms indicates that firms are more likely to achieve their highestimpact patent at the beginning of their patenting activity, contradicting the random-impact rule.
3.3. Dynamical model of firms’technological impact
To further understand and model the dynamics of firms’impact, we then analyze the average impact of patents issued to firms in different phases of lifecycles. In Fig. 5, we show patents’ average impact as a function of their temporal orderwithin firms’ lifecycles. We find an approximately linear decreasing trend, which indicates that firms tend to obtain diminishing returns from patents as they are issued more patents.Based on this finding,in the time-varying returns model shown in Eq.(2),we assume a linearly-decreasing function to model the phenomenon of the diminishing returns
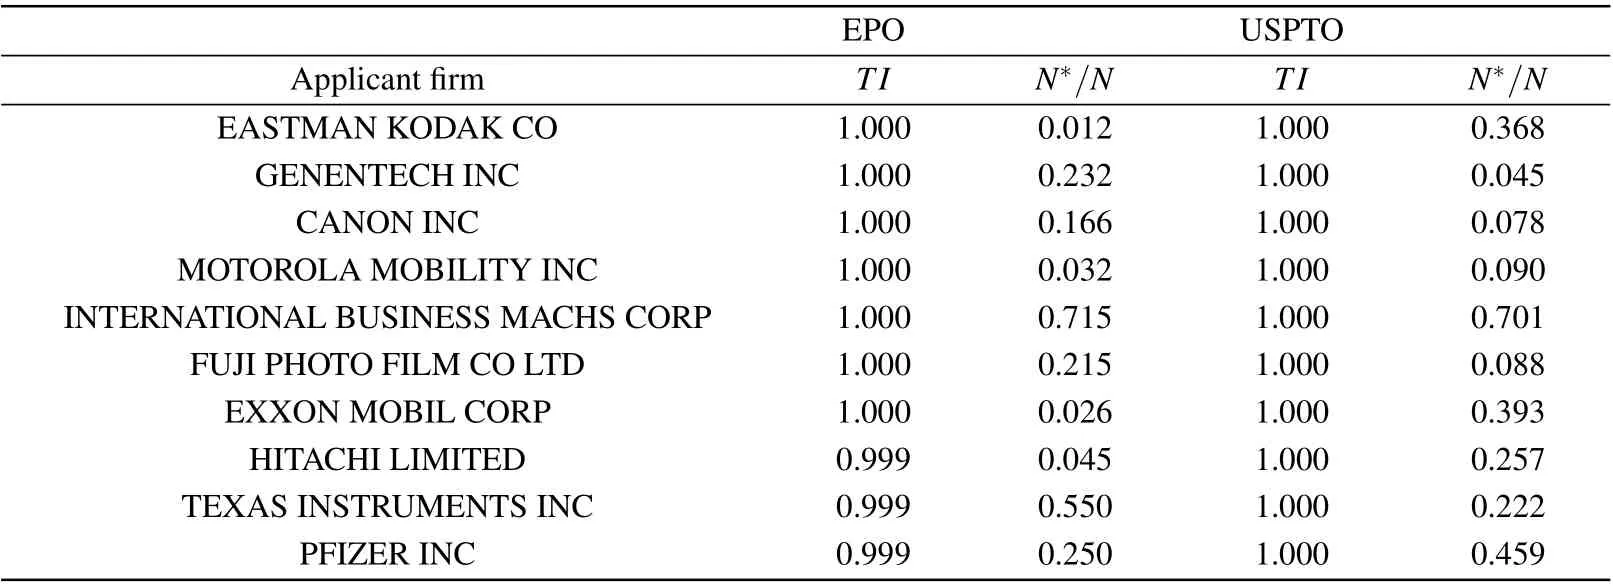
Table 3. The technological impact and timing to achieve the breakthrough patents of several high-impact firms. Here we select firms that have records in both the EPO and USPTO data.

whereβandγare parameters to be estimated based on the empirical data. Whenβ=1,γ=0(no-varying scenario),the time-varying returns model reduces to theQ-model.
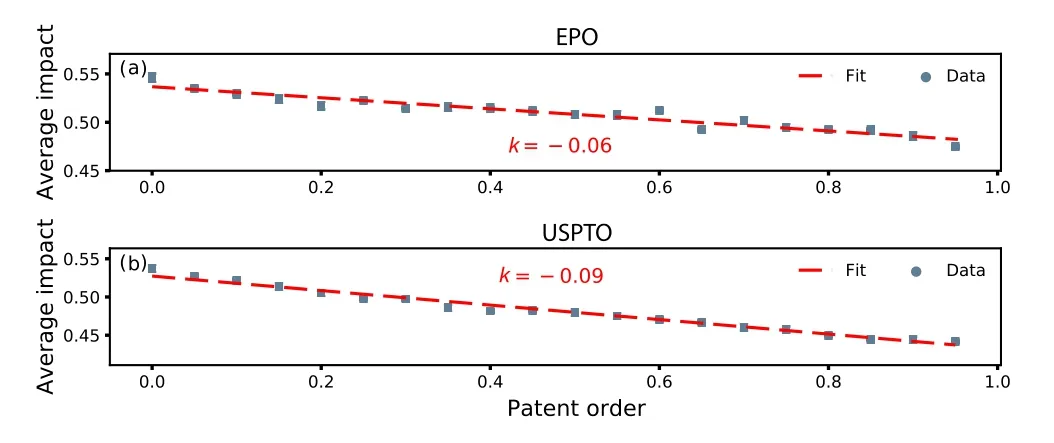
Fig.5.Average impact of patents as a function of their temporal order within the applicant firms’lifecycle. We divide each firm’s issued patents into 20 equally-sized groups according to the patents’issuance date. By aggregating all the analyzed firms,each dot represents the average impact of firms’patents that belong to the corresponding group. For example, the first dot from the left represents the average impact of firms’earliest 5%patents. Error bars refer to the standard errors of the mean. The results show that for both the two datasets, there is a linearly decreasing trend of patent impact as the patent order increases(via linear fit),which suggests a monotonously decreasing function for the time-varying returns model.
Assuming the proposed model, we firstly sum over the impact values of a firm’s all patents,and empirically estimate each firm’sQbased on Eq. (2) through the approximate formula

whereIαis the total patent impact of firmα,Pαdenotes the set of patents issued to firmα. Subsequently, we generate each patent’s simulated impact according to Eq.(2),and compare the simulated temporal pattern of firms’ breakthrough patents(i.e.,the probability distribution ofN?/N)with the corresponding pattern in the empirical data.
To calibrate the model parameters to the data, we apply a maximum likelihood approach. Specifically, we consider the Jensen Shannon divergence (DJS)[40]to measure the statistical “distance” between the observed temporal distribution,Pdata(N?/N), and the model-generated distribution,Pmodel(N?/N), which is the symmetric version of the Kullback–Leibler divergence.[1,41]It is defined as
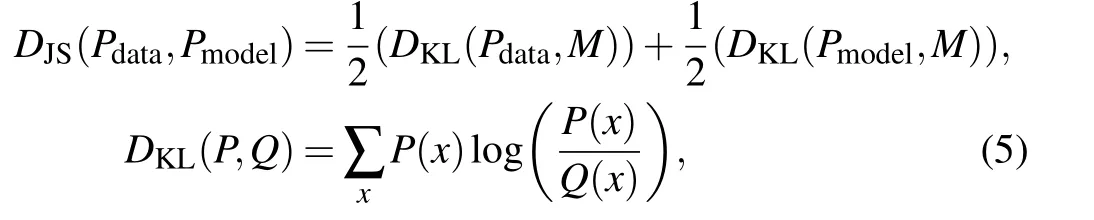
whereM=(Pdata+Pmodel)/2 is the mixed distribution. Then the likelihood function is defined as the fraction of modelgenerated distributions that are sufficiently close to the empirical one among 100 times simulations, i.e., the fraction of the simulated distributions such thatDJS<0.002 for the EPO data andDJS<0.005 for the USPTO data,in which the thresholds are chosen based on theDJSresults in each dataset. The threshold is a little larger concerning the USPTO data than the EPO data considering theDJSresults are overall larger for the former. The value of the likelihood function ranges from 0(no simulation fulfills the threshold) to 1 (all of the simulations fulfill the threshold). We choose the optimal parameter pair(?β,?γ)that maximizes the likelihood to generate a model whose temporal pattern is sufficiently close to the empirical one. The results are shown in Figs.6(a)and 6(b),in which the color of each box refers to the value of the likelihood function.Figures 6(a) and 6(b) demonstrate that the optimal combination of parameters(denoted by the box with green contour)is ?β=0.9, ?γ=0.06 for the EPO data, and ?β=0.9, ?γ=0.08 for the USPTO data, which are similar to the slope of the fitted line in Fig. 5. We also observe that theQmodel corresponding to the box with pink contour achieves 0 in terms of the likelihood on both datasets,namely,none of the 100 times simulations fulfills the related thresholds. This reveals that to accurately model firms’ impact dynamics, the role of the diminishing returns effect cannot be ignored.
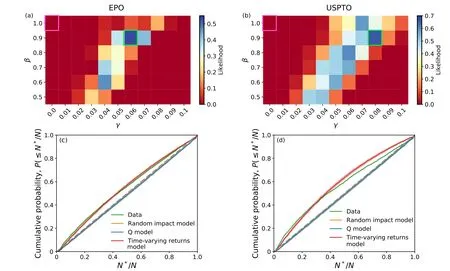
Fig. 6. Comparison of the empirical and model-based temporal patterns of firms’ breakthrough patents. (a), (b) The likelihood that the timing distribution of breakthrough patents(P(N?/N))generated by the time-varying returns model is sufficiently close to the empirical one(see Subsection 3.3 for details)among 100 times simulations for different parameter combinations. The parameter pairs that lead to the maximum likelihood are ?β =0.9, ?γ =0.06 for the EPO data (a), and ?β =0.9, ?γ =0.08 for the USPTO data (b), which are corresponding to the boxes with green contour. The Q model(corresponding to the box denoted by the pink contour)achieves the lowest likelihood. (c),(d)A comparison of the empirical and model-based distributions P(≤N?/N)of the breakthrough patents’temporal positions of firms. We consider two state-of-art models and the proposed time-varying returns model,which uses the optimal parameter pairs as mentioned above. The results indicate that the empirical results in the two datasets are well reproduced by the time-varying returns model.
Figures 6(c) and 6(d) show the fitting performance of the proposed model with the optimal parameters against the random-impact model and theQmodel for the EPO and USPTO datasets. The result reveals that the proposed timevarying returns model can match the empirical curve much more accurately. While the random-impact model andQmodel assume that a patent’s impact does not depend on its temporal position among its applicant firm’s patents,thus fail to generate the concave timing distribution of breakthrough patents observed in the empirical data. The results further confirm the discrepancy of the timing pattern of the highestimpact works for firms and individuals(such as scientists and artists[1,6,8]). Besides, we also notice that although our proposed model outperforms the random-impact model andQmodel by a wide margin, it cannot fit the empirical results perfectly, especially for the USPTO data. This could be due to the heterogeneity in firms’impact dynamics and model parameters,which will be validated in future works.
4. Conclusion and discussion
In this work, we modeled the evolution mechanism of firms’ technological impact within lifecycles. The USPTO and EPO patenting history data of applicant firms on a long timescale enable us to quantitatively trace and analyze the dynamic patterns of diverse firms worldwide. By treating each firm as a time-ordered sequence of its issued patents,we quantified the technological impact of their patents through a timenormalized citation measure, based on which we studied the dynamics of firms’ patent productivity, technological impact,and the timing pattern of the highest-impact patents. There are three main takeaways from this work.Firstly,we provided evidence that firms tend to have their technological breakthroughs at the early stage within their lifecycles, which contradicts the random-impact rule that governing individual careers,and confirms previous findings.[14]Secondly,we found that the decrease of firms’average patent impact along with the patenting lifecycles is accurately matched by a linear function. Thirdly,most importantly, inspired by these findings, we proposed a time-varying returns model, which is proved to capture the temporal distributions of firms’ technological breakthroughs more accurately than two state-of-art dynamical models.
A potential limitation of our approach is that our analysis assumes that all firms follow a uniform pattern. Yet different firms might have different trajectories, and the “average” behavior might not hold for all of them. Thus, our results could be not informative for specific types of firms. In future research,we will explore multiple patterns held by distinct types and industries of firms. Identifying drivers of the temporal position of firms’technological breakthroughs is also worth further research: The proposed model assumes that the time-varying functionΦis given, which leads to the important problem of identifying its determinants at the firm level.Besides,incorporating our insights into real-world investment and policy decisions would need careful integration with a variety of signals beyond patent analysis.Addressing these questions will help us identify the best path for firm development and further catch a glimpse of the secret of business success.
To conclude,this paper enriches the understanding of firm impact dynamics.It provides the first step towards new models to describe the observed,firm-specific empirical patterns. The results can offer insights into technological innovation management for firms.
Acknowledgment
We thank Luciano Pietronero, Emanuele Pugliese, and Andrea Zaccaria for providing us with the EPO patent data and enlightening discussions.
Appendix A: Filtering firm applicants in the
EPO data
As the research target in this paper is firm and not all applicants involved in the EPO data are firms,we remove some of the patent data that can be sure not assigned to firms. In detail,we identify four kinds of applicants based on their names and the information of their patents’inventors according to the following rules. (i) Firm applicants. If an applicant has the firm-related strings (refer to the first row in Table A1) in its name,this applicant is identified as a firm. (ii)Individual applicants. For each patent issued to a given applicant,if all its inventors also appear in the assignee field,and the applicant’s name does not contain any firm-related string,this applicant is identified as an individual applicant.[42](iii)Educational applicants. If the applicant does not have any firm-related string in its name but has the education-related strings (refer to the second row in Table A1), it is considered as an educational institution. (iv)Other applicants. If none of the above conditions is satisfied,the applicant belongs to this set. To exclude the patent data that is irrelevant to firms,we remove the patents issued to individual applicants and educational applicants,and leave the remaining data for the study. In total, we exclude 15.5%applicants and 4.3%patents,note that few of such applicants have larger than 20 patents, so the filtering has little influence on our analysis.
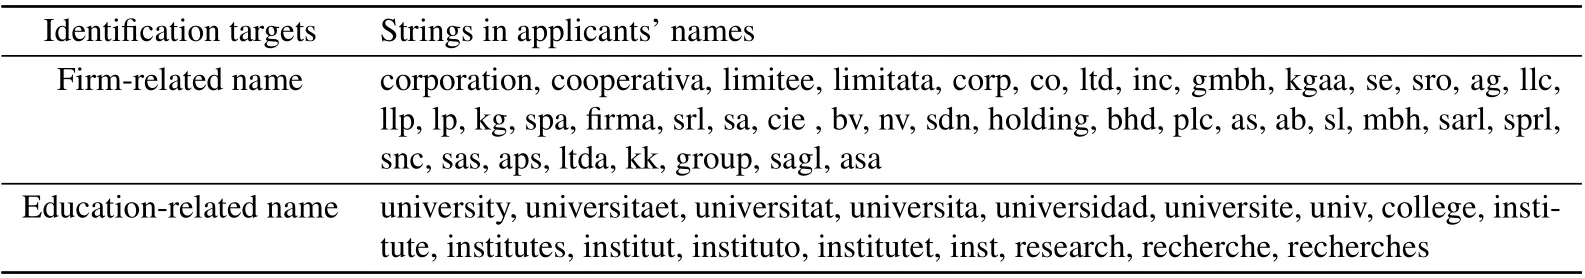
Table A1. The identification strings in applicants’names that we apply to filter applicants in the EPO data.
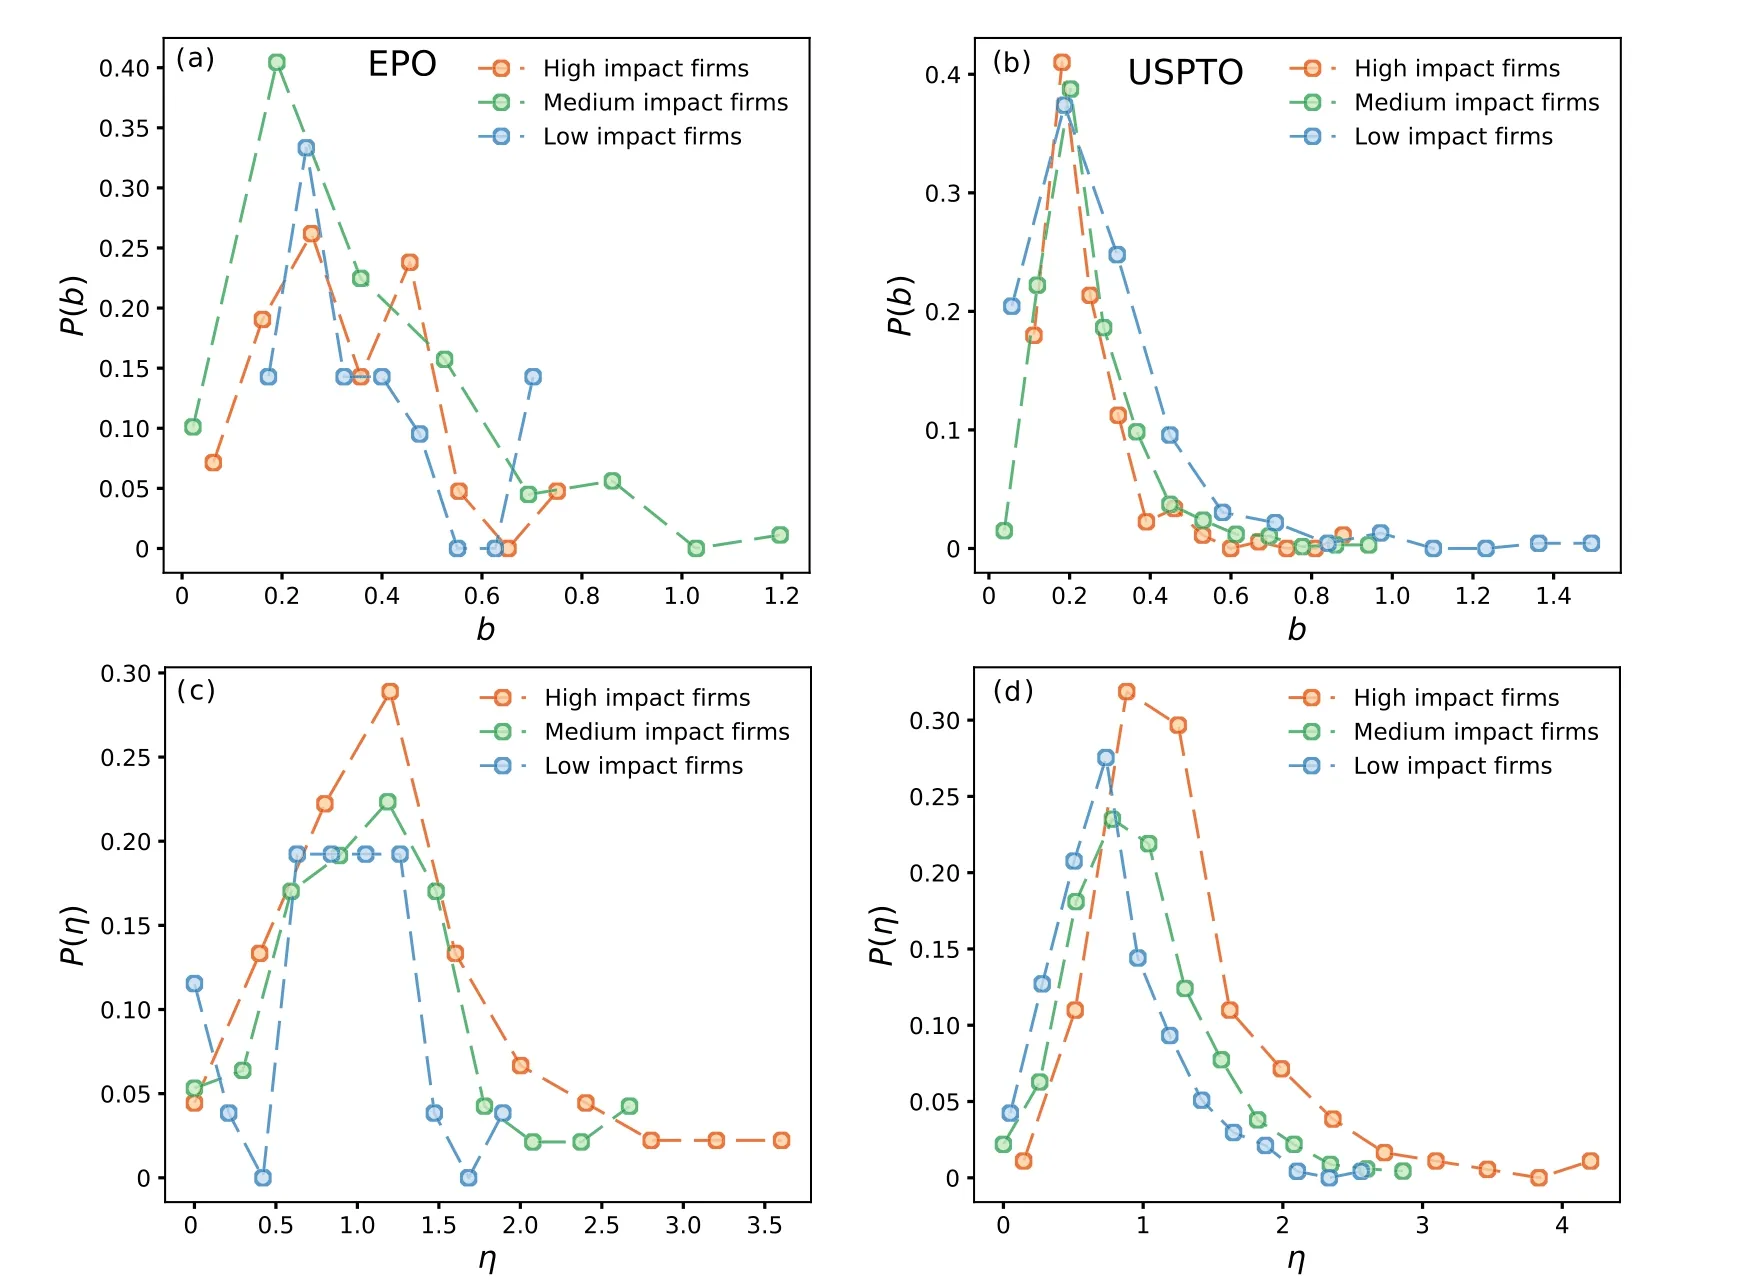
Fig.B1. Distribution of the parameter values(b and η)in the fitting of productivity and impact dynamics(see Fig.3)for firms in the(a),(c)EPO and(b),(d)USPTO data.
As for the USPTO data,in view of Koganet al.[18,19]have made the extraction based on the Center for Research in Security Prices(CRSP)database, we do not implement any applicant filter on this data.
Appendix B: Distribution of the fitting parameters in Fig.3
Based on Fig. 3, we further show the distribution of the fitting parameters of the productivity growth and impact growth for the three groups of firms in Fig. B1. The results reveal that in terms of productivity, the development of high-impact firms (〈bhigh〉=0.33 in EPO,〈bhigh〉=0.24 in USPTO)is faster than that of low-impact firms(〈blow〉=0.36 in EPO,〈blow〉= 0.31 in USPTO). In terms of technological impact, for low-impact firms, the growth is steady, with〈ηlow〉=0.88 in EPO, and〈ηlow〉=0.82 in USPTO.The increase of other firms is much faster, for whom the averageηis bigger,see Fig.B1.
Appendix C: Robustness check of the main results
In the main text, we consider firms that have been issued at least a given number of patents. To guarantee the robustness of our main results, we further add analysis under a different filter criterion for firms in both datasets, i.e.,the analyzed firms need to have long-lasting active patenting activities.[1,5,14]Specifically, for EPO data, we only consider firms that have at least 10-year patenting activity and have been issued to at least one patent every two years,which ends up with 1495 firms; for USPTO data, firms need to have at least 15-year patenting activity and have been issued to at least one patent every three years,involving 1007 firms. The main results under the new filter criterion are shown in Fig. C1,which demonstrate the robustness of our results.
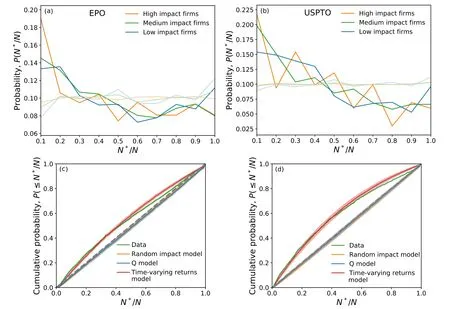
Fig. C1. Robustness check of the main results, in which we restrict firms’ patenting activities to be long-lasting and active. The results are consistent with the conclusions in the main text. (a), (b) Distribution of the temporal order of firms’ highest-impact patents, which is similar to Fig. 4. (c), (d) Comparison of the empirical and model-based temporal patterns of firms’ breakthrough patents, which is similar to Fig. 6. The optimal parameters for the EPO data are ?β =0.8, ?γ =0.06,and for the USPTO data,they are ?β =0.9, ?γ =0.08.
- Chinese Physics B的其它文章
- Sensitivity to external optical feedback of circular-side hexagonal resonator microcavity laser?
- Controlling chaos and supressing chimeras in a fractional-order discrete phase-locked loop using impulse control?
- Proton loss of inner radiation belt during geomagnetic storm of 2018 based on CSES satellite observation?
- Embedding any desired number of coexisting attractors in memristive system?
- Thermal and mechanical properties and micro-mechanism of SiO2/epoxy nanodielectrics?
- Tunable wide-angle multi-band mid-infrared linear-to-linear polarization converter based on a graphene metasurface?