
Experimental analysis of interface contact behavior using a novel image processing method*
2021-05-24 02:23:12JingyuHan韓靖宇ZhijunLuo羅治軍YulingZhang張玉玲andShaozeYan閻紹澤
Chinese Physics B 2021年5期
Jingyu Han(韓靖宇), Zhijun Luo(羅治軍), Yuling Zhang(張玉玲), and Shaoze Yan(閻紹澤)
State Key Laboratory of Tribology,Department of Mechanical Engineering,Tsinghua University,Beijing 100084,China
Keywords: real contact area,total reflection method,micro-contact spots,interface contact,experimental analysis
1. Introduction
Predicting the real contact area growth with load is an important and fundamental project in engineering science, such as sealing, conduction, heat conduction, friction and vibration. For the measurement of contact area, there are electrical conductivity method,[1,2]acoustic method[3,4]and optical method,[5,6]etc. Although the average of the real contact area can be obtained by the first two methods, the local or micro contact area of the contact interface cannot be measured.Optical method can be used to observe the change of local or micro contact behavior on the contact interface in real time, which is of great significance to reveal the spatiotemporal evolution mechanism of interface contact.
Interface contact is a cross spatial scale behavior. It should be noted that the term “scale” in this paper refers to the contact size, and represents the Hertz contact diameter.[7]Microscale refers to 0.01 micrometers to several micrometers,macroscale refers to 100μm to several millimeters. There are only few asperities in microscale contact, but millions of asperities in macroscale contact. With the development of measurement methods and measuring instruments, scholars can distinguish contact spots of microscale on larger macroscale contact.[8–10]In this paper, the macroscale less than 1 mm is named to be small-scale,and the macroscale larger than 1 mm is large-scale. In general, it is considered that the real contact area increases approximately linearly with the increase of normal load.[8,11–16]However, in recent years, scholars have found that the relationship between real contact area and normal load is not a simple linear relationship with the increase of contact scale.[2,17–22]The size of the contact interface,the contact material, the surface morphology and the loading mode may lead to real contact area growth slowing down with the increase of the normal load.[23–25]The relationship between the real contact area and normal load is nonlinear. The more obvious the change of real contact area growth rate is,the more obvious the nonlinear characteristic is. This phenomenon is called the nonlinear phenomenon of real contact area. At present, there is no unified conclusion on the mechanism of this nonlinear phenomenon.
In small-scale contact, the relationship between contact area and normal load in loading stage is mainly related to materials. For soft materials, the contact area has a good linear or sub-linear positive correlation with normal load. Parker and Hatch[11]first used a microscope to capture real contact area images under different working conditions, and verified the linear relationship between real contact area and normal load with soft metal,such as lead and indium.Ovcharenko et al.[23]also used a similar method to verify this linear phenomenon with copper material. In 2018, Weber et al.[8]adopted a molecular-level sensitive contact detection method to carry out the above research,and found that real contact area and normal load are not strictly linear correlation, but sub-linear correlation. They thought that this sub-linearity could be caused by the coupling of elastic deformation of the asperities and the plasticity of the contact interface. However, when the hardness of the material is high,such as steel,the contact deformation is mainly elastic deformation,and the small-scale contact obeys the Hertz contact law,and the relationship between real contact area and normal load is nonlinear.[23]
In large-scale contact, the relationship between contact area and normal load is mainly related to surface morphology,but weakly related to materials. When the roughness of the contact surface is large,the relationship between contact area and normal load is approximately linear.[5,9,26]Rubinstein et al.[5]analyzed the large-scale interface contact(300–1200)of polymathic methacrylate(PMMA)materials with a novel optical method based on total reflection principle. They thought that the change of transmission intensity can be used to characterize the change of real contact area. The experimental results showed that the real contact area has a linear positive correlation with normal load, and the relationship is not affected by environmental humidity, loading speed and materials. Kucharski and Starzynski[26]conducted large-scale interface contact experiments on steel materials,estimated the real contact area based on the surface morphology after loading,and found that for metal materials with high hardness,the real contact area was also approximately linearly related to normal load. However, for large-scale contact, when the roughness is small, the relationship between the real contact area and the normal load is nonlinear.[21,22]Rubinstein et al.[5]believed that for the contact of the surface with small roughness(RMS <0.1μm),the nonlinear phenomenon might be related to the evanescent wave,and the measurement error of contact area would be caused by the tunneling effect[27]of light when the real contact area was measured based on the total reflection method. Different from the analysis of Rubinstein et al.,Matsuda et al.[24,25]compared the effects of vacuum,dry and wet environment on real contact area,and found that the relationship between real contact area and normal load would be related to the existence of fluid between contact interface. The smaller the compression ratio of fluid, the slower the growth rate of real contact area with normal load. However, in the experiment of Matsuda et al., the surface of the specimens is very regular, which is generated by the mold, but the surface of engineering components is often irregular. Whether the inference is true or not remains to be verified.
It should be noted that the current research on the relationship between real contact area and normal load is still mainly focused on the loading stage. For the unloading stage, the contact behavior will be more complicated due to the influence of viscous or creep forces. When unloading, the relationship between real contact area and normal load is nonlinear, which shows that the decrease of real contact area lags behind the decrease of normal load.[5,10]In the complete loading and unloading process, real contact area and normal load show the hysteresis phenomenon. Rubinstein et al.[5]carried out the experimental and theoretical research on this hysteresis characteristic. They found that the hysteresis is related to the aging and“de-aging”of contact interfaces, and showed a scale-free mechanism. Dillavou and Rubinstein[28]regarded the hysteresis phenomenon as an aging of disordered system and introduced the Amir–Oreg–Imry (AOI) model to characterize it. The hysteresis characteristic of real contact area will cause excess energy dissipation, cause more wear of contact surface, affect the service life of equipment, and also bring challenges to the analysis of interface contact behavior.
Why is there a nonlinear relationship between contact area and normal load when loading with the increase of contact scale? For the irregular surface,what is the mechanism of nonlinear relationship between contact area and normal load in large-scale interface contact? Is this nonlinearity related to the existence of fluid between the contact interfaces? How does this nonlinearity affect the contact behavior during loading and unloading? In this paper, we set up an experimental apparatus based on the total reflection method,and attempt to analyze the above questions.
The overall plan of this paper is as follows. Section 2 describes the experimental apparatus and propose an image processing method to calculate real contact area and identify the micro contact behavior. In Section 3,the experimental verification and mechanism analysis of the nonlinear phenomenon of real contact area are carried out,and the micro contact behavior of this phenomenon is quantitatively analyzed. In Section 4, the influence of nonlinear phenomenon on the whole loading and unloading process is analyzed through the loading and unloading experiments with different normal load amplitudes and initial contact states. Section 5 is the conclusion of this study.
2. Experimental apparatus and image processing method
2.1. Description of specimens and experimental apparatus
The contact type of the experiment is the contact between rough surface and smooth surface.The specimen of rough surface is named as specimen 1,the specimen of smooth surface is named as specimen 2,and the specimen material is PMMA.The isotropic rough surface(3.024μm2)is obtained by sandblasting PMMA smooth surface (0.002 μm2) and processed into a boss. The size and surface morphology of specimen 1 are shown in Fig.1.
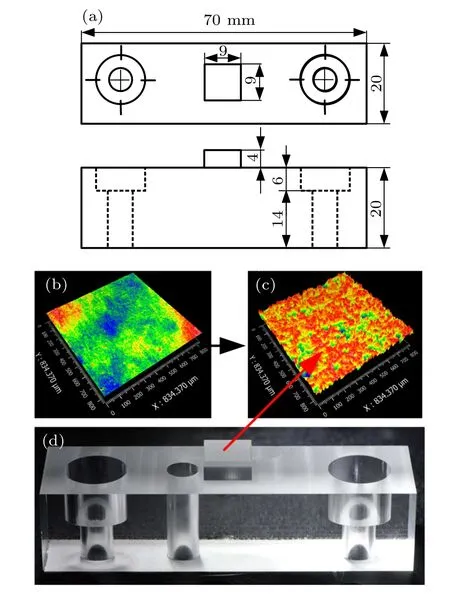
Fig. 1. Specimen 1: (a) size of specimen 1, (top) top view, (bottom) front view,(b)smooth surface,(c)rough surface,(d)picture of specimen 1.
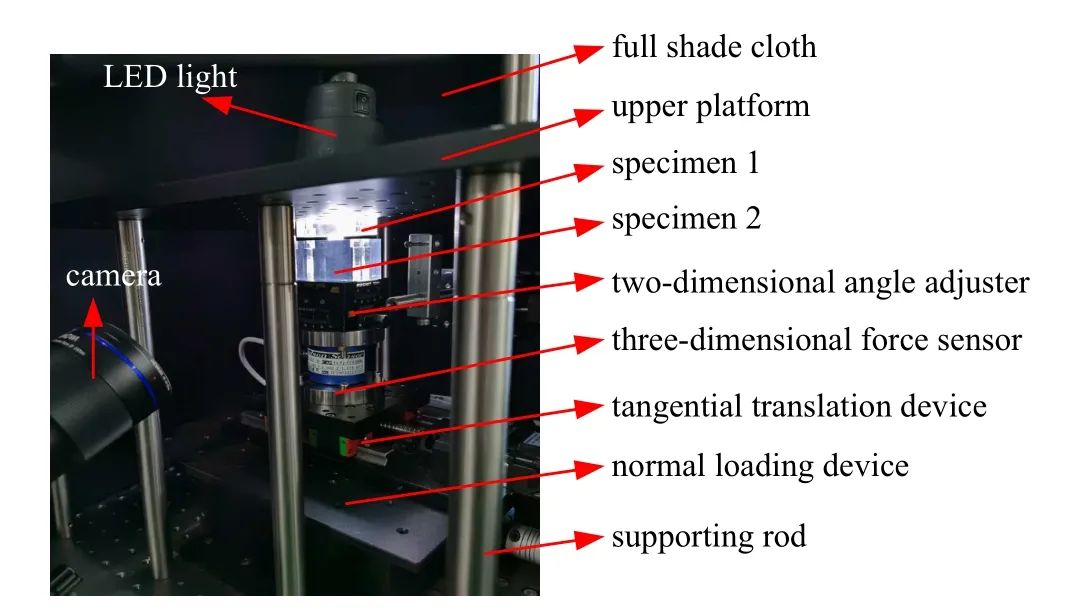
Fig.2. Picture of the experimental apparatus.
The total reflection apparatus designed by our research group is used in the experiment, as shown in Fig. 2. Specimen 1 is fixed on the upper platform by bolts, and specimen 2 is fixed on the two-dimensional angle adjuster by bolts,and the contact angle of contact interface is adjusted by the angle adjuster to ensure uniform contact. Angle adjuster,threedimensional force sensor, tangential translation device and loading device are connected by bolts. The force signal collected by force sensor(range 2000 N,resolution 0.5 N)is used as the contact force of interface. The normal loading device(stroke 25 mm,resolution 0.6μm,maximum load 800 N)can realize the loading and unloading. The tangential translation device (resolution 0.32 μm) is used to adjust the horizontal position. The LED light emits light to illuminate the specimens. The camera adopts Nikon D610+100 mm macro lens,with maximum aperture of 2.8. The whole experimental platform is covered with full shade cloth,to avoid the influence of environmental light on the experimental results.
2.2. Principle of total reflection method
There are many methods to acquire the image of contact area based on total reflection.[9,24,29–32]In order to achieve higher contrast,we chose to shoot from the side,[24]as shown in Fig.2(a). A hole is drilled on the top of the upper platform,and the contact specimen is irradiated by LED light source through the through-hole, and the contact interface image is collected by camera. When specimens 1 and 2 are not in contact,total reflection occurs on the smooth surface of specimen 2,and there is no spots image on the contact interface. When the asperities on the rough surface contact with the smooth surface,diffuse reflection occurs in the contact area,and the spots image are continuously recorded by the camera. Figure 3(b)shows the contact images observed before and after the contact. Since the interface is observed at 64°, the image is 3.5 times smaller in the x direction. The light intensity information and contact spots information of contact interface can be obtained by processing the video image.
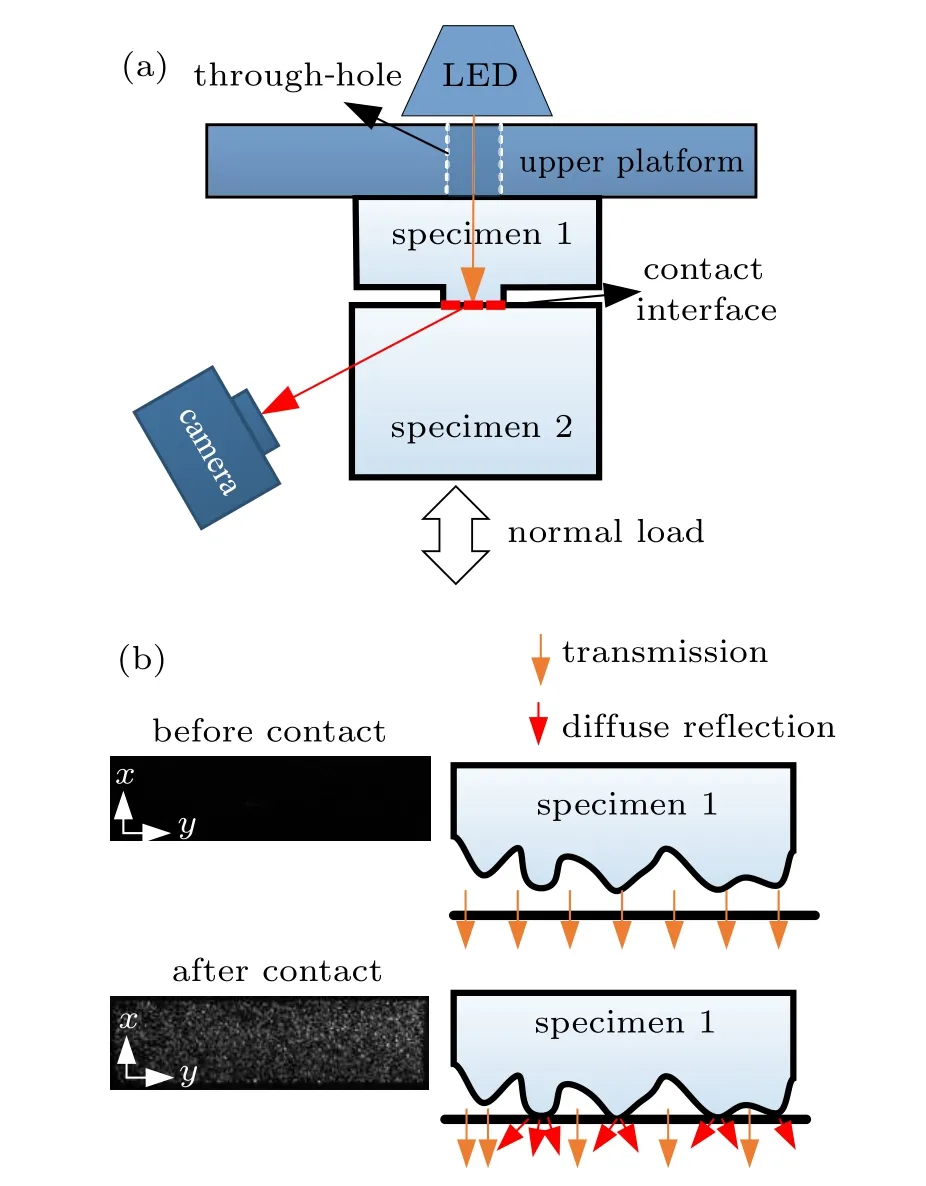
Fig.3. Schematic diagram of the total reflection method: (a)light path diagram,(b)principle of total reflection method.
2.3. Determination of micro contact spots and real contact area based on weighted superposition method
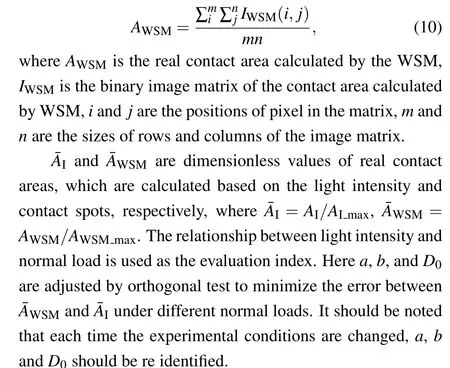
It is an active subject to predict the change of real contact area with normal load or tangential load. When the total reflection method is used to study the interface contact behavior,the intensity of transmitted light is usually used to characterize the real contact area,[5,6,8–10,24,33,34]expressed as follows:

where AIis the real contact area calculated by the total intensity of transmitted light, I is the grayscale matrix of image, i and j are the positions of pixel in the matrix,m and n are the sizes of rows and columns of the image matrix.
In order to further analyze the evolution of local contact area,some scholars use the Ostu algorithm to binarize the image to realize the recognition of the contact spots in the contact area.[10,23]The real contact area is calculated by the proportion of the contact spots in the contact area, as expressed in the following. The distribution of contact spots and their evolution with time can be used to reveal the internal mechanism of contact behavior.The Otsu algorithm can achieve a good identification result for the small-scale interface contact. However,in large-scale interface contact, because the contact spots are difficult to identify,[35–37]the evolution of the contact area is mainly characterized by the transmitted light intensity.[38,39]Song et al.[21]proposed to use the improved Otsu algorithm to identify the contact spots of large size contact interface, also expressed in the following.
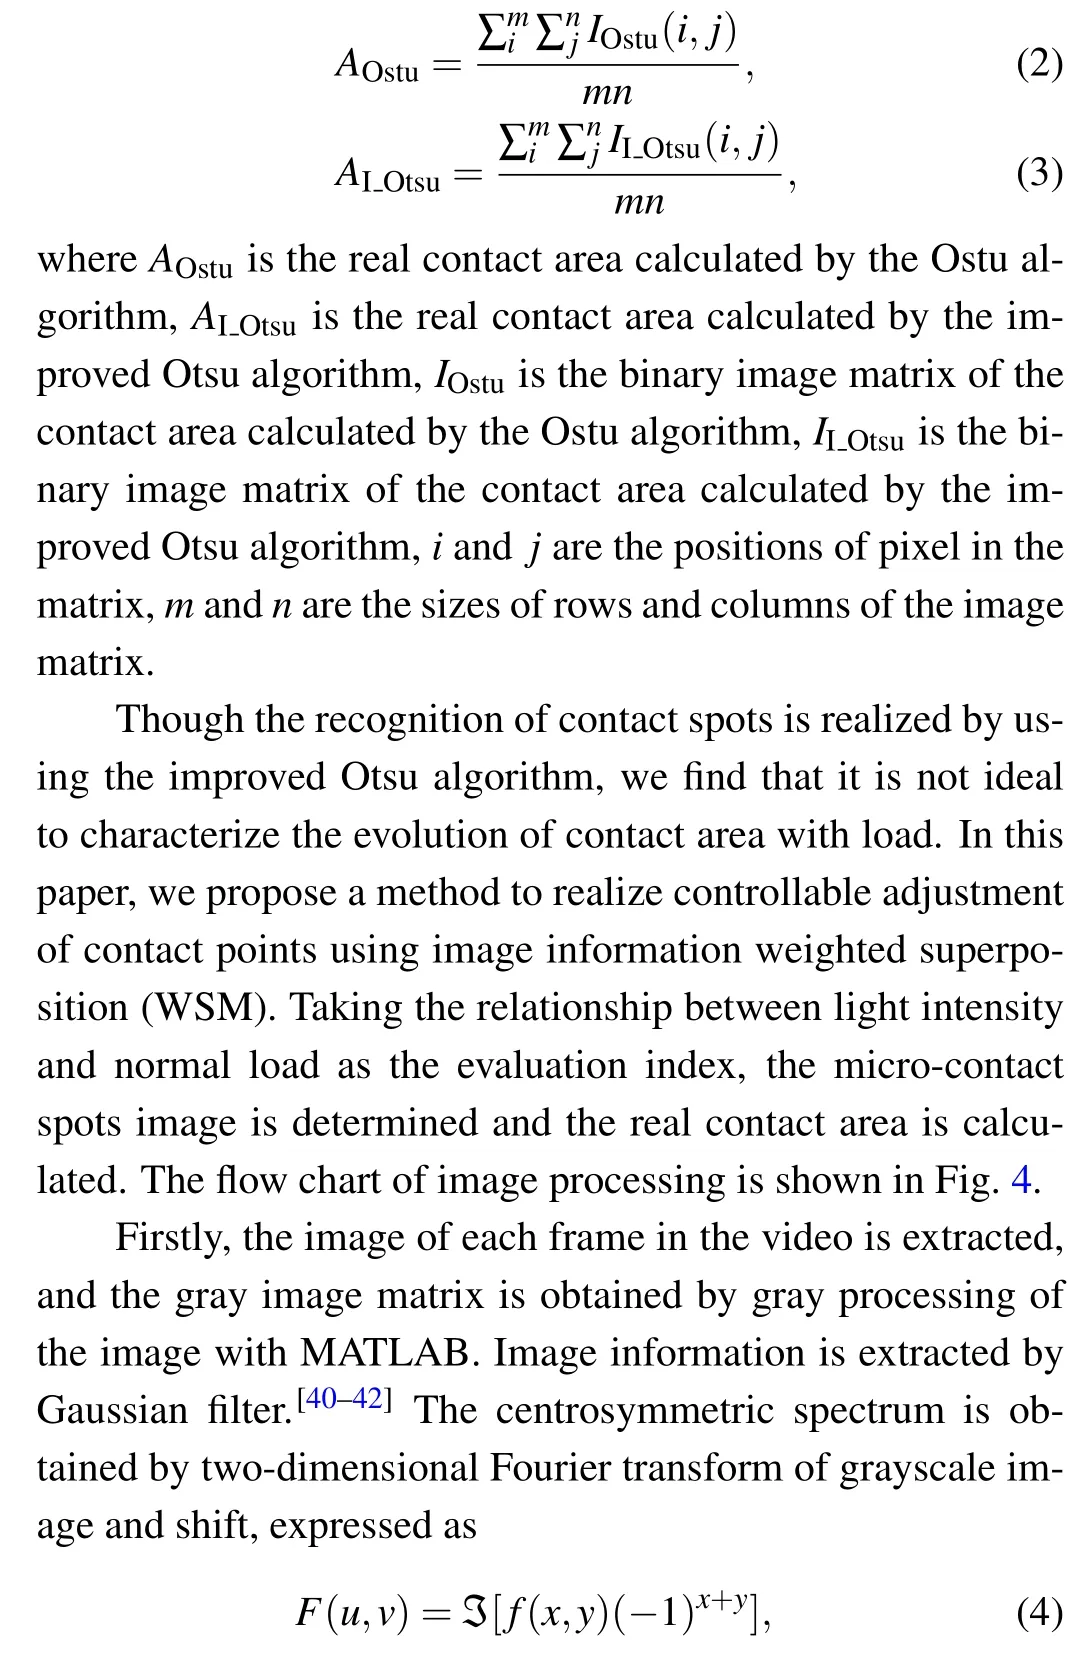
where f(x,y)is grayscale image matrix,x and y are variables of the image,F(u,v)is centrosymmetric spectrum,u and v are variables of the spectrum.
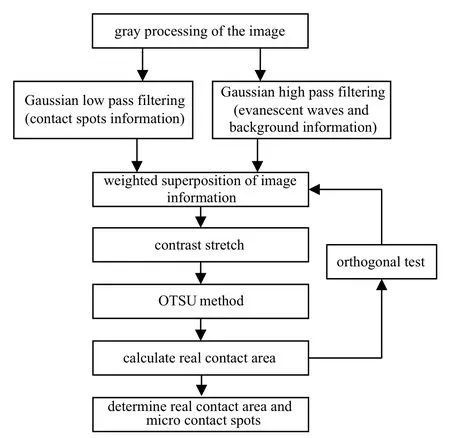
Fig. 4. Flow chart of the weighted superposition method of image information.
F(u,v) is convoluted with Gaussian high-pass filter HH(u,v,D0) to obtain the filtered spectrum GH(u,v,D0). D0is the cut-off frequency of Gaussian filter.

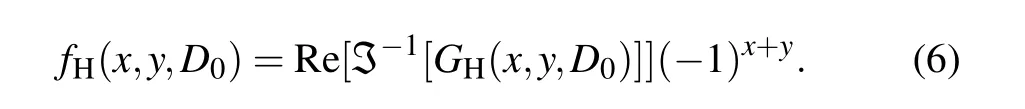
After the inverse two-dimensional Fourier transform and inverse shift of GH(u,v,D0), the Gaussian high-pass filtering image fH(x,y,D0)is obtained, fH(x,y,D0)is used to represent contact spots information,
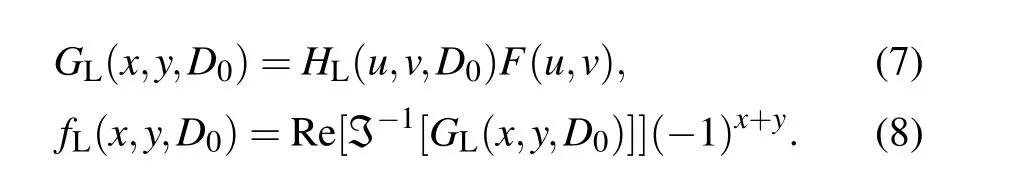
Similarly, the Gaussian low-pass filter transfer function HL(u,v)can be used to obtain fL(x,y,D0)after Gaussian lowpass filter, and fL(x,y,D0) is used to represent evanescent waves and background information
The weighted fH(x,y,D0) and fL(x,y,D0) are added to the original gray image f(x,y)to obtain the region of interest(ROI) fs(x,y,a,b,D0),
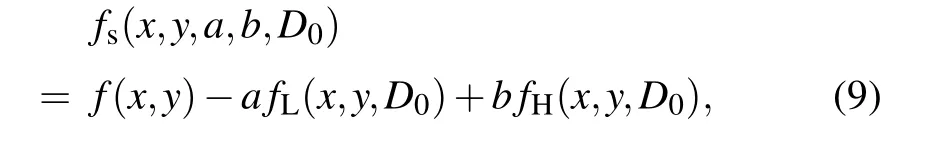
where a is the weight of evanescent wave and background information,and b is the weight of contact spots information.

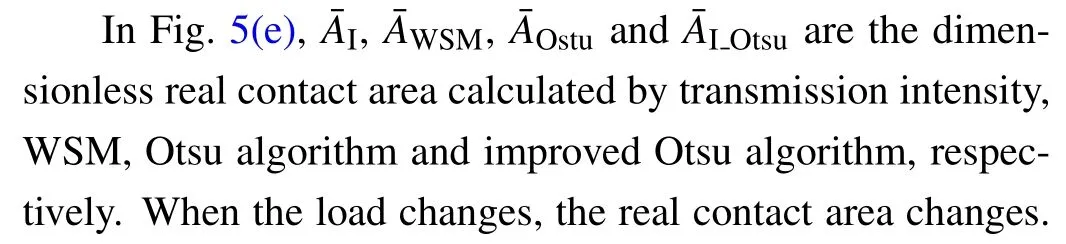
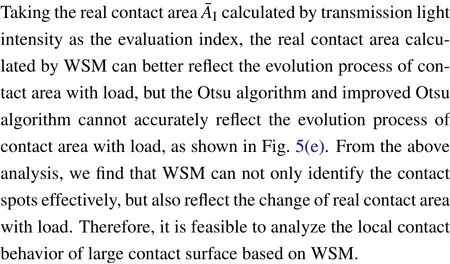
Fig.5.(a)Original image.(b)Processed image by WSM.(c)Processed image by Otsu.(d)Processed image by improved Otsu.(e)Comparison of real contact area measurement methods.
After contrast stretching and Otsu processing of ROI, a binarized image of contact spots is obtained. By calculating the number of white pixels,real contact area under the corresponding normal load can be obtained as follows:
Taking the loading hysteresis experiment in this study as an example, the experimental conditions are shown in section 4.1. After orthogonal test, we determine that a=1.33,b=1.47, D0=1.60, and the error between ˉAWSMand ˉAIis less than 5.28%. The contact area image identified by WSM is shown in Fig. 5(b). In order to verify the accuracy of the method,we also use Otsu and improved Otsu algorithm to calculate the real contact area.
When the load is 2.4 MPa, the contact area image is shown in Fig. 5(a), and the binarization image processed by three algorithms is shown in Figs. 5(b)–5(d). Compared the original image with the processed image,it can be found that WSM and the improved Ostu algorithm can better identify the micro-contact spots,whereas the Ostu algorithm cannot accurately identify the boundary of micro-contact spots.
2.4. Identification of micro contact behavior based on color superimposed image
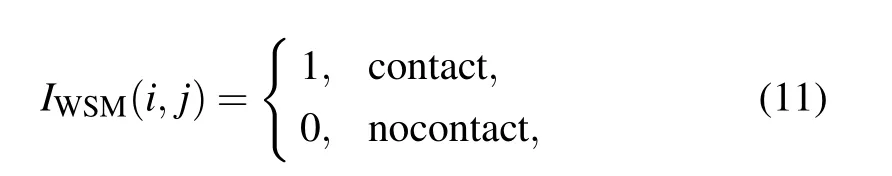
The corresponding contact spots information at different loads can be obtained by WSM.By analyzing the changes of local and global contact spots under different loads, the internal mechanism of contact behavior can be qualitatively revealed. However, there are many contact spots on the largescale contact interface,which brings challenges to direct analysis. We propose an image processing method based on the principle of primary color superposition,which uses different colors to represent the contact behavior, and realizes the visual analysis of contact behavior. When the normal load is applied, the initial load is wini, the final load is wfin, and wprois a process load between them. The binary image IWSMof the corresponding load can be obtained by WSM,in which the initial load image is IWSM,ini,the process load image is IWSM,proand the final load image is IWSM,fin. In the binary image IWSM,0 represents no contact and 1 represents contact.
where i and j are the positions of pixel in the matrix.
The binary images corresponding to the three loads are represented by RGB images of different colors. In order to display the contact behavior more intuitively, we adjust the partial superimposed colors based on the principle of three primary colors superposition, as shown in Fig. 6(a). Make the background white, and the contact spots in IWSM,ini, IWSM,proand IWSM,finare represented by blue,green and red colors,respectively. When the images of three kinds of loads are superimposed together,some contact areas will be overlapped. The contact areas where IWSM,iniand IWSM,procoincide are represented by sky blue, the contact areas overlapped by IWSM,proand IWSM,finare represented by purple,the contact areas overlapped by IWSM,iniand IWSM,finare represented by yellow,and the overlapping and contact areas in all three images are represented by black.
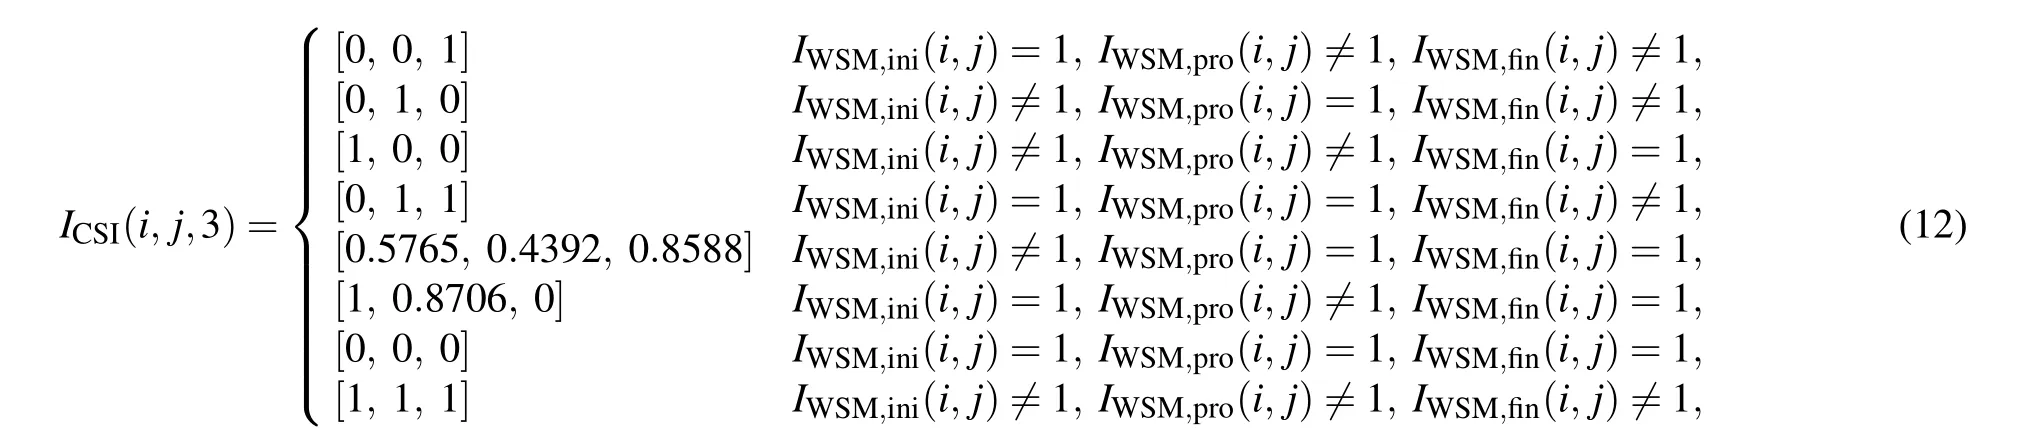
where i and j are the positions of pixel in the matrix,ICSI(i,j,3)is RGB image processed by the CSI method. The color of pixels in RGB image is determined by the threeelement row vector, in which elements specify the intensities of the red, green, and blue components of the color. Among them, blue is [1, 0, 0], green is [0, 1, 0], red is [0, 0, 1], sky blue is[0,1,1],purple is[0.5765,0.4392,0.8588],yellow is[1, 0.8706, 0], black is [0, 0, 0], and white is [1, 1, 1]. The image obtained based on the principle of primary color superposition is called the color superimposed image (CSI), as shown in Fig.6(b).
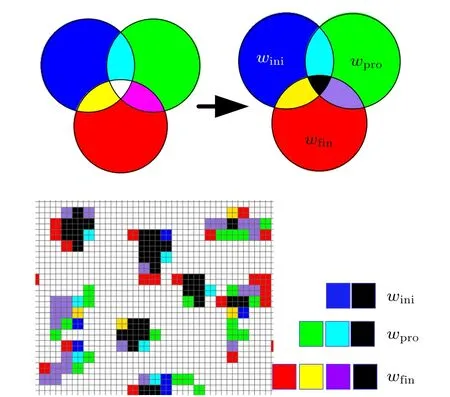
Fig.6.Principle of primary color superposition.(a)Color superposition adjustment. (b)CSI of the local contact area.
Taking the load hysteresis experiment in this paper as an example,the contact surface images under 1.0 MPa,2.0 MPa and 3.0 MPa are selected, and the corresponding binary images IWSM,ini,IWSM,proand IWSM,finare obtained by WSM,and the corresponding CSIs under the loading condition are obtained by formula(12),as shown in Fig.7(a). Primary colors and their superimposed colors can be used to characterize the micro-contact behavior. For primary color,red represents the newly emerging contact area,as shown in Fig.7(b). Blue and green represent the contact areas that disappear with the increase of normal load, as shown in Fig. 7(e). This is mainly due to the plastic flow or creep of the contact interface during the loading process, resulting in the height of some asperities being compressed,and the asperities originally in contact state are separated from the interface.[5]In addition to the primary colors,a large number of colors in Fig.7(a)are displayed as superimposed colors. These superimposed colors indicate contact area growth.With the normal load increases,asperities that have been contacted continue to be pressed.The larger the area of superimposed color,the greater the bearing capacity of local area and the local stress. It should be noted that the sky blue indicates that, although the contact area growth occurs during the loading process, the contact area separates again with the increase of normal load,as shown in Fig.7(f). Only the three superimposed colors of purple,yellow and black represent the contact area growth that still exists, as shown in Fig.7(c). Black indicates the areas that always keep in contact during the loading process. These areas are the key to bear the normal load and the main influencing factors of contact behavior.
The interrelationships between colors can indicate more complex contact behavior.Three relationships of colors shown in Fig.7(d),purple or red between the black blocks or red between the purple blocks,all indicate that the merge of adjacent contact areas has occurred. With the increase of normal load,the adjacent contact areas will merge in a certain scale, and two independent contact areas will merge into a larger contact area. Although these merged regions are still in independent contact at higher resolution, the occurrence of these merges indicates that the interaction between asperities is enhanced,and the interaction between asperities will further affect the contact behavior.
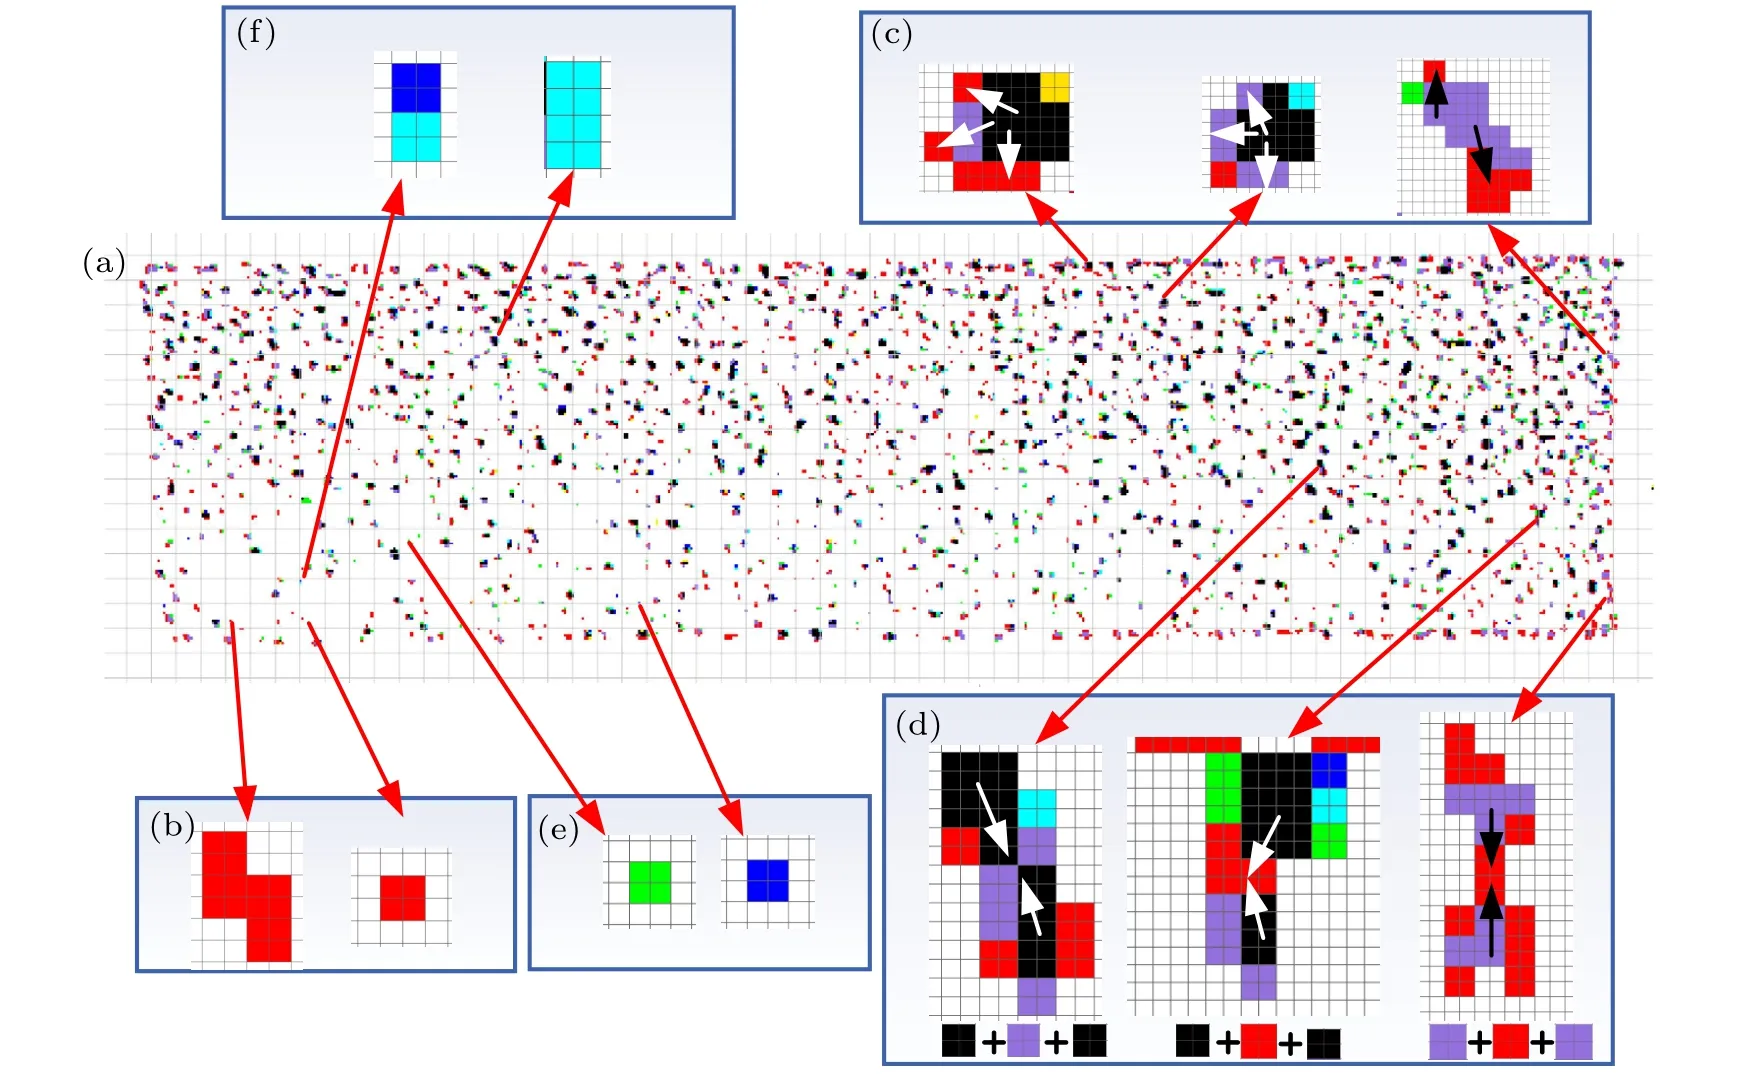
Fig. 7. Micro-contact state recognition based on the principle of primary color superposition. (a) Whole image after recognition. (b) New contact area. (c)Contact area growth. (d)Adjacent contact area merges. (e)Contact area separation. (f)Growing contact area disappears.
From the analysis of Fig. 7, it can be found that during the increase of normal load, the following behaviors mainly occur in the contact area:(1)new contact area,(2)contact area growth,(3)adjacent contact area merges,(4)contact area separation, (5) growing contact area disappears. By calculating the proportion of each color in CSI,the micro-contact behaviors of contact spots can be quantitatively analyzed. In Section 3.3,we introduce the methods for quantitative analysis of micro-contact behavior, aiming at the nonlinear phenomenon of real contact area.
3. Experiment and mechanism analysis of nonlinear phenomenon of real contact area
3.1. Experiment of nonlinear phenomenon of real contact area
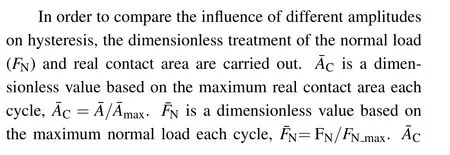
The experiment is carried out in an air-conditioned room at 25°C and 50% humidity. The initial state of the experiment is contact interface separation. Normal load is normal loaded to 3.87 MPa at the speed of 0.9 MPa/s, then unloaded to 0 MPa, repeated for three times. In order to reduce the influence of creep force,the interval of each cycle is 60 s. Since the contact gap is mainly air,the experiment is called air fluid test(AFT).After the AFT is completed,drop water drops between the contact interfaces to ensure that the water droplets can cover the contact interface,and slowly normal load so that specimen 1 is immersed in water drops and air is discharged,as shown in Fig. 8. Then the loading and unloading test is carried out in the same way as AFT.This experiment is called water fluid test(WFT).In order to achieve universality,the real contact area is treated to be dimensionless in this paper. ˉAAis dimensionless value of real contact area based on the maximum real contact area, ˉA=A/max(AAFT). Figure 9 shows the results of AFT and WFT.In AFT,the real contact area error of the maximum normal load in the three cycles is less than 2%;and in WFT,it is less than 1%. Both AFT and WFT show good repeatability.
In order to analyze the influence of air fluid and water fluid on the real contact area, the contact area of AFT and WFT is treated dimensionless with the maximum contact area of AFT as the standard, ˉAA=A/AAFT, as shown in Fig. 10.It shows that real contact area of WFT is smaller than that of AFT under the same normal load. In the loading stage,the curve bending of WFT is more obvious than that of AFT,indicating that with the decrease of fluid compression ratio between contact interface,the nonlinear relationship between real contact area and normal load is more obvious. With the increase of normal load,the asperities of the contact interface will undergo elastic deformation or plastic deformation and compress the fluid in the contact gap. Correspondingly, the fluid will resist this compression, thus hindering the increase of real contact area. We call this phenomenon the resistance effect of fluid.

Fig.8. Water fluid test.
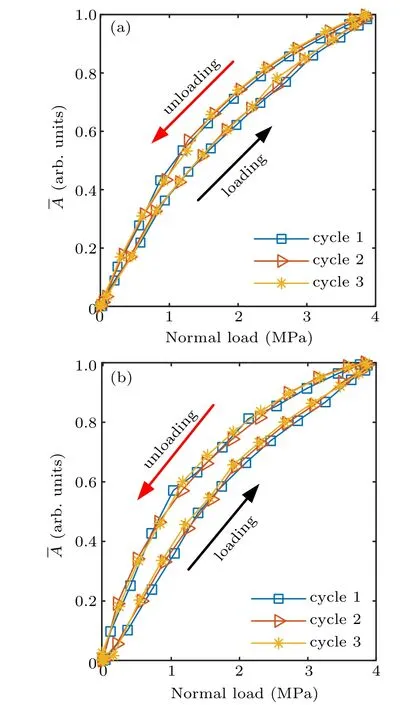
Fig. 9. ˉA versus normal load for three cycles. (a) Air fluid test. (b)Water fluid test.
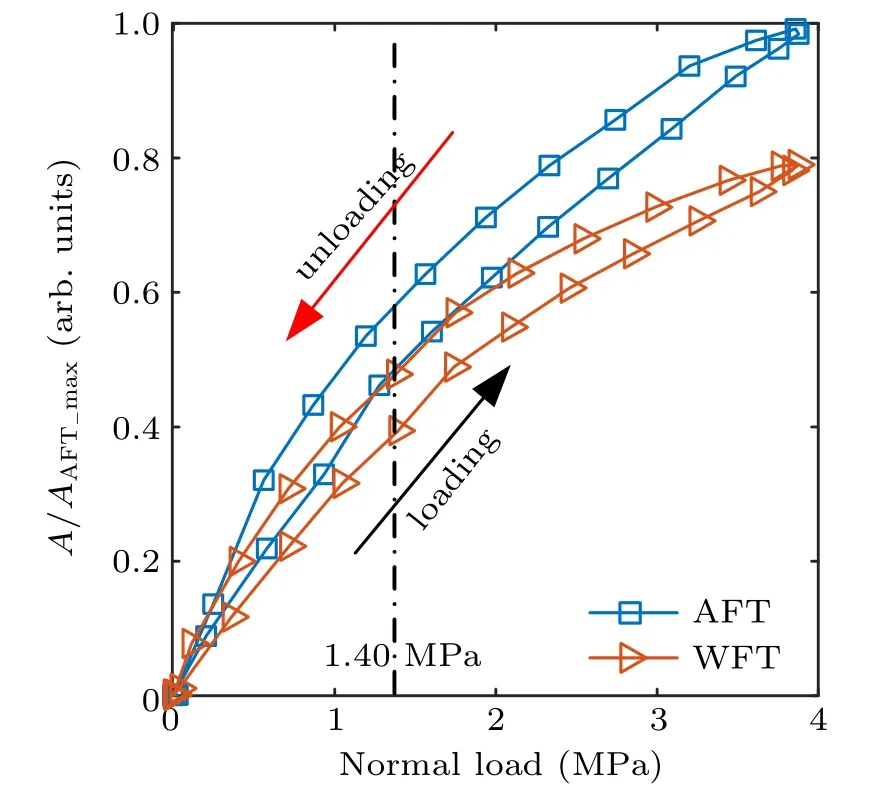
Fig.10. Comparison of AFT and WFT.
When the normal load is less than 1.4 MPa, the contact area has an approximate linear relationship with the normal load due to the weak resistance of the fluid. In addition,since the water film reduces the light intensity of the whole contact interface, real contact area of WFT is lower than that of AFT.When the normal load is greater than 1.4 MPa,the resistance of the fluid is enhanced. Due to the small compression ratio of water, the resistance effect is stronger, and the corresponding real contact area is smaller. With the increase of normal load,the real contact area grows more slowly. On the contrary, if there is no fluid in the contact interface, the relationship between real contact area and normal load tends to be linear.[24,25]The comparison of the results between WFT and AFT show that,the resistance of fluid between the contact interfaces is an important factor that leads to the slow growth of the contact area.
3.2. Analysis of nonlinear phenomenon of real contact area considering real stress
Figure 10 shows that the slope of the curve is negatively correlated with normal load. If the stress calculated by the nominal contact area is called the nominal stress (NS), and the stress calculated by the real contact area is called the real stress(RS).Because the curve bends with the increase of normal load,the growth rate of real stress is accelerated. On the contrary, if the real contact area in Fig. 10 is a straight line,the real stress increases uniformly. Figure 11 shows real contact area versus the real stress(red triangle)and nominal stress(blue square), respectively. ˉANSis the real contact area corresponding to the nominal stress, ˉARSis the real contact area corresponding to the real stress. Due to the limitation of resolution in this experiment, the error of real stress calculation becomes larger when the normal load is smaller.Therefore,we mainly analyze the real contact area above 0.2. In the loading stage,there is a good linear relationship between real contact area and real stress. Due to the resistance of the fluid,the real contact area bears more normal loads,so the real contact area and nominal stress will show a nonlinear relationship. It is further verified that the resistance of the fluid is an important factor leading to the nonlinear phenomenon of the real contact area.
The resistance of the fluid between contact interface is related to the surface morphology. For the small-scale interface contact, the contact area has a good linear relationship with the nominal stress,[8,11,23,38]because the fluid is easy to overflow through the contact gap, and cannot form a resistance effect.[24,25]For large-scale interface contact, when the roughness of the contact surface is large, the fluid can easily leak from the contact gap, and the resistance of the fluid can be ignored.[24,25]However, for the interface contact with small roughness or contact between rough surface and smooth surface, fluid leakage from the contact gap becomes difficult.With the increase of normal load,the fluid will be compressed in the contact gap, thus producing a resistance effect. Under the resistance effect of the fluid between the contact interface,although friction force is reduced, local or real stress is increased, which may lead to an increase in the incidence of surface wear.
It should be noted that the“black box”behavior between the contact interfaces leads to a very complex relationship between real contact area and normal load.Our experiments only found that there is a correlation between the resistance of the fluid and the nonlinear phenomenon of real contact area. For higher hardness materials,such as metals,more experimental verification is needed.
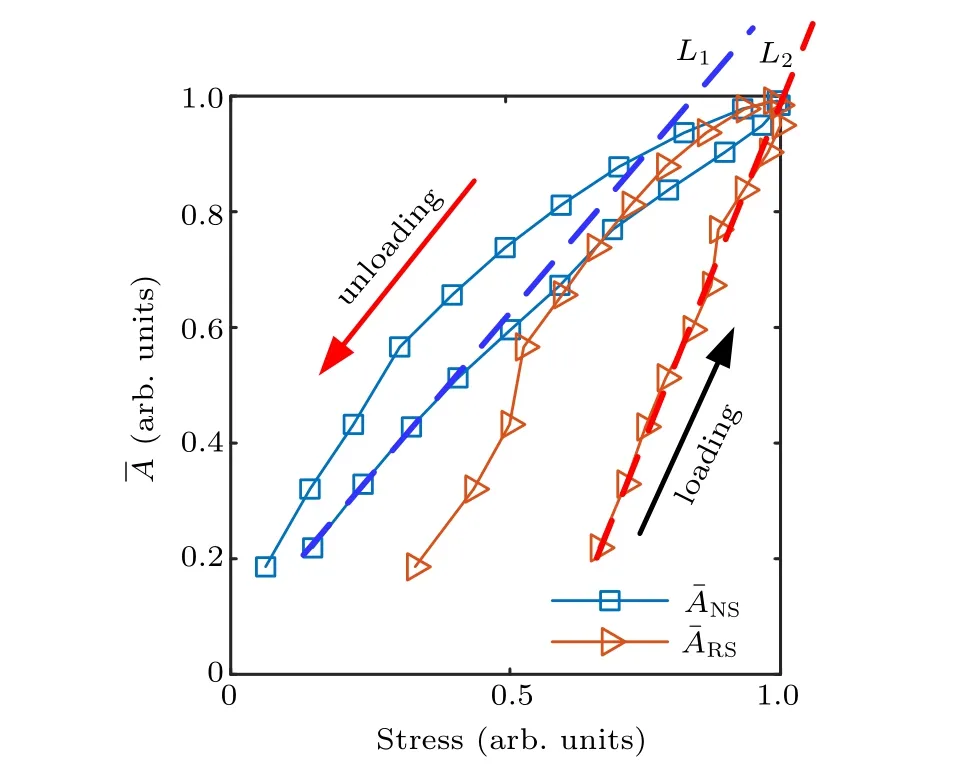
Fig. 11. Comparison of the effect of real stress and nominal stress on real contact area. L1 and L2 are linear fitting of ˉANS and ˉARS,respectively.
3.3. Analysis of nonlinear phenomenon of real contact area based on WSM and CSI
The contact behavior is mainly determined by the interaction of asperities on the interface. In order to analyze the influence of micro contact behavior of asperities on the nonlinear phenomenon of real contact area. We use WSM to identify the contact spots in AFT and WFT. The weight is determined by orthogonal experiment.For AFT,a=1.35,b=1.25,D0=1.60, the recognition error is 4.6%. For WFT, a=1.3,b=1.25, D0=1.60, the recognition error is 3.5%. The CSI of AFT and WFT is obtained by superimposing 1 MPa,2 MPa and 3 MPa images, as shown in Fig. 12. Because the spatial position of the contact spots is basically fixed,it is convenient for us to carry out comparative analysis of micro contact behavior. Since the number of contact spots of AFT is less than that of WFT,the real contact area of WFT is smaller than AFT under the same normal load,which is consistent with the conclusion in section 3.1.
By counting the number of colors in CSI,the micro contact behavior can be quantitatively analyzed. Figure 13(a)shows the proportions of various colors with AFT as the standard. Red,purple and black accounted for the largest proportion,while blue,green and sky blue accounted for a small proportion. The new contact area and contact area growth compensate for the decrease of real contact area caused by contact area separation,indicating that the increase of real contact area mainly depends on the new contact area and contact area growth. The pie diagram of CSI can more directly reflect the influence of micro contact spots on contact behavior,as shown in Figs.13(b)and 13(c).

Fig.12. CSI comparison of AFT and WFT.(a)AFT.(b)WFT.
When the proportion of red in pie diagram is high, the increase of real contact area mainly depends on the new contact area with the increase of normal load. New contact area can bear the increased normal load and make the surface stress more uniform. Black,purple and yellow all indicate the growth of contact area.
When their sum ratio increases and the red ratio decreases, the bearing capacity mainly depends on the contact area growth, which means that the local stress increases and part of the asperities will bear more normal load. Comparing Figs.13(b)and 13(c),we can find that the combination of black,purple and yellow proportion are 54%(AFT)and 55%(WFT), basically unchanged, whereas the red proportion of AFT (30%) is obviously less than that of WFT (34%). This shows that the fluid between the contact interfaces mainly obstructs the appearance of new contact area, and then leads to the decrease of real contact area,which will cause some asperities of AFT to bear more stress under the same normal load.The increase of local stress also increases the probability of wear,which is consistent with the conclusion of section 3.2.

Fig.13. Quantitative analysis of micro contact behavior of WFT and AFT.(a)Bar diagram comparison of contact behavior. Abbreviations in abscissa indicate color,B(blue),G(green),R(red),LB(sky blue),Y(yellow),P(purple),K(black). (b)Pie diagram of micro contact behavior of WFT.(c)Pie diagram of micro contact behavior of AFT.
4. The effect of nonlinear phenomenon of real contact area on the whole loading and unloading process
At present, the analysis of loading and unloading hysteretic characteristics is based on the linear relationship between contact area and normal load. However, for the largescale interface contact with small roughness surface,the fluid between contact interface may lead to the nonlinear phenomenon of the real contact area.This section mainly analyzes the influence of this nonlinear phenomenon on the hysteretic characteristics of the whole loading and unloading process.Through the loading and unloading experiments with different normal load amplitude and initial contact state, we will analyze the influence of nonlinear phenomenon of real contact area on the whole loading and unloading process.
4.1. Loading hysteresis experiment
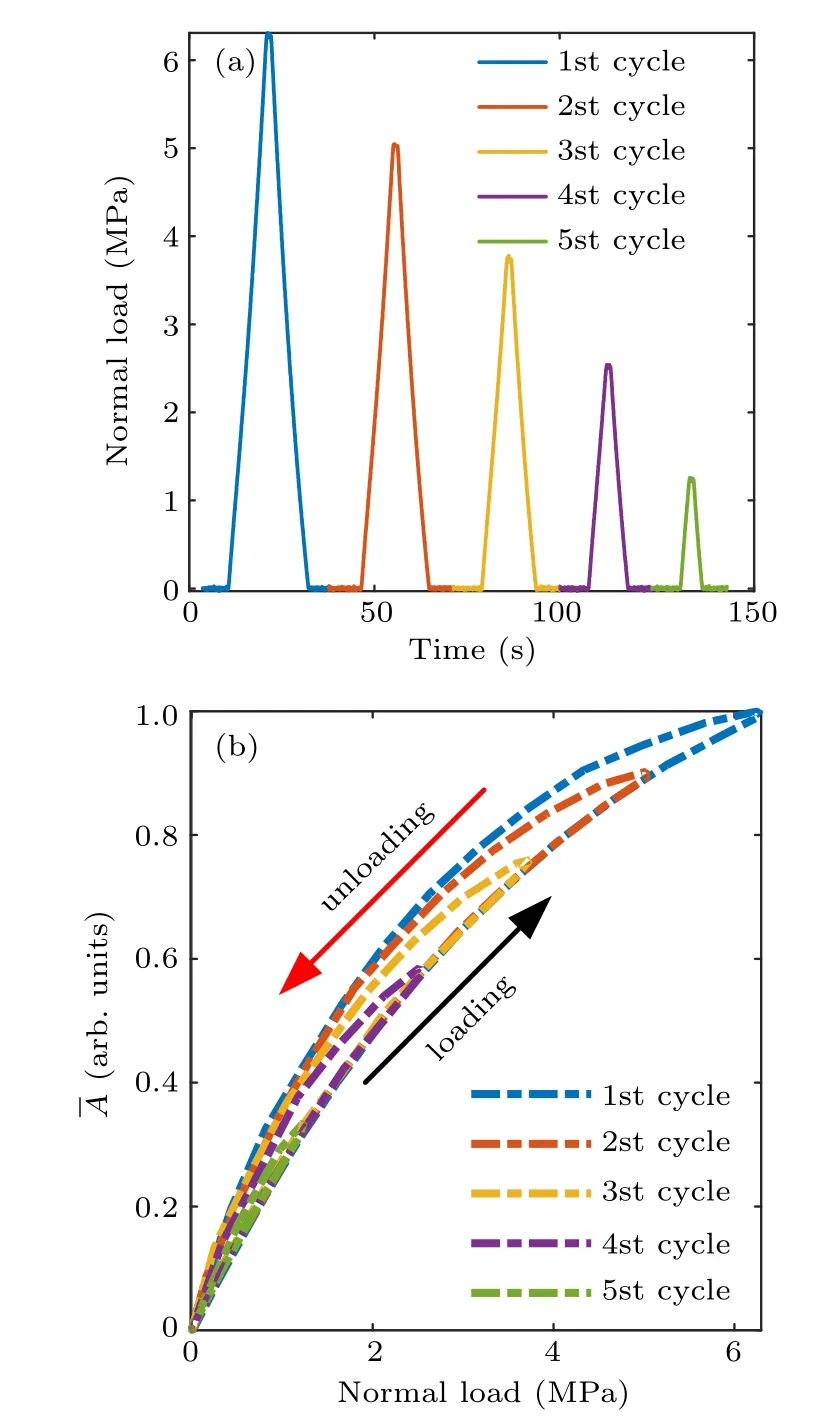
Fig.14.Loading hysteresis experiment.(a)Loading mode.(b) ˉA versus normal load, ˉA=A/max(A).
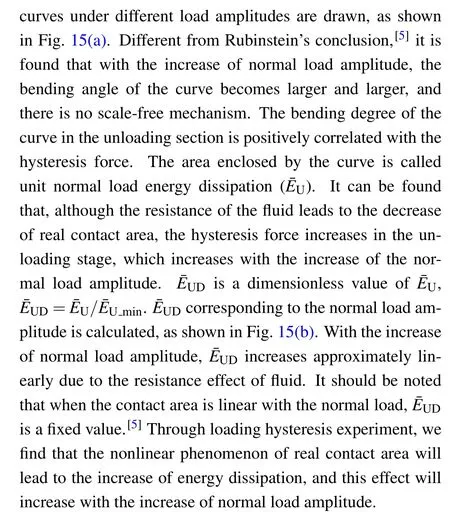
The initial state of the experiment is interface separation. The loading and unloading experiments are carried out with the peak to peak values of 6.3 MPa, 5.0 MPa, 3.7 MPa,2.5 MPa and 1.23 MPa, respectively, as shown in Fig. 14(a).In order to reduce the influence of “aging”, the interval between cycles is 15 s. This experiment is called the loading hysteresis experiment. The experiment is repeated three times under the same working conditions. In the whole experiment,the error of real contact area at the maximum normal load is less than 2.0%,and in the single experiment,the error of real contact area at the minimum normal load is less than 0.5%,showing good repeatability. Figure 14(b)shows that,although the shape of the curve changes with the normal load amplitude,the real contact area always increases with the same curve during loading, showing a good memory. It is verified that the memory effect of real contact area is not affected by the fluid between the contact interface. Under the same normal load,real contact area under unloading is obviously larger than that under loading, showing the obvious hysteresis phenomenon,which may be caused by viscous force or creep force. In this paper, the force causing hysteresis is referred to as hysteresis force.During the whole loading and unloading process,due to the existence of hysteresis force,the relationship between real contact area and normal load forms a closed curve, and the closed area of the closed curve is called energy dissipation.

Fig. 15. Energy dissipation of loading hysteresis experiment. (a) ˉAC versus ˉFN,(b) ˉEUD versus normal load amplitude.
4.2. Unloading hysteresis experiment
The initial state of the experiment is loading at 6.3 MPa.The experiments are carried out with the peak to peak values of 1.4 MPa, 2.8 MPa, 4 MPa and 5.3 MPa respectively, and finally unloaded to 0 MPa. In order to reduce the effect of aging, each cycle pauses 15 s, as shown in Fig. 16(a). This experiment is called unloading hysteresis experiment. The experiment is repeated three times under the same working conditions. The error of real contact area at the maximum normal load is less than 2.4%in three experiments,and less than 1.2%under the maximum normal load in a single experiment, the experiment shows good repeatability. It should be noted that the error in the unloading hysteresis experiment is larger than that in loading hysteresis experiment due to the aging effect.[5]
Figure 16(b)shows that,contrary to the loading hysteresis experiment, the real contact area of the unloading hysteresis experiment always decreases along a curve when unloading,which also shows good memory. In order to compare the influence of normal load amplitude on energy dissipation, the normal load amplitude and real contact area of each cycle are both dimensionless.

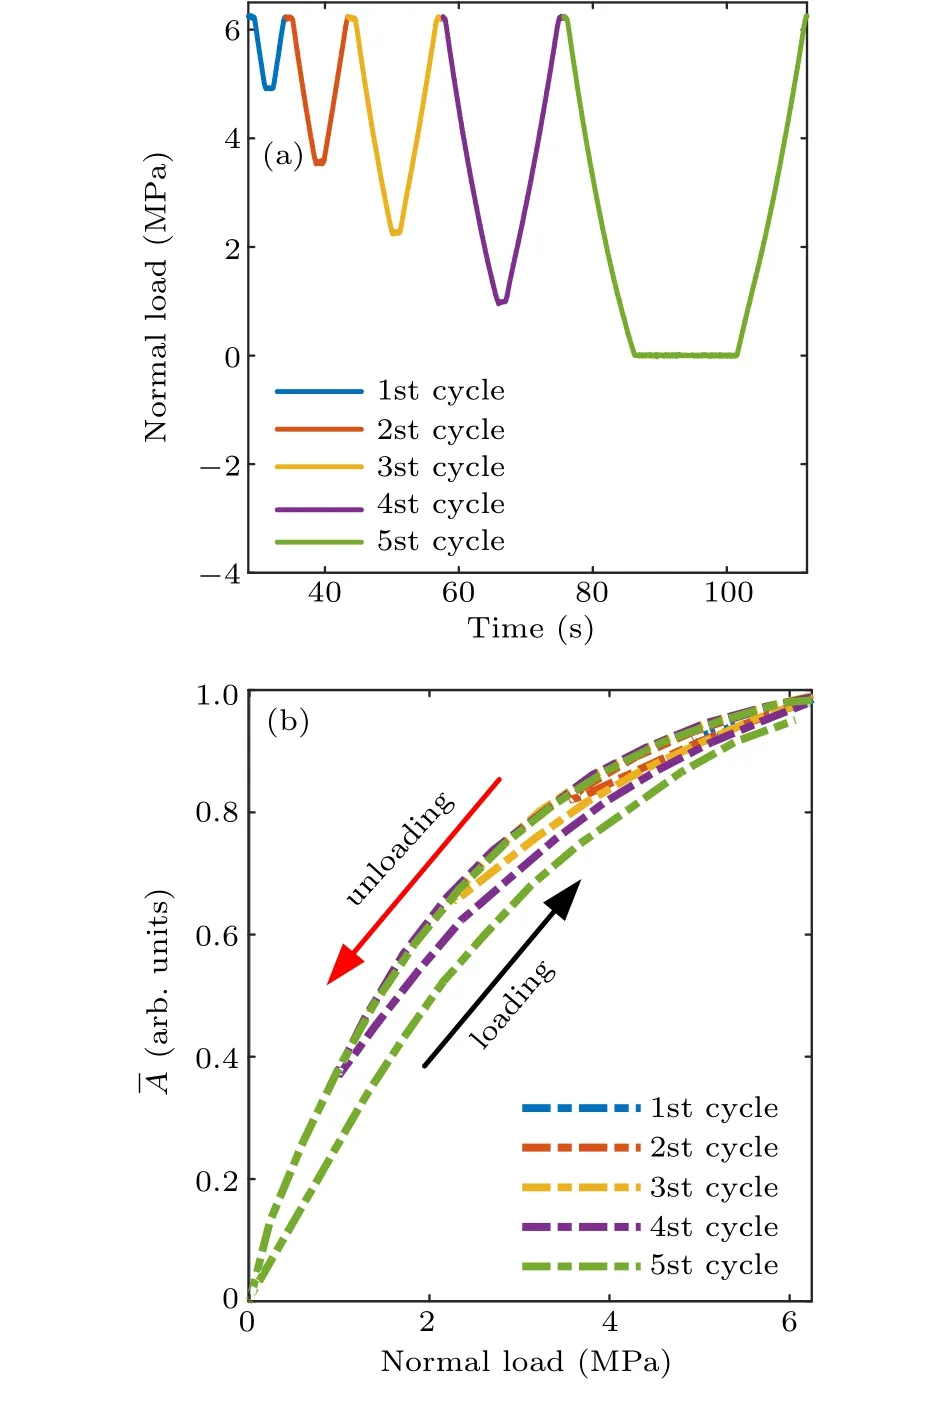
Fig. 16. Unloading hysteresis experiment. (a) Loading mode. (b) ˉA versus normal load.
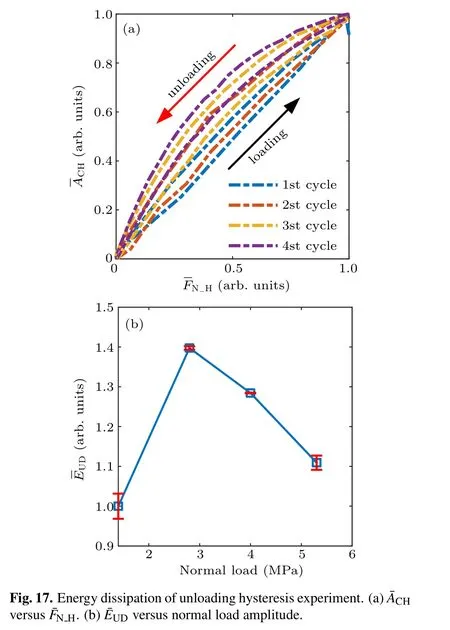
In Fig. 17(a), the bending angle of the curves increases with the increase of normal load amplitude. This shows that,although the initial contact changes,the hysteresis force also increases with the increase of the normal load amplitude. Calculateat different normal load amplitudes as shown in Fig. 17(b). Different from the loading hysteretic experiment,in the unloading experiment,the energy dispersion is no longer linearly related to the normal load amplitude, but increases first and then decreases with the increase of the normal load amplitude. We speculate that this may be due to the interaction of aging,deaging and fluid between contact interface,but more experiments are needed to verify it. The initial contact states of the unloading hysteresis experiment and loading hysteresis experiment are different, and the energy dissipation is also not the same. This shows that the energy dissipation is not only related to the normal load amplitude, but also to the initial contact state after considering the influence of the fluid between contact interface.
5. Conclusion
In view of the complex and varied micro-contact behaviors existing in large-scale interface contact,an image processing method(WSM+CSI)is proposed in this paper,which can realize the quantitative analysis of micro contact behaviors in large-scale interface. Based on this method, a bridge is built from macro contact to micro contact. The spatiotemporal evolution mechanism of nonlinear phenomenon of real contact area is analyzed, and the influence of nonlinear phenomenon in the whole loading and unloading process is verified by experiments. The main conclusions are as follows:
(1) WSM can identify the micro contact spots in largescale contact. CSI can be used to identify the micro contact behavior in large-scale contact. Through the colors and their relationship, the visual recognition of various micro contact behaviors can be realized,which simplifies the analysis of micro contact behavior in large-scale contact area. This method uses color and their relationship to represent the various micro contact behaviors. By calculating the number of different color pixels, the micro contact behavior in the macro contact phenomenon can be quantitatively analyzed, such as the behavior characteristics of micro-slip,stick-slip and macro-slip,and the nonlinear characteristics of contact stiffness and friction coefficient,etc.
(2)The fluid between contact interfaces is one of the important factors that cause the nonlinear phenomenon of contact area. It may lead to the decrease of real contact area,the increase of local stress, the increase of surface wear rate and energy dissipation. It is found that the effects of fluid,normal load amplitude and initial contact state cannot be ignored for the large-scale interface contact with small rough surfaces.
The research on the spatiotemporal evolution of real contact area is of great significance for the mechanism of contact behavior. We will analyze the influence of tangential load on real contact area, and further explain the rich and universal behavior of contact dynamics in the near future.
猜你喜歡
Chinese Physics B(2022年10期)2022-10-26 09:53:46
Chinese Physics B(2022年8期)2022-08-31 09:58:44
Chinese Physics B(2022年3期)2022-03-12 07:44:30
Chinese Physics B(2019年10期)2019-11-06 00:44:46
作文評點報·低幼版(2019年5期)2019-02-18 01:24:56
婦女生活(2015年5期)2015-09-10 07:22:44
四川黨的建設(shè)(2014年8期)2014-04-16 05:58:30
軍事歷史(2002年3期)2002-08-21 02:07:38
軍事歷史(1993年3期)1993-08-21 06:16:06
軍事歷史(1991年6期)1991-08-16 02:22:04

- Chinese Physics B的其它文章
- Process modeling gas atomization of close-coupled ring-hole nozzle for 316L stainless steel powder production*
- A 532 nm molecular iodine optical frequency standard based on modulation transfer spectroscopy*
- High-throughput identification of one-dimensional atomic wires and first principles calculations of their electronic states*
- Effect of tellurium(Te4+)irradiation on microstructure and associated irradiation-induced hardening*
- Effect of helium concentration on irradiation damage of Fe-ion irradiated SIMP steel at 300 °C and 450 °C*
- Optical spectroscopy study of damage evolution in 6H-SiC by H+2 implantation*