
Measurement of time-varying electron density of the plasma generated from a small-size cylindrical RDX explosion by Rayleigh microwave scattering
2021-04-22 05:34:20HongCHEN陳鴻XuchaoPAN潘緒超YongHE何勇JunjieJIAO焦俊杰JieSHEN沈杰andChiBEN賁馳
Plasma Science and Technology 2021年4期
Hong CHEN(陳鴻),Xuchao PAN(潘緒超),Yong HE(何勇),3,Junjie JIAO(焦俊杰),Jie SHEN(沈杰) and Chi BEN(賁馳)
1 School of Mechanical Engineering,Nanjing University of Science and Technology,Nanjing 210094,People’s Republic of China
2 China North Industries Group Corporation,Beijing 100053,People’s Republic of China
3 Author to whom any correspondence should be addressed.
Abstract It is challenging to measure the electron density of the unsteady plasma formed by charged particles generated from explosions in the air,because it is transient and on a microsecond time scale.In this study,the time-varying electron density of the plasma generated from a small cylindrical cyclotrimethylenetrinitramine(RDX)explosion in air was measured,based on the principle of microwave Rayleigh scattering.It was found that the evolution of the electron density is related to the diffusion of the detonation products.The application of the Rayleigh microwave scattering principle is an attempt to estimate the electron density in explosively generated plasma.Using the equivalent radius and length of the detonation products in the bright areas of images taken by a high-speed framing camera,the electron density was determined to be of the order of 1020 m?3.The delay time between the initiation time and the start of variation in the electron-density curve was 2.77-6.93 μs.In the time-varying Rayleigh microwave scattering signal curve of the explosively generated plasma,the electron density had two fluctuation processes.The durations of the first stage and the second stage were 11.32 μs and 19.20 μs,respectively.Both fluctuation processes increased rapidly to a peak value and then rapidly attenuated with time.This revealed the movement characteristics of the charged particles during the explosion.
Keywords:Rayleigh microwave scattering,explosive,explosively generated plasma,electron density measurement
1.Introduction
A large number of charged particles are generated from a condensed explosive,which form a certain volume of weakly ionized non-ideal plasma[1,2].This plasma is transient and time-varying and is called an explosively generated plasma[3-6].This is an important object for studying the thermodynamic and electromagnetic effects from explosions.Tasker et al equated the detonation product diffusion process to the plasma diffusion process and studied the effect of applied electric field and magnetic field on the detonation performance of explosives[7].In studies about the conductivity of detonation products from single-compound explosives[8]and explosive-metal additive mixtures[9],the charged particles generated from the explosion are usually equivalent to the unsteady plasma.Ershov et al pointed out the possibility of the application of low-temperature non-ideal plasmas from explosions in the field of electromagnetic energy[10,11].In addition,the plasma was treated as a radiation source in research about the electromagnetic radiation effect generated from the explosion[12,13].Tasker et al explored the applications of explosively generated plasma in the field of engineering[14-16].In this research,the plasma generated from the end face of a small explosive confined by a guide tube is usually taken as the research object[3-7].The macroscopic size,spectral characteristics,and peak electron density of the explosively generated plasma have been studied using optical instruments[6,7]and a charge-probe[3].The existence of explosively generated plasma has been confirmed,but because of limitations in measurement methods,there have been few reports on the temporal evolution of the electron density in explosively generated plasma.
With the development of measurement technology,Shneider et al reported the use of a Rayleigh microwave scattering method for studying the parameters and temporal evolution of the electron density of small-scale plasma[17-19].This measurement method uses a microwave Rayleigh scattering signal from the plasma and images taken by a high-speed framing camera to determine the time-varying electron density[20].The method has been applied to temporally resolved measurements of laser-induced avalanche ionization in air and resonance-enhanced multiphoton ionization in argon[20-22].It is suitable for non-contact examination of small-scale plasma and can effectively obtain the complete characteristics of a plasma in the time domain.The Rayleigh microwave scattering method provides a novel and vital way to examine the plasma generated from small explosives,and it can be used to obtain the time-varying electron density of explosively generated plasma,which is an important expansion of the application fields of this technique.
In this work,the characteristics of the electron density and its time-domain variation in the plasma generated from a small cylindrical cyclotrimethylenetrinitramine(RDX)explosion were experimentally studied using the Rayleigh microwave scattering method.The order of electron density and the time-domain variation characteristics of explosively generated plasma are discussed,along with the plasma-generation mechanism.
2.Experimental principle and setup
2.1.Experimental principle
The Rayleigh microwave scattering method can be used to measure the total number of electrons in a plasma jet by examining the scattered microwave signal from the incident microwave-induced polarization plasma jet received through a horn antenna[17,18].When the size(L)of the explosively generated plasma generated from the cylindrical explosive is much smaller than the microwave wavelength λ(L?λ),the total scattering signal of the plasma column can be measured using this system.Then,the total number of electrons in the plasma column can be obtained by analyzing the scattering signal of the linearly polarized microwave radiation in the plasma column[18].
At a distance R(R?λ)from the center of the explosively generated plasma,the plasma can be regarded as a dipole radiation source induced by the incident microwaves.That is,the received microwave scattering signal measured by the system comes from the radiation signal generated by the dipole changes in the plasma induced by the incident microwaves.The intensity of the scattering signal is therefore proportional to the electron density in the plasma.According to this principle of microwave scattering,the relationship between the measured signal and the conductivity of the plasma can be expressed by[20-22]

where the system constant A is one of the specific properties of the microwave test system,which can be calibrated by dielectric scatterers with known properties and has the unit V·Ω·m?2[20-22];σ is the conductivity of the plasma;V is the volume;ε0is the dielectric constant of a vacuum;ε is the dielectric permittivity of the scatterer material; and ω is the angular frequency of the microwave radiation.

where e is the single-electron charge;neis the plasma density;meis the mass of an electron; andγenis the collision frequency between plasma electrons and neutral particles,which can be expressed as[22-25]

where r is the gas molecular radius;P is the gas pressure;andTeis the electron temperature.At low temperature(Te<10 eV)and with a weakly ionized plasma,most of the momentum and energy transport of the electrons are caused by elastic collisions between electrons and neutral atoms[24,25].Considering the complexity of the components of detonation products,equation(3)is used to estimate the collision frequency of particles in explosively generated plasma.Thus,the collision frequencyγenbetween electrons and neutral atoms is used as the input condition in equation(2).The electron density of the plasma can then be written as

2.2.Experimental setup
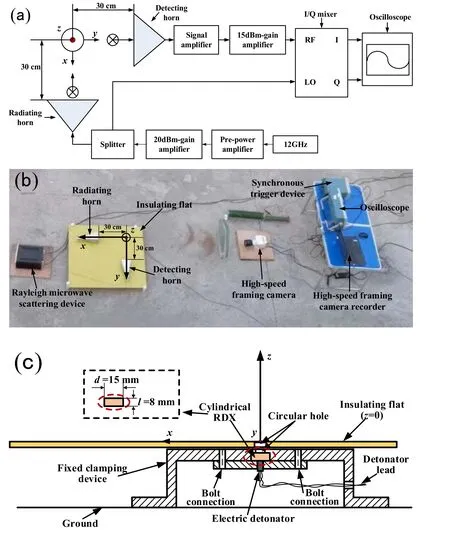
Figure 1.(a)Schematic of the Rayleigh microwave scattering device;(b)a photograph of the layout of the experimental apparatus; and(c)schematic of the cylindrical RDX and the fixed clamping device.
In the experimental system,explosively generated plasma is ejected from the end face of a small-size cylindrical RDX explosion,and the time-varying electron density is measured using a Rayleigh microwave scattering device.A schematic of the Rayleigh microwave scattering device is shown in figure 1(a),a photograph of the experimental setup is shown in figure 1(b),and a schematic of the cylindrical RDX and the fixed clamping device is shown in figure 1(c).A 12 GHz signal is generated by the microwave source,pre-amplified,and then further amplified by 20 dB m.The amplified signal is then passed through a splitter and output to the radiating antenna and the LO interface of an I/Q mixer.The measured plasma is placed between the radiating and detecting horn antennas,and Rayleigh scattering occurs when the incident beam from the radiating horn antenna irradiates the plasma.The detecting horn antenna receives the scattering signals and is connected to the radiofrequency(RF)interface of the I/Q mixer through a low-noise signal amplifier and a 15 dB m gain amplifier.The amplifiers and the mixer used in the experiment are operated in linear mode for the entire range of scattered signals.Finally,two quadrature time-varying voltage signalsUIandUQfrom the I/Q mixer are acquired by an oscilloscope,and the total scattering voltage is then determined as.

Figure 2.(a)Schematic of timing of the ignition and recording equipment;(b)output signal of the capacitive discharge unit and trigger signal; and(c)delay time between the output signal of the capacitive discharge unit and the trigger signal.
According to the measurement principle,the microwave radiation is linearly polarized along the z-axis in this experiment(see figure 1(a)),which is the injection direction of the plasma jet.The effective measurement range of the device is 0-50 mm[20-22].The plane corresponding to z=0 mm is the horizontal plane at which the antennas are located.The plate does not move significantly within 100 μs after the detonation of the explosive[1],and the explosion does not affect the position relationship between the antennas and the measured area within the test time period.As shown in figures 1(b)and(c),the horizontal plane is the upper surface of the insulating plate.The minimum measurement resolution ratio of the electron density of the system is 1018m?3[20-22].
As shown in figure 1(b),the experimental apparatus included the Rayleigh microwave scattering device,a highspeed camera(Phantom VEO 410L,Vision Research,Inc.,USA)for volume measurements,and a synchronous trigger device.The Rayleigh microwave scattering device included the microwave source,amplifier,I/Q mixer,two horn antennas,and an oscilloscope(MDO4104C,Tektronix,Inc.,USA).The sampling rate of the oscilloscope was 2.5 GS s?1.Optical images of the explosively generated plasma were taken by the high-speed framing camera with an exposure time of 1.8 μs,an exposure interval of 4.16 μs,a sampling rate of 240 000 fps,and a resolution of 128×64 pixels.The components of the measurement device were connected using RF coaxial cables.As shown in figure 1(c),these experiments used a fixed clamping device with an 8 mm long cylindrical cavity with a 15 mm inner diameter.One end of the cylindrical cavity was connected to the detonator base and the other end had a 5 mm diameter circular hole.The RDX was pressed into a cylinder with a density of 1.63 g cm?3,measuring 15 mm in diameter and 8 mm in length,and this was placed into the cylindrical cavity.One end of the bare explosive was connected to a detonator and the other end was attached to the circular hole.The explosively generated plasma ejected from the circular hole into the measurement region was the research object in this paper[3-7].All explosives were fired by electric detonators that were initiated by a capacitive discharge unit(FD100,Yingkou Feiya Technology Co.,Ltd,China).
For the high-speed framing camera recorder and the oscilloscope to start recording data at the same time,the output signal of the capacitive discharge unit was used to be a synchronous trigger signal for the measurement system.Figure 2(a)shows the schematic of timing of the ignition and recording equipment.The synchronous trigger device was triggered by the output pulse signal of the capacitive discharge unit attenuated by the high-voltage probe(Tektronix P6015A,1000:1),and the oscilloscope and the recorder of the high-speed framing camera were triggered by the synchronous trigger device.As shown in figure 2(a),the response time to the high-voltage probe ΔT1≤4 ns,and the response time to the synchronous trigger device ΔT2≤10 ns.The delay time of the RF coaxial lines with the measurement system is ΔT3.Then,the delay time between the output signal of the capacitive discharge unit and the trigger time of the oscilloscope and high-speed photography is ΔT.Before the experiment,the output signal of the capacitive discharge unit and the trigger signal were measured,as shown in figures 2(b)and(c).The output signal of the capacitive discharge unit had an obvious oscillation.The delay time ΔT between the output signal of the capacitive discharge and the trigger time of the synchronous device was approximately 0.05 μs.When the state of the measurement system remained unchanged,the delay time was consistent.For facilitating the statistics of the data in the experiment,time t=0 μs in the data records was defined as the initiation of the pulse of the capacitive discharge unit.However,as shown in figure 2(a),to prevent the Rayleigh microwave scattering signal from arriving in advance,a pre-trigger delay time of 10 μs was set in the data acquisition process.Moreover,a pre-trigger delay time of 10 ms was set in the high-speed framing camera recorder.
3.Results and discussion
3.1.Calibration of Rayleigh microwave scattering system and results
Before measuring the scattering signal from the explosively generated plasma,the system constant A of the Rayleigh microwave scattering system was calibrated.From equation(1),for the dielectric,the output voltage U of the measurement is related to the characteristics of dielectric scatterers with known physical properties[17-20].Ten quartz crystal rods with lengths of 5-50 mm at 5 mm intervals,diameters of 3.8 mm,and a dielectric constant ε of 3.8 were used as calibrators.The radiating and detecting antennas were placed in the same plane and perpendicular to each other(as shown in figure 1),as this condition provided the best observation position[18].The distance between the end face of each antenna and the center of the measured plasma was 30 cm(as shown in figure 1).The system constantwhere ε0=8.85×10?12F m?1,ε=3.8,ω=7.54×10¹⁰rad s?1,and V is the volume of a quartz rod,was determined from equation(1)using the measured value of U,the known value of ε,and the volume of each calibrator V.
During the static calibration experiment,the quartz rods were placed in the center of the microwave beam along the direction of the microwave electric field,and then the output voltagesUI,UQandfrom the I/Q mixer with and without the quartz rod,respectively,were recorded.According toand the measured voltage values from each of the ten quartz dielectric scattering signals,the total output voltage values were calculated.The results of these calculations are shown in figure 3.The ten total output voltage values were then fitted to a straight line by applying a least-squares method,such as line ①shown in the figure(the vertical axis is the voltage U,in mV,and the horizontal axis is the length l of the quartz rod,in mm).Since all the quartz dielectric rods could not be in the center of the measurement region in the experiment,line ①shown in figure 3 fails to pass through the coordinate origin.Therefore,when calculating the system constant A,line ①was translated to the coordinate origin to obtain line ②,as shown in figure 3.Then,the system constant A was determined using the equation given above,with the voltage U=23.11 mV being taken at l=25 mm on line ②.This calculation produced a value for the system constant A of 7.00×10⁴V Ω m?2.
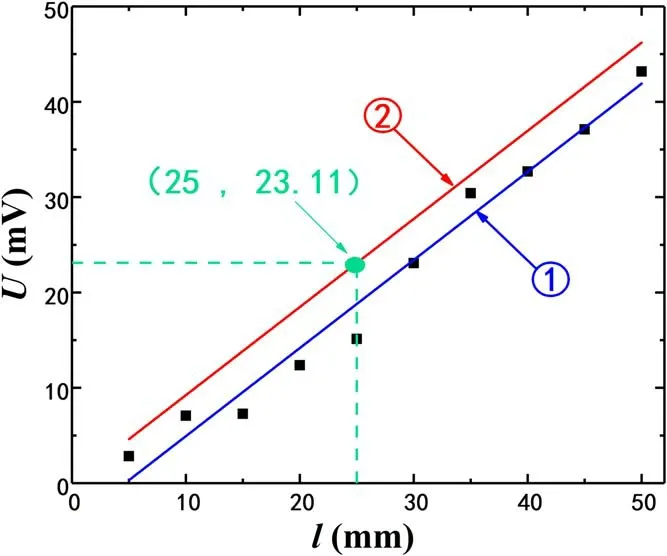
Figure 3.Calibration of the system constant A of the Rayleigh microwave scattering system.
In this experiment,the method for the calibration of the system constant A was by means of fitting the total scattering signals from a certain number of dielectric rods.This method has higher stability and can significantly improve the calibration accuracy of the system constant A when compared with the calibration method of ejecting dielectric bullets adopted by Shashurin et al[20].According to this principle,the system constant A is determined by the geometric positions of the scatterers and the antennas[20,21].The geometric positions of the antennas and the measured plasma were therefore the same in each experiment.The measurement of the time-varying electron density of the explosively generated plasma from the small-size cylindrical RDX was repeated five times.The calibrated value of the system constant A obtained before these measurements was consistent within an error range of 3.5%,which demonstrated the stability of the measurement system.

Figure 4.(a)Typical time-varying Rayleigh microwave scattering signal from the explosively generated plasma ejected from the end of the small-size cylindrical RDX explosion; and(b)discharge interference from the capacitive discharge unit.
The calibrated system was applied to measurement of the Rayleigh microwave scattering signals from the explosively generated plasma.As noted,the plasma was generated by injection from the end of a small-size cylindrical RDX explosion in air,and the direction of the plasma jet was along the axial direction of the cylindrical calibrator(the z-axis).A typical plot of the time-varying Rayleigh microwave scattering signal is presented in figure 4(a).In this figure,the voltage curves of the I and Q channels have been subtracted from the corresponding amplitudes at the initial horizontal stage.As shown in figure 4(a),U(t)is the total output voltage of the Rayleigh scattering system calculated from the formulais the output voltage of the I channel andUQ(t)is the output voltage of the Q channel.The electric detonator is initiated by the capacitive discharge unit at t=0 μs,and at this moment the measurement system clearly experiences interference from the discharge.This was a discharge interference signal in the circuit of the experimental equipment,and the discharge interference signal shown in figure 4(b)was caused by the discharge signal from the capacitive discharge unit coupled to the oscilloscope through the circuit.As shown in fgiure 4(b),the duration of this discharge interference was within 5 μs.After this,theUI(t)andUQ(t)signals remained unchanged at 0 mV and were basically coincident.Then,at t1=34.25 μs,a certain amount of explosively generated plasma was injected into the measurement area,and both theUI(t)andUQ(t)signals started to change over time.It can be seen in fgiure 4(a)that the voltageUI(t)on the I channel rises rapidly from 0 mV at t1to a peak value of 23.02 mV at 38.80 μs.Simultaneously,the voltageUQ(t)on the Q channel decreases rapidly from 0 mV to?18.85 mV,and the time of the negative peak value is 36.98 μs.With the decay of the explosively generated plasma,the scattered signal gradually weakens.The voltageUI(t)on the I channel decreases from the peak value to 0 mV,and the voltageUQ(t)on the Q channel increases to 5.62 mV and then decreases with time.Then,because of the movement of the subsequent detonation products,another obvious fluctuation of the Rayleigh microwave scattering signal appears in the region to be measured.As shown in fgiure 4(a),the voltageUI(t)on the I channel rapidly rises again to 20.72 mV,drops to?10.20 mV,and then fnially rises to the falt stage at 65.25 μs.Meanwhile,the voltageUQ(t)on the Q channel gradually decreases to?9.63 mV and finally rises rapidly to the flat stage.After 65.25 μs,the scattered signals in the measured region change insignificantly,and the voltages on the two channels and the total voltageU(t)remain approximately constant.
All time-varying Rayleigh microwave scattering signal waveforms of five groups of repeated experiments are shown in figure 5.The waveform shown in figure 5(a)is the typical timevarying Rayleigh microwave scattering signal shown in figure 4(a).As shown in figure 5,the Rayleigh microwave scattering process of the explosively generated plasma can be described as follows.The two horn antennas are placed at 90°,and at the beginning of the experiment,no scattered signals are received by the detecting antenna when there is no plasma jet passing through the incident beam.When the explosive is detonated,the scattered signals from the initial explosively generated plasma that is ejected from the end face of the explosive are received by the detecting antenna.The duration(Δt1)of the signals from this first stage is in the range of 10.71-12.16 μs,as shown in figure 5.With the diffusion of the detonation products,the detecting antenna again receives scattered signals from the explosively generated plasma from the detonation reaction area.The duration(Δt2)of the signals from the second stage is in the range of 17.21-21.85 μs.Finally,the Rayleigh microwave scattering signals become flat.As can be seen in figure 5,the waveforms of the Rayleigh scattering signal in the period of 0-70 μs have two obvious wave processes.The statistical results can be obtained by using the random error analysis method of repeated measurement data,and the confidence probability is taken as 0.9973.The statistical results of five repeated experiments are shown in table 1.The mean value of the start time of the Rayleigh microwave scattering signal
t1=33.04 μs,the standard deviation is 1.13 μs,and the random error is 10.3%.The mean value of the duration of the signals from first stage Δt1=11.32 μs,the standard deviation is 0.58
μs,and the random error is 15.3%.The peak value of the Rayleigh microwave scattering signal in the first stage is 27.84 mV,the standard deviation is 2.45 mV,and the random error is 26.4%.Since the chemical explosion is transient and difficult to reproduce,in this experimental research,it can be considered that the duration of the first-stage waveform and its peak values of five repeated experiments are relatively consistent.The mean value of the duration of the signals from second stage Δt2=19.20 μs,the standard deviation is 1.99 μs,and the random error is 29.68%.The peak value of the Rayleigh microwave scattering signal in the second stage is 17.87 mV,the standard deviation is 3.09 mV,and the random error is 51.8%.The second-stage waveform,however,has poor repeatability and obvious oscillation.The duration of the second-stage waveform is about twice that of the first-stage waveform.
3.2.Optical images of the explosively generated plasma
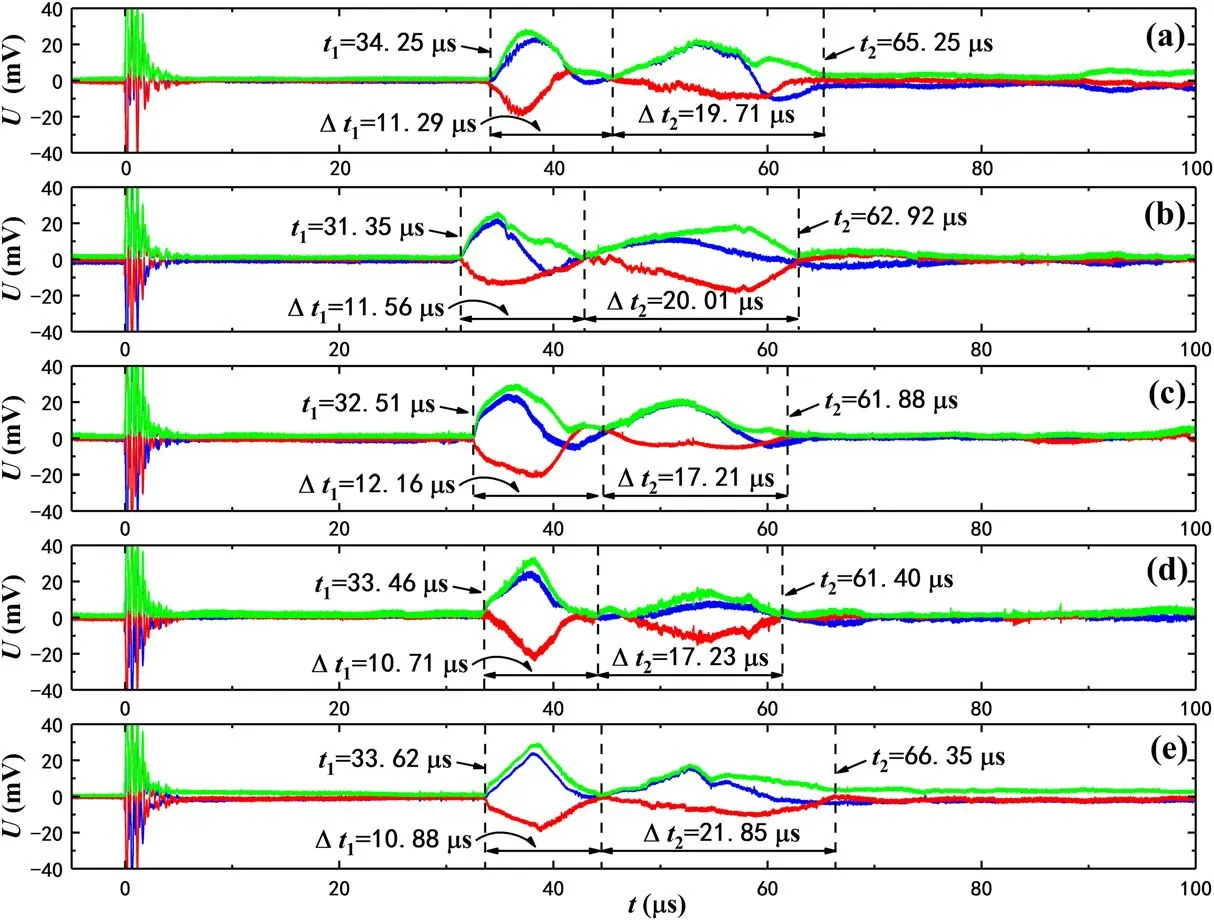
Figure 5.(a)-(e)Time-varying Rayleigh microwave scattering signal waveforms of five groups of repeated experiments.
Figure 6 shows optical images of the explosion process and a standard nylon cylinder for size calibration taken by the highspeed framing camera.The exposure time was 1.8 μs and the interval time was 4.16 μs.The images of the diffusion process in figure 6 and the measurement results shown in figure 4(a)were obtained in the same experiment.The Rayleigh microwave scattering system and the high-speed framing camera recorded data at the same time using the synchronous trigger device.Thus,the time of each image shown in figure 6 corresponds with the x-axis in figure 4(a).The development of the explosively generated plasma within 65.02 μs after initiation of the explosion was clearly recorded,and the bright parts of the images changed obviously with time.Hence,the geometry and size of the explosively generated plasma at different times could be obtained by observing and measuring the development process in these images[3-7].
Figure 6(a)shows a standard nylon cylinder for a sizecalibration image before the measurement experiment,and figures 6(b)-(j)show optical images of the explosion process.Figure 6(b)is the first bright image taken by the high-speed framing camera after detonating the explosive,at 31.66 μs.Prior to this,no obvious bright parts appeared in the images.According to the interval time,the first light from the explosion appeared within the time period of 27.50-31.66 μs,as shown in figure 6(b).For the five repeated experiments,the mean values of the time period are 26.11-30.27 μs,and according to the random error analysis method of repeated measurement data,the standard deviation is 1.07 μs,and when the confidence probability is 0.9973,the random error is in the range of 10.6%-12.3%.During this time range,it can be considered that the electric detonator has detonated the explosive[1,2].Considering the total scattering voltage curve shown in figure 4(a),it can be seen that the Rayleigh microwave scattering signal begins to appear at t1=34.25 μs.This moment is between the time of figures 6(b)and(c),that is,31.66-35.82 μs.This indicates that explosively generated plasma with an electron density of the order 10?18m?3,which is the threshold that can be clearly measured by the Rayleigh microwave scattering system,was not formed before 34.25 μs,despite the image shown in figure 6(b),which corresponds to the time period of 27.50-31.66 μs,showing a distinct bright area.The brightness in figure 6(b)is obviously lower than those in the other images,and this could explain why the electron density is low at this point.Figure 6(c)shows a distinct bright region within the effective measured height range of the Rayleigh microwave scattering system.Starting from figure 6(d),a distinct dark area appears at the bottom of the images,and this dark area increases in size as time goes on.It can be seen in figures 6(i)and(j)that there are no obvious bright areas at the bottom of the images,and the bright parts are basically concentrated in the ‘wedgeshaped’ area[4-6]at the head.
Considering the irregular shape of the explosively generated plasma,to facilitate calculation,the equivalent volume was obtained by finding a cylinder with a similar shape and volume to the plasma.Before the experiment,a standard cylinder with a length of 100 mm was used to calibrate thedimensions of the images,as shown in figure 6(a).The plane where the antenna is located also can be clearly seen in figure 6(c).In addition,there was no obvious displacement of the plane during the test period,which indicates that the geometric position of the antenna on the plane did not change.When calculating the volume parameters of the explosively generated plasma[3-5],the size of the bright area in each image was measured based on this plane[20,21].According to the calibration scale shown in figure 6(a),the diameter and length of the equivalent cylinder in the bright area in figure 6(c)are 28.16 mm and 26.88 mm,respectively,those in figure 6(d)are 29.44 mm and 42.24 mm,respectively,and those in figure 6(e)are 32.08 mm and 50.00 mm,respectively.From figures 6(f)to(j),the corresponding bright parts of the image have obviously exceeded the effective test height range of the system.Therefore,only the volume corresponding to the effective test range was considered when the volume parameters were used to calculate the electron concentration combining the Rayleigh microwave scattering signal curve.For convenience of calculation,the equivalent diameter and length of figures 6(f)to(j)were taken as 32.08 mm and 50.00 mm,respectively.Considering the matching Rayleigh scattering signal shown in figure 4(a),the curve of the equivalent diameter and length changing with time shown in figure 7 was obtained by polynomial interpolation fitting based on the data from optical images of the explosively generated plasma.As noted,figures 4(a),6 and 7 show timesynchronized results taken in the same experiment.According to the principles outlined earlier,the electron density is mainly related to the system constant A,the total scattering voltage of the plasma,and the equivalent volume of plasma at the corresponding time.Therefore,combining the known data,the time-varying electron density of the explosively generated plasma from the small cylindrical RDX explosion can be calculated.

Table 1.Statistical results of five repeated experiments.
3.3.Calculation of the time-varying electron density
According to the RDX detonation reaction equation C3H6O6N6→3H2O+3CO+3N2,the main components of the RDX detonation product gas are H2O,CO,and N2[26,27].Using the collision frequency of electrons and neutral molecules of the detonation products as input parameters,the collision radius of the RDX detonation product gas is 1.91×10?10m[25,28].The gas pressure of the detonation products is 0.07-0.09 GPa in air[3,6,7].The temperature of the detonation products is 3000-7000 K,and the corresponding electron temperature is 0.26-0.6 eV[6,7,14].For convenience of analysis and estimation of the electron concentration level of the explosively generated plasma,the smaller values were selected as the calculation parameters.The gas pressure value 0.07 GPa and the electron temperature 0.26 eV were taken for the calculations.The collision frequencyγen=7.52×10¹⁴Hz was then determined using equation(3)[22-25].The time-varying electron densityneof the measured explosively generated plasma was then determined from equation(4),where U is the total scattering voltage shown in figure 4(a)and V is the equivalent volume corresponding to the optical images of the explosively generated plasma shown in figure 6.
Firstly,without considering the volume parameters,a time-varying curve of the number of electrons in the explosively generated plasma is shown in figure 8.There are two obvious fluctuations in this curve.The waveform in figure 8 is similar to the waveform of the total voltageU(t)in figure 4(a),which indicates that the number of electrons is positively correlated with the total scattered voltage[18-20].This shows that the Rayleigh microwave scattering system is effective for observing the evolution of the electron density in the time domain.
The time-varying electron density of the explosively generated plasma was calculated,and this is discussed in two stages according to the effective measurement range of the Rayleigh microwave scattering system and the images taken by high-speed framing camera.Figure 9 shows the timevarying electron density of the explosively generated plasma at different equivalent volumes within the time period of 34.25-44.16 μs.The optical images of the plasma in this period were measured in the linear range of the microwave Rayleigh scattering system[20-22].As can be seen from figure 9,no obvious scattered signal was detected before 34.25 μs,but a clear bright area first appears in figure 6(b),at 31.66 μs from the time of the explosive initiation.This indicates that the electron density of the plasma in the initial stage of the explosion was lower than the order of 1018m?3and did not reach the lowest threshold that the measurement system can distinguish.This phenomenon existed in all of the five repeated experiments,and there was a significant delay between the explosive initiation and the occurrence of scattered signals from the explosively generated plasma.In this study,the time from the explosive initiation to the formation of a plasma with an electron density of 1018m?3is defined as the delay time.The time period 27.50-31.66 μs,corresponding to the period between the first bright image taken by the high-speed framing camera and the previous dark frame,can be regarded as the explosive initiation time[4,5].The start time of the total scattering voltage curve is 34.25 μs.The delay time can then be calculated as 2.59-6.75 μs,which is greater than the detonation reaction time(about 1 μs)[1,26,27]of the small-size cylindrical RDX explosive used in the experiments.In the five repeated experiments,the mean value of the delay time is 2.77-6.93 μs,and the random error is in the range of 10.6%-12.3%.This indicates that after the explosive detonation,the explosively generated plasma with an electron density of at least 1018m?3needs a certain period of time,and this time is greater than the explosive reaction time.This delay time may be related to the delay time of the electromagnetic radiation signal produced by the explosion[12].

Figure 6.Optical images showing(a)a standard nylon cylinder for size calibration,and(b)-(j)the explosion process.
Figure 9(a)shows the results from calculation of the time-varying electron density of the explosively generated plasma when the equivalent volume remains unchanged with time.Here,the equivalent volume of the explosively generated plasma is a cylinder with a diameter of 32.08 mm and a length of 50 mm.As shown in this panel,before 34.25 μs,there is no obvious scattering signal.After this,an explosively generated plasma of a certain order is formed in the measurement area,and the electron density increases to a peak of about 2.62×10²⁰m?3at 37.72 μs,and the duration of this rise is 3.47 μs.Then,the electron density begins to decay,and this decay stage lasts for 7.82 μs.Figure 9(b)shows the calculation results of the time-varying electron density of the explosively generated plasma when the equivalent volume changes with time.In the calculation process,the equivalent diameterd(t)and lengthl(t)from figure 7 and the total Rayleigh microwave scattering voltageU(t)in the corresponding periods were substituted into equation(4).From the calculation results shown in figure 9(b),the variation trend of the electron density is the same as that shown in figure 9(a).The electron density reaches its peak value of 4.95×10²⁰m?3at 37.72 μs.Although this peak time is the same as the result shown in figure 9(a),the peak value is larger.The equivalent volume corresponding to the calculation results shown in figure 9(a)is the maximum of the explosive plasma within 34.25-44.16 μs,so the peak value is smaller than that corresponding to the time-varying equivalent volume shown in figure 9(b).By comparing the calculation results in figures 9(a)and(b),it can be found that the volume parameters of the explosively generated plasma have a certain influence on the results of the electron density calculation,but the influence range is not more than one order of magnitude.The peak electron density of the plasma during the time period of 34.25-44.16 μs after the explosive initiation is in the order of 1020m?3.

Figure 7.Equivalent diameter d (t)and length l (t)of explosively generated plasma.
Figure 10 shows the time-varying electron density of the explosively generated plasma within the period of 44.16-100 μs.During this time,a part of the bright areas of the corresponding optical images have obviously exceeded the effective measurement range of the Rayleigh microwave scattering system.Therefore,in the calculation of electron density,the equivalent volume was taken as a fixed value,with a diameter of 32.08 mm and a length of 50.00 mm.From the calculation results shown in figure 8,the electron density of the explosively generated plasma rises at 44.16 μs and reaches a peak value of 2.05×10²⁰m?3at 53.56 μs.Then,there is a sudden change at 58.75 μs during the descending process.Finally,the electron density decreases to near 0 m?3at 65.25 μs and maintains a gentle trend.The evolution of the time-varying electron density during this period is similar to that shown in figure 9,and both of these exhibit a rapid rise and fall process.The duration of the waveform in figure 9 is 11.29 μs and that of the waveform shown in figure 10 is 19.71 μs.The duration of the waveform in figure 10 is significantly longer than that in figure 9,and this trend is basically consistent in the results of the five repeated experiments.The peak electron density of the explosively generated plasma within the period of 44.16-100 μs is also in the order of 1020m?3,which is generally lower than the calculated results in figure 9.The variation trend of the waveform in the period of 34.25-44.16 μs may be related to the charged particles of the detonation products and the initial impact-ionization effect on the interface after the detonation wave penetrates the surface of the explosive[6,7,29].However,the time-domain evolution of the electron density of the explosively generated plasma within the period 44.16-100 μs is theoretically the time evolution process of the electron density of the plasma composed of the charged particles in the detonation products.
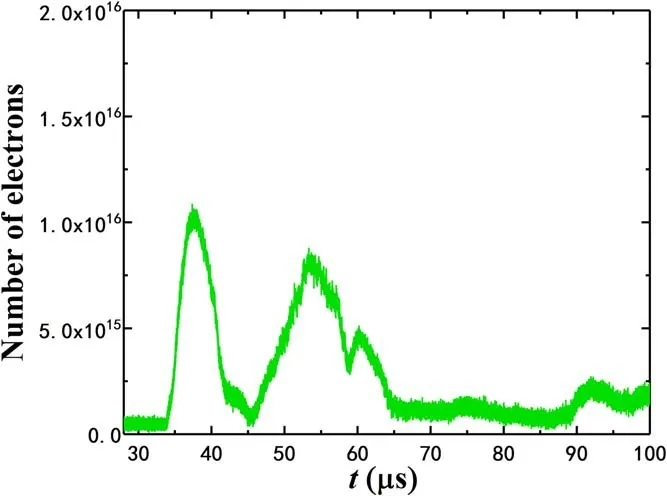
Figure 8.Time variation of the number of electrons in the explosively generated plasma.
3.4.Discussion
As described above,the time evolution of the electron density in the explosively generated plasma ejected from the end face of a small-sized cylindrical RDX explosion exhibits two significant fluctuations.The peak value of the electron density is in the order of 1020m?3,and the overall duration is about 30 μs.During the process of the detonation product passing through the end surface of the explosive and moving to the measurement area,the variation of the electron density in the explosively generated plasma is a clearly nonlinear process.Considering the relationship between the exposure time of the high-speed framing camera used in the experiment and the time scale of the diffusion of the detonation products,each frame taken by the high-speed framing camera is in fact an overexposure[5].Therefore,the equivalent volume of the explosively generated plasma used in the calculation is theoretically larger than the actual value,and the results from the calculation of the time-varying electron density will be lower than the real situation.The peak electron density of the explosively generated plasma ejected into air from the end face of the cylindrical explosive measured in the experiment is at least in the order of 1020m?3.In similar research[6],the peak electron density of the explosively generated plasma ejected from the end face of a cylindrical explosive into a closed glass container filled with argon measured by the Saha equation method was in the order of 1022m?3.This difference may be mainly related to the constraint provided by the glass tube.Furthermore,the electron affinity of air is higher than that of argon[6,25],which would also lead to a lower peak electron density being measured in the present experiments.
Explosively generated plasma is composed of charged particles generated from chemical ionization in the explosive reaction,thermal ionization in the detonation reaction,detonation-wave shock compression of unreacted explosive crystals,and ionization from the shock-wave impact on the air interface[26].This is a complex system with a macroscopic spatial and temporal scale.Figures 4(a)and 8 indicate that the explosively generated plasma experiences two obvious fluctuations in the measurement area of the system.These results also indicate that the electron-density fluctuation process is notably different from the continuous-diffusion process of the detonation products[26,27].In theory,if the explosively generated plasma was composed entirely of charged particles from the detonation products,then according to the diffusion of these detonation products,the measured results would not show two distinct fluctuations.However,this is not the case.The two distinct fluctuations confirm that the formation of the charged particles from the explosion is a complex,discontinuous,and intermittent process,and the deflagration to detonation process of the explosive would influence the explosively generated plasma information process.
A previous study[6]indicated that the initial flash of the detonation wave is enough to weakly ionize the air,and the initial plasma electron density may be related to this.Considering figures 4(a)and 6,it can be seen from the time domain that the Rayleigh microwave scattering voltage curve does not change significantly when an obvious bright region initially appears in the images taken by the high-speed framing camera.This indicates that the electron density of the plasma generated by the weak ionization of the air caused by the initial explosion flash is less than 1018m?3,below the threshold observation level of the Rayleigh microwave scattering system.
The images taken by the high-speed framing camera shown in figure 6 have obvious wedge-shaped bright areas,which are caused by the impact of the shock wave with the ionized air[26,27,29].When a strong shock wave propagates through air,the temperature behind the wave front increases sharply,which causes ionization of the air.This phenomenon is very obvious near the detonation center[27].Therefore,combined with the wedge-shaped bright areas shown in figures 6(c)-(e),the plasma composition corresponding to the curve of the electron density calculation result shown in figure 9 theoretically includes both the charged particles of the detonation products and the charged particles generated by air-impact ionization.According to the theory of the gas ionization at the front of the shock wave[27,30,31],when T=3000 K,the gas ionization degree is in the order of 10?5,and the electron density is in the order of 1021m?3.The theoretical calculation result of the electron density in the shock wave is one order of magnitude higher than the result of the experiment.According to the measurement principle,the volume enclosed by the bright area was used in calculating the volume of the plasma column.However,the charged particles from the air-impact ionization are mainly concentrated in the head of the shock wave in theory.Therefore,the volume from the measurement experiment is larger than the actual one,which causes a smaller electron density value in the experiment.Considering the images taken by the high-speed camera shown in figures 6(f)-(j),it can be seen that the plasma components corresponding to the curve of the electron density calculation result shown in figure 10 are mainly detonation products,because the head area has exceeded the linear working area of the Rayleigh microwave scattering system.Furthermore,as shown in figure 8,the sudden change of electron density in the descending stage may be caused by the detonation products of the sparse wave compression[3,4].

Figure 9.Time-varying electron density of explosively generated plasma with different equivalent volumes within 34.25-44.16 μs,showing(a)equivalent volume remaining unchanged with time,and(b)equivalent volume varying with time.

Figure 10.Time-varying electron density of explosively generated plasma within 44.16-100 μs.
The time-evolution process of the electron density of the explosively generated plasma was measured by the Rayleigh microwave scattering system only at a certain spatial position.Therefore,the two distinct fluctuations appearing in the measurement results indicate that there are two processes involved in the variation of the electron density in the measurement region.This indicates that the explosively generated plasma diffusion process is a transient nonlinear wave process,and the duration of the plasma annihilation and regeneration process is in the order of microseconds.In fact,the evolution of the electron density in the explosively generated plasma is complex in time domain.The plasma is composed of the complex gas components from the explosion.The motion characteristics of the charged particles from the detonation products,the air-impact ionization and the influence of the deflagration to detonation process will be studied from a theoretical perspective in future studies.
4.Conclusions
The time-varying electron density of explosively generated plasma ejected from the end face of a small cylindrical RDX explosion was measured using a Rayleigh microwave scattering system.The experimental results show that the detonation products ejected into the air after detonation have obvious charged particle characteristics and electron fluctuations.The peak electron density measured by the system was in the order of 1020m?3.There were two obvious fluctuations in the electron density in the time domain,and these fluctuations increased rapidly with time to a peak value and then decayed rapidly.The peak electron density of the explosively generated plasma in the first stage was greater than that in the second stage,while the duration of the first stage was significantly less than that of the second stage.
These experimental results verify the feasibility of measuring the time-varying electron density of explosively generated plasma from small-size explosives using a Rayleigh scattering microwave device.The mean value of the duration of the signals from first stage Δt1=11.32 μs and the random error is 15.3%.The mean value of the duration of the signals from second stage Δt2=19.20 μs and the random error is 29.68%.In this paper,by unifying the trigger time of the high-speed framing camera and the Rayleigh microwave scattering system,it was found that the initial formation of the explosively generated plasma was significantly delayed from the explosive initiation time.The delay time between the explosive initiation time and the start of variation in the electron-density curve was 2.77-6.93 μs,and the random error was in the range of 10.6%-12.3%.When there was obvious light in the measurement area,the Rayleigh scattering microwave system received no obvious scattering signal.The electron density of the plasma formed by the photoionization of the initial explosion was therefore less than the order of 10?18m?3,which is the lowest observation level of the Rayleigh microwave scattering system.It is considered that the primary components of the initial explosively generated plasma consist of the charged particles from the detonation products and the charged particles produced by the strong shock wave impacting the air and causing ionization.The Rayleigh microwave scattering method used in this experiment provides a new scheme for non-contact examination of explosively generated plasma,and the experimental results provide a reference for the study of the spatiotemporal evolution characteristics of explosively generated plasma.
Acknowledgments
This work is supported by National Natural Science Foundation of China(Nos.11502118,11504173).
猜你喜歡
作文小學(xué)高年級(2022年3期)2022-04-20 08:16:54
Plasma Science and Technology(2021年11期)2021-11-30 08:29:02
Plasma Science and Technology(2021年9期)2021-09-10 09:26:44
文苑(2020年7期)2020-08-12 09:36:36
海峽姐妹(2019年11期)2019-12-23 08:42:18
文苑·經(jīng)典美文(2019年11期)2019-11-07 02:10:13
作文大王·低年級(2019年2期)2019-01-23 11:35:18
作文大王·低年級(2018年9期)2018-10-24 11:01:08
Acta Mathematica Scientia(English Series)(2016年6期)2017-01-21 05:31:03
當(dāng)代水產(chǎn)(2016年8期)2016-09-03 10:44:10
 Plasma Science and Technology2021年4期
- Plasma Science and Technology的其它文章
- Electric-field induced fluctuations in laser generated plasma plume
- Comparison of emission signals for different polarizations in femtosecond laser-induced breakdown spectroscopy
- Modeling of the impurity-induced silicon nanocone growth by low energy helium plasma irradiation
- High harmonic generation driven by twocolor relativistic circularly polarized laser pulses at various frequency ratios
- Influence of target temperature on AlO emission of femtosecond laser-induced Al plasmas
- Modelling of electronegative collisional warm plasma for plasma-surface interaction process