
Investigation of the structural and dynamic basis of kinesin dissociation from microtubule by atomistic molecular dynamics simulations
2022-05-16 07:12:22JianGangWang王建港XiaoXuanShi史曉璇YuRuLiu劉玉如PengYeWang王鵬業(yè)HongChen陳洪andPingXie謝平
Chinese Physics B 2022年5期
Jian-Gang Wang(王建港) Xiao-Xuan Shi(史曉璇) Yu-Ru Liu(劉玉如) Peng-Ye Wang(王鵬業(yè))Hong Chen(陳洪) and Ping Xie(謝平)
1School of Material Science and Engineering,Central South University of Forestry and Technology,Changsha 410004,China
2Key Laboratory of Soft Matter Physics,Institute of Physics,Chinese Academy of Sciences,Beijing 100190,China
Keywords: kinesin,dissociation,energy landscape,molecular dynamics simulation
1. Introduction
In cells the fast and long-distance transport of cargoes,in forms of vesicles, organelles mitochondria, mRNA particles,liposomes,etc.,is performed by motor proteins. A typical one of these motor proteins is kinesin(concretely kinesin-1), which can step continuously on the microtubule (MT) towards the plus end for hundreds of steps before dissociation via the hydrolysis of ATP molecules.[1—9]In order to realize the processive stepping on MT, the motor is required to alternate between the strong and weak interactions with MT,which is regulated by the change of the nucleotide state of the motor domain (also called head). It was determined that the kinesin head has a strong interaction with MT in nucleotidefree, ATP and ADP.Pi states while has a weak interaction in ADP state.[10—12]To understand how different nucleotide states of the kinesin head result in different interactions with MT, structures of the head complexed with tubulin or MT in different nucleotide states of the head have been studied using x-ray crystallography and cryo-electron microscopy.[13—20]Moreover, using all-atom molecular dynamics (MD) simulations,the interactions between the kinesin head in different nucleotide states and tubulin were also analyzed in details.[21—25]
An important factor characterizing the processivity of the kinesin motor is its dissociation from MT.During the processive stepping, the dissociation rate and its dependence on the load were determined using the single molecule optical trapping method.[26—28]The run length, which is related directly to the dissociation rate, and its dependence on the load were also studied in details experimentally.[28—32]Correspondingly,the theoretical and numerical studies of the dissociation rate and run length as well as their load dependences were also made,[33—43]explaining the experimental data. Using the single molecule optical trapping method,Uemuraet al.[44]measured the dissociation force for both the single kinesin head and the kinesin dimer in different nucleotide states and under different directions of the load. These studies provided important dynamic information for the dissociation and thus the processivity of the kinesin motors.
However, the structural and dynamic basis for the dissociation of the kinesin remains elusive for the lack of structural information during the dissociation process.For example,during the dissociation process,how the position and orientation of the kinesin head relative to MT change is unknown. During the dissociation process, how the interactions such as the bonds formed between the kinesin head and MT vary is unclear. Does the dissociation show the similar dynamic behavior or different dynamic behaviors along different directions relative to the tubulin?Moreover,the potential form(or energy landscape)of the interaction between the head and tubulin remains undetermined although the maximum binding energy between them has been calculated. Addressing these issues has important implications for the detailed molecular mechanism of the dissociation of the kinesin motor and thus is critical to the mechanism of its processivity. To this end, in this work we resort to all-atom MD simulations. We apply an external force in different directions on the kinesin head of the kinesin—tubulin complex to simulate the dissociation of the kinesin head from the tubulin along the directions.By analyzing the simulated snapshots of the structure of the kinesin—tubulin complex we provide detailed structural and dynamic information for the dissociation process.
2. Materials and methods
2.1. Initial structure
The initial structure used in our MD simulations is that of a kinesin head in ADP state complexed with a tubulin.The structure of the ADP-head is from the data, pdb: 1BG2(1.8 °A).[45]The structure of the tubulin is from the data,pdb:1JFF(3.50 °A),a tubulin heterodimer bound with a GTP in theα-subunit and a GDP in theβ-subunit.[46]The missing atoms are added using the software Swiss-PdbViewer.[47]The topology files of the ADP molecule in the kinesin head are generated by the online PRODRG server. As described in details before,[24,25,48]the initial structure of the complex is prepared as follows. Firstly, on the basis of the structural data, pdb:4LNU, the complex of a human nucleotide-free kinesin head bound to a tubulin,[14]we use CHIMERA[49]to do molecular replacements. After the replacements, we do the energy minimizations twice.[50]Then,we equilibrate the complex for 100 ps at 300 K and 1 bar pressure in the NVT[51]ensemble and NPT[52,53]ensemble.
2.2. MD simulations
The MD simulation methods and conditions are similar to those used before,[24,25,48,54]which are re-described briefly as follows. We use GROMACS[55]with AMBER99SB-ILDN force filed.[56]TIP3P water model[57]is used. The steepest descent algorithm is used for the energy minimization, and leap-frog algorithm[58]is used for the temperature coupling and the pressure coupling. Potassium ions are added to neutralize the system. The time step of the simulation is set to be 2 fs.The temperature and pressure are controlled at 300 K and 1 bar, respectively. We use LINCS algorithm[59]to constrain the chemical bond, and the short-range electrostatics interaction and the cutoff for van der Waals interaction is set to be 1 nm. We use particle mesh Ewald (PME) algorithm[60]to calculate the long-range electrostatics.
To be able to simulate the dissociation process by allatom MD simulations, we apply an external force,F, on the kinesin head while restrict residues 224—239 in bothα-tubulin andβ-tubulin, where the residues 3—325 of the kinesin head are subjected to the external force. As the kinesin head can dissociate from MT along any direction, for simplicity, we consider the dissociation along five typical directions by applying the external force along those directions: (i)backward(minus-end) direction, which is defined as the-xdirection(see Fig.1),(ii)forward(plus-end)direction,i.e.,thexdirection,(iii)upward direction,which is defined as theydirection,(iv) backward-upward direction, i.e., the direction forming a 45°angle with the-xdirection,(v)forward-upward direction,i.e.,the direction forming a 45°angle with thexdirection. For the external force along the forward and backward directions,the size of the simulation box is set as 30×15×13 nm3,with 30 nm,15 nm and 13 nm along thex,yandzdirections,respectively. For the external force along the forward-upward and backward-upward directions,the size of the simulation box is set as 26×28×12 nm3,with 26 nm,28 nm and 12 nm along thex,yandzdirections, respectively. For the external force along the upward direction, the size of the simulation box is set as 14×32×12 nm3,with 14 nm,32 nm and 12 nm along thex,yandzdirections, respectively. For no external force,the size of the simulation box is set as 14×14×10 nm3,with 14 nm, 14 nm and 10 nm along thex,yandzdirections, respectively.

Fig. 1. Equilibrium MD simulation results for the kinesin head in ADP state complxed with the tubulin. (a) Temporal evolution of RMSD value.(b)Equilibrium structure of the complex.
2.3. HB analysis
The hydrogen bonds(HBs)between two polar atoms(as acceptor and donor), with one atom on the kinesin head and the other one on the tubulin, are identified using VMD, with the criterion as follows. The cutoff for the angle between the donor and acceptor is set as 30°and the cutoff for the distance between the donor and acceptor is set as 3.5 °A.We use the following two-step procedure to calculate the HB occupancy. First,from all snapshots of a simulation trajectory,we calculate the HB occupancy for each residue pair in the range of Δd±0.1 nm for a given Δd, where the HB occupancy is defined as the percentage of snapshots where a given HB is formed and Δdis defined as the change in the distance between the center-of-mass position of the kinesin head and that of the tubulin with initial Δd=0. Second,we sum up the HB occupancy for each residue pair over 10 trajectories for each case of the external force along a given direction,and then divide it by 10 to obtain the mean HB occupancy.Since multiple HBs can form between two residues,the mean HB occupancy can be larger than one.
3. Results and discussion
As previous studies indicated,during the processive stepping the dissociation of the kinesin dimer from MT under a non-large load occurs mainly in the state of the kinesin dimer where only one head in ADP state binds weakly to MT while the other head is detached from MT(called weak-MT-binding state).[40,41]Thus, in this work we focus only on the dissociation process of an ADP-head from a tubulin. First, we construct the system of the ADP-head bound to the tubulin (see Section 2). Then, we perform the equilibrium simulation for a time longer than 100 ns, with the simulation results for the time series of the root mean square deviation for Cαatoms relative to the starting one being shown in Fig.1(a). It is seen that the system reaches the equilibrium state very rapidly. The structure at the finally equilibrium state is shown in Fig.1(b).From the simulated results of the finally stable equilibrium state the calculated mean number of HBs formed at the interface between the kinesin head and tubulin is about 13. As calculated before using umbrella sampling,for the equilibrium state of the kinesin head in ADP state complexed with the unperturbed tubulin, the binding energy of the kinesin head to the tubulin, which arises mainly from the HB interactions, is aboutEw=35kBT.[25]Thus, approximately, the affinity per HB in the equilibrium state shown in Fig.1 isEHB=2.7kBT.Throughout this work, we use this equilibrium state to study the dissociation of the kinesin head from the tubulin.
Since under no load the kinesin will dissociate from MT with a long time of the order of the second in the weak-MTbinding(ADP)state,[28,61,62]it is unable to simulate the dissociation process using all-atom MD simulations with our current computational ability. In order to be able to simulate the dissociation process by all-atom MD simulations,we apply an external force on the kinesin head by fixing the tubulin (see Section 2). In order to save the simulation time,we use a large force of 500 pN.As we will show later,the choice of the magnitude of the force,for example,increasing the external force by 2-fold,has nearly no effect on our conclusion presented in this work.
3.1. Dissociation along the backward direction
In this section, we focus on the external force along the backward direction. Under the external force of 500 pN, we perform 10 simulations. Some results for the temporal evolution of the change in the distance(Δd)between the kinesin head and tubulin are shown in Fig.2(a),where Δdis defined to have a negative value with initial Δd=0. From Fig.2(a)it is seen evidently that for a given simulation,Δdis initially kept nearly equal to zero for a time period(period I),then|Δd|increases with the rate increasing with time in the following period(period II)and at last|Δd|increases with a constant rate in the last period (period III) (for clarity, we take the results depicted by red line in Fig.2(a)as the example to indicate the three periods). To see why there are three periods during the dissociation process,from each simulation we calculate statistically the HBs occupancy for each residue pair in the range of Δd±0.1 nm for different values of Δd. From the 10 simulations,with the HB occupancies as calculated above the results of the mean number of HBs (denoted byN) versus Δdare shown in Fig.2(b). With the affinity ofEHB=2.7kBTper HB(see above)and the mean HB numberNversus Δddetermined in Fig.2(b),the potential form of the kinesin head interacting with the tubulin as the function of Δdalong the —xdirection can be approximately shown in Fig.2(c). From Figs.2(b)and 2(c). we thus can explain the presence of the three periods during the dissociation as follows. During period I,the mean number of the HBs formed between the kinesin head and tubulin maintains the maximum value of about 13 and accordingly the binding energy maintains the largest value of about 35kBT.During period II,the mean number of the HBs decreases gradually from the maximum value of about 13 to the minimum value of 0 and accordingly the binding energy decreases gradually from the largest value of about 35kBTto the smallest value of 0.During period III,no HB is present and accordingly the binding energy equals to 0,and thus the head diffuses with a constant velocity under only the constant 500-pN external force.
To see if the magnitude of the external force affects our results shown in Figs.2(b)and 2(c),we use the external force of 1000 pN to make 10 simulations. Some results for the temporal evolution of Δdare shown in Figs.S1(a)and S1(b)(see supplementary materials). From the 10 simulations the results of the mean HB numberNversus Δdare shown in Fig.S1(c),which is obtained with the same method as described above for the case under the 500-pN external force. Accordingly,the potential form of the head interacting with the tubulin as the function of Δdcan be approximately shown in Fig.S1(d).From Fig.S1 it is seen that doubling the magnitude of the external force has nearly no effect on the results of the mean HB numberNversus Δdand the potential form. In the following,we use the external force of 500 pN.
To see how the position and orientation of the kinesin head change relative to the tubulin during the dissociation along the —xdirection, we show the structures of the system at different values of Δd,with some structures from one of the 10 simulations being shown in Fig.3(a)(with the enlargement of each image being shown in Fig.S2 in supplementary materials). It is noted that during the dissociation process,there are no conformational change of the head,no change in the position of the magnesium ion binding with ADP in the nucleotidebinding pocket, no change in the position and orientation of the ADP molecule in the nucleotide-binding pocket,etc. (see Fig. S3 in supplementary materials). The structures for the other nine simulations are shown in Figs.S4—S12(see supplementary materials). From Fig.3(a)and Figs.S4—S12 it is seen interestingly that the dissociation of the kinesin head from the tubulin along the backward direction is via both the counterclockwise rotation and backward translation of the head. As it is known,the HB interaction distance for a pair of residues is smaller than 1 nm in solution. Then, a puzzling issue is that even when the kinesin head is moved by a distance of about 2.5 nm relative to the tubulin,a small but non-zero binding energy is still present between the head and tubulin (Fig. 2(c)).To address this issue, we indicate the main HBs formed between the kinesin head and tubulin in the structures shown in Fig.3(a)and Figs.S4—S12. The more detailed occupancies of main HBs calculated in the range of Δd±0.1 nm for different values of Δdare also listed in the table shown in Fig.3(b)and those in Figs. S4—S12, where only the HB occupancy that is larger than 5% is listed. It is noted interestingly that as|Δd|increases, the change of the mean HB number does not arise only from the disappearance of some HBs but also from the appearance of new HBs. The appearance of new HBs results in the non-zero binding energy even when the kinesin head is moved by a distance of about 2.5 nm relative to the tubulin.

Fig.2. Simulation results under the backward force of 500 pN on the kinesin head. (a)Some results for the temporal evolution of the change in the distance,Δd,between the kinesin head and tubulin,where Δd <0. Period I,period II and period III are indicated for the results depicted by the red line. (b)Mean HB number versus Δd. Error bars represent standard deviations. (c)Potential form of the kinesin head interacting with the tubulin as the function of Δd along the backward direction. Error bars represent standard deviations.

Fig.3. Simulation results under the backward force of 500 pN on the head of the head-tubulin complex for one simulation trajectory. (a)Structures of the complex at different values of the change in the distance,Δd,between the head and tubulin,where main HBs formed between the head and tubulin are also indicated(with the numbers inside the brackets representing HB occupancies). The ADP molecule is not shown here. (b)The table lists the occupancies of main HBs calculated in the range of Δd±0.1 nm for different values of Δd,where only HBs with their occupancies larger than 5%are listed.
3.2. Dissociation along the forward direction
In this section, we focus on the external force along the forward direction. We follow the similar procedure of presenting our simulation results to that presented in the above section. We also perform 10 simulations under the external force of 500 pN. Some results for the temporal evolution of the change in the distance, Δd, between the kinesin head and tubulin are shown in Fig.4(a), where Δdis defined to have a positive value. As expected,there also exist three periods during the dissociation process.During period I,Δdis kept nearly equal to zero;during period II,|Δd|increases with the rate increasing with time;and during period III,|Δd|increases with the constant rate. From the 10 simulations, the results of the mean number of HBs formed between the kinesin head and tubulin versus Δdare shown in Fig.4(b), where for comparison the corresponding results under the backward force(with Δd <0)are also reshown.Correspondingly,the potential form of the kinesin head interacting with the tubulin as the function of Δdalong the forward direction can be approximately shown in Fig. 4(c), where for comparison the corresponding results under the backward force are also reshown.
In Fig.5(a),we show some structures of the system at different values of Δdfrom one of the 10 simulations (with the enlargement of each image being shown in Fig. S13 in supplementary materials), where the main HBs formed between the kinesin head and tubulin are indicated. Correspondingly,the more detailed occupancies of main HBs calculated in the range of Δd±0.1 nm for different values of Δdare listed in the table shown in Fig. 5(b), where only the HB occupancy that is larger than 5% is listed. The structures and the main HBs for the other nine simulations are shown in Figs. S14—S22(see supplementary materials). Comparing Figs.4 and 5 and Figs.S14—S22 with Figs.2 and 3 and Figs.S4—S12, it is seen that the structural and dynamic behaviors of the kinesin dissociation along the forward direction are similar to those along the backward direction, except that the dissociation of the kinesin head from the tubulin along the forward direction is via both the clockwise rotation and forward translation of the head.
From Figs. 4(b) and 4(c), it is seen that the mean HB number and the potential are slightly asymmetrical in the two opposite directions, with the characteristic distance of about 3 nm along the —xdirection being smaller than that of about 4 nm along thexdirection. Here, the characteristic distance is defined as the distancedc=|Δd| at which the mean HB number becomes nearly equal to zero or the potential becomes nearly to the maximum level. The sum of the two characteristic distances, which is equivalent to the interaction distance between the head and tubulin along the MT filament, is only slightly smaller than 8 nm,the repeat of tubulins in a MT filament. This is consistent with the previous argument for the potential form of the kinesin-1 head interacting with MT in the theoretical and numerical studies.[63,64]

Fig.4. Simulation results under the forward force of 500 pN on the kinesin head. (a)Some results for the temporal evolution of the change in the distance,Δd,between the kinesin head and tubulin,where Δd >0. (b)Mean HB number versus Δd. For comparison,the corresponding results under the backward force (with Δd <0) are also shown. Error bars represent standard deviations. (c) Potential form of the kinesin head interacting with the tubulin as the function of Δd along the forward direction. For comparison,the corresponding results under the backward force(with Δd <0)are also shown. Error bars represent standard deviations.

Fig. 5. Simulation results under the forward force of 500 pN on the head of the head-tubulin complex for one simulation trajectory. (a) Structures of the complex at different values of the change in the distance,Δd,between the head and tubulin,where main HBs formed between the head and tubulin are also indicated(with the numbers inside the brackets representing HB occupancies). The ADP molecule is not shown here. (b)The table lists the occupancies of main HBs calculated in the range of Δd±0.1 nm for different values of Δd,where only HBs with their occupancies larger than 5%are listed.
3.3. Dissociation along the upward direction
In this section, we focus on the external force along the upward direction. We still follow the similar procedure of presenting our simulation results to that presented in above sections. Some results under the external force of 500 pN for the temporal evolution of the change in the distance,Δd,between the kinesin head and tubulin are shown in Fig.6(a),where Δdis defined to have a positive value.It is seen from Fig.6(a)that period II is very short,which is contrast to the case of the dissociation along the backward or forward direction(Figs.2(a)or 4(a)). This feature for the case of the dissociation along the upward direction can be understood from the results of the mean number of HBs formed between the kinesin head and tubulin versus Δdshown in Fig.6(b),which is calculated statistically from the 10 simulations, and the corresponding potential form of the kinesin head interacting with the tubulin as the function of Δdalong the upward direction shown in Fig.6(c). From Fig.6(b)and 6(c)it is seen that the characteristic distance along the upward direction is smaller than 2 nm,giving the very short period II.
In Fig.7(a),we show some structures of the system at different values of Δdfrom one of the 10 simulations (with the enlargement of each image being shown in Fig. S23 in supplementary materials), where the main HBs formed between the kinesin head and tubulin are indicated. Correspondingly,the more detailed occupancies of main HBs calculated in the range of Δd±0.1 nm for different values of Δdare listed in the table shown in Fig.7(b),where only the HB occupancy that is larger than 5%is listed. The structures and the main HBs for the other nine simulations are shown in Figs. S24—S32 (see supplementary materials). As expected,it is seen from Figs.7 and Figs. S24—S32 that the dissociation of the kinesin head from the tubulin along the upward direction is mainly via the upward translation of the head. As Δdincreases,the decrease of the mean HB number is mainly due to the disappearance of some HBs,whereas only few new HBs can appear.

Fig.6.Simulation results under the upward force of 500 pN on the kinesin head.(a)Some results for the temporal evolution of the change in the distance,Δd,between the kinesin head and tubulin,where Δd >0. (b)Mean HB number versus Δd. Error bars represent standard deviations. (c)Potential form of the kinesin head interacting with the tubulin as the function of Δd along the upward direction. Error bars represent standard deviations.

Fig.7. Simulation results under the upward force of 500 pN on the head of the head-tubulin complex for one simulation trajectory. (a)Structures of the complex at different values of the change in the distance,Δd,between the head and tubulin,where main HBs formed between the head and tubulin are also indicated(with the numbers inside the brackets representing HB occupancies). The ADP molecule is not shown here. (b)The table lists the occupancies of main HBs calculated in the range of Δd±0.1 nm for different values of Δd,where only HBs with their occupancies larger than 5%are listed.
3.4. Dissociation along the backward-upward direction
In this section, we focus on the external force along the backward-upward direction. We still follow the similar procedure of presenting our simulation results to that presented in above sections. Some results under the external force of 500 pN for the temporal evolution of the change in the distance, Δd, between the kinesin head and tubulin are shown in Fig. 8(a), where Δdis defined as having a negative value.From the 10 simulations, the results of the mean number of HBs formed between the kinesin head and tubulin versus Δdare shown in Fig. 8(b). Correspondingly, the potential form of the kinesin head interacting with the tubulin as the function of Δdalong the backward-upward direction can be approximately shown in Fig. 8(c). From Fig. 8 it is noted that the feature for the case of the dissociation along the backwardupward direction is more similar to the case of the dissociation along the backward direction than to the case of the dissociation along the upward direction.
In Fig.9(a),we show some structures of the system at different values of Δdfrom one of the 10 simulations (with the enlargement of each image being shown in Fig. S33 in supplementary materials), where the main HBs formed between the kinesin head and tubulin are indicated. Correspondingly,the more detailed occupancies of main HBs calculated in the range of Δd±0.1 nm for different values of Δdare listed in the table shown in Fig. 9(b), where only the HB occupancy that is larger than 5% is listed. The structures and the main HBs for the other nine simulations are shown in Figs.S34—S42(see supplementary materials). As expected, from Fig. 9 and Figs. S34—S42 it is seen that the structural and dynamic behaviors of the kinesin dissociation along the backward-upward direction are more similar to those along the backward direction, with the dissociation being via both the backwardupward translation and the counterclockwise rotation of the head.

Fig. 8. Simulation results under the backward-upward force of 500 pN on the kinesin head. (a) Some results for the temporal evolution of the change in the distance, Δd, between the kinesin head and tubulin, where Δd is defined as having a negative value. (b) Mean HB number versus Δd. Error bars represent standard deviations. (c) Potential form of the kinesin head interacting with the tubulin as the function of Δd along the backward-upward direction. Error bars represent standard deviations.

Fig. 9. Simulation results under the backward-upward force of 500 pN on the head of the head-tubulin complex for one simulation trajectory.(a)Structures of the complex at different values of the change in the distance,Δd,between the head and tubulin,where main HBs formed between the head and tubulin are also indicated (with the numbers inside the brackets representing HB occupancies). The ADP molecule is not shown here. (b)The table lists the occupancies of main HBs calculated in the range of Δd±0.1 nm for different values of Δd,where only HBs with their occupancies larger than 5%are listed.
3.5. Dissociation along the forward-upward direction
In this section, we focus on the external force along the forward-upward direction. We still follow the similar procedure of presenting our simulation results to that presented in above sections. Some results under the external force of 500 pN for the temporal evolution of the change in the distance, Δd, between the kinesin head and tubulin are shown in Fig. 10(a), where Δdis defined to have a positive value.From the 10 simulations, the results of the mean number of HBs formed between the kinesin head and tubulin versus Δdare shown in Fig.10(b),where Δdis defined as having a positive value and for comparison the corresponding results under the backward-upward force (with Δd <0) are also reshown.Correspondingly, the potential form of the kinesin head interacting with the tubulin as the function of Δdalong the forward-upward direction can be shown in Fig. 10(c), where for comparison the corresponding results under the backwardupward force are also reshown. As expected,it is noted from Fig. 10 that the feature for the case of the dissociation along the forward-upward direction is similar to the case of the dissociation along the backward-upward direction presented in the above section.
In Fig. 11(a), we show some structures of the system at different values of Δdfrom one of the 10 simulations(with the enlargement of each image being shown in Fig. S43 in supplementary materials), where the main HBs formed between the kinesin head and tubulin are indicated. Correspondingly,the more detailed occupancies of main HBs calculated in the range of Δd±0.1 nm for different values of Δdare listed in the table shown in Fig. 11(b), where only the HB occupancy that is larger than 5% is listed. The structures and the main HBs for the other nine simulations are shown in Figs. S44—S52 (see supplementary materials). Comparing Fig. 11 and Figs. S44—S52 with Fig. 9 and Figs. S34—S42, it is seen that the structural and dynamic behaviors of the kinesin dissociation along the forward-upward direction are similar to those along the backward-upward direction,except that the dissociation of the kinesin head from the tubulin along the forwardupward direction is via both the forward-upward translation and the clockwise rotation of the head.

Fig.10.Simulation results under the forward-upward force of 500 pN on the kinesin head.(a)Some results for the temporal evolution of the change in the distance, Δd, between the kinesin head and tubulin, where Δd is defined as having a positive value. (b) Mean HB number versus Δd. For comparison, the corresponding results under the backward-upward force(with Δd <0)are also shown. Error bars represent standard deviations.(c)Potential form of the kinesin head interacting with the tubulin as the function of Δd along the forward-upward direction. For comparison, the corresponding results under the backward-upward force(with Δd <0)are also shown. Error bars represent standard deviations.
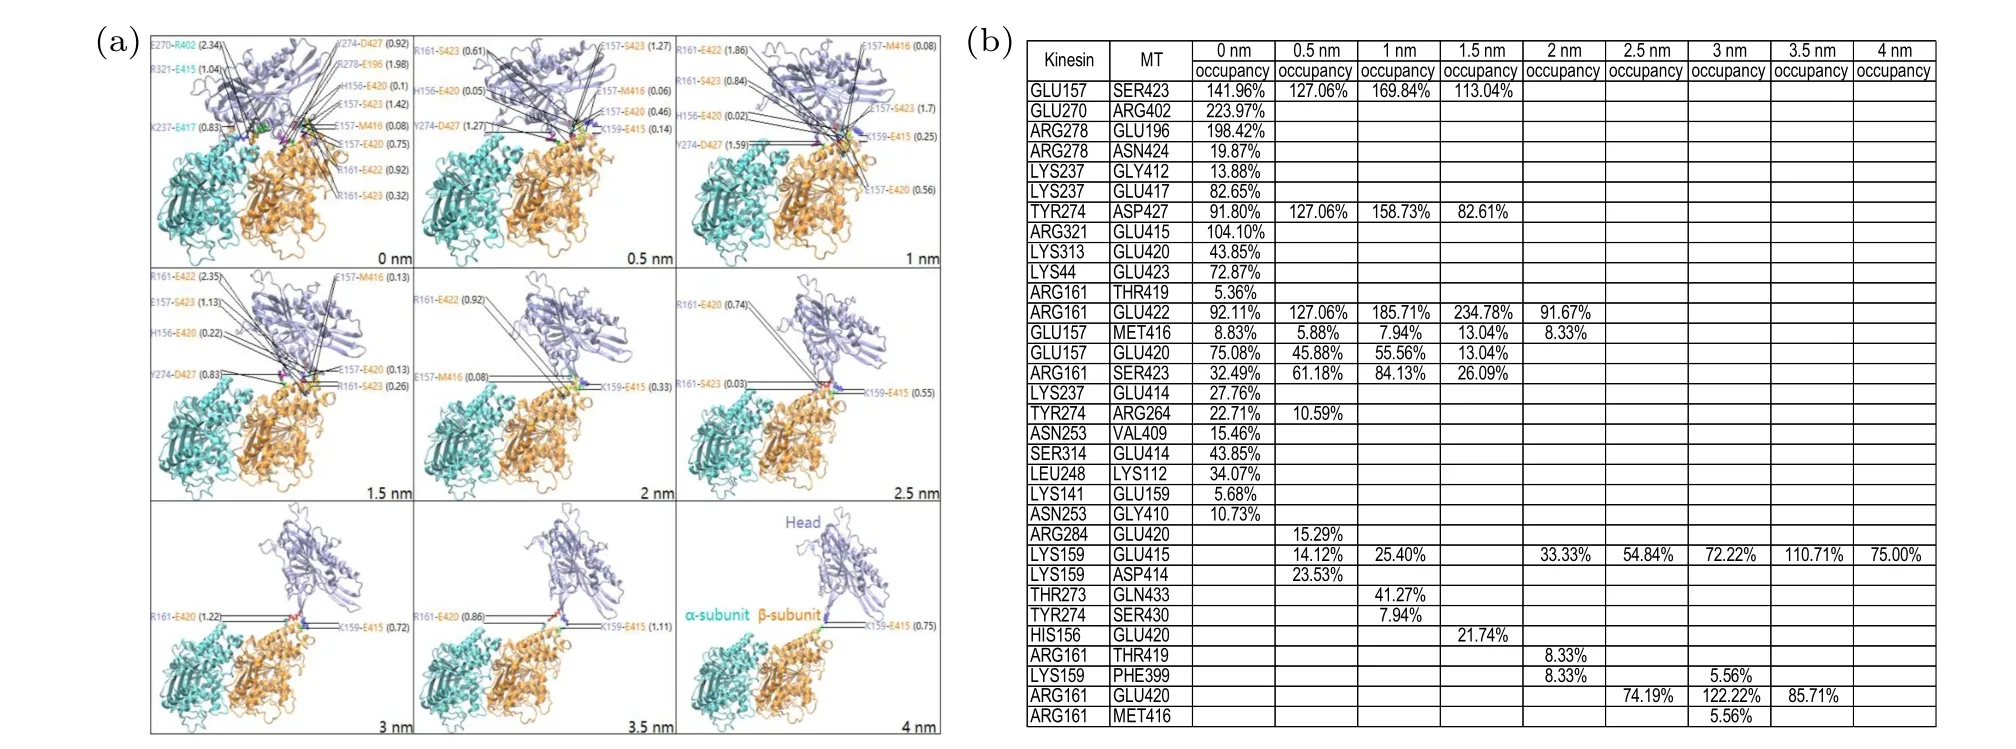
Fig. 11. Simulation results under the forward-upward force of 500 pN on the head of the head-tubulin complex for one simulation trajectory.(a)Structures of the complex at different values of the change in the distance,Δd,between the head and tubulin,where main HBs formed between the head and tubulin are also indicated (with the numbers inside the brackets representing HB occupancies). The ADP molecule is not shown here. (b)The table lists the occupancies of main HBs calculated in the range of Δd±0.1 nm for different values of Δd,where only HBs with their occupancies larger than 5%are listed.
3.6. Comparisons of our all-atom MD simulations with prior single molecule and theoretical studies
Since in the single molecule optical trapping experiments with a micrometer-sized bead attached to the stalk of the kinesin, the load on the kinesin is also in either the backwardupward or forward-upward direction,it is interesting to make the comparison of our simulation data derived from the potential form shown in Fig.10(c)with those obtained from the single molecule optical trapping experiments. According to Kramers theory, from the potential form shown in Fig. 10(c)it is noted that under the backward-upward force,the dissociation rate of the kinesin head has the form

Since during the processive stepping the dissociation of the kinesin dimer occurs mainly in the weak-MT-binding state,from Fig.10(c)it is seen that under the backward-upward and forward-upward loads, as in the single molecule optical trapping experiments,[26—28]the dissociation rate in the weak-MTbinding state is only slightly asymmetrical.Moreover,Eqs.(1)and(2)indicate that in the weak-MT-binding state the interaction of the head with the tubulin exhibits the slip-bond characteristics,with the dissociation rate as the function of the magnitude of the load having approximately the exponential form.Thus,it is expected that the dramatically asymmetric feature of the dissociation rate(or run length),with the dissociation rate(or run length) under the medium forward-upward load being much larger(or smaller)than that under the corresponding backward-upward load,[28,31]and the slip-catch-bond characteristics under the backward-upward load[27,40]would arise mainly from the occurrence rate of the weak-MT-binding state during the processive stepping of the motor. This is consistent with the conclusion from the previous theoretical and numerical studies.[39,40,42,43]
4. Concluding remarks
Here, using all-atom MD simulations we study the dissociation process of the kinesin head in ADP state from the tubulin. We focus on the dissociation along five typical directions by applying the external force along those directions on the kinesin head. Our studies show that along different directions the dissociation has different dynamic behaviors.(i) Along the backward direction, the dissociation is via both the counterclockwise rotation and backward translation of the head relative to the tubulin. The dissociation has the characteristic distance of about 3 nm. (ii) Along the forward direction, the dissociation is via both the clockwise rotation and forward translation of the head relative to the tubulin. The dissociation has the characteristic distance of about 4 nm. Along both backward and forward directions, as|Δd| increases the change of the mean HB number does not arise only from the disappearance of some HBs but also from the appearance of new HBs, and the appearance of new HBs results in the long characteristic distance. (iii) Along the upward direction, the dissociation is mainly via the upward translation of the head relative to the tubulin. The dissociation has the characteristic distance smaller than 2 nm. Along the upward directions,as|Δd| increases the change of the mean HB number arises mainly from the disappearance of some HBs, resulting in the short characteristic distance. (iv)Along the backward-upward direction, the dissociation is via both the backward-upward translation and the counterclockwise rotation of the head relative to the tubulin. The dissociation has the characteristic distance of about 3 nm. (v) Along the forward-upward direction,the dissociation is via both the forward-upward translation and the clockwise rotation of the head relative to the tubulin. The dissociation has the characteristic distance of about 4 nm. The dynamic feature of the dissociation along the backward-upward or forward-upward direction is more similar to that along the backward or forward direction than to that along the upward direction. Moreover,the potential forms(or energy landscapes) of the interaction between the head and tubulin along the five typical directions are determined, from which the whole 2D potential form in thexoyplane can be easily envisioned. Under no external force, the dissociation trajectory can transit among different directions,with the dissociation process being governed by the above 2D potential.Finally,it is noted that the method used here to determine the potential form can be generally applicable to other pairs of interacting proteins.
猜你喜歡
華人時(shí)刊(2023年19期)2023-11-16 12:32:52
Chinese Physics B(2023年7期)2023-09-05 08:48:06
大眾文藝(2022年17期)2022-09-27 16:05:38
大眾文藝(2022年10期)2022-06-08 02:33:28
中學(xué)生數(shù)理化·高二版(2022年4期)2022-05-09 22:14:17
Chinese Physics B(2021年9期)2021-09-28 02:18:28
中國音樂教育(2017年12期)2017-01-27 15:41:07
Journal of Donghua University(English Edition)(2015年2期)2015-12-20 09:14:08
Journal of Beijing Institute of Technology(2015年1期)2015-04-24 05:38:12
作文評點(diǎn)報(bào)·低幼版(2014年24期)2014-07-10 11:03:19

- Chinese Physics B的其它文章
- Erratum to“Boundary layer flow and heat transfer of a Casson fluid past a symmetric porous wedge with surface heat flux”
- Erratum to“Accurate GW0 band gaps and their phonon-induced renormalization in solids”
- A novel method for identifying influential nodes in complex networks based on gravity model
- Voter model on adaptive networks
- A novel car-following model by sharing cooperative information transmission delayed effect under V2X environment and its additional energy consumption
- GeSn(0.524 eV)single-junction thermophotovoltaic cells based on the device transport model