
Evaluating the Capabilities of Soil Enthalpy,Soil Moisture and Soil Temperature in Predicting Seasonal Precipitation
2018-03-06 03:36:08ChangyuZHAOHaishanCHENandShanleiSUNKeyLaboratoryofMeteorologicalDisasterMinistryofEducationKLMEInternationalJointResearchLaboratoryofClimateandEnvironmentChangeILCECCollaborativeInnovationCenteronForecastandEvaluationofMet
Advances in Atmospheric Sciences 2018年4期
Changyu ZHAO,Haishan CHEN?,and Shanlei SUNKey Laboratory of Meteorological Disaster,Ministry of Education(KLME)/International Joint Research Laboratory of Climate and Environment Change(ILCEC)/Collaborative Innovation Center on Forecast and Evaluation of Meteorological Disasters(CIC-FEMD),Nanjing University of Information Science and Technology(NUIST),Nanjing 20044,China
2School of Atmospheric Science,Nanjing University of Information Science and Technology(NUIST),Nanjing 210044,China
1.Introduction
The importance of land–atmosphere interactions and relevant physical processes has been increasingly recognized in analyses of land surface factors,such as soil moisture,snow,vegetation and soil temperature.Similar to sea water,the land surface also constitutes a significant“memory”component of the Earth’s climate system.However,the slowly varying land memory associated with the atmospheric forcing,and the mechanisms that drive land–atmosphere interactions,remain unclear(Wu and Dickinson,2004;Liu,2010;Yang and Zhang,2016).
Soil acts as a large heat source or sink,and thus can adjust the amplitude of the surface temperature annual cycle.In general,heat is transferred to deep soil layers and stored in the warm season,and is then released upward in the cold season,thereby increasing the surface soil temperature(Guo and Sun,2002;Zhang and Wu,2014).Usually,land surface thermal conditions can be described by the soil thermal status,which is largely determined by two soil elements:soil moisture and soil temperature.Soil moisture,which generally refers to water contained in the unsaturated soil zone,acts as a storage for precipitation,controls the partitioning of net radiation into sensible and latent heat fluxes,and moreover influences soil heat storage through altering soil thermal properties(e.g.,Specific heat capacity;Dirmeyer et al.,2003;Koster et al.,2004;Seneviratne et al.,2010;Zhang et al.,2011).As the other important component of land surface processes,soil temperature represents the soil energy status and heat transfer conditions(Tang and Reiter,1986;Qian et al.,2011;Yang and Zhang,2016).Moreover,the subsurface temperature has a longer memory and provides more effective signals of seasonal climate predictions(Mahanama et al.,2008;Xue et al.,2012;Wang et al.,2013;Wu and Zhang,2014).In short,soil moisture and soil temperature describe different aspects of land surface thermal conditions.However,land surfaces constitute a complicated system that cannot be objectively described by only one factor(e.g.,soil moisture or soil temperature).Therefore,it is critical to find or establish new variables,which can more comprehensively represent land surface thermal conditions.
Soil enthalpy is a distinct variable that accounts for variations in soil temperature,soil moisture and soil texture,and can directly reflect land surface thermal conditions in terms of energy.Bohren and Albrecht(1998)indicated that the word“enthalpy”can often be accurately used in place of“heat content per unit mass”.Despite that,only a few Scientific publications comprehensively explore the characteristics of soil enthalpy and its applications in climate studies.Pielke(2003)recommended a focus on heat storage rather than temperature for monitoring climate change across the globe.Zhang et al.(2003)deduced the enthalpy expression for a heterogeneous land surface with latent heat assumed to be a function of temperature.Chen and Kumar(2004)showed that soil enthalpy variations in the shallow soil zone were dominated by soil moisture,whereas such variations in the deep soil zone were controlled by soil temperature.Davey et al.(2006)noted that,compared with air temperature,moist enthalpy was more sensitive to vegetation properties and could more accurately depict surface heating trends.Hu and Feng(2004)found that persistent negative soil enthalpy anomalies in the northwestern U.S.were related to negative regional surface temperature changes,which encouraged a northward position of the lower-troposphere monsoonal ridge and promoted above-average monsoon rainfall in the southwestern U.S.Notably,Hu and Feng(2004)only considered soil temperature variability by setting the heat capacity as a constant when calculating soil enthalpy.Amenu et al.(2005)indicated that soil enthalpy variability was governed by variations in both soil moisture and soil temperature,whereas heat capacity was a function of soil moisture.As a result,it is necessary and required to comprehensively assess the capability of soil enthalpy as a metric in monitoring land surface heating and its impact on climate.
In the present study,we aim to(1)assess soil moisture and soil temperature contributions to soil enthalpy;and(2)select areas with similar sensitivities to soil moisture and soil temperature,and then discuss whether soil enthalpy provides a better representation of the land thermal variability.The paper is organized as follows:The data and methods are described in section 2;the main results are presented in section 3;and discussion and conclusions are provided in section 4.
2.Data and methods
2.1.Data
For the soil medium,the total enthalpy can be expressed as the summarized enthalpies of soil particles,soil water and soil air(Murray,2002).Considering the difficulties in measuring soil air and its smaller content,we ignore its impacts on soil enthalpy in this study.Therefore,the equation of soil enthalpy per unit volume(H;J m?3)can be represented as follows(Sun,2005):

where ciand clare the volumetric heat capacities of soil ice(1.942×10⁶J m?3K?1)and soil liquid water(4.188×10⁶J m?3K?1),respectively;Tfis the freezing temperature(273.16 K);Li,lis the latent heat of fusion(3.337×10⁵J kg?1)and ρiis the density of ice(917 kg m?3);cdand λdrepresent the volumetric heat capacity and the volume percent of soil solids,respectively,which can be calculated with the soil organic matter density and the percentage of sand and clay from the 1°×1°monthly global soil texture dataset provided by the IGBP(Bonan et al.,2002;Lawrence and Slater,2008);λiand λldenote the volume percentages(m3m?3)of soil ice and soil liquid water,respectively;and T represents soil temperature(K).
Due to a lack of comprehensive global observational data,soil moisture(including soilice and soilliquid water)and soil temperature are obtained from offine simulations byCLM4.0(Oleson et al.,2010),which is the land component of CESM.Compared with the previous version(i.e.,CLM3.5),CLM4.0 features a number of parameterization improvements and functional/structural advancements,such as the inclusion of a carbon–nitrogen biogeochemical model,the addition of an urban canopy model,and the introduction of transient land cover/land-use change capabilities(Lawrence et al.,2011;Hua et al.,2013;Zhu et al.,2013).The number of ground layers has been extended from 10 layers in CLM3.5 to 15 in CLM4.0,of which the top 10 and bottom 5 layers are hydrologically active(i.e.,“soil”layers)and inactive,respectively.The global near-surface meteorological forcing dataset for running this model was developed by the Land Surface Hydrology Research Group at Princeton University(Sheffield et al.,2006)for the period 1948–2006,with a temporal resolution of three hours and horizontal resolution of 1°×1°,and includes humidity,long wave radiation,precipitation,shortwave radiation,surface air temperature,surface pressure,and surface winds.CLM4.0 is spun up for 18 years to ensure that the simulated variables reach a long-term equilibrium.Finally,the model outputs of soil ice,soil liquid water and soil temperature are used to calculate the soil enthalpy.
The 1°×1°monthly gridded precipitation(P)data are from the CN05.1 dataset for the period 1961–2012,which was constructed by an “anomaly approach”during the interpolation and included a considerable number of station observations(~2400)in China(Xu et al.,2009;Wu and Gao,2013).The monthly sensible heat flux,latent heat flux,air temperature and horizontal winds are from ERA-Interim,with a horizontal resolution of 1°×1°available after 1979(Dee et al.,2011).In addition,all datasets are confined to the period 1979–2006.Seasons are specified as:March–April–May(MAM),June–July–August(JJA),September–October–November(SON),and December–January–February(DJF).Notably,soil enthalpy sensitivities to soil moisture(or soil temperature)at the first(0.7 cm;surface soil layer)and the fifth(21.22 cm;middle soil layer)soil level are calculated for describing their changes with soil depth.
2.2.Methods
Because soil enthalpy is an integrated indicator of soil moisture and soil temperature,a multi-linear regression(MLR)approach is employed to separate the respective effects of these factors on soil enthalpy.As a result,soil enthalpy(H)can be represented as a linear function of soil moisture(w;sum of soil liquid water and soil ice)and soil temperature(T)as follows:
where w(x,y,t),T(x,y,t)and ε(x,y,t)represent soil moisture,soil temperature and the residual error at location (x, y) at time t,respectively;a(x,y)and b(x,y)are the partial regression coefficients;and σ(x,y)represents the intercept.Because of the different units between a(x,y)and b(x,y),i.e.,(MJ m?3)(mm3mm3)?1versus(MJ m?3)°C?1,it is difficult to directly compare w and T impacts on H.Therefore,Eq.(2)is non-dimensionalized as follows:
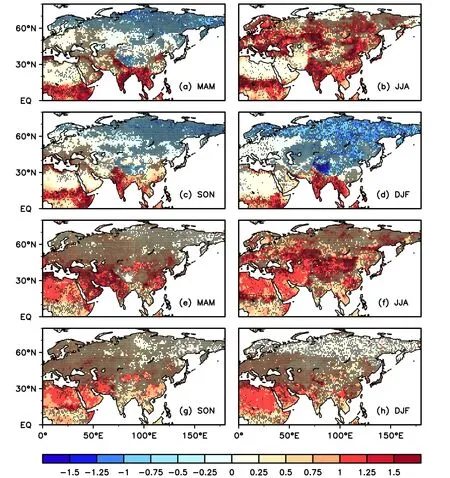
Fig.1.The MLR coefficients of H on w[a?;(a)spring;(b)summer;(c)autumn;(d)winter]and T[b?;(e)spring;(f)summer;(g)autumn;(h)winter]at the first soil level.Black dots denote the coefficients are statistically significant(p<0.05)after pre-whitening.
where SH(x,y),Sw(x,y)and ST(x,y)are the standard deviation variances of H(x,y,t),w(x,y,t)and T(x,y,t),respectively,andandare time averages.Finally,Eq.(2)can be rewritten as:
where H?(x,y,t),w?(x,y,t)and T?(x,y,t)are the standardized formations of H(x,y,t),w(x,y,t)and T(x,y,t),respectively.Through the non-dimensionalization procedure,a?(x,y)=[a(x,y)Sw(x,y)]/[SH(x,y)]and b?(x,y)=[b(x,y)ST(x,y)]/[SH(x,y)]are dimensionless,and thus can be used to compare the H sensitivities to w and T.
It should be noted that the MLR residuals usually include an autocorrelation that causes the overestimations of statistical significance if not previously removed.Therefore,following to Tung and Zhou(2010),we employ a pre-whitening procedure,which is repeated three times until most of the grids satisfy the Durbin–Watson test to ensure that the residuals are whitened.The significance level of the regression coefficients is detected using the two-tailed Student’s t-test(p=0.05).For detailed information on the pre-whitening method,readers are referred to Tung and Zhou(2010).
3.Results
3.1. Soil enthalpy sensitivities to soil moisture and soil temperature
We evaluate H sensitivities to w and T based on direction(i.e.,positive and negative)and magnitude over the Northeast Hemisphere(NEH).The signs of a?(b?),which are shown in Fig.1,represent whether H sensitivity to w(T)at the first soil level is negative or positive.Apparently,except in low latitudes and southern Europe,winter w shows a negative contribution to H over most of the NEH(Fig.1d).This may be related to the frozen soil in these regions,where more heat is required for thawing,and consequently H decreases.As shown in Figs.1a and c,the spatial distributions of a?are similar in spring and autumn,and w generally makes positive contributions to H at low latitudes and negative contributions at high latitudes.Interestingly,positive a?values are detected for an overwhelming majority of the NEH in summer,which is likely because liquid water is contained in the first soil level(Fig.1b).As expected,T shows positive contributions to H across the NEH for each season(Figs.1e–h),particularly for high latitudes in summer(Fig.1f)and low latitudes in winter(Fig.1h)with a higher a?.
To quantitatively compare H sensitivities to w and T and determine the dominant factor,the parameter|a?/b?|is estimated and illustrated in Fig.2.Basically,obvious seasonal differences are observed in the spatial distribution of|a?/b?|.In detail,the H over most of the NEH is more sensitive to w in winter(Fig.2d),especially at high latitudes,with|a?/b?|> 10,whereas smaller|a?/b?|(< 0.1)exists in southern Europe,northern Africa,western Asia and southeastern China,suggesting that H is more sensitive to T.The spatial distributions of|a?/b?|are similar in spring(Fig.2a)and autumn(Fig.2c),which generally indicates that w is more important at high latitudes but T is more important at middle latitudes.As for summer(Fig.2b),|a?/b?|≈ 1 suggests w and T play a comparable role in H over the NEH.
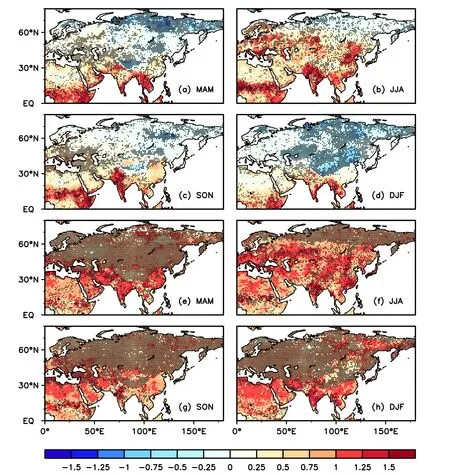
Fig.3.The MLR coefficients of H on w[a?;(a)spring;(b)summer;(c)autumn;(d)winter]and T[b?;(e)spring;(f)summer;(g)autumn;(h)winter]at the fifth soil level.Black dots denote the coefficients are statistically significant(p<0.05)after pre-whitening.
Compared to the first soil level, seasonal differences in the spatial distribution of a?are obviously smaller in the middle soil layer(Figs.3a–d).In detail,a?is negative in summer at high latitudes(Fig.3b)where soil ice still exists.However,due to the disappearance of soil ice in some midlatitude regions,the w contribution to H becomes positive,particularly in spring(Fig.3a)and autumn(Fig.3c).Relative to the results shown in Fig.1,the area with a significantly(p<0.05)positive T contribution to H apparently increases at high latitudes(Fig.3).In addition,higher a?is identified in climate transition zones,such as the Sahel and India,where a strong coupling exists between w and P(Koster et al.,2004).The analyses above imply that the MLR method can effectively distinguish the importance of w and Teffects on land surface thermal conditions.
Relative to H sensitivity in the surface soil layer,H becomes more sensitive to T in the fifth soil level with|a?/b?|<0.1(Fig.4),and the negative w contribution decreases at high latitudes,which is related to the more rapid decreases in in-terannual variabilities of w than those of T(Chen and Kumar,2004).
In particular,for areas with|a?/b?|≈ 1,land thermal variations induced by w and T are generally comparable,implying that land thermal anomalies cannot be completely captured by w or T alone.As a result,the H,as an integrated indicator involving w and T effects,can better represent land thermal variations,and thus tends to be a more effective predict and for short-term climate prediction in these identified areas.In order to further con fi rm the capability of H in seasonal climate prediction,detailed comparisons of the correla-tions of P with antecedent H,w and T are conducted in the following sections,which can provide some reference for the application of H in seasonal rainfall prediction.

Fig.4.|a?/b?|at the fifth soil level:(a)spring;(b)summer;(c)autumn;(d)winter.
3.2.Comparisons of the capabilities of H,w and T as predictands in P forecasting
Although P forecasting remains difficult,several studies have indicated that antecedent land surface anomalies can be used to predict P(Koster et al.,2004,2010;Zhang et al.,2011;Zhang and Zuo,2011;van den Hurk et al.,2012;Collow et al.,2014;Li et al.,2015).Therefore,we would like to compare the capabilities of H,w and T as predictands in P forecasting over two selected regions in China with annual|a?/b?|≈ 1[i.e.,the Huanghe-Huaihe Basin(HHB)and Southeast China(SEC);Fig.5].In order to highlight the capability of H in P prediction,we analyze the relationship between H and P at each soil layer based on the pattern correlation(detailed information below),and find that this relationship is more evident at the fifth soil layer.Therefore,the following analyses are all performed at the fifth layer.
The pattern correlations between H and P(H–P),T and P(T–P)and w and P(w–P)are compared separately as a function of the predict and month and the lags from one to six months.The color depth(Fig.6)reflects the intensity of the linkage between antecedent land surface conditions and P,i.e.,the darker the color,the closer the relationship.Overall,the pattern correlations of H–P(Figs.6a and b)are similar to those of T–P(Figs.6c and d)over both HHB and SEC,but the former are always stronger than the latter.For the w–P correlation(Figs.6e and f),it is basically weaker,except in cold months.The findings are expected and indicate that H is potentially a better local predict and for forecasting P than w and T.Overall,H has the greatest potential for predicting June P from the perspective of the magnitude and consistency(positive or negative)of the correlations;and more importantly,this consistent relationship between H and P can extend to five and six months ahead over HHB and SEC,respectively,which implies that the H anomaly has a longer memory.
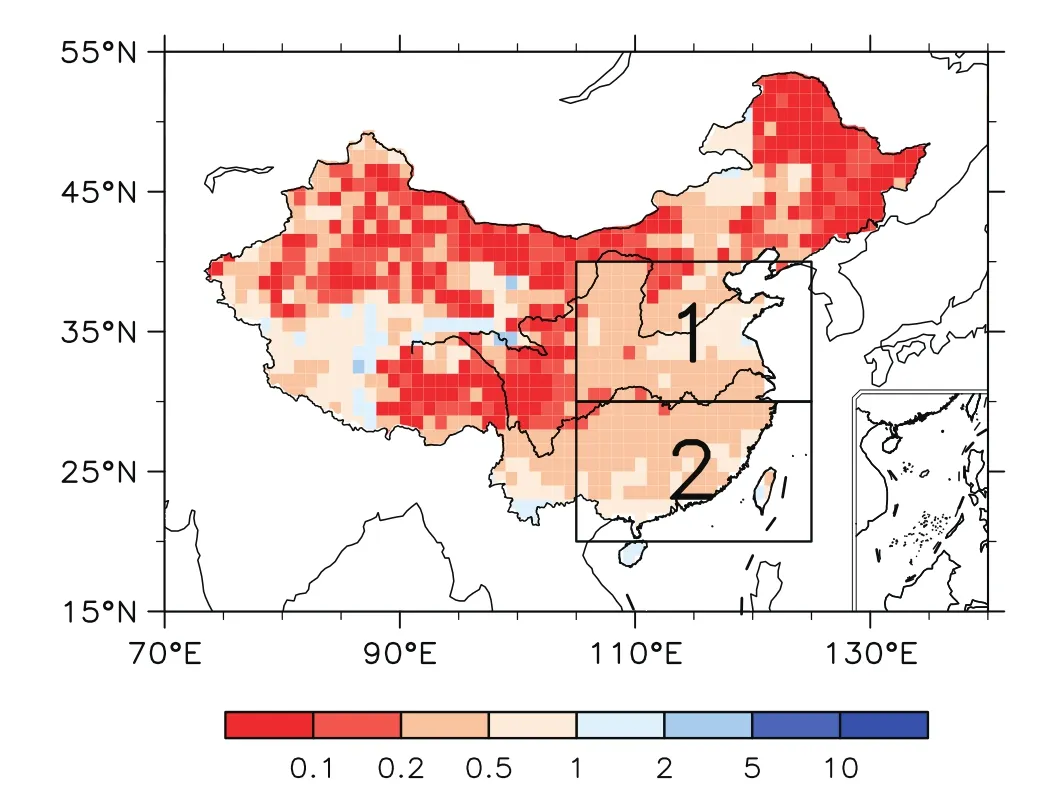
Fig.5.Annual|a?/b?|at the fifth soil level.

Fig.6.Pattern correlation over HHB(left)and SEC(right)at lags from 1 to 6 months:(a,b)H–P;(c,d)T–P;(e,f)w–P.The x-axis is the predict and’s month and the y-axis is lead time.For example,lead time=1 at month=6 is for the May–June case.

Fig.7.Temporal correlations between June P and antecedent May(a)H,(b)T and(c)w.Black dots denote regions with statistically significant(p<0.05)correlation.
The H–P correlations are statistically significant(p<0.05)in regions where H anomalies can persist over longer time.Therefore,taking May–June as an example,we would like to show detailed information about the spatial distributions of the time-lagged H–P,T–Pandw–Pcorrelations.Basically,the spatial distributions of the H–P(Fig.7a)and the T–P(Fig.7b)correlations are similar,following with significantly(p<0.05)negative and positive values over HHB and SEC,respectively,while more areas(51 grids)of the H–P correlations exceed the significance level(p<0.05)than those(33 grids)of the T–P correlations.By contrast,the spatial distribution of the w–P correlations evidently differs from those of the H–P and T–P correlations,mainly characterized by insignificantly and slightly positive values(Fig.7c).These findings are consistent with previous studies that reported w feedbacks are generally weak over wet areas,since the surface evaporation is insensitive to w(Zhang et al.,2008;Zhang and Dong,2010).To sum up,it appears to be a better choice to use H as a proxy of land surface thermal conditions for predicting P over HHB and SEC.
For further understanding the capability of H as a predict and in P prediction,May H impacts on June P are chosen to explore the possible underlying mechanisms.Firstly,singular value decomposition(SVD)analysis of H in May(the left-SVD field)and P in June(the right-SVD field)is conducted within HHB and SEC,with the linear trend of each variable removed.The first SVD mode(SVD1;Fig.8)accounts for 63.58%of the total variance,with the correlation coefficient of its expansion coefficients being 0.7(p<0.01).As seen from Fig.8a,a spatially homogeneous pattern of the left SVD1 field exists(variance contribution=49%),which strongly coincides with the first empirical orthogonal function(EOF1;not shown here)mode of H(variance contribution=54%).This indicates that a tight correspondence exists between the main abnormal changes in May H and June P,i.e.,anomalously high H in May corresponds to less PinJune over HHB but more P over SEC,and vice versa.
The spatially inhomogeneous responses of June P to May H(Fig.8b)imply that the underlying physical mechanisms may be complicated. Some studies have pointed out that summer P can be impacted by the anomalous land surface thermal conditions through their feedbacks to atmospheric circulations(Zhang and Zuo,2011;Zhang et al.,2017).Based on these conclusions,composite analyses are performed to diagnose the influence of antecedent H anomalies on the atmosphericconditions. Four positive-anomaly years(1982,1985,1994 and 1997)and four negative-anomaly years(1979,1991,1993 and 1996)of H are identified based on a threshold of 1.2 standard deviations of the left-SVD1 field time series.As depicted in Fig.9,the positive H anomalies result in more sensible and latent heat fluxes over HHB and SEC(Fig.9a),and consequently lead to significant(p<0.05)warming of the surface air temperature(Fig.9b). Notably,the land surface–induced diabatic heating dissipates with height,and significant(p<0.05)warming generally disappears near to 500 hPa(Fig.9c).
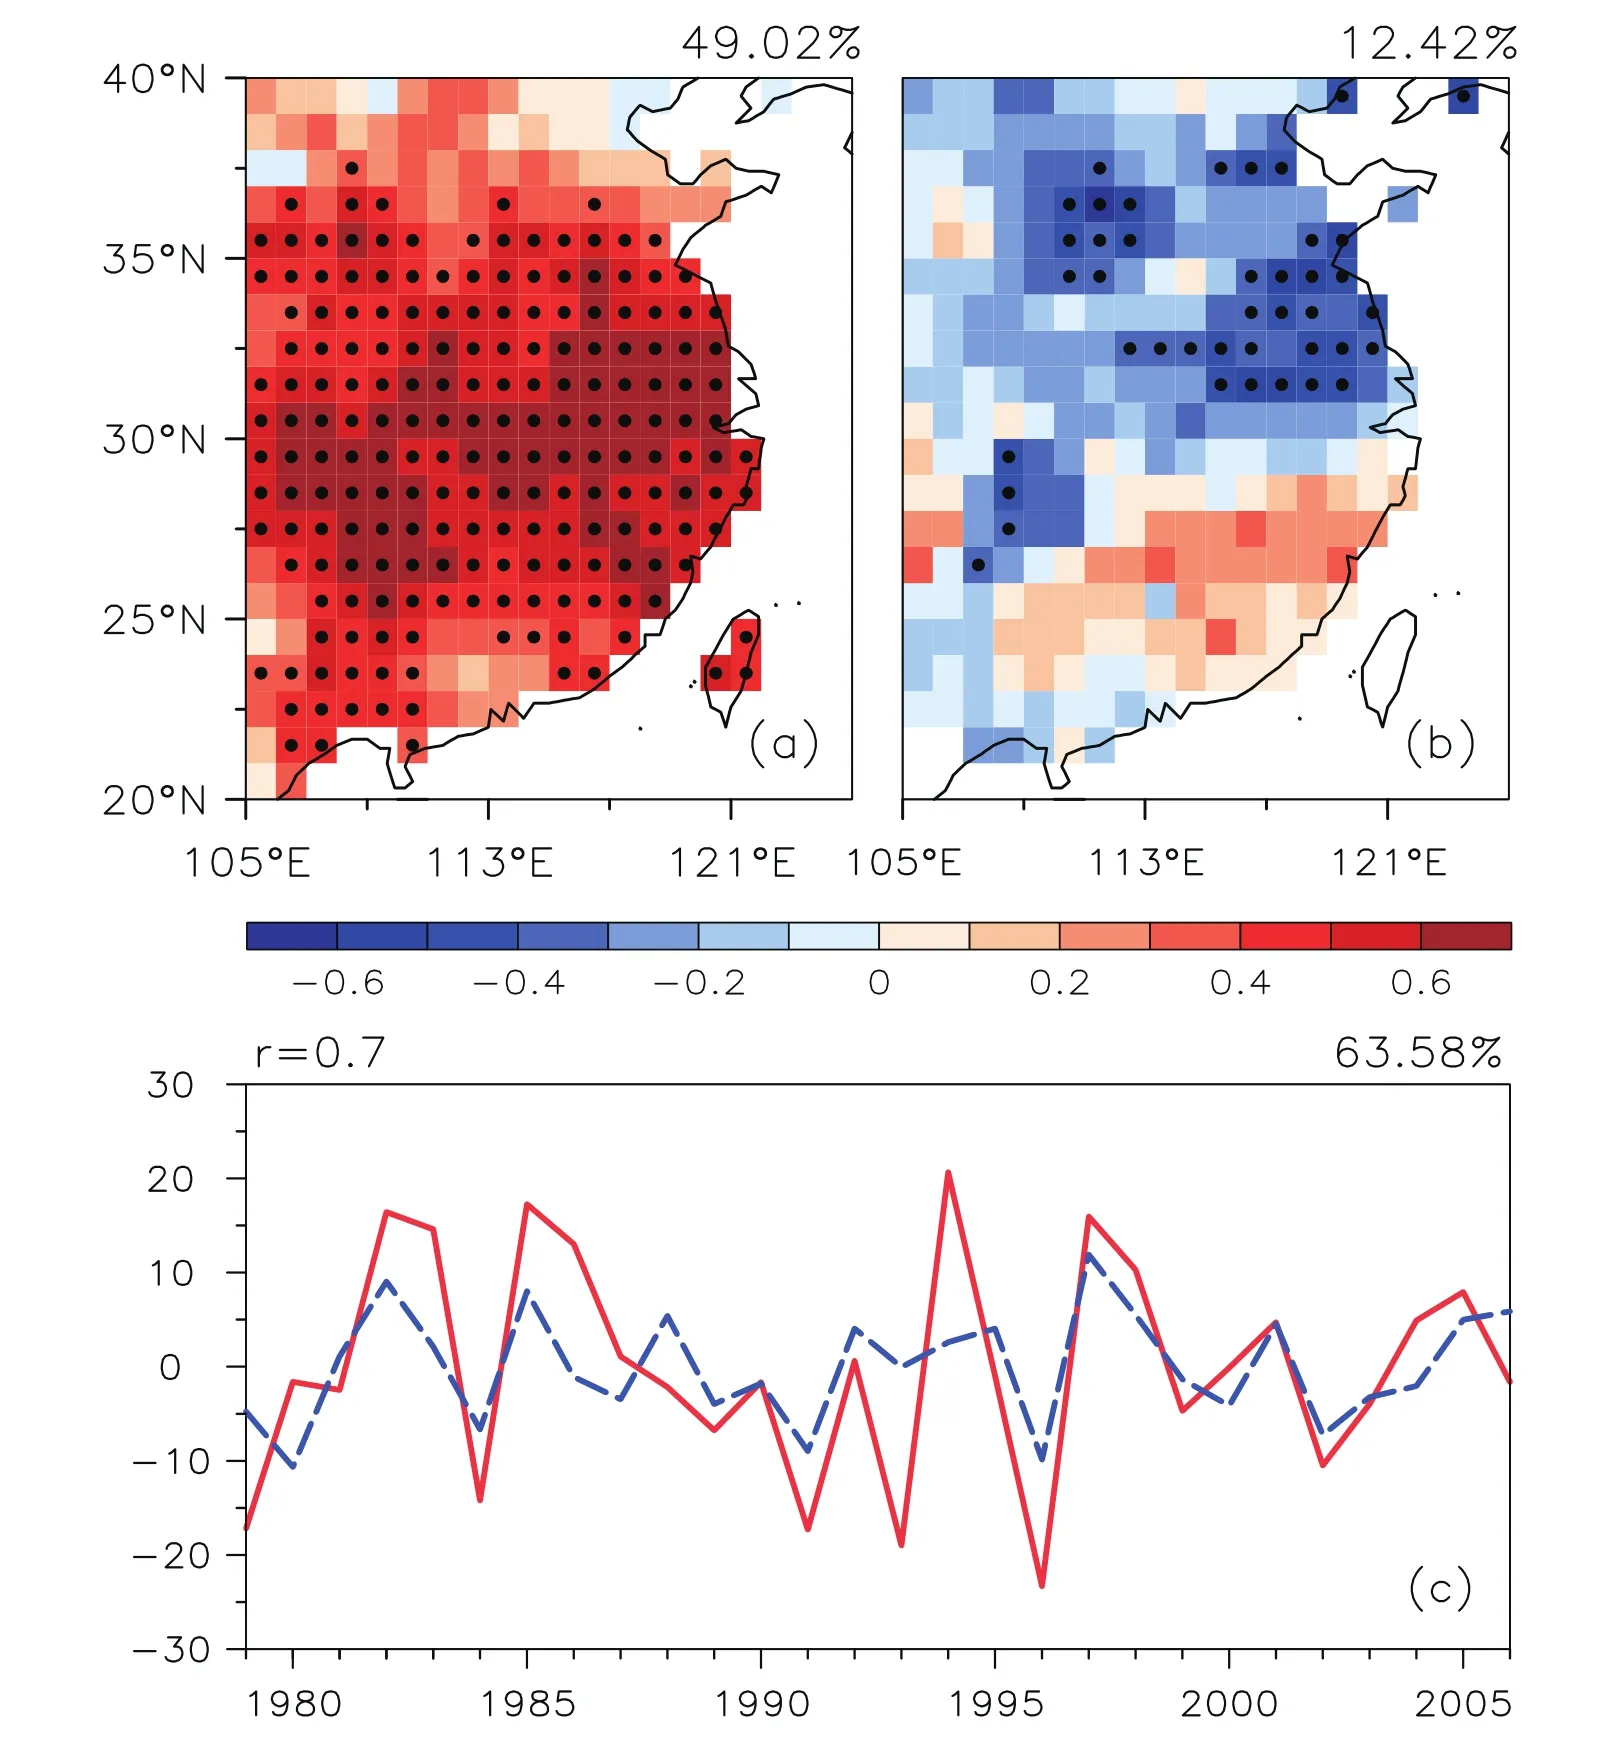
Fig.8.Heterogeneous correlation patterns of the first SVD mode between(a)May H(left field)and(b)June P(right field)and the(c)corresponding time series(red line:left field;blue line:right field).Black dots denote regions with statistically significant(p<0.05)correlation.

Fig.9.Composite differences of(a)sensible and latent heat lf uxes(units:W m?2)and(b,c)air temperature(units: °C)in May(b)at 2-m height and(c)in the latitude–height(units:hPa)profile at 115°E.Black dots and white lines denote regions with statistically significant(p<0.05)correlation.
According to the complete form of the vertical vorticity tendency equation(Wu et al.,1999;Wu,2001),local variation of vorticity in a relatively long-term evolution can be ignored,as well as horizontal and vertical advections due to their smaller magnitudes;and therefore,local meridional wind anomalies are mainly determined by the vertical profiles of the diabatic heating rate.Thus,the equation is expressed as:
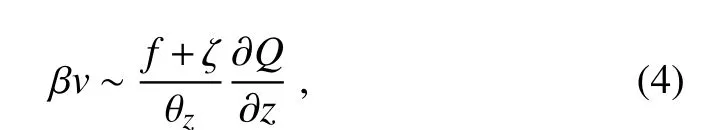
where β = ?f/?y represents the geostrophic parameter variations with latitude;f+ζ is the vertical component of absolute vorticity and usually positive on the large scale;θz= ?θ/?z is the potential temperature variations with height and typically positive on the monthly scale;and ?Q/?z represents the diabatic heating variations with height.Therefore,local northerly(southerly)wind perturbations can be excited by the negative(positive)?Q/?z.As depicted in Fig.10a,significant northerly wind anomalies indeed exist over the heating source region(i.e.,HHB and SEC),which is indicative of a weakened summer monsoon in the early summer.
A banding distribution is a distinct feature of summer P in HHB and SEC,which is mainly controlled by the advance of the summer monsoon.In June,the rain belt is usually located in the Yangtze River Basin,which is referred to as the Mei-yu.In response to the H-induced anomalous diabatic heating profile,an anomalous northerly wind tends to appear in May(Fig.10a)and persists till June(Fig.10b),weakening the summer monsoon and resulting in a southward replacement of the rain belt.Thus,less and more P occurs over HHB and SEC,respectively.
4.Discussion and conclusion
H combines the effects of both T and w on the land surface hydrothermal process,and thus comparisons of the performances of H,w and T in representing the land surface thermal status are helpful for better understanding the advantage of H as an effective land surface factor in the study of land–atmosphere interaction.In this study,we investigate the contributions of w and T to H over the NEH.At high latitudes,the w contribution to H is negative when soil contains more ice,but becomes positive after soil ice melts.The positive contribution of T to H is observed throughout the year,with the most sensitive areas at low latitudes in cold months and high latitudes in warm months.As soil depth increases,the T and w contributions to H increases and decreases,respectively.In general,H is more sensitive to w at high latitudes(shallow soil layers),but to T at low latitudes(deep soil layers).In particular,over more regions with|a?/b?|≈ 1 in summer,land surface thermal conditions can be better captured by H than w or T alone.
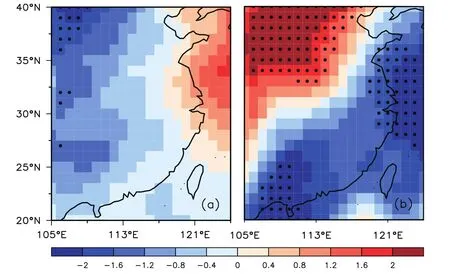
Fig.10.Composite differences of 700-hPa meridional wind(units:m s?1)in(a)May and(b)June.Black dots denote regions with statistically significant(p<0.05)correlation.
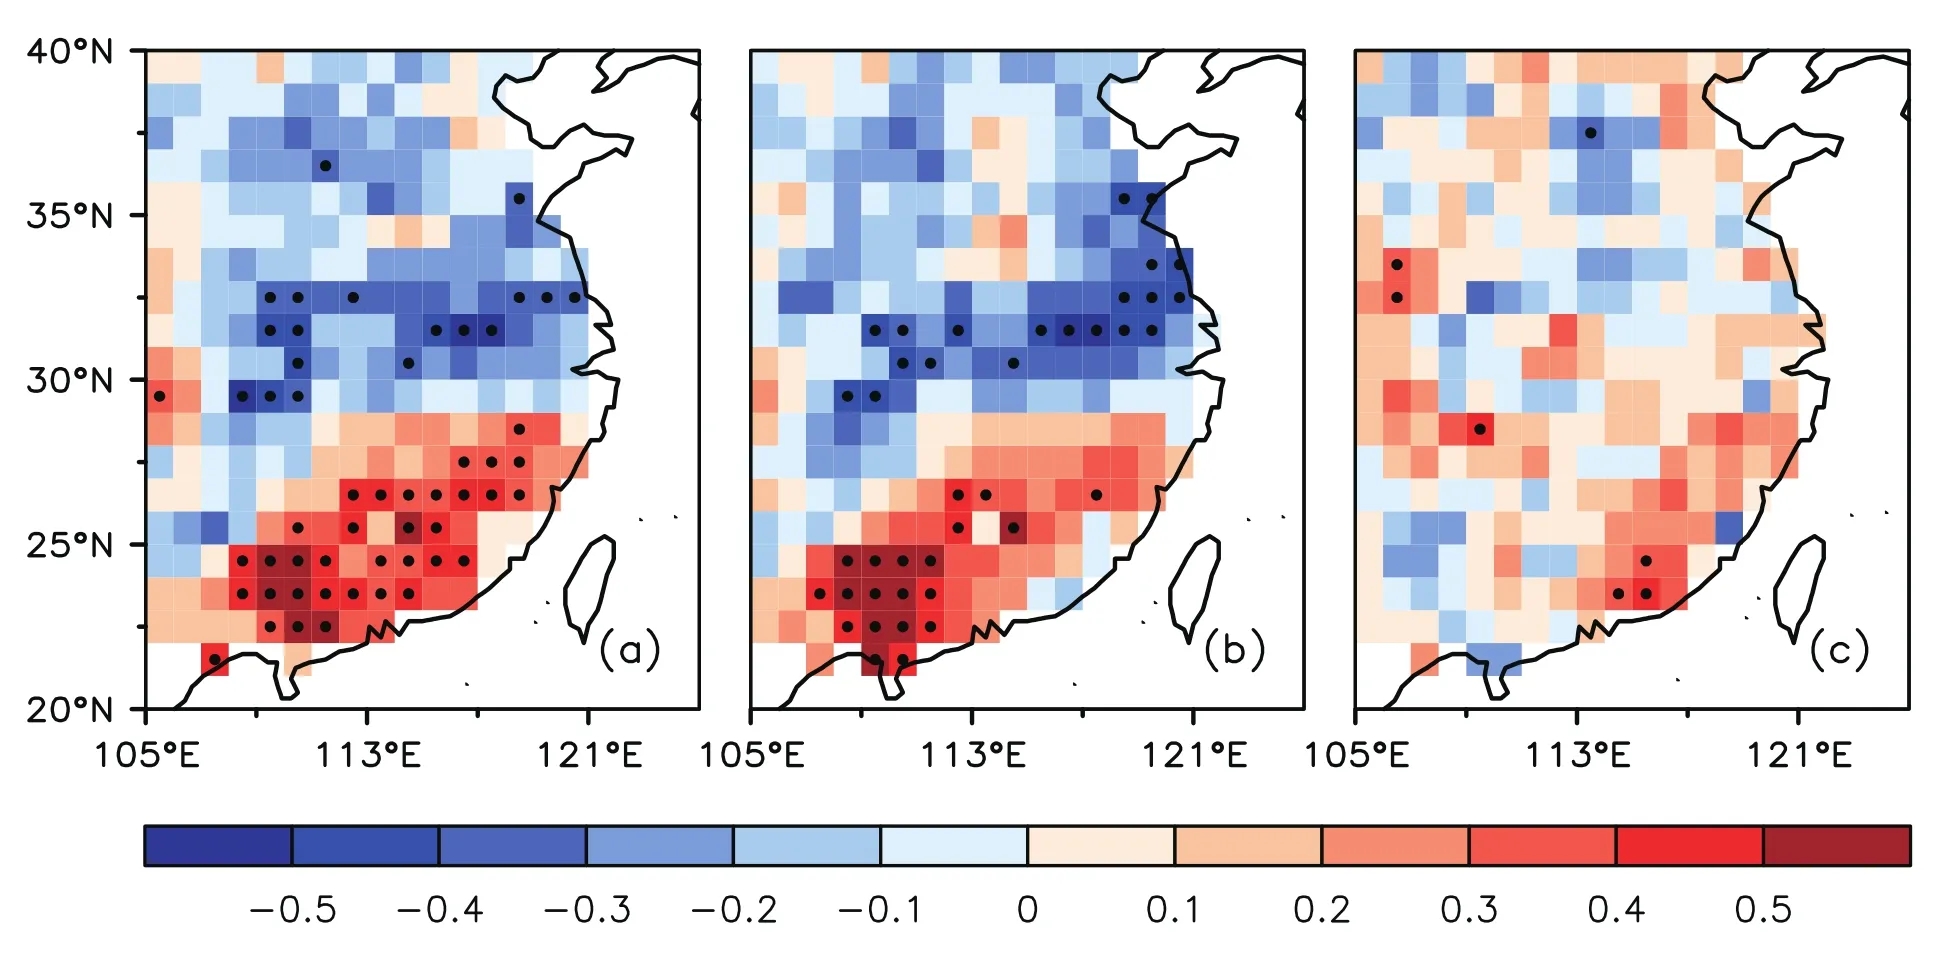
Fig.11.Temporal correlations between June P and antecedent May(a)H,(b)T and(c)w simulated from GLDAS2.0.Black dots denote regions with statistically significant(p<0.05)correlation.
H provides more effective signals for P prediction over HHB and SEC,where H is sensitive to both w and T.Results indicate that,despite similar pattern correlations,the H–P correlations are larger than those of T–P.In addition,relative to the H–P and T–P correlations,the w–P correlations are always weaker.H has the greatest potential for predicting June P from the perspective of the magnitude and consistency(positive or negative)of the correlations.Comparing the spatial distributions of the H–P,T–P and w–P correlations during May–June over HHB and SEC,more grids with significant(p<0.05)H–P correlations are detected.Predictions at monthly or longer time scales imply that H has a longer memory than T and w.The identification of such characteristics has important implications for applying H as a metric in land–atmosphere interaction studies,which are critical for designing seasonal prediction systems.
However,there are still some uncertainties in our results.For example,the land surface parameters(i.e.,soil ice,soil liquid water and soil temperature)for calculating H are from offine simulations by CLM4.0.Even though CLM4.0 has been applied extensively and validated against various assimilation datasets globally, findings derived from only one model may contain uncertainties stemming from the different structures of the selected model and different initial values.
Due to a lack of soil ice observations and reanalysis prod-ucts(e.g.,GLDAS2.0),accurate computations of H are diffi-cult.To reduce the potential uncertainties and then enhance the robustness of our results,the lagged correlations between P and antecedent soil liquid water,soil temperature and estimated soil enthalpy from CLM4.0 and GLDAS2.0 are validated over the unfrozen regions:H–P,T–P and w–P correlations over HHB and SEC for May–June.Similar to Fig.7,the H–P correlation(Fig.11a)is significantly negative over HHB and positive over SEC,with more areas(53 grids)exceeding the significance level(p<0.05)than those(40 grids)of the T–P correlation(Fig.11b),while the w–P correlation is generally weak(Fig.11c).Although the validation results show a high consistency between the results of CLM4.0 and GLDAS2.0,the potential uncertainties caused by the use of only one model’s products in the current study should still be kept in mind.Therefore,more simulations using different models and original forcings for developing ensemble datasets are needed,and a quantitative evaluation of the uncertainties induced by the model itself and initial values deserves further investigation in the future.
Another aspect of uncertainty comes from the use of the MLR method for what is a complex and nonlinear system(i.e.,the soil system).Particularly,the two explanatory variables(w and T)are highly dependent,which does not influence the establishment of the MLR model but may have introduced uncertainties in separating out their individual contributions.Although w and T are only two of the factors that control the temporal variability of H,other factors are not included in the explanatory variables,such as the soil texture and soil porosity,which have limited contributions compared with w and T.
Acknowledgements.This work was jointly supported by the National Natural Science Foundation of China(Grant Nos.41230422 and 41625019),the Special Fund for Research in the Public Interest of China(Grant No.GYHY201206017),the Natural Science Foundation of Jiangsu Province,China(Grant Nos.BK20130047 and BK20151525),the Research Innovation Program forCollegeGraduatesofJiangsuProvince(GrantNo.KYLX 0823),and a project funded by the Priority Academic Program Development of Jiangsu Higher Education Institutions.
Amenu,G.G.,P.Kumar,and X.-Z.Liang,2005:Interannual variability of deep-layer hydrologic memory and mechanisms of its influence on surface energy fluxes.J.Climate,18,5024–5045,https://doi.org/10.1175/JCLI3590.1.
Bohren,C.F.,and B.A.Albrecht,1998:Atmospheric Thermodynamics.Oxford University Press,420 pp.
Bonan,G.B.,S.Levis,L.Kergoat,and K.W.Oleson,2002:Landscapes as patches of plant functional types:An integrating concept for climate and ecosystem models.Global Biogeochemical Cycles,16,5-1–5-23,https://doi.org/10.1029/2000 GB001360.
Chen,J.,and P.Kumar,2004:A modeling study of the ENSO influence on the terrestrial energy profile in North America.J.Climate,17,1657–1670,https://doi.org/10.1175/1520-0442(2004)017<1657:AMSOTE>2.0.CO;2.
Collow,T.W.,A.Robock,and W.Wu,2014:influences of soil moisture and vegetation on convective precipitation forecasts over the United States Great Plains.J.Geophys.Res.,119,9338–9358,https://doi.org/10.1002/2014JD021454.
Davey,C.A.,R.A.Pielke,and K.P.Gallo,2006:Differences between near-surface equivalent temperature and temperature trends for the Eastern United States:Equivalent temperature as an alternative measure of heat content.Global and Planetary Change,54,19–32,https://doi.org/10.1016/j.gloplacha.2005.11.002.
Dee,D.P.,and Coauthors,2011:The ERA-Interim reanalysis:configuration and performance of the data assimilation system.Quart.J.Roy.Meteor.Soc.,137,553–597,https://doi.org/10.1002/qj.828.
Dirmeyer,P.A.,M.J.Fennessy,and L.Marx,2003:Low skill in dynamical prediction of boreal summer climate:Grounds for looking beyond sea surface temperature.J.Climate,16,995–1002,https://doi.org/10.1175/1520-0442(2003)016<0995:LSIDPO>2.0.CO;2.
Guo,W.D.,and S.F.Sun,2002:Preliminary study on the effects of soil thermal anomaly on land surface energy budget.Acta Meteorologica Sinica,60,706–714,https://doi.org/10.3321/j.issn:0577-6619.2002.06.008.(in Chinese)
Hu,Q.,and S.Feng,2004:A role of the soil enthalpy in land memory.J.Climate,17,3633–3643,https://doi.org/10.1175/1520-0442(2004)017<3633:AROTSE>2.0.CO;2.
Hua,W.J.,H.S.Chen,S.G.Zhu,S.L.Sun,M.Yu,and L.M.Zhou,2013:Hotspots of the sensitivity of the land surface hydrological cycle to climate change.Chinese Science Bulletin,58,3682–3688,https://doi.org/10.1007/s11434-013-5846-7.
Koster,R.D.,and Coauthors,2004:Regions of strong coupling between soil moisture and precipitation.Science,305,1138–1140,https://doi.org/10.1126/science.1100217.
Koster,R.D.,and Coauthors,2010:Contribution of land surface initialization to subseasonal forecast skill:First results from a multi-model experiment.Geophys.Res.Lett.,37,L02402,https://doi.org/10.1029/2009GL041677.
Lawrence,D.M.,and A.G.Slater,2008:Incorporating organic soil into a global climate model.Climate Dyn.,30,145–160,https://doi.org/10.1007/s00382-007-0278-1.
Lawrence,D.M.,andCoauthors,2011:Parameterization improvements and functional and structural advances in Version 4 of the Community Land Model.Journal of Advances in Modeling Earth Systems,3,M03001,https://doi.org/10.1029/2011 MS00045.
Li,Z.X.,T.J.Zhou,H.S.Chen,D.H.Ni,and R.-H.Zhang,2015:Modelling the effect of soil moisture variability on summer precipitation variability over East Asia.International Journal of Climatology,35,879–887,https://doi.org/10.1002/joc.4023.
Liu,Z.Y.,2010:Bimodality in a monostable climate-ecosystem:The role of climate variability and soil moisture memory.J.Climate,23,1447–1455,https://doi.org/10.1175/2009 JCLI3183.1.
Mahanama,S.P.P.,R.D.Koster,R.H.Reichle,and M.J.Suarez,2008:Impact of subsurface temperature variability on surface air temperature variability:An AGCM study.Journal of Hydro meteorology,9,804–815,https://doi.org/10.1175/2008 JHM949.1.
Murray,E.J.,2002:An equation of state for unsaturated soils.Canadian Geotechnical Journal,39,125–140,https://doi.org/10.1139/t01-087.
Oleson,K.W.,and Coauthors,2010:Technical Description of Version 4.0 of the Community Land Model(CLM).NCAR Technical Note.NCAR/TN-478+STR.
Pielke,R.A.,2003:Heat storage within the earth system.Bull.Amer.Meteor.Soc.,84,331–335,https://doi.org/10.1175/BAMS-84-3-331.
Qian,B.D.,E.G.Gregorich,S.Gameda,D.W.Hopkins,and X.L.Wang,2011:Observed soil temperature trends associated with climate change in Canada.J.Geophys.Res.,116,D02106,https://doi.org/10.1029/2010JD015012.
Seneviratne,S.I.,T.Corti,E.L.Davin,M.Hirschi,E.B.Jaeger,I.Lehner,B.Orlowsky,and A.J.Teuling,2010:Investigating soil moisture-climate interactions in a changing climate:A review.Earth-Science Reviews,99,125–161,https://doi.org/10.1016/j.earscirev.2010.02.004.
Sheffield,J.,G.Goteti,and E.F.Wood,2006:Development of a 50-year high-resolution global dataset of meteorological forcings for land surface modeling.J.Climate,19,3088–3111,https://doi.org/10.1175/JCLI3790.1.
Sun,S.F.,2005:Parameterization Study of Physical and Biochemical Mechanism and Parameter Model of Land Surface Process.China Meteorology Press,307 pp.(in Chinese)
Tang,M.C.,and E.R.Reiter,1986:The similarity between the maps of soil temperature and precipitation anomaly of the subsequent season.Plateau Meteorology,5,293–307.(in Chinese)
Tung,K.-K.,and J.S.Zhou,2010:The Pacific’s response to surface heating in 130 Yr of SST:La Ni?a-like or El Ni?o-like?J.Atmos.Sci.,67,2649–2657,https://doi.org/10.1175/2010 JAS3510.1.
van den Hurk,B.,F.Doblas-Reyes,G.Balsamo,R.D.Koster,S.I.Seneviratne,and H.Camargo Jr.,2012:Soil moisture effects on seasonal temperature and precipitation forecast scores in Europe.Climate Dyn.,38,349–362,https://doi.org/10.1007/s00382-010-0956-2.
Wang,Y.H.,W.Chen,J.Y.Zhang,and D.Nath,2013:Relationship between soil temperature in May over Northwest China and the East Asian summer monsoon precipitation.Acta Meteorologica Sinica,27,716–724,https://doi.org/10.1007/s13351-013-0505-0.
Wu,G.X.,2001:Comparison between the complete-form vorticity equation and the traditional vorticity equation.Acta Meteorologica Sinica,59,385–392,https://doi.org/10.11676/qxxb2001.042.(in Chinese)
Wu,G.X.,Y.M.Liu,and P.Liu,1999:The effect of spatially nonuniform heating on the formation and variation of sub tropical high I:Scale analysis.Acta Meteorologica Sinica,57,257–263,https://doi.org/10.11676/qxxb1999.025.(in Chinese)
Wu,J.,and X.J.Gao,2013:A gridded daily observation dataset over China region and comparison with the other datasets.Chinese Journal of Geophysics,56,1102–1111,https://doi.org/10.6038/cjg20130406.(in Chinese)
Wu,L.Y.,and J.Y.Zhang,2014:Strong subsurface soil temperature feedbacks on summer climate variability over the arid/semi-arid regions of East Asia.Atmospheric Science Letters,15,307–313,https://doi.org/10.1002/asl2.504.
Wu,W.R.,and R.E.Dickinson,2004:Time scales of layered soil moisture memory in the context of land-atmosphere interaction.J.Climate,17,2752–2764,https://doi.org/10.1175/1520-0442(2004)017<2752:TSOLSM>2.0.CO;2.
Xu,Y.,X.J.Gao,Y.Shen,C.H.Xu,Y.Shi,and F.Giorgi,2009:A daily temperature dataset over China and its application in validating a RCM simulation.Adv.Atmos.Sci.,26,763–772,https://doi.org/10.1007/s00376-009-9029-z.
Xue,Y.K.,R.Vasic,Z.Janjic,Y.M.Liu,and P.C.Chu,2012:The impact of spring subsurface soil temperature anomaly in the western U.S.on North American summer precipitation:A case study using regional climate model downscaling.J.Geophys.Res.,117,D11103,https://doi.org/10.1029/2012JD017692.
Yang,K.,and J.Y.Zhang,2016:Spatiotemporal characteristics of soil temperature memory in China from observation.Theor.Appl.Climatol.,126,739–749,https://doi.org/10.1007/s00704-015-1613-9.
Zhang,J.Y.,and W.J.Dong,2010:Soil moisture influence on summertime surface air temperature over East Asia.Theor.Appl.Climatol.,100,221–226,https://doi.org/10.1007/s00704-009-0236-4.
Zhang,J.Y.,and L.Y.Wu,2014:Impacts of Land-Atmosphere Interactions on Climate over East China.China Meteorological Press,138 pp.(in Chinese)
Zhang,J.Y.,W.-C.Wang,and J.F.Wei,2008:Assessing landatmosphere coupling using soil moisture from the Global Land Data Assimilation System and observational precipitation.J.Geophys.Res.,113,D17119,https://doi.org/10.1029/2008JD009807.
Zhang,J.Y.,L.Y.Wu,and W.J.Dong,2011:Land-atmosphere coupling and summer climate variability over East Asia.J.Geophys.Res.,116,D05117,https://doi.org/10.1029/2010 JD014714.
Zhang,R.H.,and Z.Y.Zuo,2011:Impact of spring soil moisture on surface energy balance and summer monsoon circulation over East Asia and precipitation in East China.J.Climate,24,3309–3322,https://doi.org/10.1175/2011JCLI4084.1.
Zhang,R.N.,R.H.Zhang,and Z.Y.Zuo,2017:Impact of Eurasian spring snow decrement on east Asian summer precipitation.J.Climate,30,3421–3437,https://doi.org/10.1175/JCLI-D-16-0214.1.
Zhang,Z.Q.,X.J.Zhou,W.L.Li,and M.Sparrow,2003:Calculation of the energy budget for heterogeneous land surfaces.Earth Interactions,7,1,https://doi.org/10.1175/1087-3562(2003)007<0001:COTEBF>2.0.CO;2.
Zhu,S.G.,H.S.Chen,and J.Zhou,2013:Simulations of global land surface conditions in recent 50 years with three versions of NCAR Community Land Models and their comparative analysis.Transactions of Atmospheric Sciences,36,434–446,https://doi.org/10.3969/j.issn.1674-7097.2013.04.006.(in Chinese)
 Advances in Atmospheric Sciences2018年4期
- Advances in Atmospheric Sciences的其它文章
- Validation and Spatiotemporal Distribution of GEOS-5–Based Planetary Boundary Layer Height and Relative Humidity in China
- Effects of Sea-Surface Waves and Ocean Spray on Air–Sea Momentum Fluxes
- Evaluation of TIGGE Ensemble Forecasts of Precipitation in Distinct Climate Regions in Iran
- Large-scale Circulation Control of the Occurrence of Low-level Turbulence at Hong Kong International Airport
- Variations in High-frequency Oscillations of Tropical Cyclones over the Western North Pacific
- Idealized Experiments for Optimizing Model Parameters Using a 4D-Variational Method in an Intermediate Coupled Model of ENSO