
Observation and modeling of tide-and wind-induced surface currents in Galway Bay
2015-01-16 01:21:24LeiRenStephenNashMichaelHartnett
Water Science and Engineering 2015年4期
Lei Ren*,Stephen Nash,Michael Hartnett
Department of Civil Engineering,College of Engineering and Informatics,National University of Ireland,Galway,Ireland
Observation and modeling of tide-and wind-induced surface currents in Galway Bay
Lei Ren*,Stephen Nash,Michael Hartnett
Department of Civil Engineering,College of Engineering and Informatics,National University of Ireland,Galway,Ireland
A high-frequency radar system has been deployed in Galway Bay,a semi-enclosed bay on the west coast of Ireland.The system provides surface currents with fne spatial resolution every hour.Prior to its use for model validation,the accuracy of the radar data was verifed through comparison with measurements from acoustic Doppler current proflers(ADCPs)and a good correlation between time series of surface current speeds and directions obtained from radar data and ADCP data.Since Galway Bay is located on the coast of the Atlantic Ocean,it is subject to relatively windy conditions,and surface currents are therefore strongly wind-driven.With a view to assimilating the radar data for forecasting purposes,a three-dimensional numerical model of Galway Bay,the Environmental Fluid Dynamics Code(EFDC),was developed based on a terrain-following vertical(sigma)coordinate system.This study shows that the performance and accuracy of the numerical model,particularly with regard to tide-and wind-induced surface currents,are sensitive to the vertical layer structure.Results of fve models with different layer structures are presented and compared with radar measurements.A variable vertical structure with thin layers at the bottom and the surface and thicker layers in the middle of the water column was found to be the optimal layer structure for reproduction of tide-and wind-induced surface currents.This structure ensures that wind shear can properly propagate from the surface layer to the sub-surface layers,thereby ensuring that wind forcing is not overdamped by tidal forcing.The vertical layer structure affects not only the velocities at the surface layer but also the velocities further down in the water column.
Wind-induced surface current;Vertical layer structure;High-frequency radar;Coastal ocean dynamics application radar;Environmental fuid dynamics code;Galway Bay
1.Introduction
High-frequency(HF)radar systems are increasingly being used to measure surface currents in coastal areas. Since the sea surface is quite dynamic,it is necessary to ensure the measurement quality of such systems before using them for other purposes.The more traditional methodof measurement of coastal currents uses acoustic Doppler current proflers(ADCPs),which give current velocities at various depths throughout the water column.Both data sources are extremely useful for the validation of numerical models as well as for the verifcation of the accuracy of measured data.
Mau et al.(2007)used Coastal Ocean Dynamics Applications Radar(CODAR)data to validate their numerical model by comparing measured and modeled M2 tidal ellipses in the New York Bight and Block Island Sound.They also used ADCP measurements at fve sites to validate the modeled vertical velocity profles.Their models reproduced well the regional tidal fow pattern as well as the vertical tidal velocity structure.Liu et al.(2010)compared the HF radar and ADCPradial currents at low wave energy.It was found that the values of the root mean square error(RMSE)between the HF radar data and ADCP radials were reduced when the signifcant wave height was less than 0.3 m.Ebuchi et al.(2006) compared HF radar data with measurements collected by shipboard ADCPs.It was found that,owing to the depth of the shipboard ADCPs,the wind drift obtained by shipboard ADCPs was considered to be much weaker than the HF radar measurements,and comparison of zonal and meridional velocities showed reasonable agreement.Teague et al.(2001) compared the near-surface currents measured by multifrequency radars and ADCPs at several locations.In their study,four different radar wavelengths were used to examine the vertical structure of the currents.It was concluded that currents from HF radars and ADCPs were highly correlated and showed similar behavior with depth.Kelly et al.(2002, 2003)compared HF radar data with ADCP measurements on the West Florida Shelf.They found that the surface currents along the shelf measured by HF radars were around 30% larger than the measurements from ADCPs according to the standard deviation and linear regression slopes.Yoshikawa et al.(2007)studied the structure of wind-driven fow in the Tsushima Strait by analyzing the ADCP measurements and HF radar data.They found that wind-driven fow was balanced with wind stress after 11-13 h,half of the inertial period at their study latitude.
Kuang et al.(2012)used abundant CODAR measurements to assessthefdelityofsurfacecurrentsfromacoastaloceanmodel. They compared the vector maps of the mean surface current obtained from the numerical model and CODAR.They found that the model and CODAR obtained the correct mean fow pattern,andboththemodelandCODARsurfacecurrentsshowed strong currents fowing out of the eastern end of Long Island Sound.Inordertofurthervalidatethemodel,theyalsocompared the M2 tidal ellipses in the Middle Atlantic Bight obtained from the model and CODAR,and found that the modeled ellipses agreed with measurements for all 16 sites.O'Donncha et al. (2015)also used CODAR and ADCP measurements to characterize the circulation patterns of surface currents.
Accurate forecasting of surface currents in Galway Bay is highly important to marine renewable energy extraction and search and rescue operations.In this study,currents in Galway Bay on the west coast of Ireland were observed using HF radars and ADCPs at a fxed location.The surface current speeds and directions obtained from HF radars and ADCPs were compared.The currents were also modeled using the three-dimensional(3D)Environmental Fluid Dynamics Code (EFDC).The modeled surface currents were compared with HF radar measurements.Models with different vertical layer structures were run,and their accuracy was assessed using the vertical current profles measured by ADCPs and the surface currents recorded by HF radars.
2.Galway Bay and observed current velocities
2.1.Description of Galway Bay
Galway Bay is located on the west coast of Ireland,with the bay entrance opening to the Northeast Atlantic Ocean.The bay is semi-enclosed as it is partially shielded from the harsh Atlantic conditions by three islands called the Aran Islands. The water depth of the inner bay covered by CODAR is in the range of 10-40 m.Meteorological conditions in Galway Bay are mainly infuenced by the Atlantic weather system.The bay is bounded approximately by latitudes from 53°N to 53°18′N and longitudes from 8°54′W to 9°42′W.Fig.1 shows Galway Bay and the locations of the measurement instruments,whereC1andC2are Mutton Island and Spiddal HF radar stations, respectively,Ais the ADCP measurement site,Tis the tidal gauge,and the red rectangular domain is the area of comparison of the mean surface currents.
2.2.CODAR
The CODAR system is a type of portable,land-based HF radar system that can measure the near-surface ocean currents in a coastal area(Kaplan et al.,2005).The measurements obtained from the CODAR system are nearly real-time.The rough ocean surface information is obtained by the radar signal,which scatters in many directions.When the radar signal scatters off a wave whose wavelength is exactly equal to half of the transmitted signal wavelength(Wang et al.,2004; Haus et al.,2000),the radar signal can return measurement information.A single HF radar station,or mast,only determines the radial component of the surface current relative to that station.Total surface current velocities can be computed and displayed as vector maps through combination of the radial velocity components of surface current from two or more different masts.The CODAR system can provide rich datasets,which can be used to explore the dynamic process of surface currents(Paduan and Washburn,2013).
CODAR data have had a wide range of applications in recent years,and they have been used to generate animations of the surface current circulation,to investigate tidal processes and generation of eddies in the coastal ocean,to validate numerical models(Paduan et al.,2006),to improve model forecasting by assimilating available observations into models (Gopalakrishnan,2008),and to provide useful information for marine ecology(Paduan and Washburn,2013).
There are two CODAR SeaSonde HF radar stations in the CODAR system of Galway Bay:Mutton Island Station(C1in Fig.1),located at Mutton Island Waste Water Treatment Plant, and Spiddal Station(C2in Fig.1),located at Spiddal Pier.The CODAR system is able to compile surface current maps for theinner bay area at a spatial resolution of 300 m and a temporal resolution of 60 min.The radar bandwidth is 500 kHz at both stations.The centerfrequenciesare 26.425 MHz and 24.640 MHz for the Mutton Island Station and Spiddal Station, respectively.Depending on the roughness of the ocean surface, thecoveragedomainvariesovertime,andsotemporalandspatial gapscanexistintheoutput.Fig.2showsthesurfacecurrentmap measured by CODAR at 9:00 on Julian Day 220,2013.
2.3.ADCP
A bed-mounted ADCP was deployed in Galway Bay at locationAin Fig.1.The frequency of the ADCP was 600 kHz. Time series of current speed and direction on vertical layers were recorded.The water depth was about 20 m at the measurement site.The ADCP measured currents over 2-m depth increments.The area 3.2 m beneath the surface cannot be measured due to the side lobe interference area with the 2-m depth cells.Data were recorded every 60 min and the measurement period was from 0:00 on Julian Day 212,2013 to 0:00 on Julian Day 335,2013.
2.4.Quality control
In order to improve the measurement precision,quality control was undertaken before comparison.The recorded data from CODAR were fltered before results were output.The extreme values,which were greater than 100 cm/s,were not recorded.The standard deviation(SD)of surface velocity components was also provided in the output fle.
Owingtothecomplicatedseasurfaceconditions,thetoplayer current measured by ADCPs was very noisy.Low-water level (LWL)current was used to calibrate CODAR data.In order to compare vertical current profles from models and ADCPs,the top layer current from the ADCPs was low-pass fltered.
2.5.Comparison of measured data
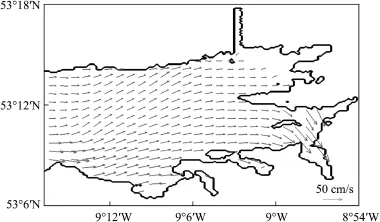
Fig.2.Vector map of surface current measured by CODAR at 9:00 on Julian Day 220,2013.
A comparison of time series of surface current speed and direction measured by CODAR and ADCP at locationAis shown in Fig.3,where the time period for comparison is from 0:00 on Julian Day 231,2013 to 0:00 on Julian Day 237,2013. Both the speeds and directions show strong correlation, providing confdence in the accuracy of the measured datasets. It was important to establish this confdence before using the measured data for validation of the numerical model.
3.Development of numerical model
3.1.Model description
The numerical modeling code EFDC was used to simulate the hydrodynamic circulation of Galway Bay.EFDC was developed at the Virginia Institute of Marine Science and is currently supported by the U.S.Environmental Protection Agency(EPA)(Hamrick,1992).It comprises four linked modules:hydrodynamic,water quality and eutrophication, sediment transport,and toxic chemical transport modules(Zou et al.,2006;Jin and Ji,2004).Only the hydrodynamic module was used for this study.This module solves the threedimensional,vertically hydrostatic,free surface,turbulent averaged equations of motion for a variable-density fuid.The model uses a sigma vertical coordinate system and either regular or curvilinear,orthogonal,horizontal coordinates.The model has been used in a variety of modeling studies.
The model was applied to the domain shown in Fig.1 using a horizontally regular grid coordinate system.A 150 m horizontal spatial resolution was employed,yielding 380×241 grid cells.The temporal resolution in the model was 3 s.Themodel was run to simulate the time period from 0:00 on Julian Day 211,2013 to 0:00 on Julian Day 231,2013.
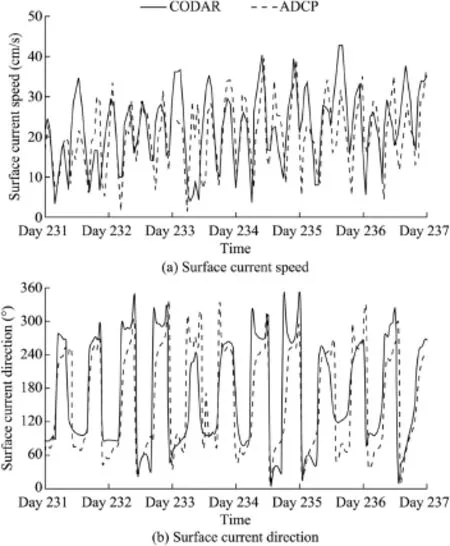
Fig.3.Comparison of time series of surface current speed and direction obtained from CODAR and ADCP.
3.2.Vertical layer structure
EFDC uses a sigma vertical coordinate system where the number of vertical layers is the same at all horizontal locations in the model grid(Hamrick,2006).The transformation formula is expressed in the following way(Kelly et al.,2002):
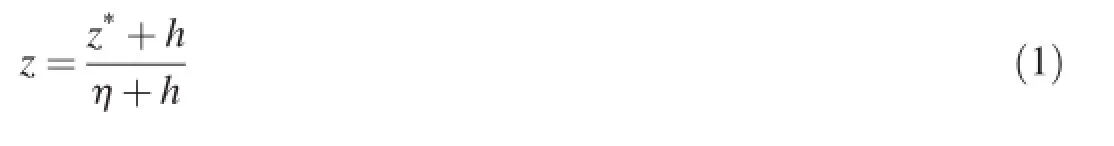
wherez*is the physical vertical coordinate,or Cartesian coordinate;his the depth of the water column;η is the free surface elevation;andzis the stretched,dimensionless vertical coordinate,or sigma coordinate,withz=0(z*=-h)representing the bottom topography,andz=1(z*=η)representing the free surface.EFDC utilizes external-internal mode splitting to solve the horizontal momentum equations and continuity equation on a staggered grid.In the internal mode, horizontal velocity components on every layer are solved.The following equations make it possible to remove a degree of freedom from total momentum equations in the vertical direction to form the external mode equations(Hamrick,1992, 2006):

where Δkis the thickness of thekth vertical layer(k=1 is the bottom layer closest to the seabed),Kis the number of vertical layers,ukandvkare the east-west(xdirection)and north-south (ydirection)components of the horizontal velocity on thekth layer,respectively,and an over bar indicates an average over the depth of the water column.
Eqs.(2)and(3)show that the magnitude of the horizontal velocity components on every layer are dependent on the layer thicknesses.Model results indicated that the accuracy of the surface currents and the vertical velocity profles were highly sensitive to the vertical layer structure(Hamrick,1992).To test the sensitivity of the model to the vertical layer structure, fve models with different vertical layer structures were developed.For consistency,all fve models had ten vertical layers.In the models,a vertical layer thickness is specifed as the ratio of the vertical layer height to the total water column height,such that the sum of all layers'thicknesses is 1.0.To maintain the same relative infuence of wind and bottom roughness across all models,a surface layer thickness of 1%of the total water column height and a bottom layer thickness of 2%of the total water column height were employed in all models.The thickness of the other layers varied among the fve models,as shown in Table 1.
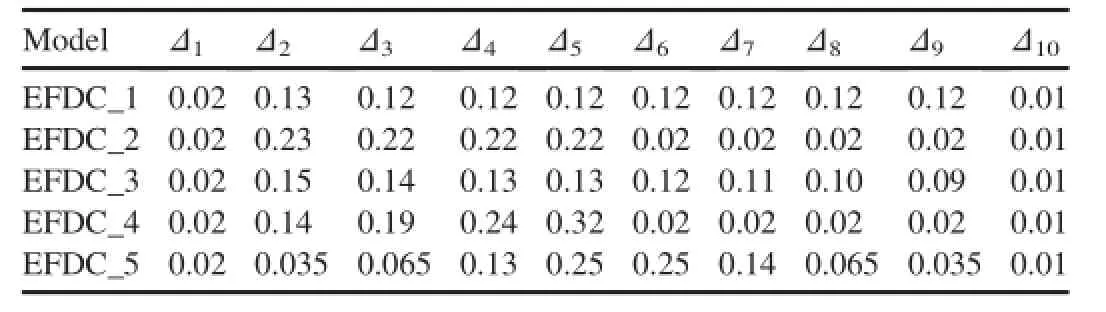
Table 1 Vertical layer thicknesses for fve models.
3.3.Wind stress
Wind forcing in EFDC is treated as a surface stress computed as follows:

where τxzand τyzare the surface shear stresses in thexandydirections,respectively;UwandVware thexandycomponents of the wind velocity 10 m above the water surface,respectively;andkwis a wind stress coeffcient.The model's ability to simulate wind-induced surfacecurrents is obviously dependent on Eqs.(4)and(5)and on the formulation ofkwin particular.Previous studies by Nagle(2013)and Wen(1995) found that best model results were achieved for Galway Bay when a constantkwof 2.6×10⁻⁶was used.The same value was employed for the present study.
3.4.Input data
The meteorological data(temperature,rain,solar radiation, and relative humidity)were obtained from a weather station located at National University of Ireland,in Galway(http:// weather.nuigalway.ie/).Flow data from the River Corrib, which enters Galway Bay to the north of pointC1in Fig.1, were obtained from the Offce of Public Works(http://www. opw.ie/hydro/).
Oregon State University Tidal Prediction Software(OTPS) provides water level time series on the western and southern open boundaries in the model(Egbert and Erofeeva,2002; Padman and Erofeeva,2004).In order to validate the tidal forcing on open boundaries,time series of water level at locationTobtained from the EFDC model were compared with tidal gauge measurements during the stable simulation period.The simulated results from EFDC showed agreement with tidal gauge measurements,as shown in Fig.4,where the time period for comparison is from 0:00 on Julian Day 217, 2013 to 0:00 on Julian Day 230,2013.
Wind data for the model were obtained from the Mace Head meteorological station,which is located on the coast to the west of the model domain.In order to run the model with Eqs.(4)and(5),the original Mace Head wind data were fltered,and we set the value at 12 m/s if the original wind speed was greater than 12 m/s.The wind direction used in our model was the same as in the original Mace Head wind data.
某精神專科醫(yī)院115例新的藥品不良反應(yīng)的回顧性分析…………………………………………………… 莊紅艷等(23):3259

Fig.5 shows the wind speed and direction specifed for the model.
4.Results
4.1.Comparison of surface velocity
To demonstrate the infuence of vertical layer confguration on model performance,surface current speeds at pointAobtained from fve EFDC models were compared with CODAR measurements,asshowninFig.6,wherethecomparisonperiod was from 0:00 on Julian Day 220,2013 to 0:00 on Julian Day 230,2013.Fig.6 indicates that the surface current speeds of model EFDC_5 are close to the CODAR measurements.Model EFDC_2 showed a largeRMSEvalue of 17.18 cm/s at locationAduring our research period,and the values for models EFDC_4 and EFDC_5 were lower,6.35 cm/s and 6.39 cm/s, respectively.
In order to further investigate the infuence of the vertical layer structure on modeled surface currents,the values ofRMSEbetween the modeled and measured surface velocity components were calculated,as shown in Table 2,whereRMSEuis theRMSEbetween the surface velocities in thexdirection obtained from the model and CODAR,andRMSEvis theRMSEbetween the surface velocities in theydirection obtained from the model and CODAR.Modeled surface currents were frst averaged in time to match the hourly temporal resolution of the CODAR data.The values ofRMSEbetween the model and measured data were then computed across the full CODAR domain and averaged spatially to obtain a singleRMSEat each measurement location.The time period forRMSEcalculation was the same as that shown in Fig.6.

Fig.5.Time series of wind speed and direction specifed for model.
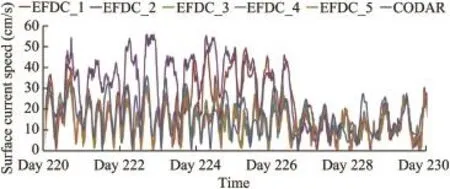
Fig.6.Comparison of surface current speeds at pointAobtained from EFDC models and CODAR.
For the surface velocity componentu,model EFDC_5 is optimal,with a minimumRMSEuof 13.08 cm/s.For the surface velocity componentv,model EFDC_4 has the lowestRMSEv,and EFDC_5 has a relatively lowRMSEvvalue compared with models EFDC_1,EFDC_2 and EFDC_3.The values ofRMSEvof EFDC_4 and EFDC_5 are very close to one another.Overall,model EFDC_5 appears to be optimal with regard to reproducing the surface currents measured by CODAR.The surface currents were found to be highly sensitive to the type of wind forcing and the wind stress formulation.Furthersensitivity analysesare currently being undertaken in these areas.
4.2.Mean surface current maps and M2 tidal current ellipses
Fig.7 shows vector plots of mean surface currents from CODAR and EFDC models for the rectangular area shown in Fig.1;this is the area with the highest CODAR coverage.The averaging period was the same as the comparison period shown in Fig.6.The mean surface current measured by CODAR shows a strong west-east fow trend.There are signifcant differences between surface current circulations modeled by models EFDC_1 to EFDC_4 and CODAR measurements.Clockwise circulation exists in EFDC_2 and EFDC_3 and anticlockwise circulation exists in EFDC_1. Although a small anticlockwise circulation exists in EFDC_5, the time-averaged current vectors from CODAR have much in common with those from model EFDC_5,showing a strong west-east current fowing into the inner bay.In summary,in comparison with the other four models,EFDC_5,with thin layers at the surface and bottom and thicker layers in the middle of the water column,is best able to reproduce the surface current circulation.

Table 2RMSEbetween surface velocity components obtained from models and CODAR.
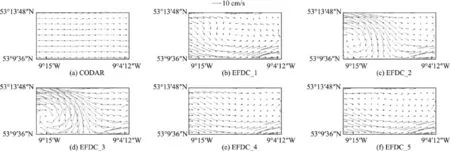
Fig.7.Vector plots of mean surface currents obtained from CODAR and EFDC models.
Circulation in Galway Bay is also strongly infuenced by a semi-diurnal tide.In order to further compare the model results,M2 tidal current ellipses were computed using both CODAR measurements and the model data.M2 tidal current ellipses at twenty locations with a high density of CODAR coverage in time are presented in Fig.8.
The tidal ellipses obtained from CODAR data exhibit considerable spatial variation in amplitude and phase.The mean differences in the semi-major axis,semi-minor axis,and inclination between CODAR and EFDC_5 were computed at the twenty locations.The mean differences were 1.76 cm/s for the semi-major axis,0.64 cm/s for the semi-minor axis,and 18°for the inclination.The worst tidal ellipse at these comparison locations is from model EFDC_2(Fig.8(b)).A signifcant difference appears between CODAR data and results from model EFDC_2.Visser et al.(1994)used a two-layer model to study the effect of stratifcation on tidal current profles.They found that the inclinations of the upper and lower axes are offset up to 20°with respect to one another and the relative orientation of this offset appears to change signifcantly at some points during the stratifed period.In short,the close correlation between the characteristics of the M2 tidal ellipses obtained from EFDC_5 and CODAR in this study confrms that model EFDC_5 can capture M2 tidal current ellipses similar to those captured by radar measurements.
4.3.Vertical profles of current speed and direction
In order to investigate the impact of vertical layer structure on the vertical profle of the current speed,vertical profles of the current speed obtained from different models were output over the course of a tidal cycle and compared with those computed from ADCP data.The vertical profles of modeled and measured current speeds at locationAare shown in Fig.9 at mid-food,high water,mid-ebb,and low water.Since the measured ADCP data were obtained every hour,the modeled current data were averaged over 60 min for comparison.For the vertical current profles,the current on the top layers is sensitive to the wind forcing,while the current on the bottom layers slows due to bottom drag effects(Nagle,2013;Wen, 1995).It can be seen from Fig.9 that at mid-food,usually with maximum surface currents,all of these models can obtain a vertical distribution of current speed similar to the ADCP data except for EFDC_2.EFDC_5 matches more closely than others.At high or low water,the value of the current speed is signifcantly lower than at mid-food and mid-ebb.The current speed obtained from EFDC_2 deviates widely from ADCP measurements at high water.However,the differences between these models are not signifcant at low water.In general,at mid-food and mid-ebb,EFDC_5 is able to well predict the vertical distribution of current speed,while at high or low water,the performance of the model is not as good.
The infuence of the vertical layer structure in the model on the current direction was also studied.Vertical profles of the current direction from models and ADCPs at locationAat four differenttimesareshowninFig.10.Obviously,theverticallayer structure has an infuence on the current direction.The difference in the current direction between fve models is not significant at mid-food and mid-ebb,at which the current speeds are larger than at high water and low water.The analysis fromFigs.9and10showsthatADCPdatawereveryusefulformodel validation.Moreover,the speeds and directions of currents on vertical layers in the 3D model were sensitive to the vertical layer structure.More attention needs to be paid to simulation.

Fig.8.M2 tidal current ellipses obtained from CODAR,EFDC_2,and EFDC_5.

Fig.9.Vertical profles of modeled and measured current speeds at locationAat four different times.

Fig.10.Vertical profles of modeled and measured current directions at locationAat four different times.
5.Conclusions
A three-dimensional model(EFDC)of Galway Bay,a semienclosed bay on the west coast of Ireland,was developed.The surface currents obtained from the model were compared with measurements of CODAR and ADCP.To verify the accuracy of the measured datasets,surface currents extracted from ADCP data were compared with those measured by HF radars. Five different vertical layer structures were investigated and the EFDC model performance was found to be sensitive to the structure of the vertical layers.Comparisons were conducted between surface currents,M2 currents,and vertical profles of current speed and direction obtained from models and ADCP in order to determine the optimal vertical layer structure.The following conclusions are drawn:
(1)The high level of correlation between time series of surface current speeds and directions from CODAR and ADCP confrmed that the two observation systems were capable of capturing the surface current and were reliable and accurate.
(2)The use of OTPS tide data to drive the model produced good correlation between measured and modeled water levels within the model domain.
(3)The modeled results show that model accuracy is dependent on the structure of the vertical layers.The sensitivity analysis shows that a variable thickness structure is best, where layers are thinnest at the top and bottom of the water column and the thickness gradually increases towards the middle of the water column.This ensures that wind shear can properly propagate from the surface layer to the sub-surface layers,thereby ensuring that wind forcing is not overdamped by tidal forcing.This is particularly important in shallow water where the surface layer(1%of the water depth)is quite thin compared with that in deep water.
(4)The vertical layer structure affects not only the velocities in the surface layer but also the velocities further down in the water column and signifcantly different velocities can be obtained for different vertical layer structures.In addition,the vertical layer structure affects the direction of currents over the water column.Careful attention should be paid to the vertical layer structure during development of 3D models.
Acknowledgements
We would like to thank the Informatics Research Unit for Sustainable Engineering(IRUSE)and the Offce of Public Works for providing the data,and Ireland's High-Performance Computing Centre(ICHEC)for providing the computational platform.
Ebuchi,N.,Fukamachi,Y.,Ohshima,K.I.,Shirasawa,K.,Ishikawa,M., Takatsuka,T.,Daibo,T.,Wakatsuchi,M.,2006.Observation of the Soya warm current using HF ocean radar.J.Oceanogr.62(1),47-61.http:// dx.doi.org/10.1007/s10872-006-0031-0.
Egbert,G.D.,Erofeeva,S.Y.,2002.Effcient inverse modeling of barotropic ocean tides.J.Atmos.Ocean.Technol.19(2),183-204.http://dx.doi.org/ 10.1175/1520-0426(2002)019<0183:EIMOBO>2.0.CO;2.
Gopalakrishnan,G.,2008.Surface Current Observations Using High Frequency Radar and Its Assimilation into the New York Harbor Observing and Prediction System.Ph.D.Dissertation.Stevens Institute of Technology,Hoboken.
Hamrick,J.M.,1992.A Three-dimensional Environmental Fluid Dynamics Computer Code:Theoretical and Computational Aspects.Virginia Institute of Marine Science,Williamsburg.
Hamrick,J.M.,2006.EFDC Technical Memorandum Theoretical and Computational Aspects of the Generalized Vertical Coordinate Option in the EFDC Model.US Environmental Protection,Fairfax.
Haus,B.K.,Wang,J.D.,Rivera,J.,Martinez-Pedraja,J.,Smith,N.,2000. Remote radar measurement of shelf currents off Key Largo,Florida, U.S.A.Estuarine.Coast.Shelf Sci.51(5),553-569.http://dx.doi.org/ 10.1006/ecss.2000.0704.
Jin,K.R.,Ji,Z.G.,2004.Case study:Modeling of sediment transport and windwave impact in Lake Okeechobee.J.Hydraul.Eng.130(11),1055-1067. http://dx.doi.org/10.1061/(ASCE)0733-9429(2004)130:11(1055).
Kaplan,D.M.,Largier,J.,Botsford,L.W.,2005.HF radar observations of surface circulation off Bodega Bay(northern California,USA).J. Geophys. Res. 110(C10), 1-25. http://dx.doi.org/10.1029/ 2005JC002959.
Kelly,F.J.,Bonner,J.S.,Perez,J.C.,Adams,J.S.,Prouty,D.,Trujillo,D., Weisberg,R.H.,Luther,M.E.,He,R.,Cole,R.,et al.,2002.An HF-radar test deployment amidst an ADCP array on the West Florida Shelf.In: Proceedingsofthe Oceans2002 IEEE/MTS Conference.IEEE, pp.692-698.http://dx.doi.org/10.1109/OCEANS.2002.1192053.
Kelly,F.J.,Bonner,J.S.,Perez,J.C.,Trujillo,D.,Weisberg,R.H.,Luther,M.E., He,H.,2003.A comparison of near-surface current measurements by ADCP and HF-radar on the West Florida Shelf.In:Proceedings of the IEEE/OES Seventh Working Conference on Current Measurement Technology.IEEE,pp.70-74.http://dx.doi.org/10.1109/CCM.2003.1194286.
Kuang,L.,Blumberg,A.F.,Georgas,N.,2012.Assessing the fdelity of surface currents from a coastal ocean model and HF radar using drifting buoys in the Middle Atlantic Bight.Ocean.Dyn.62(8),1229-1243.http:// dx.doi.org/10.1007/s10236-012-0556-2.
Liu,Y.,Weisberg,R.H.,Merz,C.R.,Lichtenwalner,S.,Kirkpatrick,G.J., 2010.HF radar performance in a low-energy environment:CODAR Sea-Sonde experience on the West Florida Shelf.J.Atmos.Ocean.Technol. 27(10),1689-1710.http://dx.doi.org/10.1175/2010JTECHO720.1.
Mau,J.C.,Wang,D.P.,Ullman,D.S.,Codiga,D.L.,2007.Comparison of observed(HF radar,ADCP)and model barotropic tidal currents in the New York Bight and Block Island Sound.Estuar.Coast.Shelf Sci.72(1-2), 129-137.http://dx.doi.org/10.1016/j.ecss.2006.10.011.
Nagle,D.,2013.Modelling and Observation of Wind-driven Circulation in Galway Bay.M.S.Dissertation.National University of Ireland,Galway.
O'Donncha,F.,Hartnett,M.,Nash,S.,Ren,L.,Ragnoli,E.,2015.Characterizing observed circulation patterns within a bay using HF radar and numerical model simulations.J.Mar.Syst.142,96-110.http://dx.doi.org/ 10.1016/j.jmarsys.2014.10.004.
Padman,L.,Erofeeva,S.,2004.A barotropic inverse tidal model for the Arctic Ocean.Geophys.Res.Lett.31(2),1-4.http://dx.doi.org/10.1029/ 2003GL019003.
Paduan,J.D.,Kim,K.C.,Cook,M.S.,Chavez,F.P.,2006.Calibration and validation of direction-fnding high-frequency radar ocean surface current observations.IEEE J.Ocean.Eng.31(4),862-875.http://dx.doi.org/ 10.1109/JOE.2006.886195.
Paduan,J.D.,Washburn,L.,2013.High-frequency radar observations of ocean surface currents.Annu.Rev.Mar.Sci.5(1),115-136.http://dx.doi.org/ 10.1146/annurev-marine-121211-172315.
Teague,C.C.,Vesecky,J.F.,Hallock,Z.R.,2001.Acomparisonofmultifrequency HF radar and ADCP measurements of near-surface currents during COPE-3. IEEE J.Ocean.Eng.26(3),399-405.http://dx.doi.org/10.1109/48.946513.
Visser,A.W.,Souza,A.J.,Hessner,K.,Simpson,J.H.,1994.The effect of stratifcation on tidal current profles in a region of freshwater infuence. Oceanol.Acta 17(4),369-381.
Wang,J.,Dizaji,R.,Ponsford,A.M.,2004.Analysis of clutter distribution in bistatic high frequency surface wave radar.In:Proceedings of the 2004 Canadian Conference on Electrical and Computer Engineering.IEEE, pp.1301-1304.http://dx.doi.org/10.1109/CCECE.2004.1349637.
Wen,L.,1995.Three-dimensional Hydrodynamic Modelling in Galway Bay. Ph.D.Dissertation.University College Galway,Galway.
Yoshikawa,Y.,Matsuno,T.,Marubayashi,K.,Fukudome,K.,2007.A surface velocity spiral observed with ADCP and HF radar in the Tsushima Strait.J. Geophys.Res.112(C6),1-14.http://dx.doi.org/10.1029/2006JC003625.
Zou,R.,Carter,S.,Shoemaker,L.,Parker,A.,Henry,T.,2006.Integrated hydrodynamicandwaterqualitymodelingsystemtosupportnutrienttotalmaximum daily load development for Wissahickon Creek.J.Environ.Eng.132(4), 555-566.http://dx.doi.org/10.1061/(ASCE)0733-9372(2006)132:4(555).
Received 17 July 2014;accepted 20 September 2015
Available online 17 December 2015
This work was supported by the China Scholarship Council(Grant No. 2011671057),the European Regional Development Fund(ERDF)through the Atlantic Area Transnational Programme(INTERREG IV),and the National University of Ireland.
*Corresponding author.
E-mail address:leirencomeon@gmail.com(Lei Ren).
Peer review under responsibility of Hohai University.
http://dx.doi.org/10.1016/j.wse.2015.12.001
1674-2370/?2015 Hohai University.Production and hosting by Elsevier B.V.This is an open access article under the CC BY-NC-ND license(http:// creativecommons.org/licenses/by-nc-nd/4.0/).
?2015 Hohai University.Production and hosting by Elsevier B.V.This is an open access article under the CC BY-NC-ND license(http:// creativecommons.org/licenses/by-nc-nd/4.0/).
猜你喜歡
現(xiàn)代儀器與醫(yī)療(2022年2期)2022-08-11 09:51:52
中國民間療法(2021年10期)2021-07-22 02:33:18
High Technology Letters(2017年4期)2017-12-19 00:45:27
實用口腔醫(yī)學(xué)雜志(2017年6期)2017-09-19 02:51:18
High Technology Letters(2016年3期)2016-12-05 06:39:00
中國衛(wèi)生標(biāo)準(zhǔn)管理(2015年17期)2016-01-20 09:26:40
中國醫(yī)藥導(dǎo)報(2015年27期)2015-02-28 22:08:08
中國司法鑒定(2015年4期)2015-02-28 14:29:16
High Technology Letters(2015年1期)2015-02-15 02:19:18
安徽醫(yī)藥(2014年9期)2014-03-20 13:14:08
 Water Science and Engineering2015年4期
- Water Science and Engineering的其它文章
- Deposited sediment settlement and consolidation mechanisms
- Seepage and stress analysis of anti-seepage structures constructed with different concrete materials in an RCC gravity dam
- Numerical simulation of fow past twin near-wall circular cylinders in tandem arrangement at low Reynolds number
- Analysis of effect of nicotine on microbial community structure in sediment using PCR-DGGE fngerprinting
- Impacts of water quality variation and rainfall runoff on Jinpen Reservoir, in Northwest China
- Effects of temporal variability on HBV model calibration