
Detection of Al,Mg,Ca,and Zn in copper slag by LIBS combined with calibration curve and PLSR methods
2024-03-19 02:37:24JunweiJIA賈軍偉ZhifengLIU劉志峰CongyuanPAN潘從元andHuaqinXUE薛驊骎
Plasma Science and Technology 2024年2期
關鍵詞:志峰
Junwei JIA (賈軍偉),Zhifeng LIU (劉志峰),Congyuan PAN (潘從元) and Huaqin XUE (薛驊骎)
1 School of Mechanical Engineering,Hefei University of Technology,Hefei 230009,People’s Republic of China
2 Hefei GStar Intelligent Control Technical Co.Ltd.,Hefei 230088,People’s Republic of China
3 Anhui Industrial Combustion Monitoring Technology and Equipment Engineering Laboratory,Hefei 230088,People’s Republic of China
Abstract The precise measurement of Al,Mg,Ca,and Zn composition in copper slag is crucial for effective process control of copper pyrometallurgy.In this study,a remote laser-induced breakdown spectroscopy (LIBS) system was utilized for the spectral analysis of copper slag samples at a distance of 2.5 m.The composition of copper slag was then analyzed using both the calibration curve (CC) method and the partial least squares regression (PLSR) analysis method based on the characteristic spectral intensity ratio.The performance of the two analysis methods was gauged through the determination coefficient (R2),average relative error (ARE),root mean square error of calibration (RMSEC),and root mean square error of prediction (RMSEP).The results demonstrate that the PLSR method significantly improved both R2 for the calibration and test sets while reducing ARE,RMSEC,and RMSEP by 50% compared to the CC method.The results suggest that the combination of LIBS and PLSR is a viable approach for effectively detecting the elemental concentration in copper slag and holds potential for online detection of the elemental composition of high-temperature molten copper slag.
Keywords: copper slag,element,remote,LIBS,PLSR
1.Introduction
In copper pyrometallurgy,copper slag is a vital product,and accurate control of the smelting process necessitates timely updates regarding the slag viscosity.This is because viscosity governs both heat and quality transfer in the slag and has a direct relationship with the loss of valuable elements and the durability of the smelting furnace.Al,Mg,and Ca content in the slag directly affects its viscosity,while Zn is a crucial element in the smelting process.Therefore,a precise and efficient determination of their respective concentrations is of great significance in achieving precise control of production processes.
Currently,chemical analysis methods such as X-ray fluorescence analysis (XRF) [1,2] and inductively coupled plasma emission spectroscopy (ICP) [3] are commonly employed for determining the composition of copper slag.However,these methods require meticulous sampling and preparation procedures,resulting in long analysis time,which is incapable of meeting the demands of precise process control for the rapid analysis of copper slag composition.On the other hand,Laser-Induced Breakdown Spectroscopy (LIBS) is an atomic emission spectroscopy technology that enables quantitative or qualitative analysis of sample elemental composition.With its remote non-contact detection capabilities,absence of any complex sample pretreatment requirements,rapid analysis speed,simultaneous analysis of multiple elements,lack of radiation,and robust adaptability to harsh environments [4],it has been extensively applied in various fields [5] such as environmental monitoring [6],resource exploration [7-9],metal smelting [10],and agricultural production [11].
In metal smelting,LIBS technology is mostly used for detecting the composition of alloys,stainless steel,steel slag,and other components [12-18].It is seldom used for detecting the composition of copper slag.Only Fran?oisetalstudied the feasibility of analyzing the slag composition in secondary copper production [19].Furthermore,traditional LIBS systems have short detection distances,making them unsuitable for detecting high-temperature melt composition in the smelting process.Yoonetalused LIBS and partial least squares regression (PLSR) method to analyze heavy metals in sediments [20].Kashiwakura and Wagatsuma used LIBS and PLSR method to analyze austenitic stainless steel[21].Brinkmannetalused laser-induced breakdown spectroscopy combined with PLSR method to determine copper in ores [22].These studies all indicated that LIBS combined with PLSR method is a good approach for component analysis.To address this issue,we utilized a remote LIBS system to detect the concentrations of Al,Mg,Ca,and Zn in copper slag.The results were subsequently analyzed and compared using the calibration curve and the PLSR methods.Implementing the LIBS system has established a viable solution for the online and rapid detection of molten slag composition for the copper smelting process.
2.Experiment
2.1.Experimental instrument
The rendering of the schematic diagram of the LIBS system is shown in figure 1.A nanosecond Q-switched Nd: YAG laser (Quantel Ultra100) was employed at 1064 nm with a pulse energy of 100 mJ,a repetition rate of 10 Hz and a pulse duration of 7 ns.The pulse laser emitted by the laser is reflected by the dielectric film mirror (Beamsplitter,R> 96%at 1064 nm andT> 90 at 250-700 nm) and directly incident onto the convex mirror (Mirror1,R> 90% at 250-1100 nm)through a small hole in the center of the concave mirror(Mirror2,R> 90% at 250-1100 nm).It is subsequently reflected by the convex mirror to the concave mirror and focused on the sample in front to excite the plasma.The signal light emitted by the plasma returns along the original optical path focuses through the dielectric film mirror and is transmitted to the spectrometer through collecting lens and optical fiber for spectral collection.A spectrometer(AvaSpec-ULS2048CL-EVO,Avantes) with three channel was used to detect the spectral wavelength regions of 270-610 nm with a delay time of 1.28μs and the integration time of 1.05 ms,respectively.The focal length (detection distance) of the system can be changed by adjusting the position of the convex reflector,and the detection distance of this system is from 1.5 to 3.6 m.The details of the experimental system were described in our previous work [23,24].For this experiment,a detection distance of 2.5 m was applied.
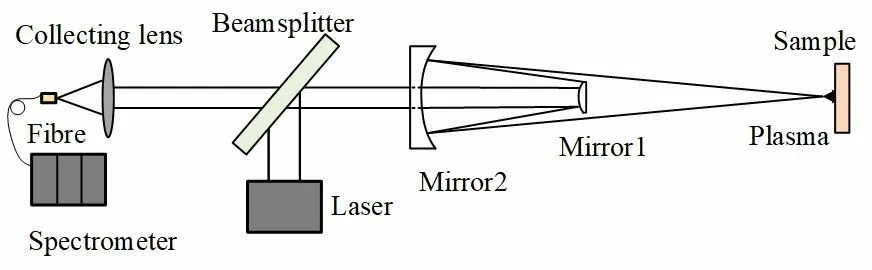
Figure 1.The rendering of the schematic diagram of the LIBS system.
2.2.Samples
105 slag powder samples were collected from a copper smelter company.Of these,74 samples were used for the calibration set,whereas 31 were reserved for the test set.Table 1 presents the certified concentration range of Al,Mg,Ca,and Zn elements in both the calibration and test set samples.To prepare the samples for analysis,the powder samples were pressed into pellets with a diameter of 36 mm and a thickness of 3 mm,using an electric hydraulic jack under pressure of 30 MPa for 5 min,followed by 3 min of dwell time,and 2 min of release time.For each particle sample,analysis was conducted on nine different positions,with each position subjected to 200 shots to generate an average spectrum that improved the signal-to-noise ratio(SNR).Consequently,each sample was represented by nine spectra from distinct positions.
2.3.Analysis methods
The calibration curve (CC) method is one of the most widely used and straightforward quantitative techniques.It involves generating a linear relationship between each element’s spectral intensity and concentration by analyzing a series of samples possessing known component information.However,this method is vulnerable to matrix effects,making it ideal for quantitative analysis of non-major elements in samples with similar matrices.
Partial least squares regression (PLSR) is a novel technique that leverages multivariate statistical data analysis methods such as principal component analysis,canonical correlation analysis,and linear regression analysis to model multiple independent variables using either a single (PLSR1)or multiple (PLSR2) dependent variables.Compared to the CC method,PLSR has several advantages,particularly when dealing with multiple correlations between variables and small sample sizes in linear regression analysis.In this study,we employed a single dependent variable partial least squares regression (PLSR1) model to analyze the elemental composition of copper slag.
To estimate and compare the analytical performance of the CC and PLSR methods regarding their quantitative analytical capabilities,we utilized several evaluation parameters,including the determination coefficient (R2),the aver-age relative error (ARE),as well as the root mean square error of calibration (RMSEC) and root mean square error of prediction (RMSEP).The expressions of these parameters are provided below:

Table 1.Measured elements in copper slag,concentration ranges of training,and test set.
whereyi,predictedandyi,actualare the predicted and certified concentration of samplei,respectively.is the average value of the predicted concentration of samplei,kis the number of samples in the calibration or test set,andmis the number of samples in the calibration set,andnis the number of samples in the test set.
3.Results and discussion
3.1.Quantitative analysis with calibration curve (CC) method
To account for the impact of self-absorption and pulse-topulse variations,we selected the normalized intensity ratios of Al 308.2 nm/Fe 351.3 nm,Mg 383.7 nm/Fe 353.6 nm,Ca 445.5 nm/Fe 427.2 nm,and Zn 481.1 nm/Fe 495.7 nm,with Fe serving as the standard internal element,to establish calibration curves for Al,Mg,Ca,and Zn elements.In order to reduce the influence of different channels,the characteristic spectral lines of the matrix Fe element and the target element in the normalized intensity of the target element are located in the same channel.The full channel spectrum of the slag sample and the characteristic spectral lines of the target element in different channels are shown in figure 2.All emission lines were identified based on a representative spectrum utilizing the NIST LIBS database [25].
The calibration curves of Al,Mg,Ca,and Zn elements are shown in figure 3.As shown in figure 3,theR2values are 0.9309,0.9724,0.9507 and 0.9915,respectively.These results indicate a strong linear relationship between the concentration of elements and the spectral intensity of the respective calibration samples.
Furthermore,we employed the calibration curves to determine the element content in both the calibration and test sets.The analysis results for both sets are presented in figure 4.The calibration set ofR2values for each element is 0.9667,0.9793,0.9507,and 0.9955,respectively.The corresponding ARE values for each element in the calibration set are 11.87%,6.75%,14.11%,and 7.32%,while the RMSEC values for each element in the calibration set are 0.1536,0.0886,0.1895,and 0.0958,respectively.
In figure 4,the test set ofR2values for each element in the test set are 0.9117,0.9662,0.9439,and 0.9927,respectively.The ARE values for each element in the calibration set are 11.24%,6.92%,9.53%,and 7.1%,respectively.The RMSEP values for each element in the calibration set are 0.1435,0.0904,0.1126,and 0.099,respectively.
The limit of detections (LODs) of the target elements were calculated the standard IUPAC by 3σ/k,whereσis the standard deviation of the background near the analysis line,andkis the slope of the fitted line for the intensity ratio [26].The calculated LODs of Al,Mg,Ca,and Zn are 0.16 wt.%,0.091 wt.%,0.055 wt.%,and 0.11 wt.%,respectively.
The results indicated that the calibration curve method was less impacted by matrix effects when the sample matrix was consistent.This was evidenced by theR2values of Al,Mg,Ca,and Zn elements in both the calibration and test set exceeding 0.90.Further,the RMSEC and RMSEP values were nearby,emphasizing the stability and accuracy of the calibration curve method for detecting elemental composition in pyrometallurgy copper slag samples.
3.2.Quantitative analysis with partial least squares regression (PLSR) method
Generally,PLSR is used for spectral data analysis,often using spectral data within the entire or partial band range as input data.These spectral data contain many useless noise signals,and the analysis results are susceptible to interference from noise signals.This article uses the normalized intensity of the target elements and matrix element spectral intensity ratio and the certified concentration of the target element as input data for the PLSR model,reducing the interference of different noise signals and the risk of overfitting.According to the NIST LIBS database,the spectra lines of the Al,Mg,Ca,and Zn elements are extracted,as shown in table 2.The emission lines of Fe are also selected as the internal standard lines.Using the Fe element as the internal standard element,we obtained the normalized intensity of each target element as the input data for PLSR analysis.
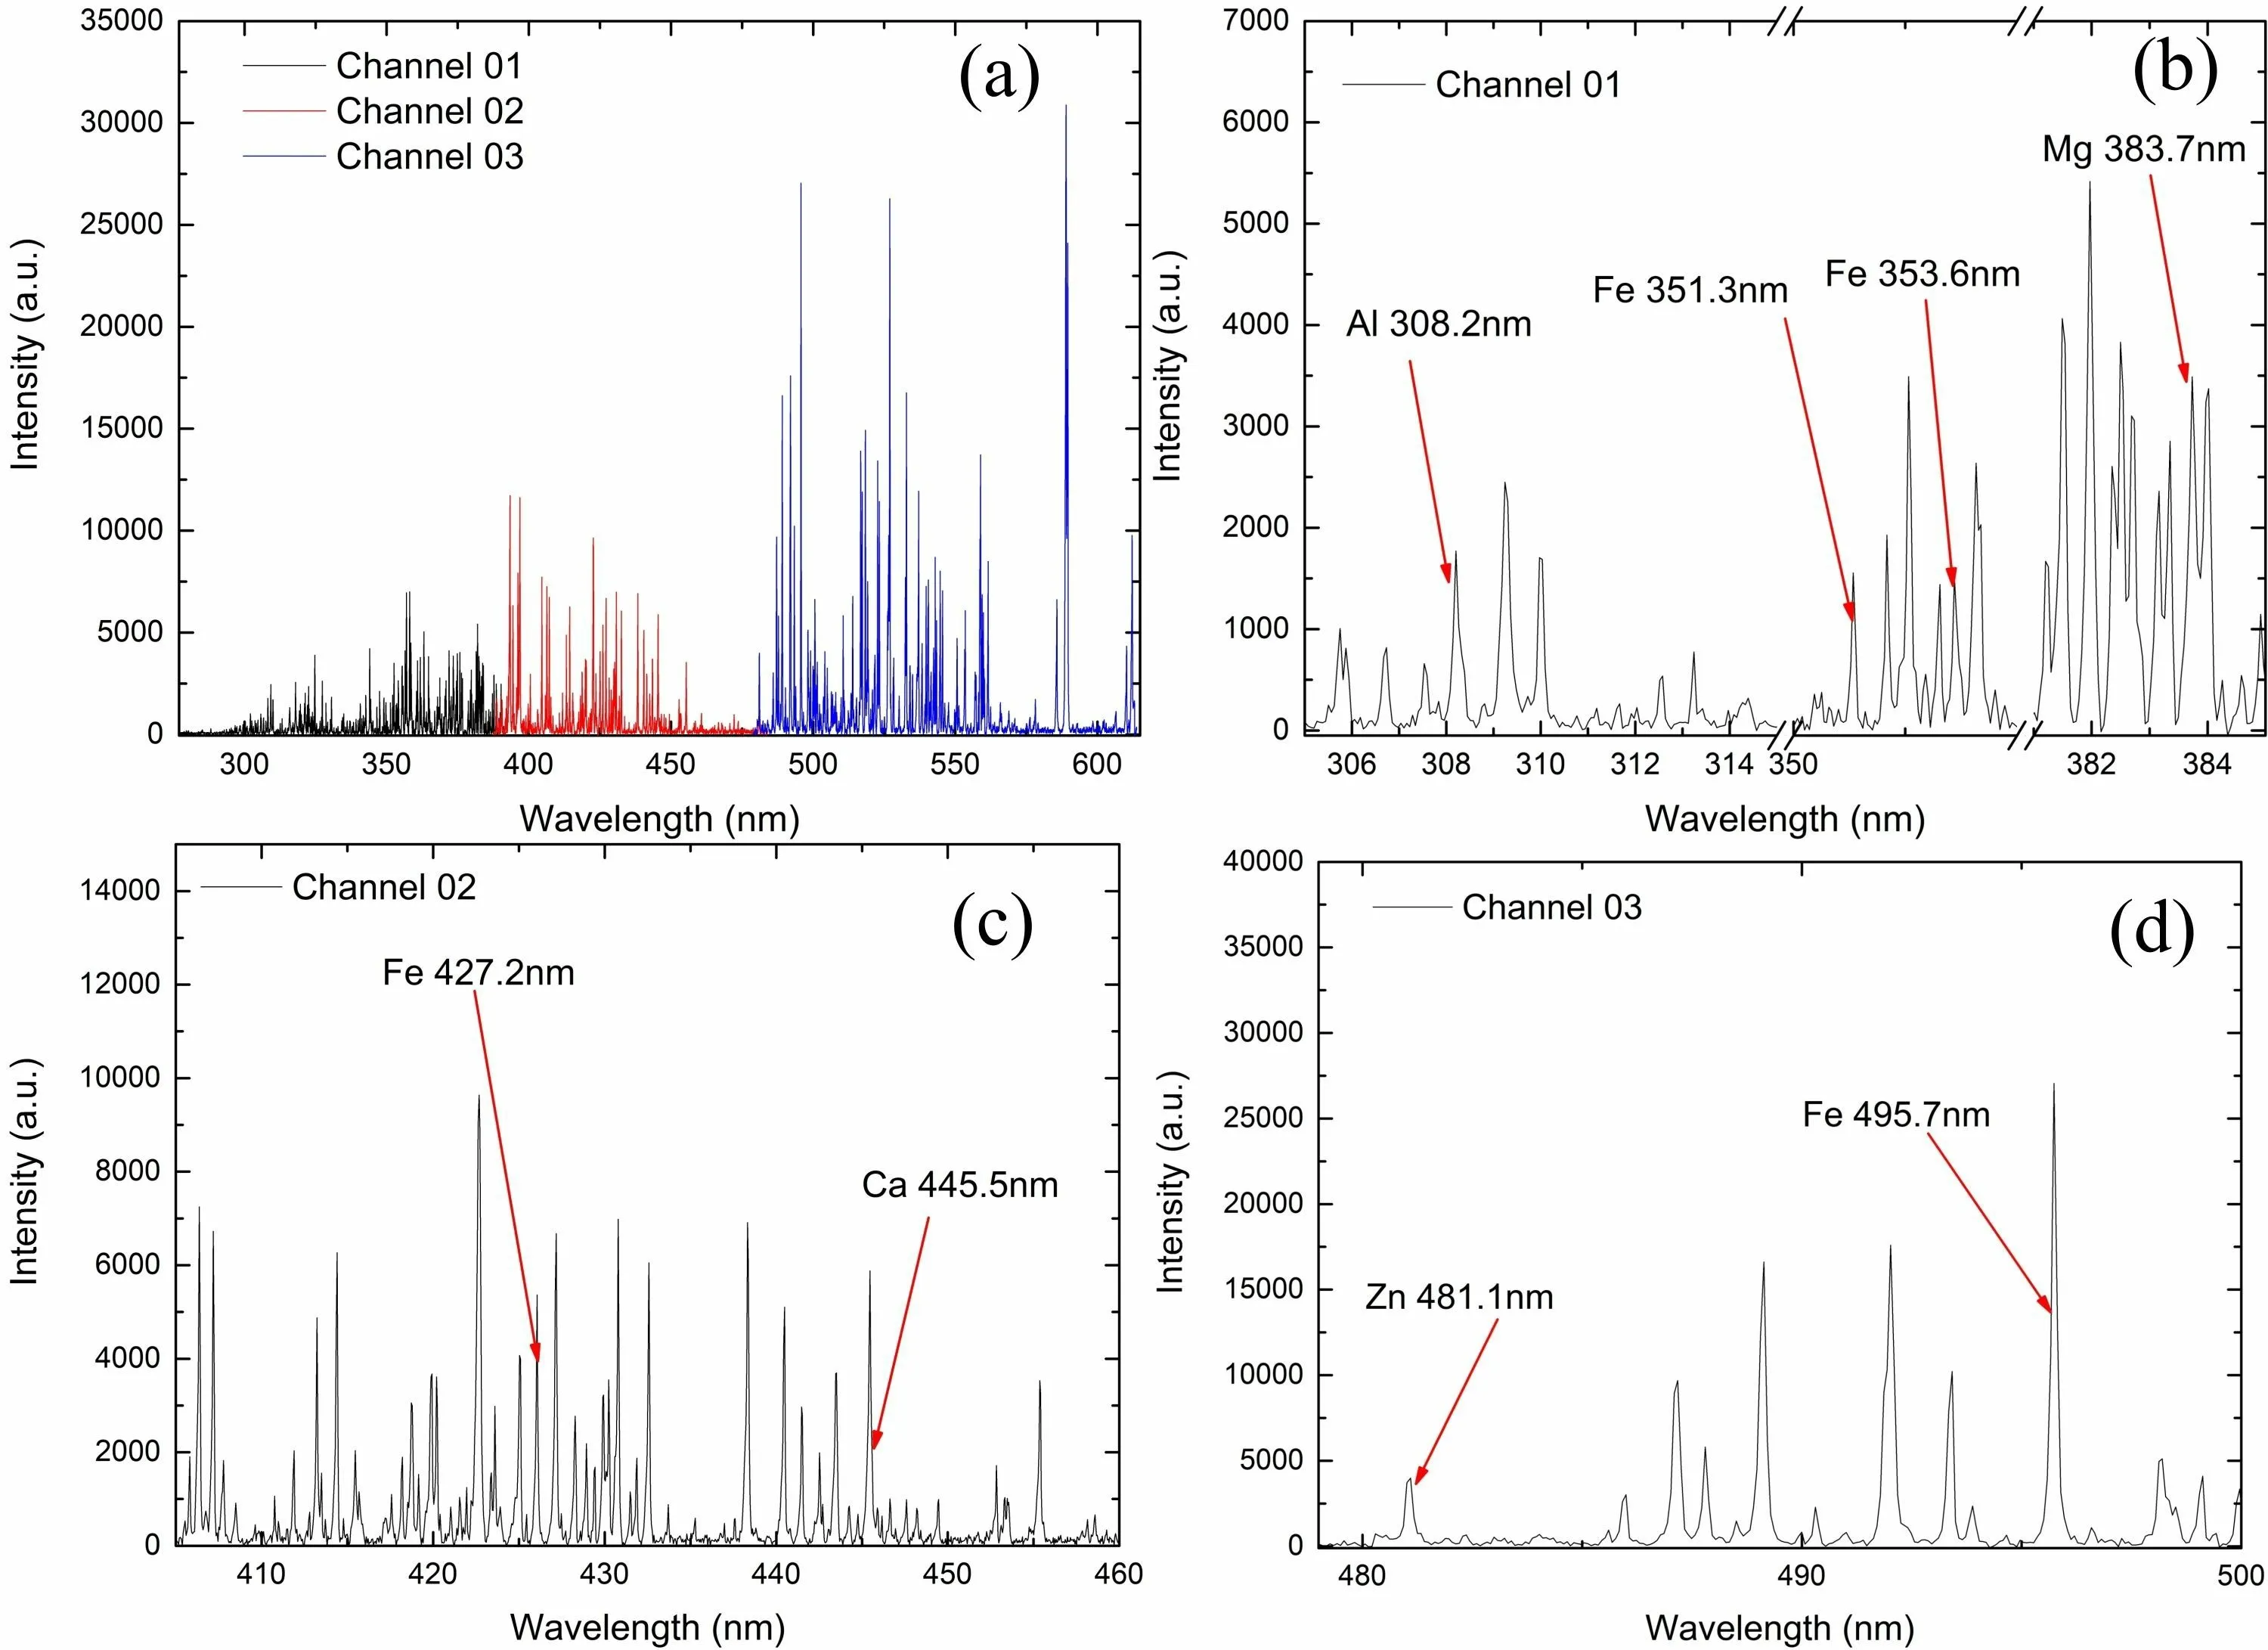
Figure 2.Full channel spectrum (a) and characteristic spectral lines of different elements in channel 1 to channel 3 ((b)-(d)).

Figure 3.The calibration curves of Al,Mg,Ca,and Zn elements.

Figure 4.The calibration and test set results of the CC method.
PLSR is a multivariate statistical analysis method based on factor analysis that can effectively eliminate multiple correlations.The selection of the number of principal components (PC) is a crucial parameter that affects the performance of the PLSR model.To avoid over-fitting or sub-fitting of the model,a 10-fold cross-validation method is used to optimize the selection of the number of principal components (PC).Figure 5 shows the relationship between the number of PCs for Al,Mg,Ca,and Zn elements and root mean square error of cross validation (RMSECV) of the validation model.The optimal PC numbers for Al,Mg,Ca,and Zn elements are 9,16,13,and 16,respectively,when the RMSECV values reach their minimum or constant values.
Subsequently,we have built a PLSR model,utilizing the optimal number of PCs for each element,to determine the elemental content in the calibration and test set samples.The obtained results are displayed in figure 6.TheR2values of the calibration set for each element in the calibration set are 0.9906,0.9966,0.9969,and 0.9992,respectively.The corresponding ARE values for each element in the calibration set are 6.91%,2.89%,4.39%,and 4.08%,with the RMSEC values being 0.0823,0.0359,0.0541,and 0.0408,respectively.
The results obtained for the test set,as shown in figure 6,indicate that theR2values of each element test set are 0.9543,0.99,0.972,and 0.9968,respectively.The correspondingAREvalues for each element in the test set are 7.24%,3.75%,7.19%,and 5.65%,respectively,with the RMSEP values being 0.021,0.0164,0.0033,and 0.0171,respectively.It is noteworthy that compared to the CC method,the PLSR method has enhanced the calibration set and test setR2values,reducing ARE,RMSEC,and RMSEP by approximately 50%.This suggests that the accuracy and stability of prediction have been significantly improved.Hence,it is evident that the PLSR method exhibits excellent quantitative analysis ability for elements in copper slag samplescompared to the CC method.
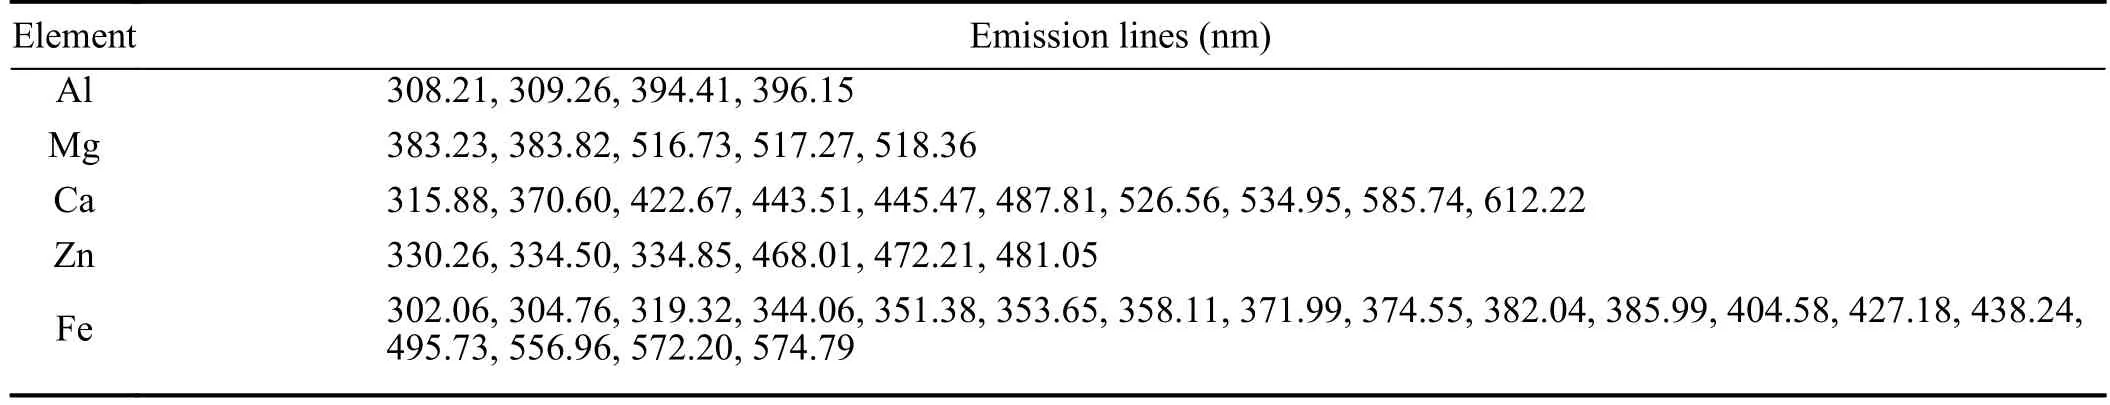
Table 2.Emission lines selected for PLSR.
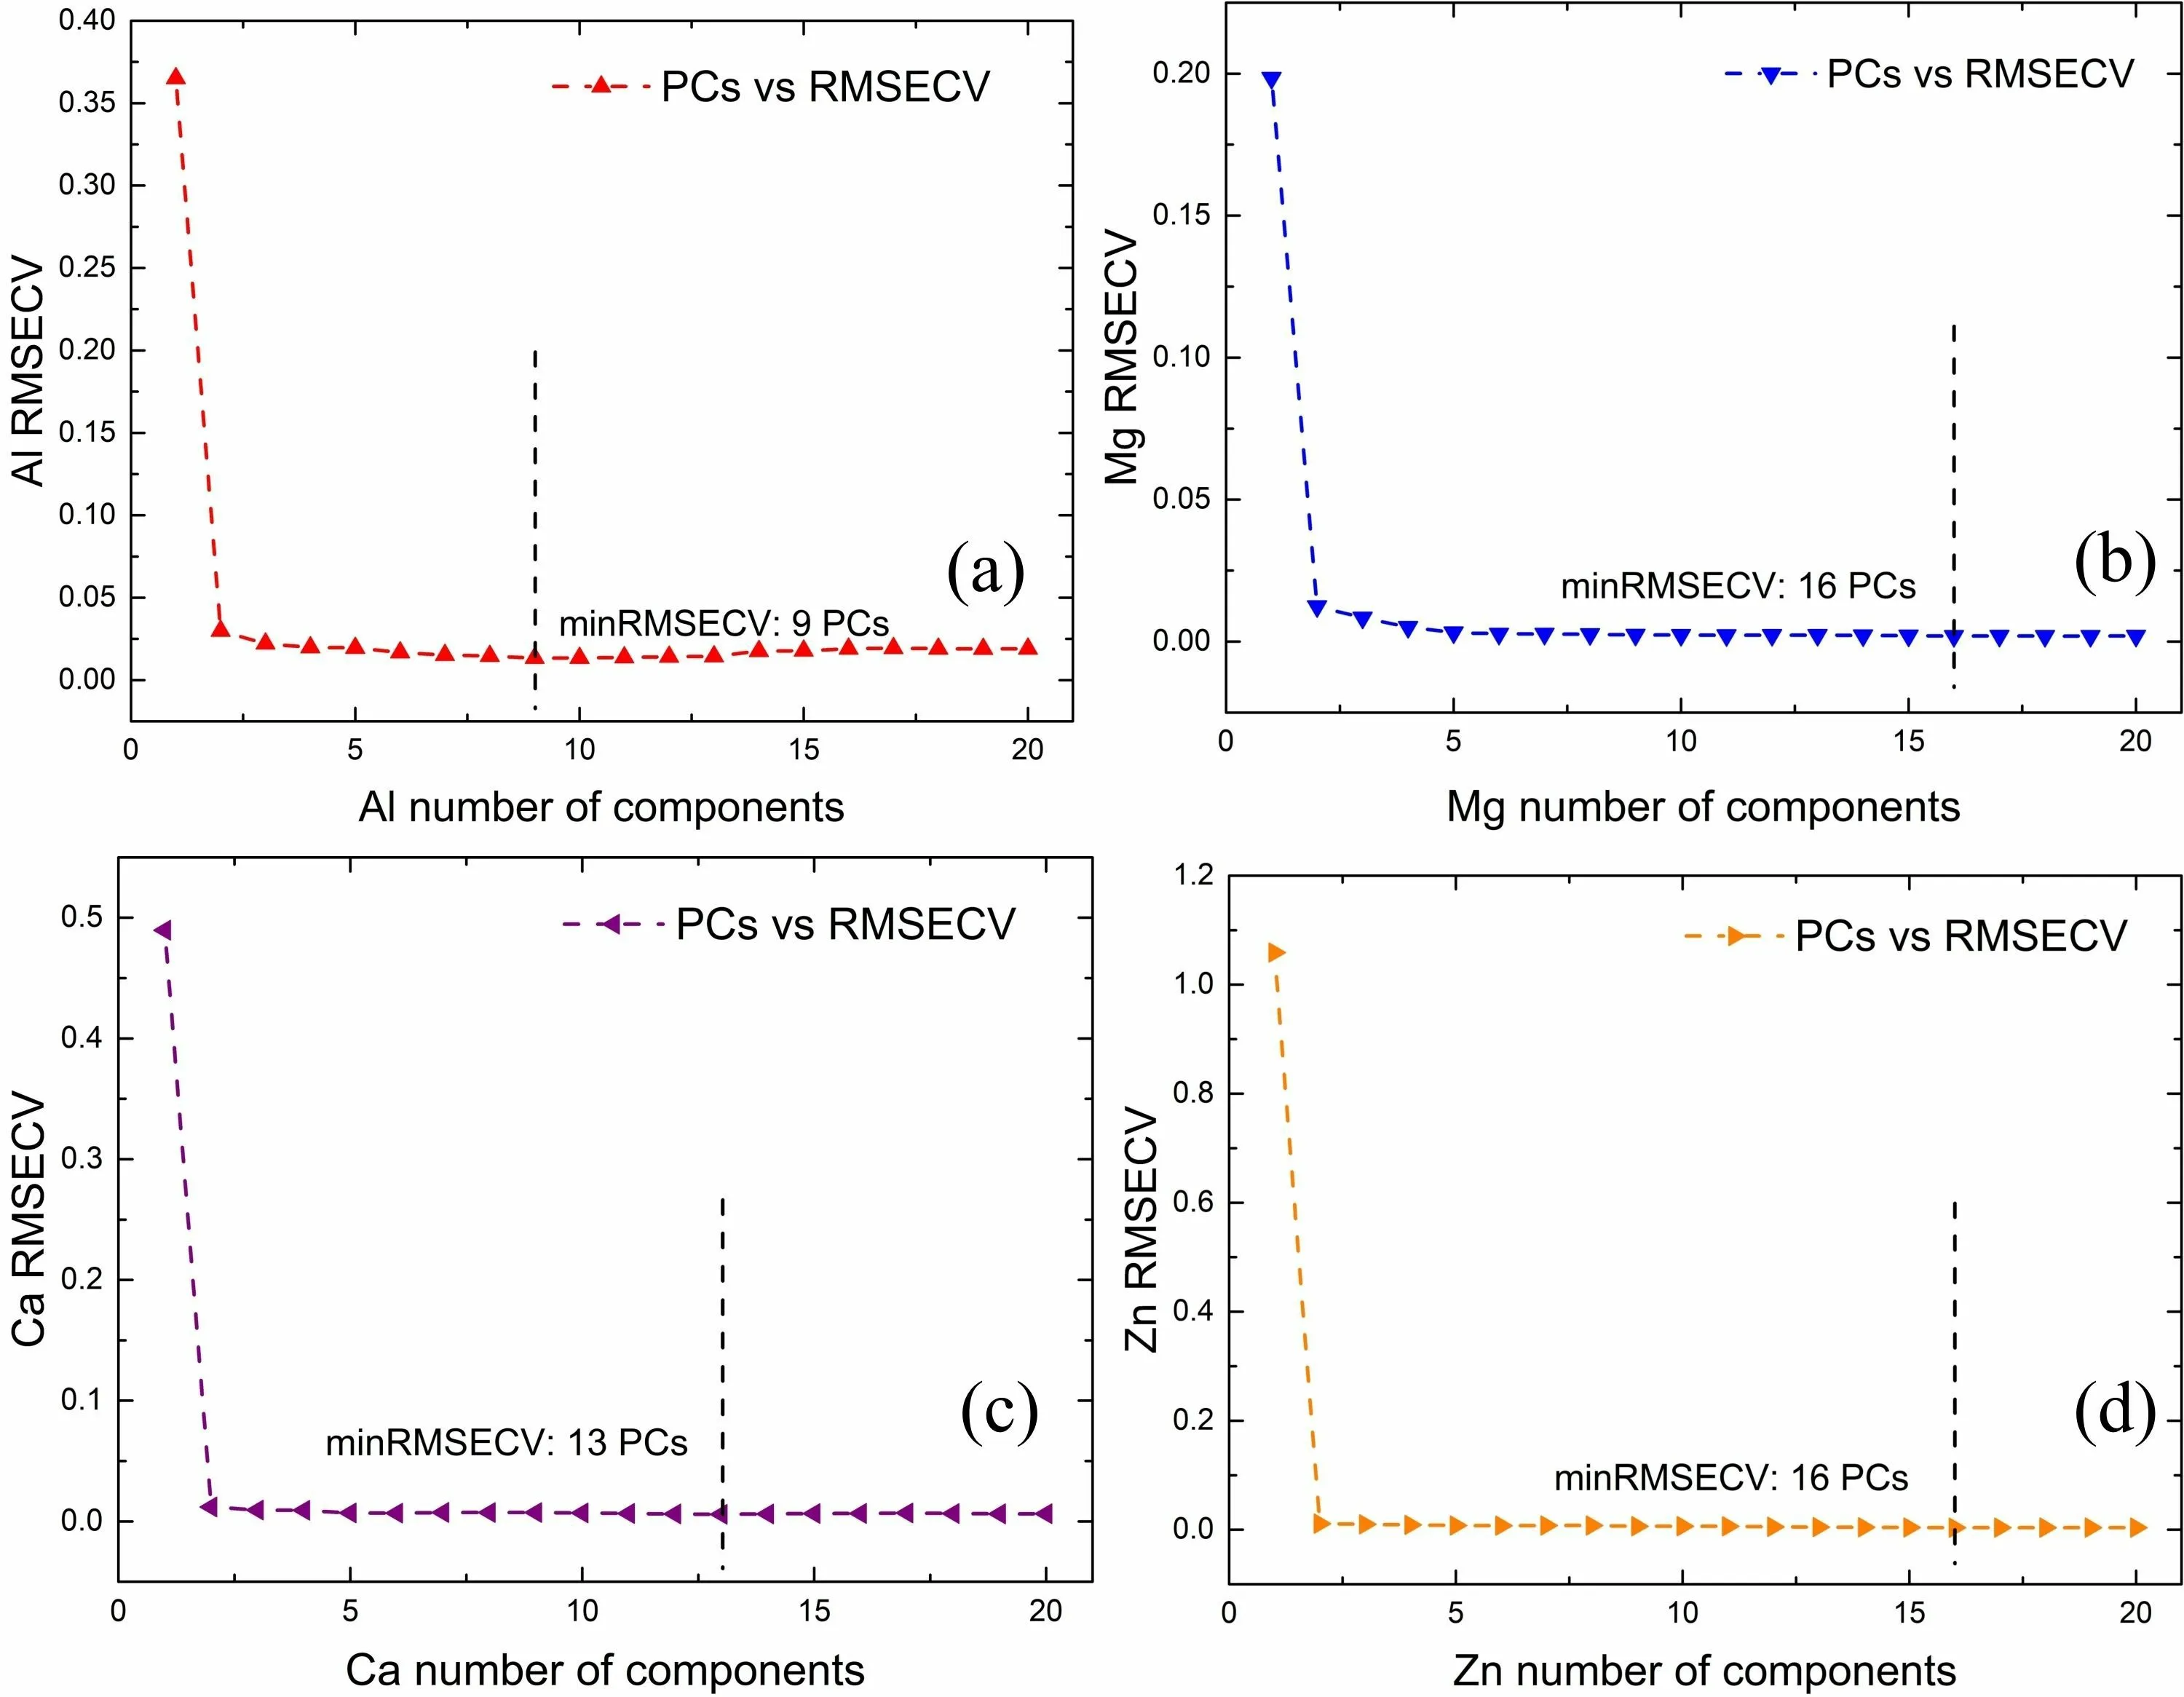
Figure 5.The number of principal components versus RMSECV for Al,Mg,Ca,and Zn.
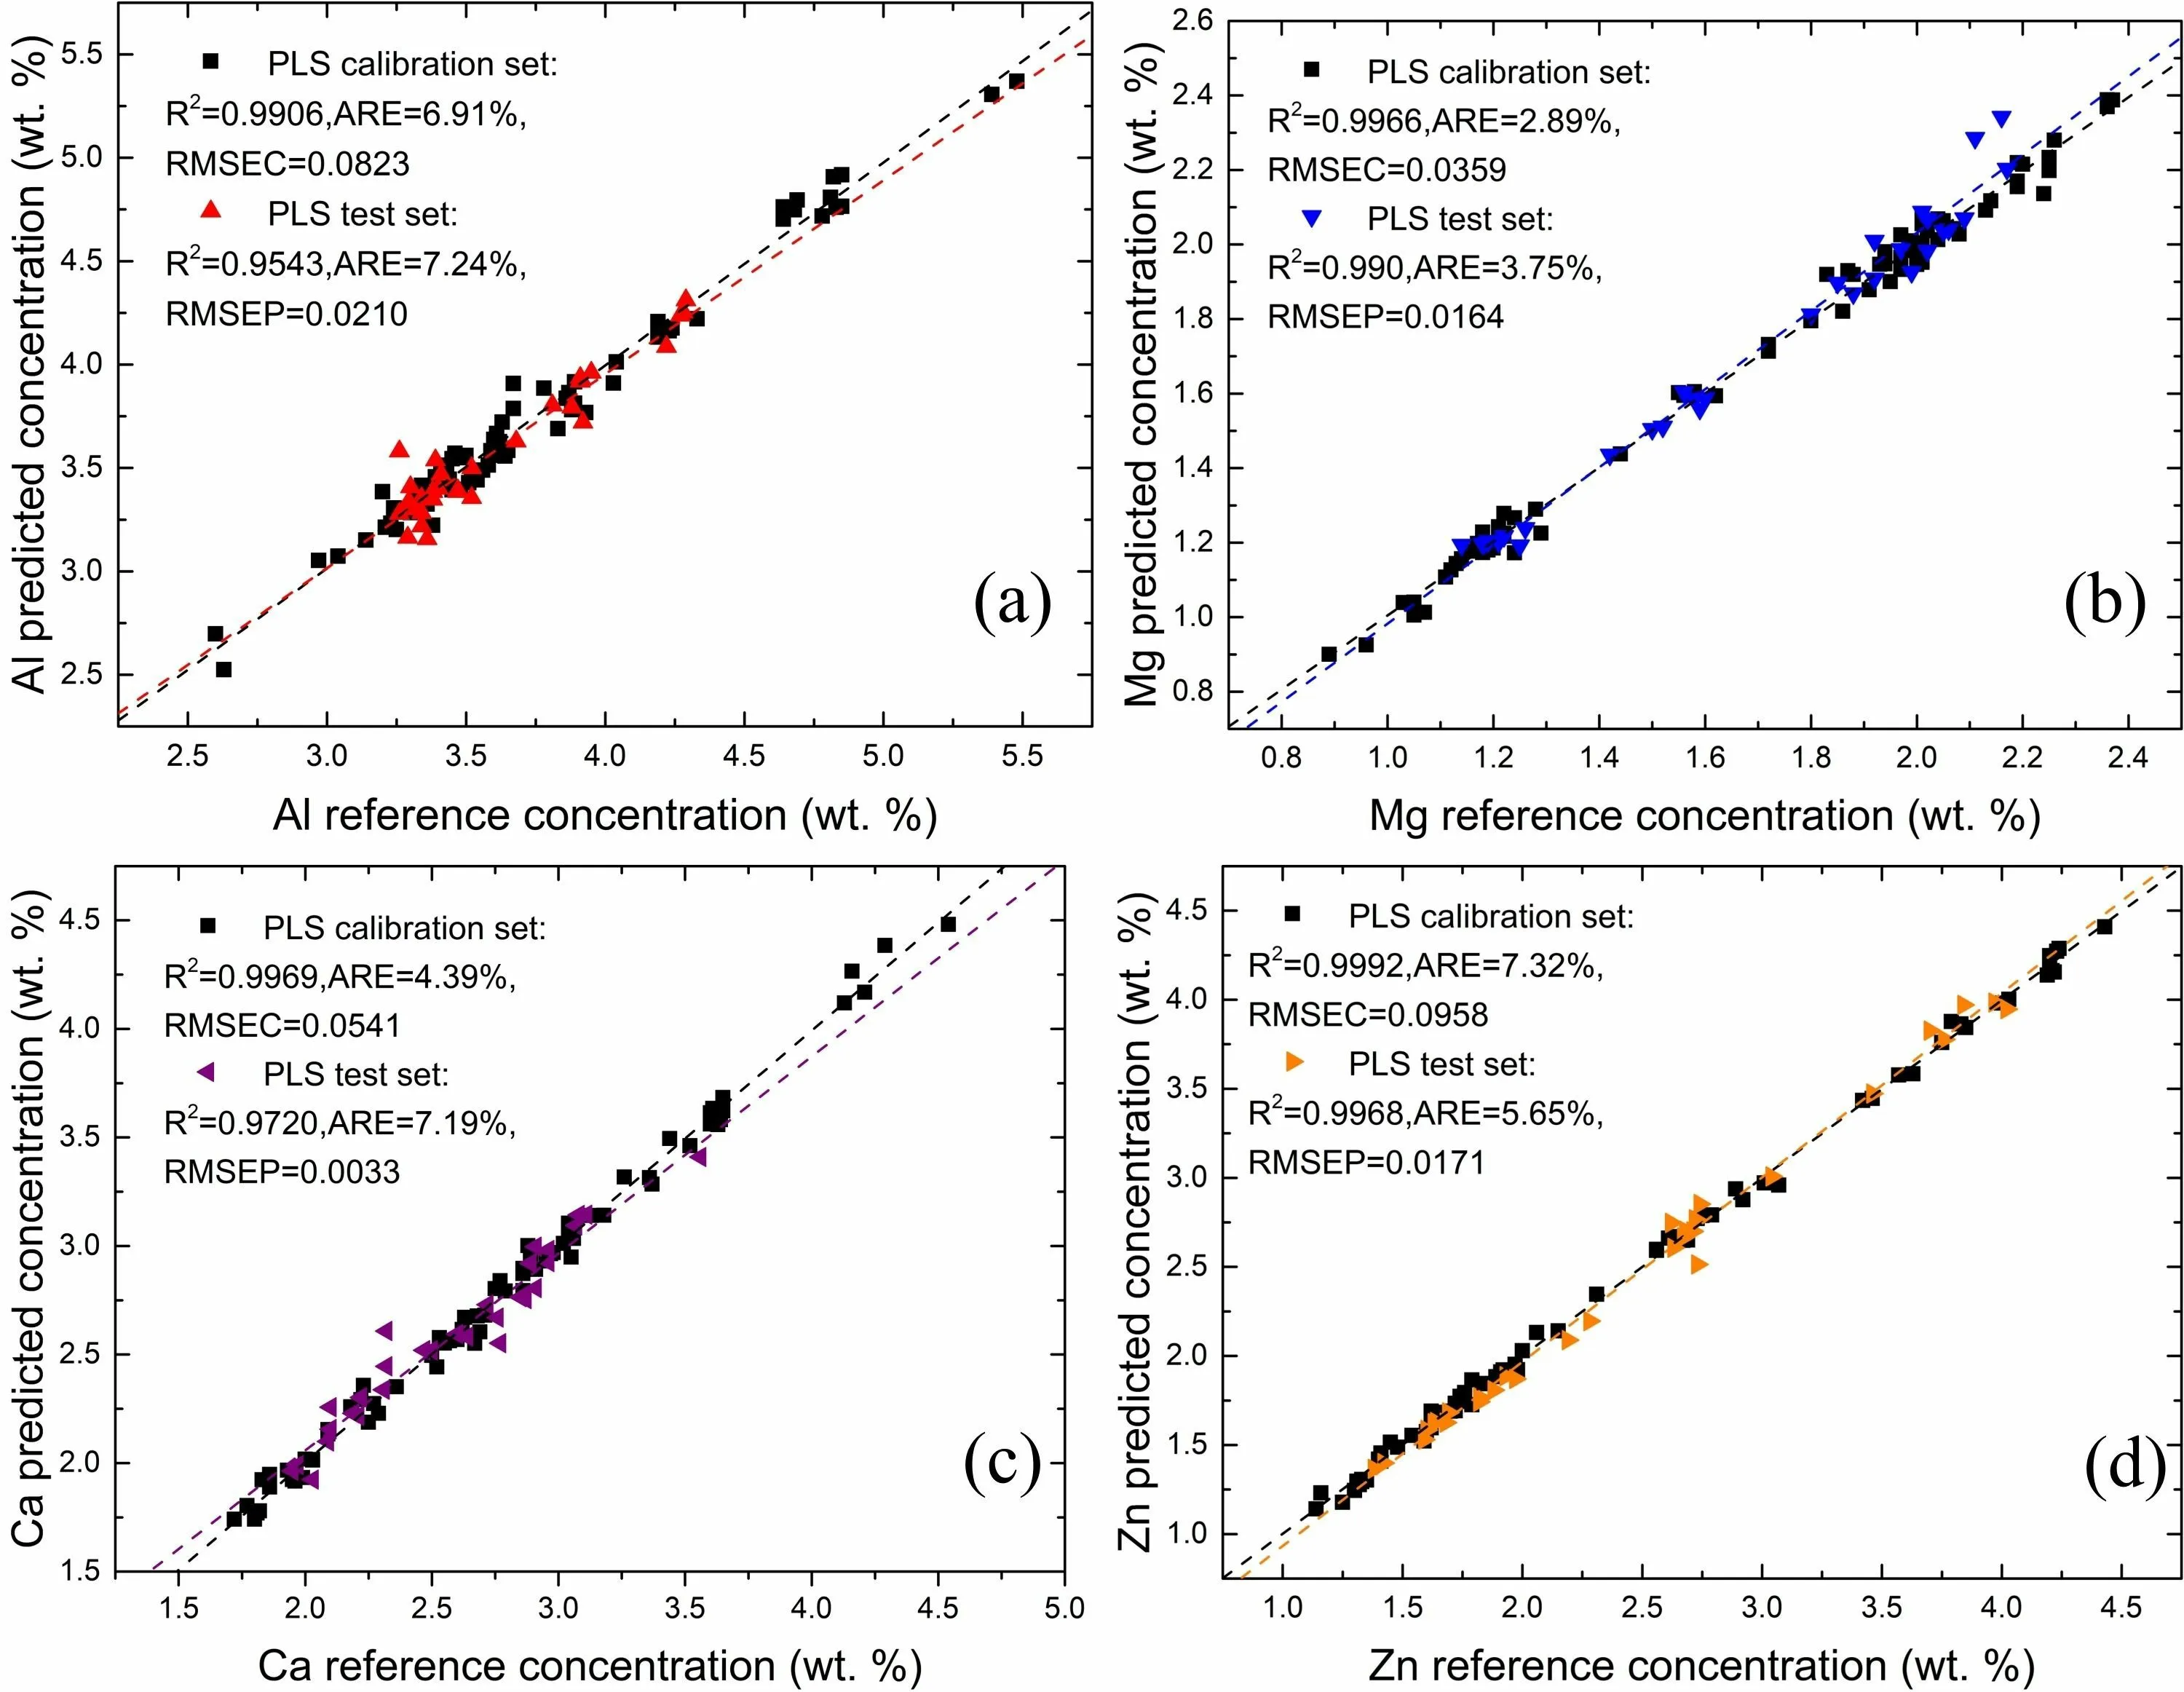
Figure 6.The calibration and test set results of the PLSR method.

Table 3.Comparisons of R2,ARE,RMSEC of Al,Mg,Ca,and Zn elements calculated by CC and PLSR analysis methods of the calibration set.
The obtainedR2,ARE,RMSEC,and RMSEP values for Al,Mg,Ca,and Zn elements from the CC and PLSR analysis method are summarized in tables 3 and 4.These results establish that the PLSR method surpasses the CC method regarding predictive accuracy.Leveraging multivariate input data with various spectral line intensity ratios,we reduced the influence of matrix and self-absorption effects.This study demonstrates that integrating LIBS and PLSR enables accurate detection of the elemental concentration in copper slag,thus serving as a reliable and practical approach.Furthermore,this study could serve as a valuable reference for online detection of the elemental composition of hightemperature molten copper slag using the LIBS system.
4.Conclusions
In conclusion,a remote LIBS system combined with CC and PLSR methods based on characteristic spectral intensity ratios has been successfully utilized to detect Al,Mg,Ca,and Zn elements in copper slag samples from pyrometallurgy processes.The precision and accuracy of the two analysis methods were investigated and evaluated using a comparison with reference values.It was evident that the PLSR method outperformed the CC method in terms of the improvement ofR2for both the calibration set and test set,as well as the significant reduction in ARE,RMSEC,and RMSEP to approximately half of those of the CC method.This indicates that the PLSR method demonstrates a higher accuracy in the quantitative analysis of elements in copper slag samples.Based on the results,the combination of LIBS and PLSR is a viable approach to detecting the elemental concentration in copper slag.It could serve as a reference for online detection of the elemental composition of hightemperature molten copper slag using the LIBS system.
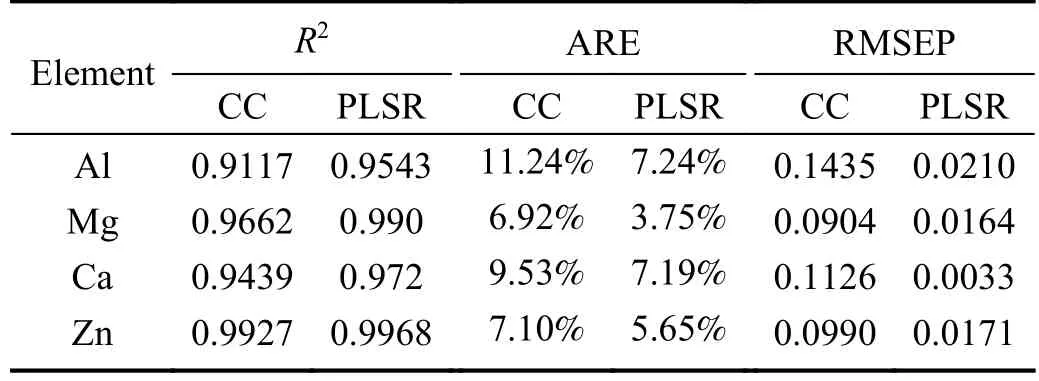
Table 4.Comparisons of R2,ARE,RMSEP of Al,Mg,Ca,and Zn elements calculated by CC and PLSR analysis methods of the test set.
Acknowledgments
This work is supported by funding for research activities of postdoctoral researchers in Anhui Province and special funds for developing Anhui Province’s industrial “three highs” and high-tech industries.
猜你喜歡
當代作家(2023年5期)2023-07-10 22:13:48
Plasma Science and Technology(2022年2期)2022-03-10 03:50:02
中國民間療法(2021年6期)2021-06-09 06:19:08
山西文學(2018年6期)2018-11-13 10:43:08
Journal of Oceanology and Limnology(2018年2期)2018-05-07 06:07:38
中學生理科應試(2017年2期)2017-04-01 21:07:12
中國房地產(chǎn)·市場版(2016年12期)2017-01-13 20:08:40
水動力學研究與進展 B輯(2016年4期)2016-10-18 01:45:23
Journal of Donghua University(English Edition)(2014年6期)2014-08-12 02:30:58
中國攝影家(2012年8期)2012-04-29 00:44:03
 Plasma Science and Technology2024年2期
- Plasma Science and Technology的其它文章
- Experimental study on the effect of H2O and O2 on the degradation of SF6 by pulsed dielectric barrier discharge
- Phase field model for electric-thermal coupled discharge breakdown of polyimide nanocomposites under high frequency electrical stress
- Non-thermal atmospheric-pressure positive pulsating corona discharge in degradation of textile dye Reactive Blue 19 enhanced by Bi2O3 catalyst
- Airfoil friction drag reduction based on grid-type and super-dense array plasma actuators
- Characteristics of laser-induced breakdown spectroscopy of liquid slag
- The characteristics of negative corona discharge and radio interference at different altitudes based on coaxial wire-cylinder gap