
Linkage of the Decadal Variability of Extreme Summer Heat in North China with the IPOD since 1981
2023-09-07 07:49:04TiejunXIEJiWANGTaichenFENGTingDINGandLiangZHAO
Advances in Atmospheric Sciences 2023年9期
Tiejun XIE, Ji WANG, Taichen FENG, Ting DING, and Liang ZHAO
1Beijing Municipal Climate Center, Beijing Meteorological Bureau, Beijing 100089, China
2School of Atmospheric Sciences, Sun Yat-sen University, Zhuhai 528478, China
3National Climate Center, China Meteorological Administration, Beijing 100081, China
4State Key Laboratory of Numerical Modeling for Atmosphere Sciences and Geophysical Fluid Dynamics (LASG),Institute of Atmospheric Physics, Chinese Academy of Sciences, Beijing 100029, China
ABSTRACT Extreme summer heat can have serious socioeconomic impacts in North China.Here, we explore the decadal variability of the number of extreme heat days in early-to-mid summer (June and July) and a related potential mechanism consistent with the major seasonal occurrence period of extreme heat events in North China (NCSH).Observational analyses show significant decadal variability in NCSH for 1981—2021, potentially linked to the Indo-Pacific warm pool and Northwest Pacific Ocean dipole (IPOD) in early-to-mid summer.Dynamic diagnostic analysis and the linear baroclinic model (LBM) show that the positive IPOD in early-to-mid summer can excite upward vertical wind anomalies in the South China-East China Sea region, shifting the position of the western Pacific subtropical high (WPSH) to the east or weakening the degree of its control of the South China-East China Sea region, thus generating a positive geopotential height quadrupole (EAWPQ) pattern in the East Asia-Northwest Pacific region.Subsequently, the EAWPQ can cause air compression (expansion) over North China by regulating the tropospheric thickness anomalies in North China, thus increasing (decreasing) NCSH.Finally, an empirical model that incorporates the linear trend can better simulate the decadal NCSH compared to an empirical model based solely on the IPOD index, suggesting that the decadal variability of NCSH may be a combined contribution of the decadal IPOD and external linear forcing.
Key words: extreme heat, early-mid summer, North China, Indo-Pacific warm pool and Northwest Pacific Ocean dipole(IPOD), decadal variability
1.Introduction
Since the onset of rapid global warming in the 1980s,extreme heat events have occurred frequently in many global regions, adversely affecting human production, life,and health (e.g., Lobell and Field, 2007; Ding et al., 2010;Mora et al., 2017; King and Harrington, 2018; Lewis et al.,2019; Perkins-Kirkpatrick and Lewis, 2020; Suarez-Gutierrez et al., 2020; Yu et al., 2021).This was especially the case in 2022 when the average maximum temperature in central India exceeded the historical record for the past 122 years.The temperature in many regions in Europe exceeded their most extreme values in nearly 100 years, and China experienced the strongest extreme summer heat event in terms of its combined intensity since there were complete meteorological observation records.Numerous evidence suggests that the frequency and intensity of extreme heat events increased under global warming (e.g., Feng et al., 2009;Gong et al., 2009; Xu et al., 2009; Shi, 2012; Chen and Zhai,2017; Li et al., 2018; Deng et al., 2019).The North China region is home to a large population and is among the most prolific industrial and agricultural production centers in the world (Sun et al., 2006; Zhang et al., 2015), and are affected by extreme heat days, which mainly occur in early-to-mid summer (June and July; Shi, 2012; Wang et al., 2018).Notably, operational prediction for early-to-mid summer extreme heat days in North China still falls short of societal needs.Therefore, it is very important to investigate the change characteristics and mechanism of NCSH under global warming since the 1980s to provide a theoretical basis for its prediction.
The soil water-surface-temperature feedback and atmospheric anticyclonic forcing represent the two main factors for extreme heat occurrence (e.g., Domonkos et al., 2003;Fischer et al., 2007; Seneviratne et al., 2010; Dole et al.,2011; Hirschi et al., 2011; Jia and Lin, 2011; Stéfanon et al.,2014; Qian et al., 2016; Wang et al., 2018; Deng et al.,2019).The soil water-surface temperature feedback operates under the premise that insufficient soil moisture in the preceding stages may greatly reduce evaporative cooling and amplify surface warming, favoring the occurrence of extreme heat.The atmospheric anticyclonic forcing is elucidated by the tendency for anticyclonic circulation anomalies to suppress convection and reduce cloud cover, thus on the one hand causing more diabatic or adiabatic heating at the surface and on the other hand causing compressional warming through large-scale subsidence, in turn increasing the occurrence of extreme heat.The extreme heat in North China is mainly influenced by the atmospheric anticyclonic forcing associated with the western Pacific subtropical high (WPSH)and continental high pressure over Eurasia (Wei et al.,2004; Wu et al., 2012; Zhou and Wu, 2016; Wang et al.,2018).Wu et al.(2012) found that the snow cover on the western Tibetan Plateau can influence the summer heatwave frequency in North China by strengthening the high pressure over Mongolia and its surrounding regions.Deng et al.(2019) found that the frequency of summertime extreme heat events in North China significantly correlates with sea surface temperature (SST) anomalies in the Indian Ocean and the Northwest Pacific.By combining the roles of the SST anomalies in the Indian Ocean and the Northwest Pacific, our study found that the decadal variability of the number of extreme heat days in early-to-mid summer in North China (NCSH) is closely linked to the Indo-Pacific warm pool and Northwest Pacific Ocean dipole (IPOD).
The IPOD, characterized by positive (negative) SST anomalies in the Northwest Pacific and negative (positive)SST anomalies in the Indo-Pacific warm pool, was first proposed in Zheng et al.(2014) based on the work of Li and Hu (2011).This climatological feature is manifest by a significant summertime anomalous SST pattern in the Indian and Pacific oceans that appears around May, strengthens in the following months, before weakening in September, and can significantly influence the summer climates of East Asia(Zheng et al., 2014; Yu et al., 2019).Zheng et al.(2014)found that the positive phase of the IPOD in summer can weaken and shrink the WPSH, which favors the strengthening of the East Asian summer monsoon (EASM), and vice versa.The relationship between the IPOD and the EASM in summer was also evaluated by Yu et al.(2019) based on the Coupled Model Intercomparison Project Phase 5 (CMIP5).Furthermore, Fig.4a in Zheng et al.(2014) shows that when the IPOD is in its positive phase, not only are there negative geopotential height anomalies in South China but also positive geopotential height anomalies in North China, suggesting that the IPOD may also exert some influence on the climate in North China.Our further study found that the IPOD in early-to-mid summer could have a significant influence on NCSH on decadal timescales
This paper discusses the significant decadal variability in NCSH and advances the premise that the decadal NCSH may be tied to the early-to-mid summer IPOD.The mechanism by which the early-mid summer IPOD influences the decadal NCSH is also investigated.The remainder of the text is organized as follows.The data and methodology employed in this study are described in section 2.In section 3, we investigate the decadal variability of NCSH and its relationship with the IPOD.In section 4, we investigate the mechanism by which the IPOD influences the decadal variability of NCSH.In section 5, we establish a decadal empirical model of NCSH by combining the early-to-mid summer IPOD and the linear trend of NCSH.A summary and discussion are given in section 6.
2.Data and methodology
2.1.Datasets
The datasets employed in this research include, 1) The daily meteorological dataset of basic meteorological elements of China National Surface Weather Stations (V3.0) covering the period 1951—2021 from the China Meteorological Administration (CMA) with 467 valid stations in North China under strict quality control, in which the daily surface air temperature (SAT) data are used; 2) The National Centers for Environmental Predictions-Department of Energy reanalysis 2 (NCEP-DOE reanalysis II) dataset covering the period 1979—2021 with a spatial resolution of 2.5° latitude × 2.5° longitude from the NOAA/ESRL (Kanamitsu et al., 2002), in which the atmospheric circulation data including wind, geopotential height and sea surface pressure (SLP) are employed;3) The Hadley Centre Sea Ice and Sea Surface Temperature dataset (HadISST) covering the period 1870—2021 with a spatial resolution of 1° × 1° from the Met Office Hadley Centre(Rayner et al., 2003).In this research, the above-mentioned datasets from 1981—2021 are analyzed.
2.2.Indices
In this research, a maximum daily temperature equal to or greater than 35°C is defined as an extreme heat day based on operational monitoring and forecasting necessity.June and July are referred to hereafter as early-mid summer.The latitude range of the North China region in this study is 35°-44°N, and the longitude range is 110°-120°E, as shown in Fig.2.The NCSH is calculated according to the areaweighted average of the number of extreme heat days in early-mid summer in North China; in this calculation, the number of extreme heat days is first calculated station by station and then interpolated onto a 0.5° × 0.5° grid.Another method that first spatially averages the daily maximum temperature over North China and then calculates the number of heat days that exceed a certain threshold (i.e., 90th percentile) was also applied and is not shown here because the study in this paper is not sensitive to the choice of the two methods mentioned above.Analogous to the definition in Zheng et al.(2014), the IPOD index (IPODI) is defined as the difference between the normalized area-weighted average SST anomalies of the Northwest Pacific (A1 region: 10°—40°N, 140°—170°E; nSSTaA1) and the Indo-Pacific warm pool (A2 region: 10°S—20°N, 90°—120°E; nSSTaA2) which are displayed in Fig.7a, and is formulated as follows:
To quantitatively characterize the horizontal circulation pattern in the East Asia-Northwest Pacific region corresponding to the period of high NCSH decadal variability, the East Asia-Northwest Pacific geopotential height quadrupole(EAWPQ) index is defined as follows:
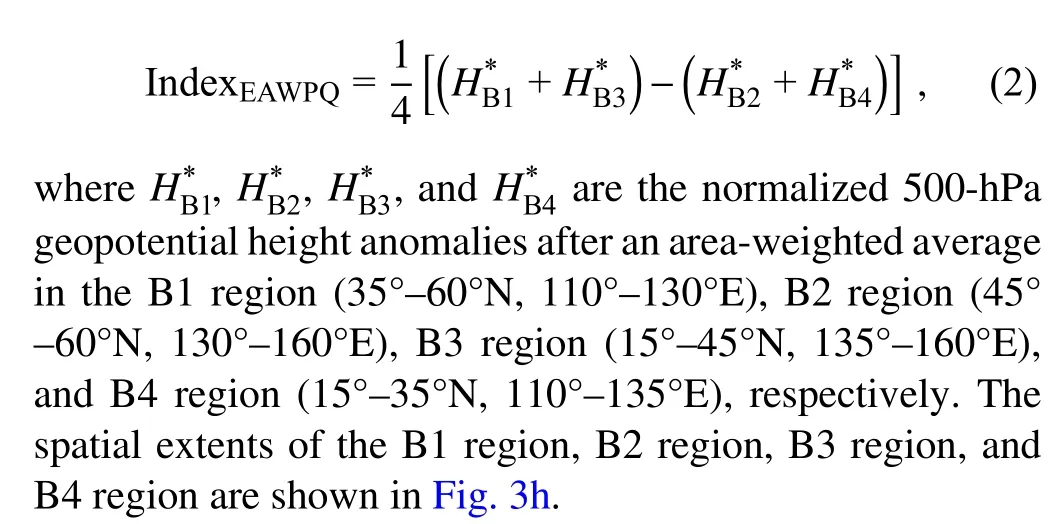
In this paper, these above indices are for early-mid summer unless otherwise specified.
2.3.Dynamical diagnosis
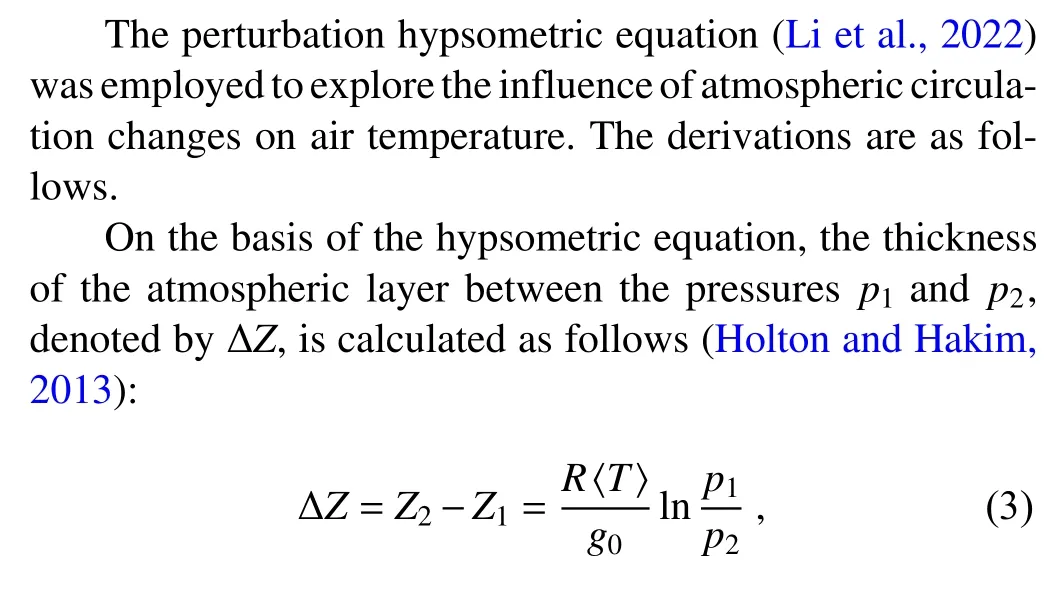
whereZ1andZ2denote the geopotential heights at pressuresp1andp2, respectively, the gas constant for dry air is given by R = 287 J kg—1K—1and g0= 9.80665 m s—2denotes the global average gravity at mean sea level.The mean temperature of the layer, denoted by ed by 〈T〉, can be written as follows:
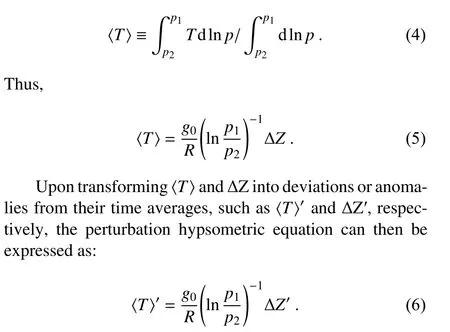
Therefore, the perturbation average temperature 〈T〉′of the layer is proportional to the perturbation thickness ΔZ? of the corresponding layer bounded by isobaric surfaces.When the perturbation layer thickness ΔZ? increases, the corresponding perturbation layer mean temperature〈T〉′increases and vice versa.We apply the perturbation hypsometric equation to estimate the layer-averaged temperature allowing us to discuss the influences of upper atmospheric circulation changes upon the air temperature anomalies over North China.
The linear baroclinic model (LBM; Watanabe and Kimoto, 2000) is employed to explore the influence of the IPOD on the EAWPQ pattern.In this study, a dry version of the LBM and an early-mid summer climatology consisting of a T21 horizontal resolution and 20 vertical levels obtained from the NCEP-NCAR reanalysis dataset are employed.The variables in the above-mentioned climatology include the zonal wind, meridional wind, vertical velocity(Pa s-1), temperature, geopotential height, surface pressure,stream function, and velocity potential.Further details on the LBM are described in Watanabe and Kimoto (2000).The LBM is integrated for 29 days, and the results after stabilization (the 10th modeled day) are used.
2.4.Statistical methods
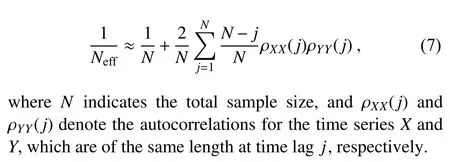
Since the analysis of this study is focused on a decadal timescale, a 7-year Gaussian low-pass filter is used to obtain the decadal series.A two-tailed t-test is then used to determine the significance levels of the correlation and regression.The number of effective degrees of freedomNeffis used to consider the influence of low-pass filtering on degrees of freedom, which can be calculated as follows: (e.g., Pyper and Peterman, 1998; Li et al., 2013; Xie et al.,2019):
Some other statistical methods are also employed, such as the area-weighted average, correlation analysis, composite analysis, regression analysis, etc.; however, the specific information therein is not detailed here.
3.Decadal variability in NCSH and relationship to IPOD
As shown in Fig.1a, there is a significant decadal variation characteristic in NCSH accompanied by a significant(>95% confidence level) linear-increasing trend of 0.22 days per decade.Relatively high NCSH occurred around 1997—2001 and around 2017—19, and relatively small NCSH was evident in 1981—96 and 2002—16 since the rapid global warming from 1981.The highest values of NCSH occurred in 2000, exceeding 3.6 days, followed by 1998 with more than 3.3 days, and the lowest value occurred in 1993 with less than 0.2 days.From 1981—2021, there were 24 years with an NCSH below 1 day, 17 years with values above 1.0 day, and 17 years with values below 0.6 days, indicating that years with larger NCSH occurred less frequently than years with lower NCSH.In addition, as shown by the red line in Fig.1a, a clear decadal characteristic is present in the number of early-mid summer heat stations in North China.Early-mid summer heat stations in North China after 1997 were significantly more numerous than before 1996.This trend is not discussed in further detail here as NCSH remains the primary concern of this study.
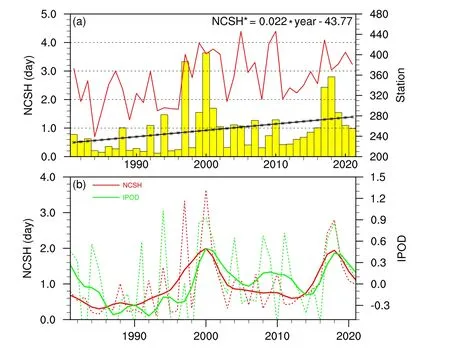
Fig.1.Time series of NCSH and IPOD indices.(a) Area-weighted average NCSH(units: d; bars) and the number of observation stations (red line) in North China for 1981—2021.The black line, marked with stars, is the linear trend of the NCSH series.(b) The red and green dashed lines denote the year-to-year series of NCSH and IPOD indices, respectively.The solid lines correspond to the decadal series of NCSH and IPOD indices in early-mid summer after applying a 7-year low-pass Gaussian filter,respectively.
To further analyze the decadal characteristics of NCSH,the time series for NCSH subjected to a 7-year Gaussian low-pass filter is shown in Fig.1b.It can be seen that NCSH has a clear decadal quasi-periodic variability with a cycle of about 20 years.Here, we set a one-day threshold as the cut-off value for the high and low-value years of NCSH on a decadal timescale.It is then clearly seen that the periods of 1981—95 and 2003—14 are low-value years of NCSH, and the periods of 1996—2002 and 2015—21 are the high-value years of NCSH on decadal timescales.It is revealed that there is a potential dynamical linkage between NCSH and IPOD on decadal timescales in early-mid summer.Similar to the NCSH, the early-mid summer IPOD index also has a significant decadal cyclic variation, with a correlation coefficient of 0.69 (>95% confidence level based on the effective degrees of freedom).Figure 2 shows the spatial correlation between the IPOD index and the number of extreme heat days in early-mid summer in North China.It is evident that the IPOD index also has a spatially consistent and significant spatial correlation with NCSH on the decadal scale.
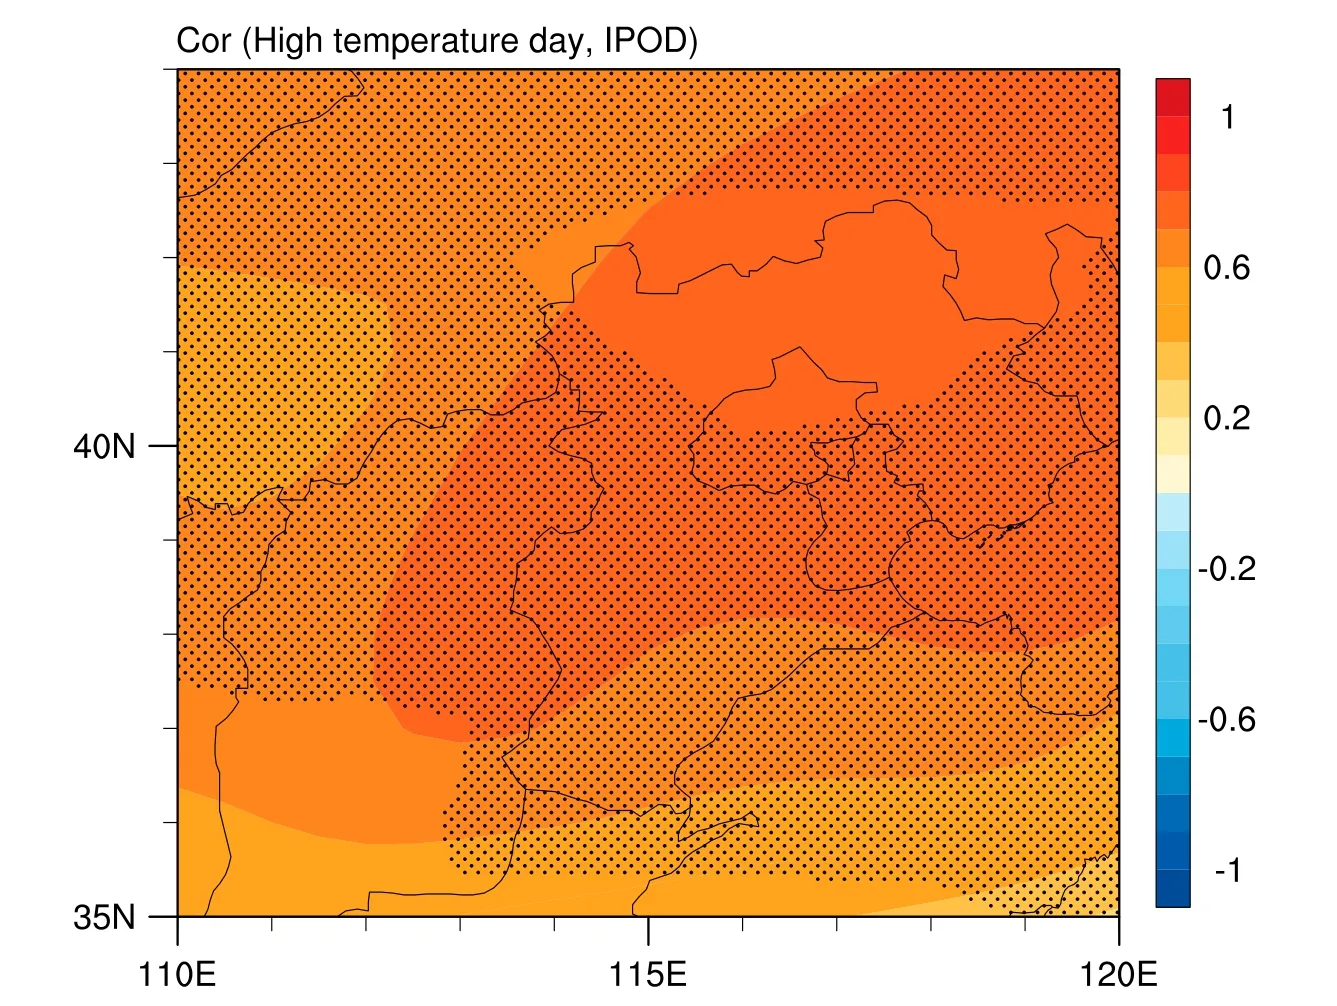
Fig.2.Correlation map between the early-mid summer IPOD index and extreme heat days over the North China region (35°-44°N, 110°-120°E)during 1981—2021 based on 7-year low-pass Gaussian filtered data.The blackdotted region represents the areas where the significance of the correlation coefficient exceeds the 90% confidence level using the effective number of degrees of freedom.
These results indicate that NCSH exhibits significant decadal variability and is significantly correlated with the IPOD index in early-mid summer, suggesting that the IPOD may influence the decadal variability of NCSH.
4.Mechanism of the IPOD influences on the decadal variability in NCSH
Further studies found that NCSH decadal variability is linked to the IPOD in early-mid summer, which can generate the EAWPQ circulation pattern and thus influences the NCSH decadal variability by modulating adiabatic expansion and compression of the air.The potential physical mechanisms by which the early-mid summer IPOD influences the decadal variability of NCSH are introduced in this section.
4.1.Relationship between the NCSH and EAWPQ
Extreme summer heat in North China is generally considered to be related to the interaction between the continental high pressure on the Eurasian continent and the western Pacific subtropical high (WPSH), which can influence the heat in North China by modifying the atmospheric pressure in North China and surrounding regions (Wu et al., 2012;Zhou and Wu, 2016; Wang et al., 2018).Therefore, the atmospheric circulation and its differences corresponding to the years of high and low values of NCSH are first analyzed here, and the corresponding climatological states are also given for the convenience of the analysis.
From the climatological states of the geopotential height and SLP in early-mid summer, the upper-level geopotential heights in the East Asia-Northwest Pacific region show a distribution of high in the south and low in the north,such as the 300-hPa (Fig.3a) and 500-hPa (Fig.3e) geopotential heights, and the lower levels show a distribution of high in the southeast and low in the northwest, such as the 850-hPa geopotential height field (Fig.3i) and SLP(Fig.3m).From the composites of the early-mid summer geopotential height anomalies for high NCSH years, positive geopotential height anomalies are stronger and constant in all levels such as 300 hPa (Fig.3b), 500 hPa (Fig.3f) and 850 hPa (Fig.3j), in the Baikal Lake and its surrounding regions and the Northwest Pacific region east of Japan.However, in the Okhotsk Sea region, negative geopotential height anomalies are present at all levels and in the SLP field (Fig.3n).The geopotential height anomalies in the South China-East China Sea regions are different in the upper and lower levels.For example, there are weaker positive anomalies at 300 hPa (Fig.3b), weaker negative anomalies at 500 hPa (Fig.3f), and enhanced negative anomalies at 850 hPa (Fig.3j).The negative anomalies are even more obvious in the SLP field (Fig.3n).Figures 3c, g, k, and 3o show the atmospheric circulation pattern in early-mid summer corresponding to the low-value years of NCSH is opposite to that described above.From the composite differences between the early-mid summer geopotential height anomalies and SLP anomalies in the high and low NCSH years(Figs.3d, h, l, p), the circulation pattern that favors increased NCSH is clearly seen.
The above results indicate that when stronger positive geopotential height anomalies are present in Baikal and its surrounding regions as well as in the Northwest Pacific region east of Japan and when negative geopotential height anomalies occur in the Okhotsk Sea region, it is favorable for enhanced NCSH on decadal timescales.At the same time,the geopotential height in the South China-East China Sea region experiences weak positive anomalies at the upper levels and negative anomalies at the lower levels.In other words, when a circulation pattern similar to the above occurs in the East Asia-Northwest Pacific region, it is favorable for heat to appear in North China.
For further study, the above circulation pattern in the East Asia-Northwest Pacific region corresponding to a highvalue year of NCSH is defined as the EAWPQ pattern, and the EAWPQ index is calculated, the details of which are given in section 2.2.As shown in Fig.4, the early-mid summer EAWPQ index is relatively consistent with the NCSH series over the period 1981—2021 on a decadal timescale, with a correlation coefficient of 0.82 (significant above the 95% confidence level based on the effective degrees of freedom), further indicating that the decadal variability of NCSH is significantly associated with the early-mid summer EAWPQ pattern.
4.2.Mechanism responsible for the effect of the EAWPQ on NCSH
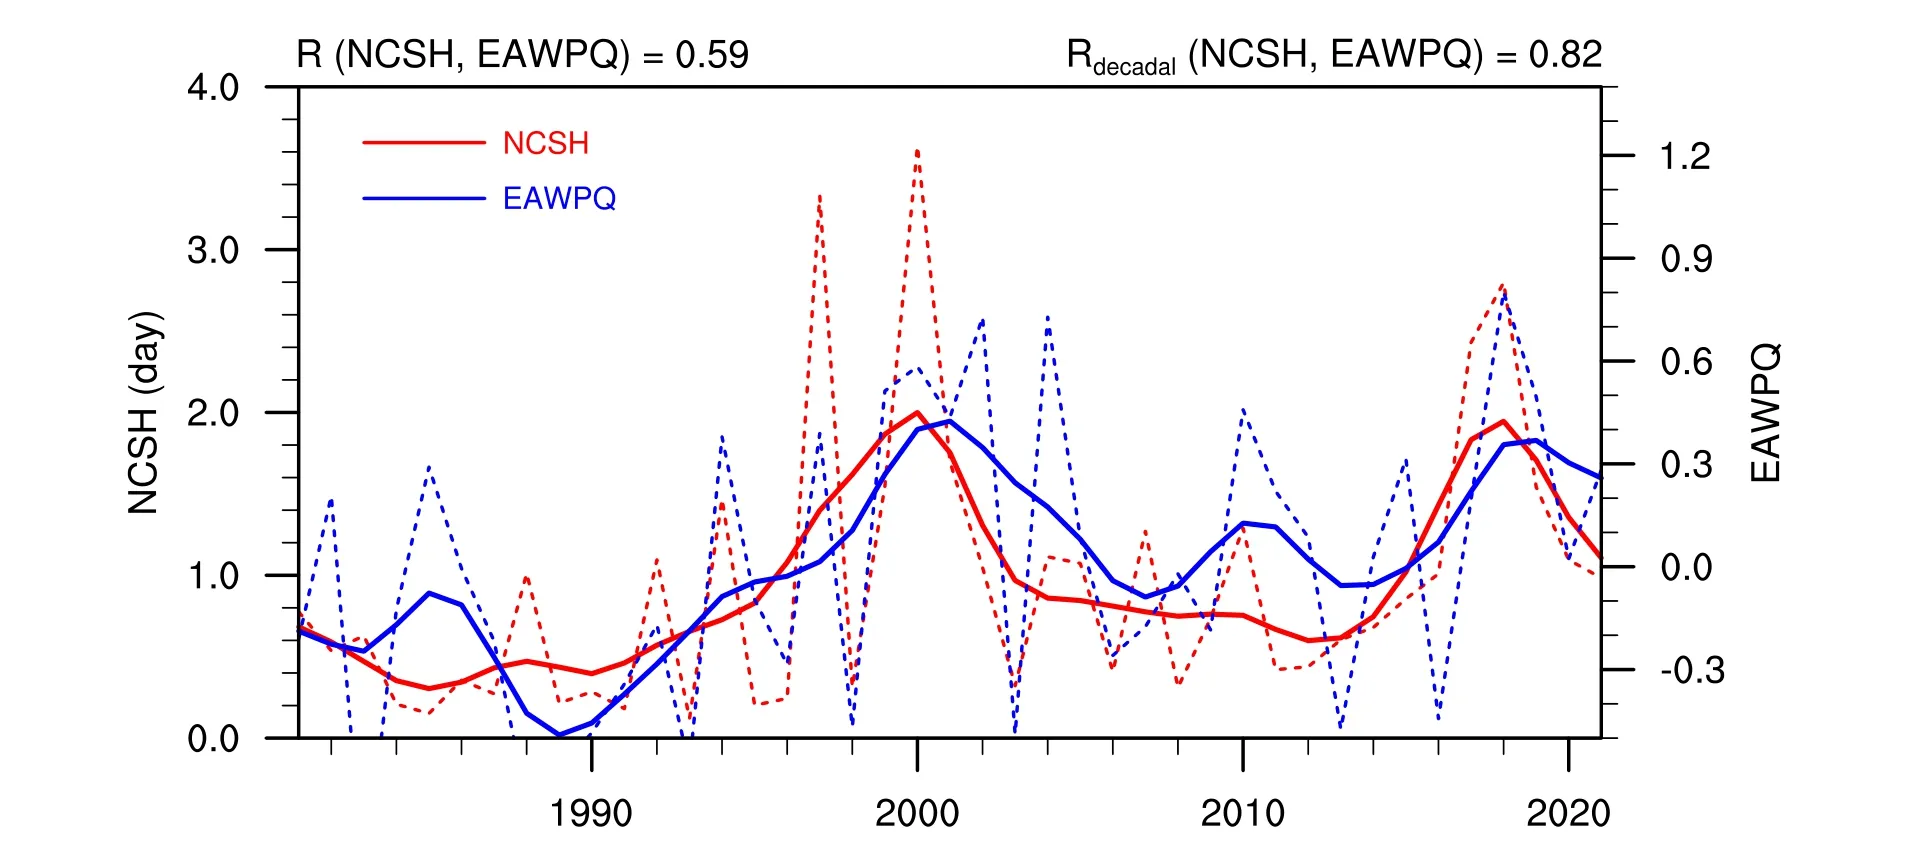
Fig.4.As in Fig.1b, but for the NCSH and EAWPQ indices in early-mid summer.
The physical mechanism by which the EAWPQ affects NCSH decadal variability is analyzed in this subsection.Figure 3 shows that during the period of high NCSH, positive geopotential height anomalies are present in the Northwest Pacific region east of Japan, while negative geopotential height anomalies are present in the lower levels and weaker positive geopotential height anomalies are present in the upper levels in the South China-East China Sea region, and these above regions are generally controlled by the WPSH in summer (e.g., Huang and Yu, 1962; Zhu et al., 2000;Zhou and Yu, 2005; He et al., 2007; Wang et al., 2018;Zhao et al., 2022) and are also representative of the two activity centers of the EAWPQ pattern located in the south.Therefore, these results suggest that when the control region of the WPSH is displaced eastward, or its control region is strong in the east (the Northwest Pacific region east of Japan) and weak in the west (the South China-East China Sea region), which also corresponds to the positive phase of the EAWPQ pattern, it is favorable for hot weather to occur in the North China region.This is easily understood because the WPSH often enhances precipitation in the adjacent western region due to efficient water vapor transport.However,when the control region of the WPSH is eastward, or its control region is strong in the east and weak in the west, as mentioned above, the location of enhanced precipitation in the adjacent western regions of the WPSH also shifts correspondingly eastward, which reduces the precipitation in North China and favors the occurrence of excessive heat in the region.
In addition, when the EAWPQ pattern in early-mid summer is in its positive phase, the geopotential height of its northwest polariton is strong, meaning that the North China region is controlled by high pressure, which also favors high NCSH.As shown in Fig.5, the climatological state as indicated by the composites of the geopotential height and meridional—vertical winds in early-mid summer averaged over 110°—130°E during 1981—2021 are used to advance research concerning the effect of the EAWPQ on NCSH decadal variability.As seen from the climatology, in earlymid summer, the vertical winds in North China are weaker than those in South China (Fig.5a).As shown in Fig.5b,when there are positive geopotential height anomalies over North China in all vertical levels, which corresponds to the positive phase of the EAWPQ pattern, there are strong downward vertical wind anomalies in North China which favor a high NCSH.Similar results can be seen in Figs.5c and 5d.
Figure 6 shows the time series of early-mid summer tropospheric mean temperature anomalies between 500 and 1000 hPa over North China, as evaluated by the perturbation hypsometric equation, to further study the influence of the upper-level atmospheric circulation on the decadal variability of NCSH.The temperature anomalies, as evaluated by the thickness anomalies between 500 and 1000 hPa pressure levels, are very consistent with the decadal NCSH.The correlation coefficient between the evaluated early-mid summer 500—1000-hPa layer mean temperature anomalies over North China and NCSH on a decadal timescale is 0.75,which is significant at a 95% confidence level based on the effective degrees of freedom.In addition, the correlation coefficients between the above-mentioned evaluated temperature anomalies and the IPOD and EAWPQ indices are 0.83 and 0.73, respectively, both exceeding the 95% confidence level.These results suggest that the EAWPQ can cause the expansion/compression of the air over North China by regulating the tropospheric thickness anomalies in North China, perhaps playing an essential role in the IPOD influencing the decadal variability of NCSH.
4.3.Relationship between the EAWPQ and IPOD
The correlation map between the EAWPQ index and SST anomalies in early-mid summer over the Northwest Pacific region and the Indo-Pacific warm pool region on the decadal scale is shown in Fig.7a.It can be seen that the early-mid summer EAWPQ index has a strong positive correlation with the decadal variability of SST anomalies over the Northwest Pacific region, especially in the region of 10°—40°N, 140°—170°E, and has a strong negative correlation with the decadal variability of SST anomalies over the Indo-Pacific warm pool, especially in the region of 10°S—20°N,90°—120°E.This illustrates that when positive SST anomalies occur in the Northwest Pacific region and negative SST anomalies occur in the Indo-Pacific warm pool region, it favors the circulation pattern associated with the EAWPQ positive phase in the East Asia-Northwest Pacific region.
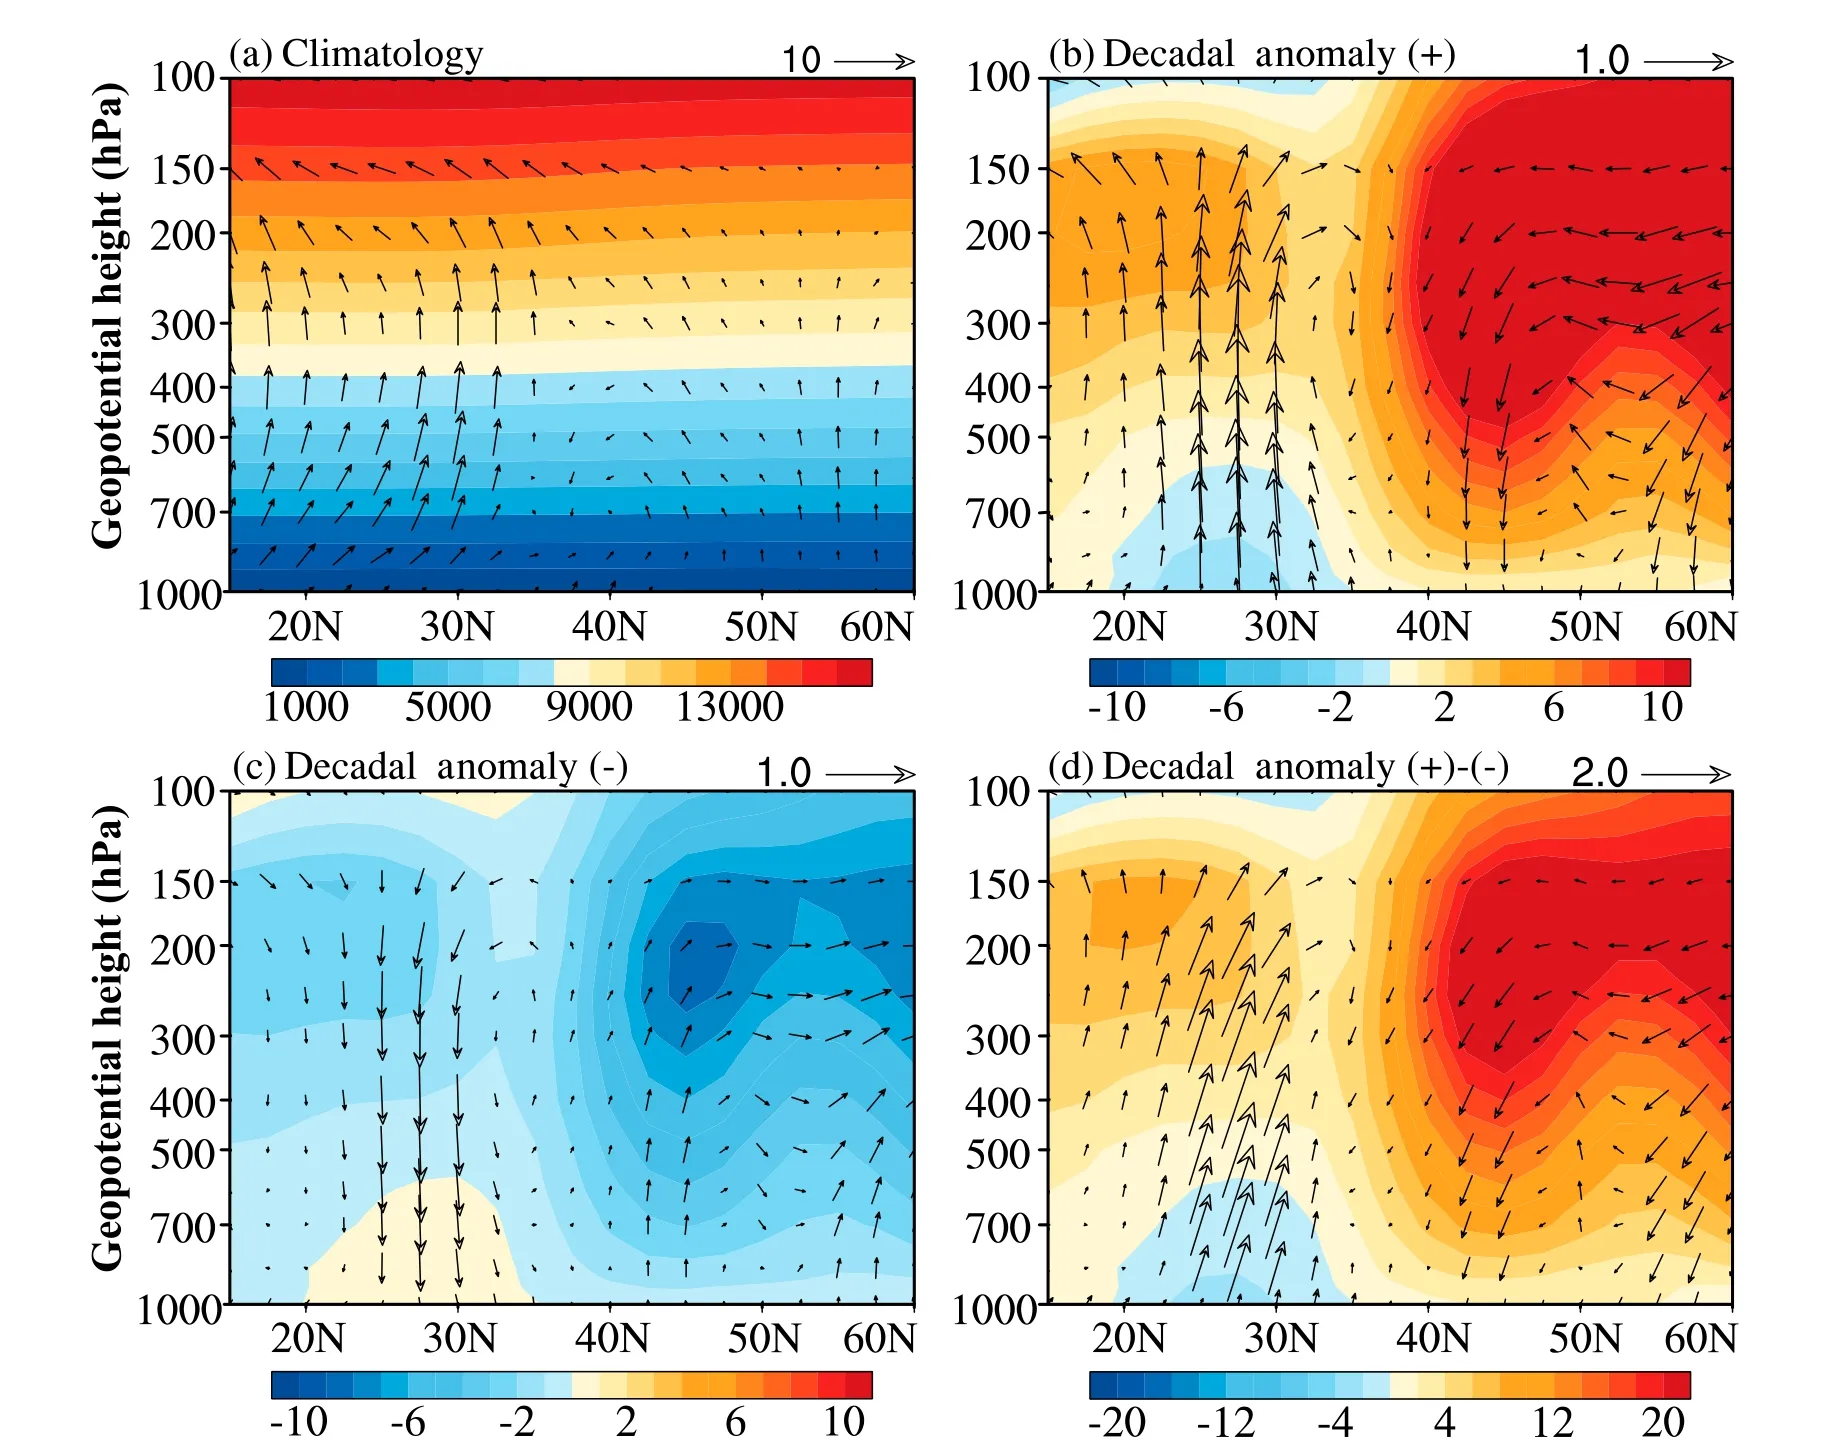
Fig.5.(a) The climatology of early-mid summer geopotential height (units: gpm; shading) and meridional—vertical winds (units: m s-1; vectors) averaged over 110°—130°E for 1981—2021.(b) The composite of early-mid summer geopotential height anomalies (units: gpm) and meridional—vertical winds anomalies during the period when the decadal NCSH is above one day.(c) As in (b), but for the period when the decadal NCSH is less than one day.(d) As in (b), but for the composite difference between (b) and (c).
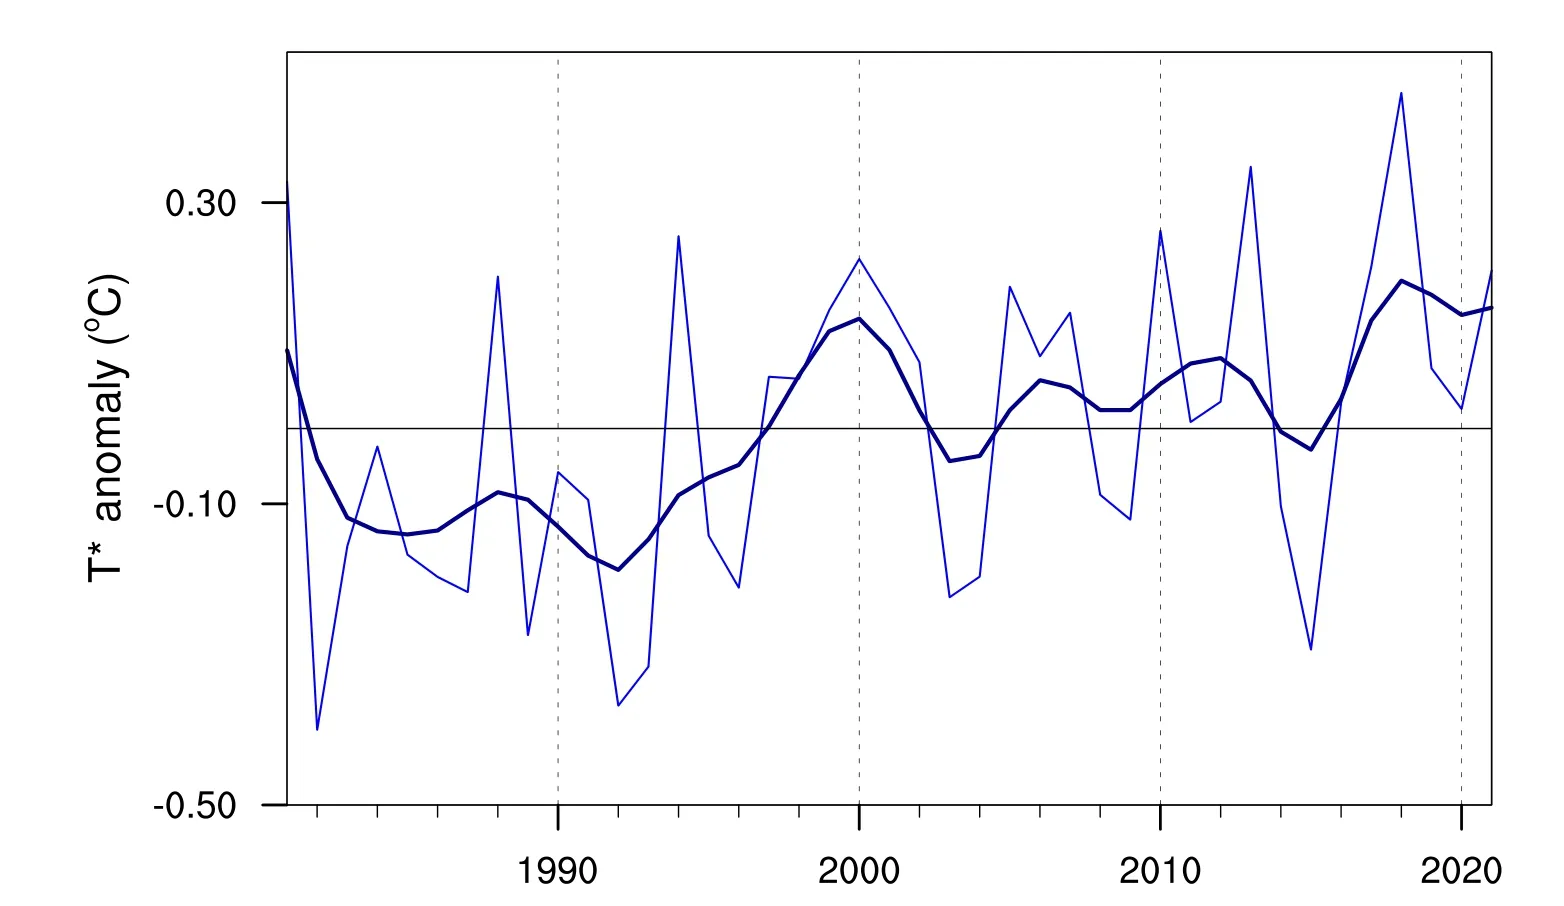
Fig.6.Time series of early-mid summer layer mean temperature anomalies in North China.The thin blue line is the area-weighted averaged tropospheric (500-1000 hPa) mean temperature anomalies in early-mid summer in the researched North China region, which is estimated from the perturbation hypsometric equation for the period 1981—2021.The solid dark blue line indicates the 7-year low-pass Gaussian filtered time series.
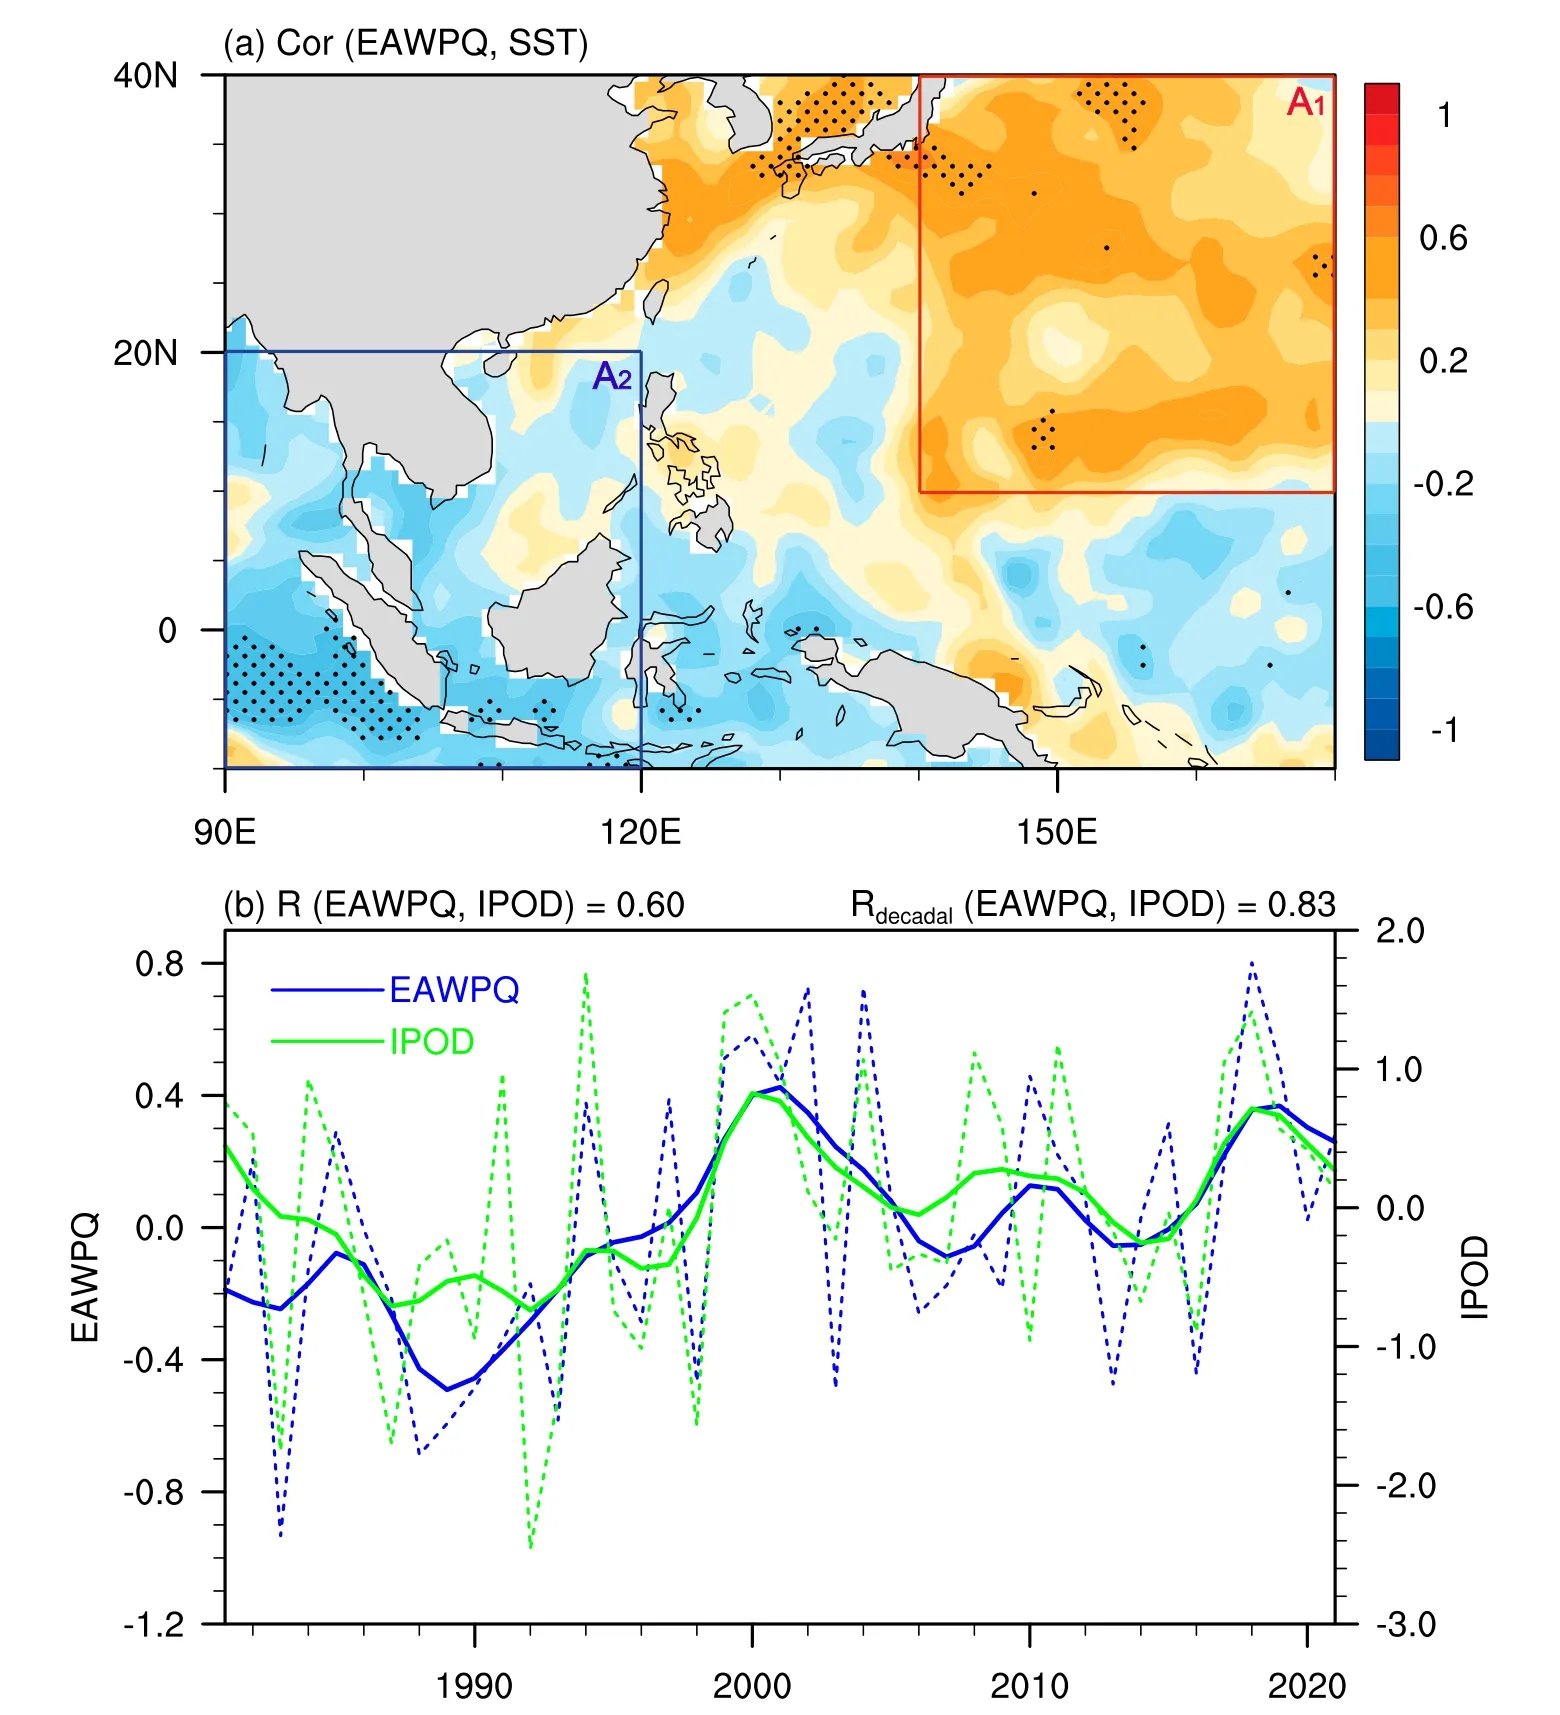
Fig.7.(a) Correlation map between the EAWPQ index and SST anomalies over the Northwest Pacific region (A1 region) and the Indo-Pacific warm pool region (A2 region) in early-mid summer during 1981—2021 based on 7-year low-pass Gaussian filtered data.The black dotted region represents the significance of the correlation coefficient above the 90%confidence level using the effective number of degrees of freedom.(b) As in Fig.1b, but for the EAWPQ and IPOD indices.
Furthermore, the time series of early-mid summer EAWPQ and IPOD indices are given in Fig.7b, and it can be seen that the two have similar trend change characteristics on the decadal scale over the period 1981—2021.The correlation coefficients between the EAWPQ and IPOD indices in early-mid summer are 0.60 on the annual scale and 0.83 on the decadal scale, both exceeding the 95% confidence level based on the effective degrees of freedom.This further suggests a potential connection between the EAWPQ pattern and IPOD in early-mid summer and that the EAWPQ may be an intermediate factor for the early-mid summer IPOD influencing the decadal variability of NCSH.
4.4.Mechanisms responsible for the effect of the IPOD on EAWPQ
First, as shown in Fig.8, the regression patterns of the normalized geopotential height anomalies and meridional—vertical winds anomalies averaged over 110°—130°E in earlymid summer against the IPOD indices on the decadal scale are very similar to Fig.5d.This result suggests that the IPOD may be able to excite upward vertical wind anomalies in the South China-East China Sea region, which can shift the position of the WPSH to the east or weaken its control intensity in the South China-East China Sea region.This condition can reduce the water vapor transported to the North China region, thus reducing the precipitation, which is not conducive to the emergence of heat days in North China.This also corresponds to the two polaritons of the EAWPQtype circulation anomalies located in the west.
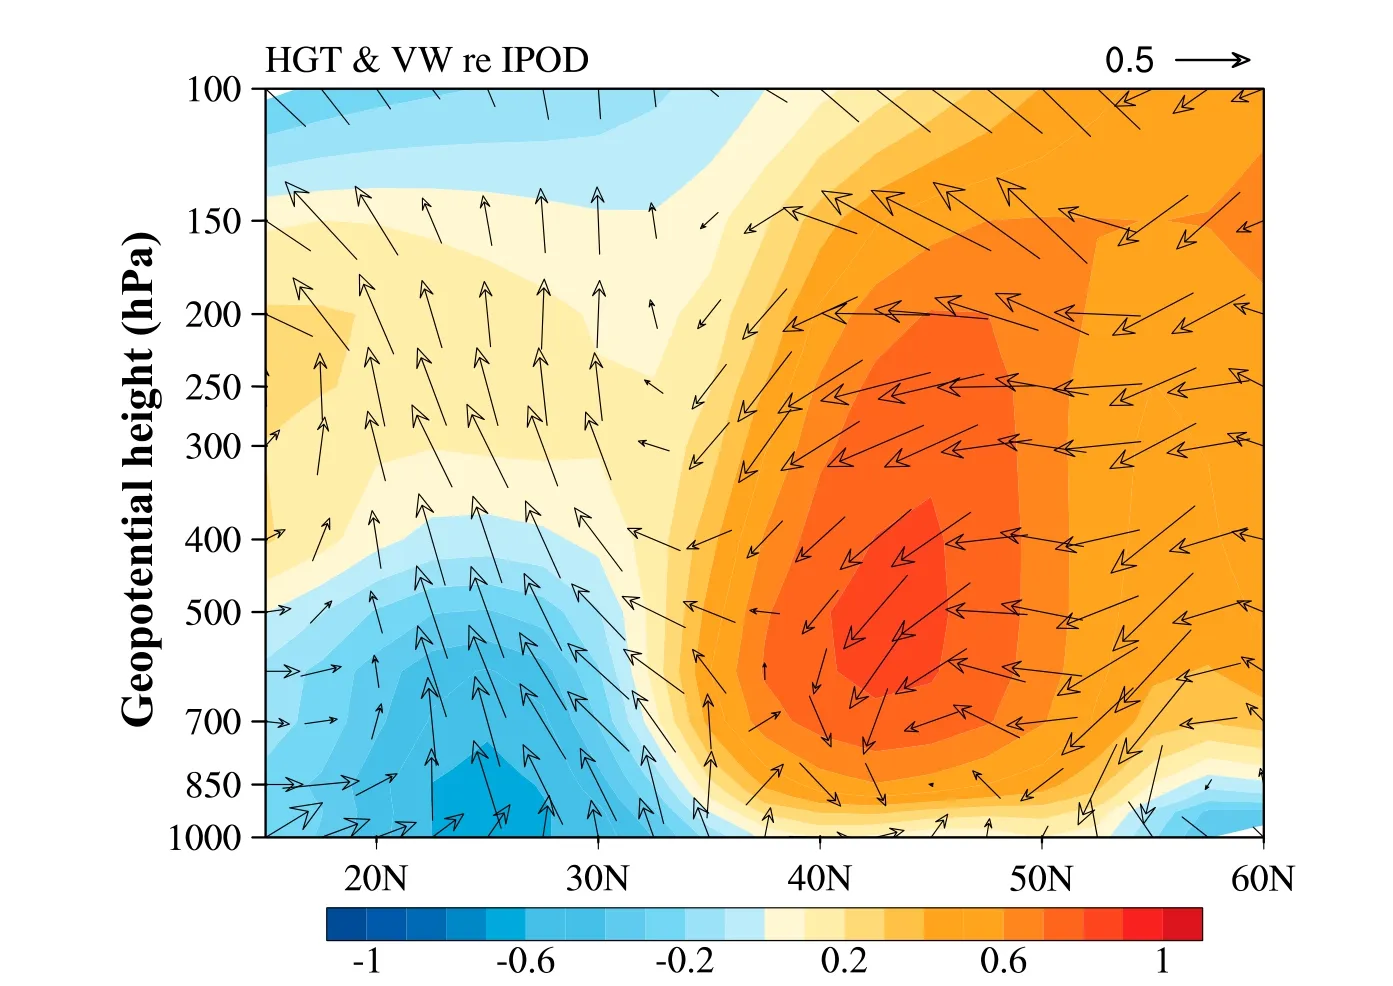
Fig.8.The regression coefficients of the normalized geopotential height anomalies (shading) and meridional—vertical winds anomalies (vectors)averaged over 110°—130°E against IPOD indices for the period 1981—2021.
Meanwhile, to further explore the physical mechanism of the IPOD influencing the EAWPQ in early-mid summer,three idealized simulations based on the LBM (Watanabe and Kimoto, 2000) were conducted in this section.The first idealized simulation sets up a positive SST forcing in the Northwest Pacific region (A1 region), and the stable geopotential height anomalies of 300 hPa (Fig.9a), 500 hPa (Fig.9b),850 hPa (Fig.9c), and 1000 hPa (Fig.9d) are obtained after integration.It can be seen that the positive geopotential height anomalies located in the Baikal Lake and its surrounding regions and the Northwest Pacific region east of the Sea of Japan and the negative geopotential height anomalies located in the Okhotsk Sea region correspond to the positive EAWPQ pattern.Still, the negative geopotential height anomalies contained within the southwest pole of the EAWPQ pattern have not been simulated.The second idealized simulation sets up a negative SST forcing in the Indo-Pacific warm pool region (A2 region), and the stable geopotential height anomalies of 300 hPa (Fig.9e), 500 hPa(Fig.9f), 850 hPa (Fig.9g), and 1000 hPa (Fig.9h) are obtained after integration.It can be seen that the positive geopotential height anomalies in the northwestern part of the EAWPQ pattern are more shifted, but the negative geopotential height anomalies in its southwestern part can be simulated, despite a slight shift in their location.The third idealized simulation sets up a positive SST forcing in the Pacific Northwest region and a negative SST forcing in the region of the Indo-Pacific warm pool to obtain stable geopotential height anomalies at 300 hPa (Fig.9i), 500 hPa (Fig.9j), 850 hPa(Fig.9k), and 1000 hPa (Fig.9l) after integration.It can be seen that the anomalies in the geopotential height field, similar to that of the EAWPQ pattern in its positive phase, can be obtained.This is especially obvious at 500 hPa.Undeniably,there are some discrepancies with the observations, which may be related to the fact that fewer climatic factors were considered, and only linear forcing was considered in the idealized LBM experiment.The results of these simulations suggest that the emergence of the EAWPQ pattern needs the joint forcing of positive SST anomalies located in the Northwest Pacific region and negative SST anomalies located in the Indo-Pacific warm pool region rather than just one of them.In other words, the anomalous SST field of the IPDO pattern can excite the anomalous geopotential height field of the EAWPQ pattern.
In addition, previous studies have arrived similar conclusion.During the boreal summer, when the IPOD is in its positive phase, the WPSH weakens and narrows (Zheng et al.,2014).Based on the above findings, we propose that the IPOD influences the decadal variability of NCSH through the EAWPQ.The IPOD first enhances vertical wind anomalies in the South China and East China Sea region, accompanied by an eastwardly displaced or weakly-intense WPSH,generating a positive phase EAWPQ circulation pattern in the East Asia-Northwest Pacific region, and then enhances the decadal variability of NCSH by adiabatically compressing the atmosphere over the North China region, and vice versa.
5.Decadal climate model of NCSH
In practical climate prediction operations, the SST can be better predicted than the atmospheric circulation.Thus,the IPOD index obtained based on SST may be used to predict the decadal variability of NCSH.Here, two empirical models for the decadal variability of NCSH are constructed based on the IPOD index, one of which does not consider the linear trend of the NCSH decadal variability, while the other one does.Without considering the linear trend of NCSH, the decadal NCSH model is established as follows:
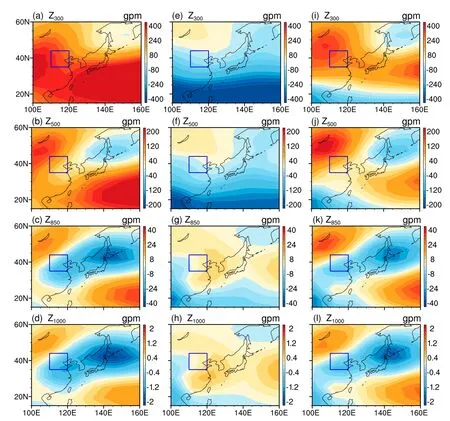
Fig.9.(a) The horizontal 300-hPa geopotential height anomalies (units: gpm) derived from the LBM using summer basic states and a thermal forcing source located in Northwest Pacific (10°-40°N, 140°-170°E).(b) As in (a), but the forcing source is a cold source which is located in Indo-Pacific warm pool region (10°S-20°N, 90°-120°E).(c) As in (a), but the forcing sources are mixtures of the thermal forcing source located in Northwest Pacific and the cold source located in Indo-Pacific warm pool region.(d—f), (g—i), and (j—l) As in (a—c), but for the geopotential heights at 500 hPa, 850 hPa and 1000 hPa, respectively.The researched North China region is surrounded by a blue box.
where NCS H? denotes the modeled NCSH, t is the time in years, the coefficients a1, and e1are empirically obtained by linear regression, and the approximation of the variance between the modeled and the observed NCSH is consistent with the decadal timescale.As shown in Fig.10a, this decadal NCSH model can reflect the decadal variability of NCS H?close to the observed decadal NCSH, such as the high values of the decadal NCSH around 2000 and 2018,and almost all observed decadal NCSH are in the 2-sigma uncertainty range of modeled values.The correlation coefficient between the observed and the modeled decadal NCSH is 0.69, whose significance exceeds the 95% confidence level based on the effective degrees of freedom.These results indicate that this decadal NCSH model can better simulate the decadal NCSH compared to an empirical model based solely on the IPOD index, and further validate that the decadal variability of NCSH is significantly tied to the IPOD in early-mid summer.
Another decadal NCSH model that considers the linear trend of NCSH is established as follows:
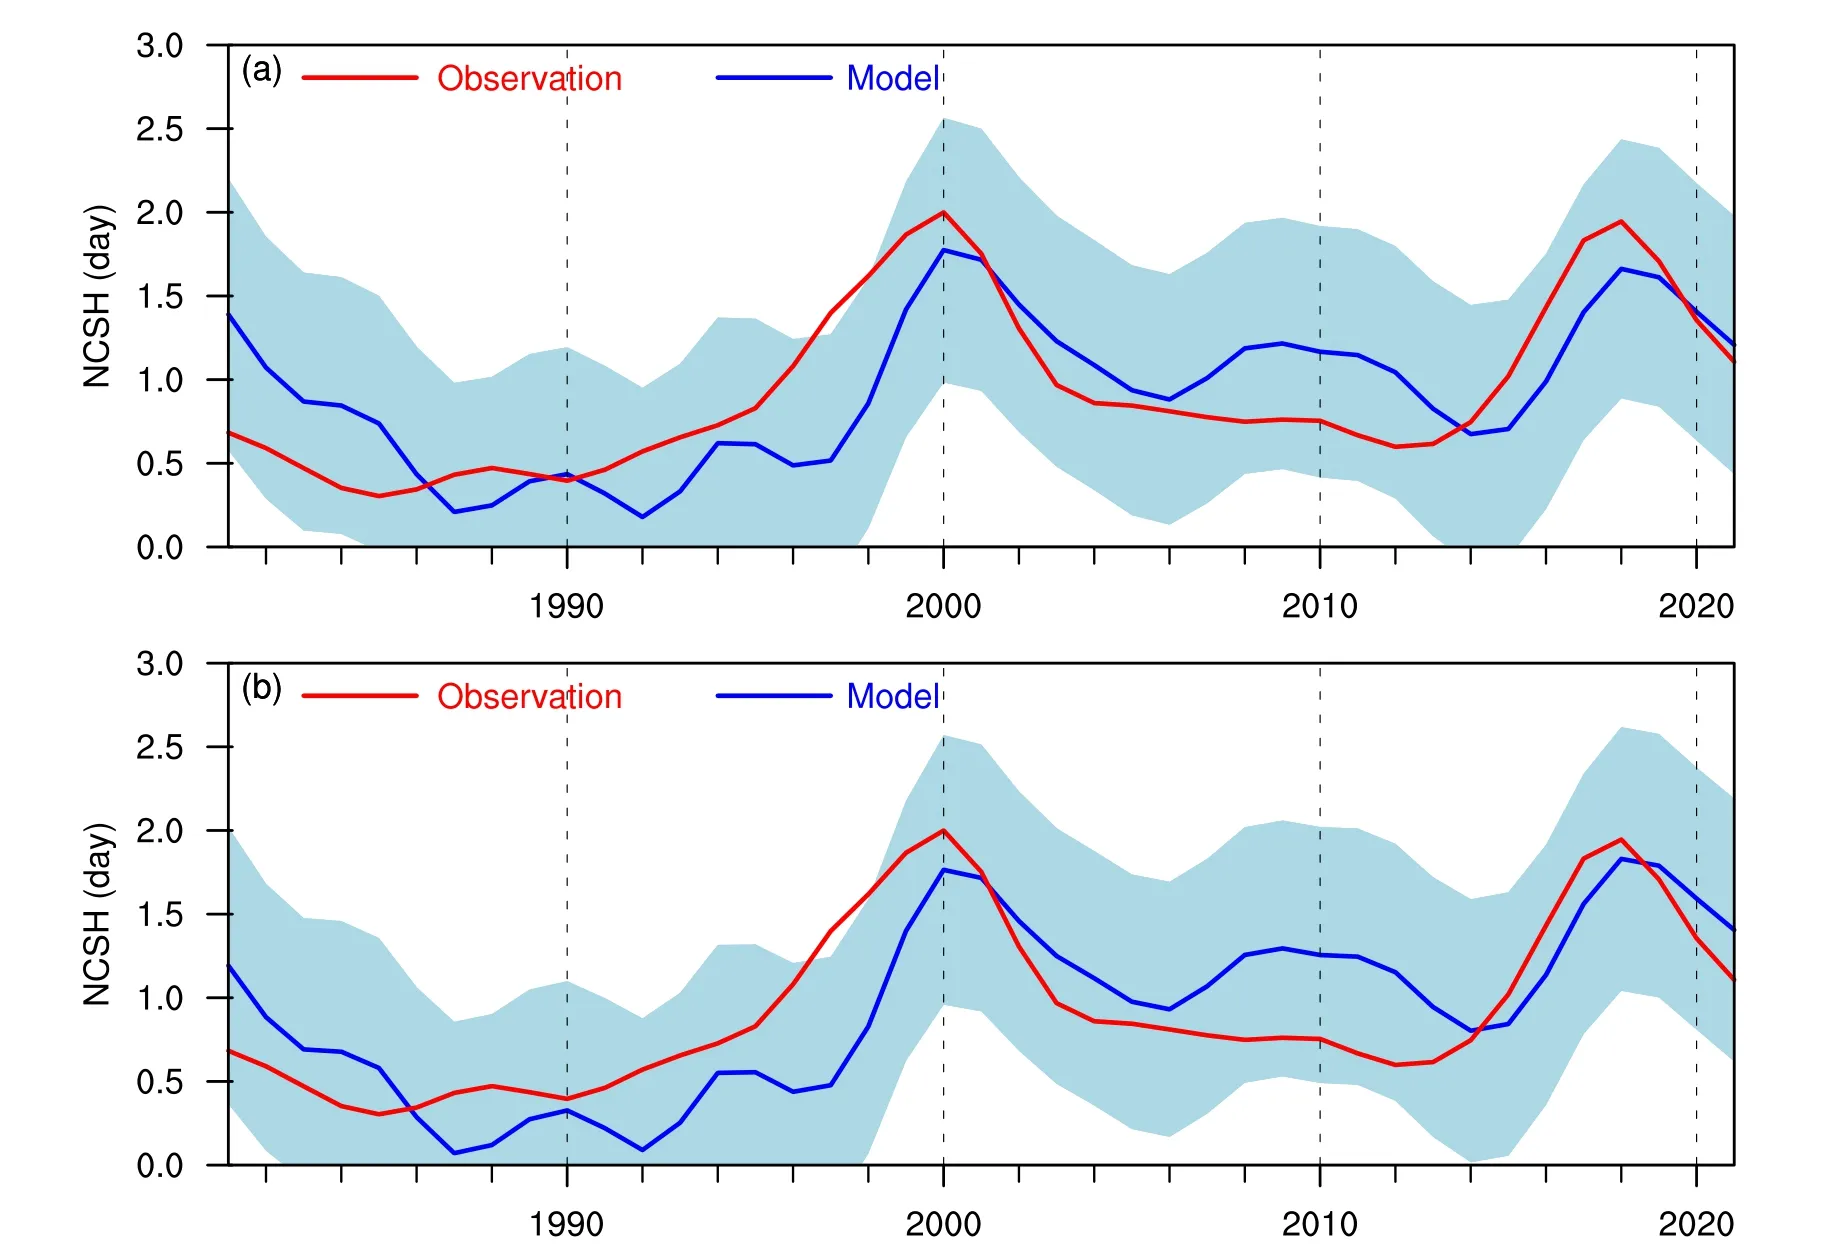
Fig.10.(a) Observed (red line) and modeled NCSH (blue line) on decadal scale for the period 1981—2021.The 2-sigma uncertainty range of the modeled NCSH are represented as the shaded areas.(b) As in (a), but the trend item is added in the model.
where only the linear trend term b2t is added compared to Eq.(8), the coefficients a2, b2, and e2are determined in the same way as the previous Eq.(8).As shown in Fig.10b,after adding the linear trend term, the empirical model can better simulate the decadal NCSH and the correlation coefficient between the observed and the modeled decadal NCSH increases to 0.72.This result indicates that the empirical model can even better simulate the decadal NCSH with the inclusion of the linear trend term and that the decadal variability of NCSH may be a combined contribution of the decadal IPOD and external linear forcing.
6.Summary and discussion
In this study, we have investigated the linkage of the decadal variability of NCSH with the IPOD since 1981.It was found that NCSH is subjected to significant decadal variability, with relatively high values around 1996—2002 and 2015—21 and relatively small values around 1981—95 and 2003—14, on a decadal timescale, since the rapid global warming from 1981.Further studies found that the decadal NCSH may be tied to the early-mid summer IPOD, which also exhibits significant decadal cyclic variations, similar to that of the decadal NCSH, and the correlation coefficient between the decadal NCSH and the IPOD index in earlymid summer exceeds 0.69, and it is also consistent in the spatial field.The evidence presented reveals a potential dynamic linkage between the decadal NCSH and the IPOD in early-mid summer, suggesting that the decadal variability of NCSH may be influenced by the early-mid summer IPOD.
Next, the physical mechanisms by which the early-tomid summer IPOD influences the decadal NCSH are analyzed.First, based on the composites of the early-to-mid summer geopotential height and SLP anomalies over the East Asia-Northwest Pacific region in the high and low NCSH years, it is found that when there is the combination of positive geopotential height anomalies in the Baikal Lake and its surrounding regions and the Northwest Pacific region east of Japan, negative geopotential height anomalies in the Okhotsk Sea region, and positive geopotential height anomalies in the upper levels of the South China-East China Sea region and negative geopotential height anomalies in its lower levels, it is favorable for the increase of the decadal NCSH.In light of this, an EAWPQ pattern, as described above, is defined with its early-to-mid summer index significantly correlated with the NCSH on a decadal timescale.Based on the perturbation hypsometric equation, we find that the early-to-mid summer EAWPQ can cause either the expansion or compression of the air over North China by regulating the tropospheric thickness anomalies in North China,suggesting that the early-to-mid summer EAWPQ might play an essential role in the IPOD influencing the decadal NCSH.
Second, the relationship between the EAWPQ and the IPOD in early-to-mid summer on decadal scales and the physical mechanisms by which the IPOD influences the EAWPQ are analyzed.We found that the early-to-mid summer EAWPQ index has a strong positive correlation with the decadal variability of SST anomalies over the Northwest Pacific region, and has a strong negative correlation with the decadal variability of SST anomalies over the Indo-Pacific warm pool, consistent with the regions of the IPOD positive and negative poles.The correlation coefficient between the EAWPQ index and the IPOD index in early-tomid summer reached 0.83, implying that there may be a dynamic linkage between the two.Based on the LBM and previous studies, we found that the positive IPOD in early-tomid summer can excite upward vertical wind anomalies in the South China-East China Sea region, shifting the position of WPSH to the east or weakening its control intensity in the South China-East China Sea region, thus generating a positive phase EAWPQ circulation pattern in the East Asia-Northwest Pacific region.
Finally, two empirical models for the decadal NCSH are constructed based on the IPOD index.The decadal NCSH based on the early-to-mid summer IPOD index can simulate the decadal NCSH relatively well and further validate that the decadal variability of NCSH is significantly tied to the IPOD in early-mid summer.After the linear trend term is added to the decadal NCSH model, the correlation coefficient between the modeled and the observed decadal NCSH increases to 0.72.These results further suggest that the decadal variability of NCSH may be a combined contribution of the decadal IPOD and external linear forcing.It should be pointed out that although the contribution of the linear trend to the decadal NCSH is weak relative to that of the decadal IPOD, it does not mean that global warming is entirely independent of the decadal variability of the NCSH.It is possible that global warming can indirectly affect the decadal NCSH by influencing the SST, such as the IPOD pattern.
Note that this work only analyzed the linkage of the decadal NCSH with the IPOD and the physical mechanisms by which the IPOD influences the decadal NCSH in early-tomid summer.Although it is undeniable that the continental high pressure over Eurasia has been integrated into the EAWPQ pattern described here, upstream climate factors in the North Atlantic and other locations also influence it.This teleconnection is worthy of further exploration in the future.Finally, due to the limitations of the built-in climatology of the LBM, the LBM simulations of this study used the climatology from the NCEP data (based on the average for the period 1958—1997).In the future, the adaptation of global climate models can better reproduce the corresponding atmospheric circulation to IPOD forcing.
Acknowledgements.This work was jointly supported by the National Natural Science Foundation of China (Grant Nos.42130610, 42075040, and 42175078), the Joint Research Project for Meteorological Capacity Improvement (Grant No.22NLTSQ002), Guangdong Major Project of Basic and Applied Basic Research (2020B0301030004), and the Innovation and development project of China Meteorological Administration (Grant No.CXFZ2022J030).The authors wish to thank all data providers and two reviewers for their constructive suggestions.Thanks to Dr.Michiya HAYASHI from the National Institute for Environmental Studies of Japan for providing the LBM code.
 Advances in Atmospheric Sciences2023年9期
- Advances in Atmospheric Sciences的其它文章
- The 17th Workshop on Antarctic Meteorology and Climate and 7th Year of Polar Prediction in the Southern Hemisphere Meeting
- Modulation of the Wind Field Structure of Initial Vortex on the Relationship between Tropical Cyclone Size and Intensity
- A Lagrangian Trajectory Analysis of Azimuthally Asymmetric Equivalent Potential Temperature in the Outer Core of Sheared Tropical Cyclones
- Coupling of the Calculated Freezing and Thawing Front Parameterization in the Earth System Model CAS-ESM
- The Processes-Based Attributes of Four Major Surface Melting Events over the Antarctic Ross Ice Shelf
- Hybrid Seasonal Prediction of Meridional Temperature Gradient Associated with “Warm Arctic-Cold Eurasia”