
Mongolia Contributed More than 42% of the Dust Concentrations in Northern China in March and April 2023
2023-09-07 07:48:38SiyuCHENDanZHAOJianpingHUANGJiaqiHEYuCHENJunyanCHENHongruBIGaotongLOUShikangDUYueZHANGandFanYANG
Advances in Atmospheric Sciences 2023年9期
Siyu CHEN, Dan ZHAO, Jianping HUANG*, Jiaqi HE, Yu CHEN, Junyan CHEN, Hongru BI,Gaotong LOU, Shikang DU, Yue ZHANG, and Fan YANG
1Key Laboratory for Semi-Arid Climate Change of the Ministry of Education, Lanzhou University, Lanzhou 730000, China
2Institute of Desert Meteorology, China Meteorological Administration, Urumqi 830002, China
ABSTRACT Dust storms are one of the most frequent meteorological disasters in China, endangering agricultural production,transportation, air quality, and the safety of people’s lives and property.Against the backdrop of climate change, Mongolia’s contribution to China’s dust cannot be ignored in recent years.In this study, we used the Weather Research and Forecasting model coupled with Chemistry (WRF-Chem), along with dynamic dust sources and the HYSPLIT model, to analyze the contributions of different dust sources to dust concentrations in northern China in March and April 2023.The results show that the frequency of dust storms in 2023 was the highest observed in the past decade.Mongolia and the Taklimakan Desert were identified as two main dust sources contributing to northern China.Specifically, Mongolia contributed more than 42% of dust, while the Taklimakan Desert accounted for 26%.A cold high-pressure center, a cold front, and a Mongolian cyclone resulted in the transport of dust aerosols from Mongolia and the Taklimakan Desert to northern China, where they affected most parts of the region.Moreover, two machine learning methods [the XGBoost algorithm and the Synthetic Minority Oversampling Technique (SMOTE)] were used to forecast the dust storms in March 2023, based on ground observations and WRF-Chem simulations over East Asia.XGBoost-SMOTE performed well in predicting hourly PM10 concentrations in China in March 2023, with a mean absolute error of 33.8 μg m-3 and RMSE of 54.2 μg m-3.
Key words: dust aerosol, Mongolian dust, transboundary contribution, WRF-Chem, HYSPLIT model
1.Introduction
China is one of the countries most severely affected by meteorological disasters, and dust storms are the most common meteorological disaster type in northern China.These storms are characterized by their suddenness and wide-ranging impact, posing significant threats to socioeconomic development, the ecological environment, and the safety of people’s lives and property (Qian et al., 2004).Therefore, identifying and forecasting dust storms is crucial for disaster prevention and mitigation.
Although significant progress has been made in combating desertification in China in recent years (Zhang and Huisingh, 2018), nearly 90% of Mongolia’s land area, which borders China, has become the most important foreign dust source area, posing a serious threat to the construction of an ecological security barrier in northern China (Zhang and Gao, 2007;Vova et al., 2015).As the upstream weather region of China, the frequency of dust storms in Mongolia’s Gobi region has increased almost fourfold compared to the 1960s (METM, 2018).Transboundary dust from Mongolia accounts for approximately 50% of the total dust days in China, making it a significant source of dust disaster weather in the country (Bao et al.,2021).The “3.15”event in 2021 witnessed a severe dust storm across East Asia from Mongolia, causing the strongest and most extensive dust storm weather in almost a decade (Yin et al., 2022).It affected 12 provinces in China, with the affected area exceeding 3.8 million square kilometers and resulting in a direct economic loss exceeding 30 million yuan.
However, the current forecasting capability for transboundary dust events from Mongolia is insufficient and contains uncertainties.The accuracy rate for forecasting such events is currently only 30%—51%, with false alarms peaking at 49%—70%.In addition, the forecast score for transboundary dust events in Mongolia lags behind that for local dust storms in China by more than 60%, representing a critical deficiency that severely constrains the overall quality of dust storm forecasting in China.Large uncertainties exist in the early identification and monitoring of transboundary dust transport in Mongolia,leading to overestimation of weak dust processes and significant uncertainties in dust simulation in Northeast China.Accurately simulating Mongolian dust and revealing the transboundary transport pathway, as well as the contribution of Mongolian dust to China, is of great significance to dust forecasting in China.
China has encountered 12 episodes of dust events in 2023 as of 30 April, marking the highest occurrence in nearly a decade.The frequency and intensity of these dust events have raised concerns regarding their impact on public health and the environment, as well as their potential to disrupt transportation and economic activities.It is crucial to improve our understanding of the sources, transport pathways, and meteorological conditions associated with dust events in March and April 2023, with the aim of enhancing our ability to predict and mitigate their impacts.This study seeks to investigate the contributions of different dust sources to dust concentrations in northern China by numerical modeling and improve the prediction accuracy of numerical model predictions by machine learning.
2.Methods and datasets
2.1.WRF-Chem model
The Weather Research and Forecasting Model coupled with Chemistry (WRF-Chem) is a new online coupled meteorological and chemical model developed by a collaboration of several research institutions, including the National Center for Atmospheric Research and the National Oceanic and Atmospheric Administration.It includes a variety of physical and chemical processes, such as transport (including advection, diffusion and convection processes), wet and dry deposition, vapor chemistry, aerosol formation, radiation and photolysis, and biological emissions, and complete coupling and online feedback between meteorological models and chemical transport processes at specific temporal and spatial resolutions (Grell et al.,2005).
Previous studies have employed static land cover types to classify potential dust sources, ignoring dynamic variations in surface bareness, which may lead to large uncertainties in the simulated dust emission fluxes.Therefore, here, MODIS NDVI datasets combined with the terrain feature function were used to construct the dynamic dust source in the modeling process.Moreover, version 3.9.1 of WRF-Chem was used in this study, which has a Lambert projection and single nested mesh.With 40°N and 105°E as the center, the number of horizontal grid points was 200 (in the east—west direction) × 200 (in the north—south direction), and the grid resolution was 30 km.
2.2.HYSPLIT model
This study used the HYSPLIT (Hybrid Single-Particle Lagrangian Integrated Trajectory) model to simulate the source and diffusion pathways of air pollutants (Stein et al., 2015).The model has wide applicability in analyzing the transport and diffusion of atmospheric pollutants by calculating backward air quality trajectories at different altitudes and times based on given meteorological datasets.
2.2.1.Trajectory cluster analysis
Trajectory cluster analysis categorizes airmass trajectories that arrive at a research point based on spatial similarity, determining the dominant airflow direction and potential pollutant sources.TrajStat software in a GIS performs cluster analysis using angle or Euler clustering.This study used Euler clustering to classify airflow trajectories into three categories based on propagation speed and direction in different seasons.The aim was to analyze the source and transmission paths of a dust storm event in Beijing and Hohhot on 10 March 2023.
2.2.2.Concentration weighted trajectory (CWT) analysis
CWT is a method used to quantitatively estimate pollutant concentrations at each grid point, reflecting pollution levels.It assigns a weighted concentration to each grid unit by averaging the sample concentrations of relevant trajectories passing through that unit.The CWT calculation formula is
2.3.Machine learning algorithms
Gradient boosting decision tree (GBDT) is a decision tree model based on the idea of boosting integrated learning.eXtreme Gradient Boosting (XGBoost) is an optimization algorithm of GBDT (Chen et al., 2016).Compared with traditional GBDT methods, XGBoost introduces a regularization term in the objective function to prevent overfitting and adds a second-order Taylor series to the objective function.It produces good results and has a good processing speed when handling large quantities of data.In terms of training a machine learning model, the fewer the number of single category samples in the dataset, the less information each category provides.To solve this problem, random oversampling techniques are often used.However, the random oversampling method directs re-adoption of a small number of categories, which can result in many duplicate samples in the training set and can easily cause overfitting problems.In contrast, the Synthetic Minority Oversampling Technique (SMOTE) will generate new samples based on a small number of categories to avoid this problem.Therefore, This study used the XGBoost method combined with the SMOTE sampling method to forecast PM10concentrations in China based on ground observations and WRF-Chem simulations.
2.4.Moderate Resolution Imaging Spectroradiometer (MODIS) retrievals
MODIS was successfully deployed on the solar synchronous polar orbiting satellites of Terra [1030 LST (local standard time), LST=UTC+8] in 1999, and Aqua (1330 LST) in 2002 (Kaufman et al., 1997; Xiong et al., 2009).It provides nearglobal coverage with a period of one to two days, and is utilized for observations of cloud, water vapor and aerosol with a resolution of 0.25—1 km in 36 visible and infrared bands (Salomonson et al., 1989).In this study, the Combined Dark Target,Deep Blue aerosol optical depth (AOD) at 550 nm from the MYD08_D3 products with a latitudinal and longitudinal resolution of 1° × 1° were used to reveal the distribution of aerosols during the dust episode.
3.Strong dust storms in March and April 2023
Since January 2023, China has experienced 12 dust events, with the frequency of dust events increasing significantly in March and April.The number of dust weather events since January 2023 is the highest in the same period in the past decade.Cold air activity and strong Mongolian cyclones were major factors in these dust processes in March and April.Since 8 March 2023, northern China began to experience its first instance of dust weather in March, characterized by short-term intensity and wide-ranging influence.Late February’s rise in temperatures over the Mongolian Plateau led to dry and warm surface temperatures in desert areas, which provided favorable conditions for wind erosion and dust emissions from Mongolian dust sources.Cold advection of a 500-hPa trough facilitated the southward flow of cold air from Siberia, affecting Mongolia and northern China.As the trough and ridge developed, the cold high center and strongly developed Mongolian cyclone moved eastward, resulting in transboundary transport of Mongolian dust and the occurrence of four dust weather events in China in March 2023, including two floating dust event, one dust storm event, and one strong dust storm event.
The three most severe dust storms in March 2023 are analyzed here.On 10 March, due to the eastward movement of the cold high and Mongolian cyclone, dust erupted along with the southward movement of the cold front, showing a southwest—northeast zonal distribution (Fig.1a).Dust aerosol affected most areas of northern China, and the daily average PM10concentrations at most observation stations exceeded 400 μg m-3(Fig.2a).Beijing, Huhhot and Lanzhou experienced seriously strong dust weather within a few hours.The instantaneous peak dust concentrations in Beijing and Huhhot exceeded 1200 μg m-3.Lanzhou also recorded its fourth peak of dust concentrations this year on the same day.On 11 March, the intensity of the dust weather weakened over most areas of China, and with the northerly wind, the dust penetrated the south, and provinces in the Yangtze River Basin generally suffered from mild pollution.On 14 March, the cold air carried dust, causing floating dust weather in Northwest China.Compared to 10 March, the intensity and scope of the dust event weakened(Fig.1b).Dust continued to move southeast under the influence of northwesterly airflow, affecting the North China Plain and the middle and lower reaches of the Yangtze River.Large areas of severe pollution occurred in Shandong, Henan, northern Anhui, and northern Jiangsu in China (Fig.2b).
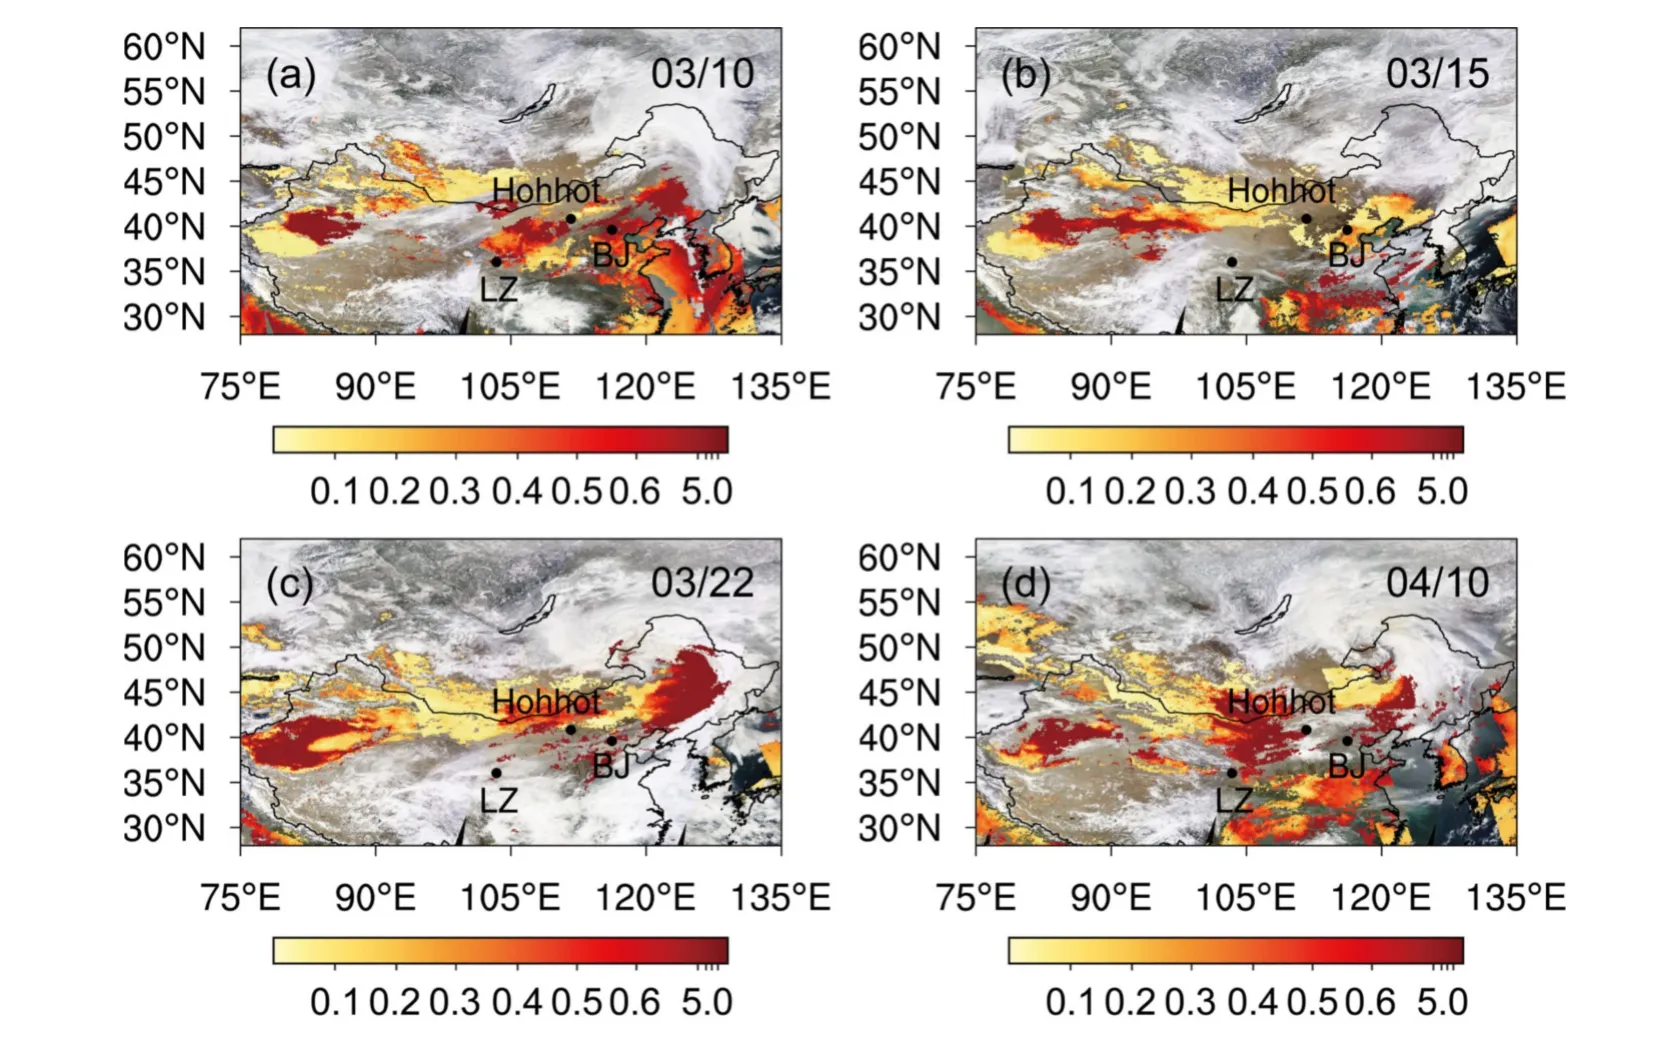
Fig.1.Spatial distributions of AOD in northern China: (a—d) cloud images and AOD based on MODIS retrievals on 10 March, 15 March, 22 March, and 10 April, respectively.BJ: Beijing;LZ: Lanzhou.
Around 22 March, the most extensive and intense dust storm weather of the year occurred.The dust broke out with a new round of cold air southward, forming a thick dust cloud that stretched thousands of kilometers from southern Xinjiang to western Jilin (Fig.1c).Inner Mongolia, Shaanxi, Shanxi, North China and Northeast China experienced short-term strong dust weather, and even dust storms occurred.The daily average PM10concentrations exceeded 600 μg m-3(Fig.2c).The PM10concentrations in Beijing have been soaring since 22 March, and the hourly PM10concentrations have increased from 500 μg m-3to 1490 μg m-3, reaching peak concentrations of 1667 μg m-3, classified as a strong dust storm (Fig.2e).Moreover, the instantaneous peak dust concentrations in Huhhot exceeded 2400 μg m-3.From 23 to 24 March, with the northerly wind, the dust penetrated South China, and provinces in the Yangtze River Basin suffered from severe pollution.
Compared with March, northern China experienced more dust events in April (Fig.2e).Since 10 April, five more dust events have been observed at these three sites.Taking the most serious dust event in April as an example, the Mongolian cyclone enhanced the eastward transport of aerosols in western Inner Mongolia and southern Mongolia, and the dust aerosol in the Gobi Desert was able to affect North China (Fig.1d).PM10concentrations were greater than 600 μg m-3at several sites in southern Inner Mongolia (Fig.2d).The peak PM10concentrations in Beijing and Hohhot exceeded 1400 μg m-3and 2100 μg m-3, respectively.These events have seriously polluted the air quality in northern China (Fig.2e).
4.Mongolian dust transboundary transport path and physical mechanism
In mid-March, three dust events occurred due to cold fronts and a Mongolian cyclone.The dust erupted in a northeast—southwest zonal distribution as the trough at 500 hPa moved eastward and the Mongolian cyclone developed.During the early stage of the dust outbreak, the trough at 500 hPa was located to the west of the Ural Mountains.Strong warm advection in front of the trough led to the development of surface low pressure while cold air moved southward behind the trough, forming a cold front.In front of the cold front, low pressure developed.At 1200 LST 9 March, the trough at 500 hPa developed.The northerly wind behind the trough exceeded 20 m s-1, leading to cold air intrusion from the polar regions and the formation of a -45°C cold center west of Lake Baikal.Meanwhile, the cold front was located in the west of Lake Baikal and Mongolia and the northern Tianshan Mountains.Surface winds in Mongolia near the frontal surface strengthened, leading to dust emissions (Fig.3a).The highest dust concentrations values in Mongolia ranged from 320 μg kg-1to 500 μg kg-1(Fig.3).
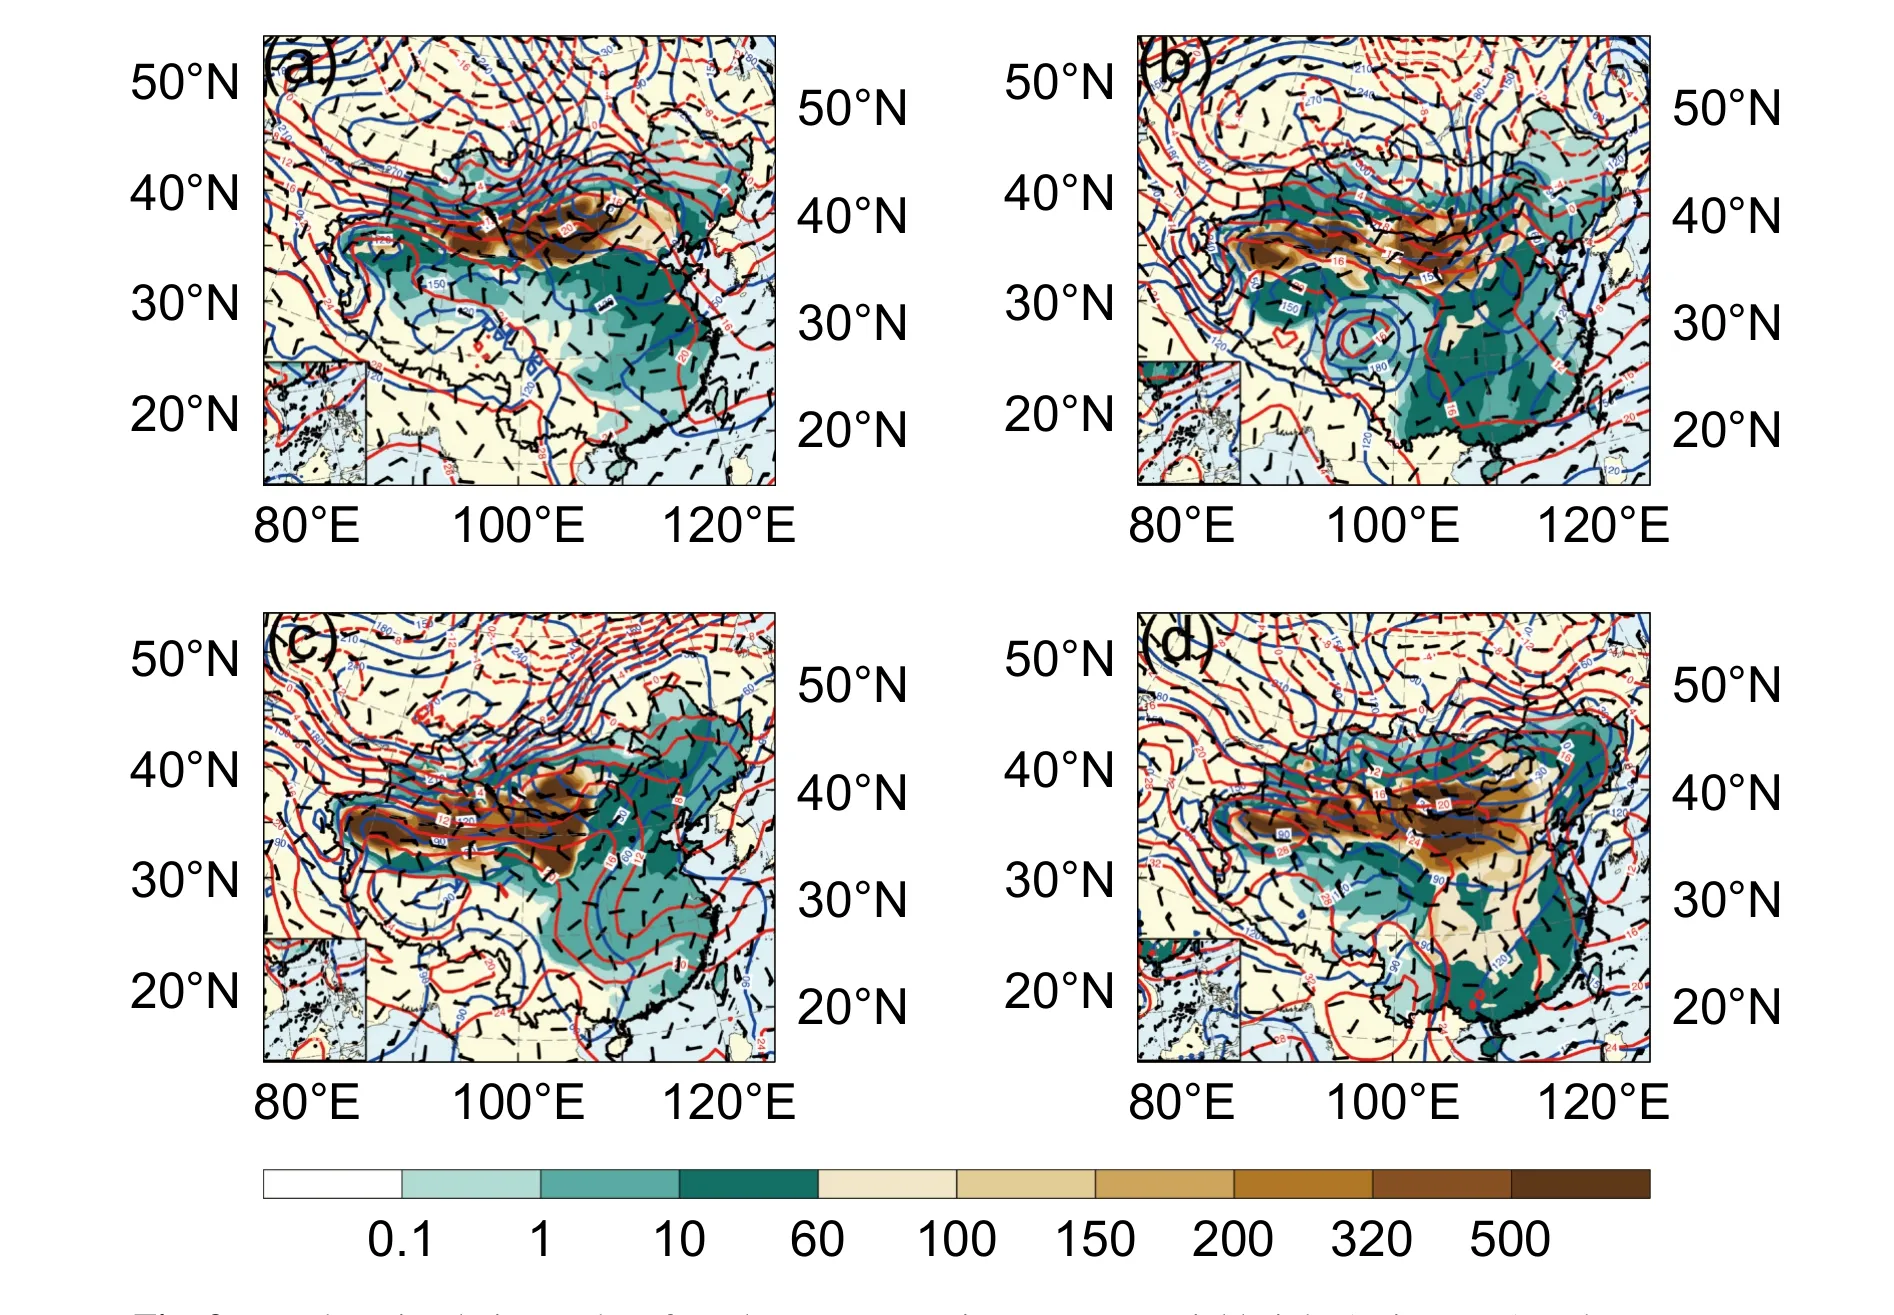
Fig.3.Weather circulation and surface dust concentrations: geopotential height (units: gpm) and temperature(units: °C) at 1000 hPa and dust concentrations (units: μg kg-1) based on the WRF-Chem model at (a) 1200 LST 9 March, (b) 0000 LST 14 March, (c) 1800 LST 20 March, and (d) 1200 LST 9 April.
On 10 March, the cold front was located in eastern Mongolia—North China—Northwest China.Dust aerosols from Southwest Mongolia and the Taklimakan Desert were transported southward, affecting most parts of northern China, with dust concentrations in Gansu and Ningxia exceeding 60 μg kg-1.Dust also reached the Korean Peninsula and central China, with dust concentrations higher than 15 μg kg-1.The cold air on 14 March was weaker than that on 10 March.However, under the influence of the Mongolian cyclone, dust continued to rise in southern Mongolia and moved southeast under the northwesterly airflow, mainly affecting Northwest China with dust concentrations of 100—320 μg kg-1.On 20 March, the cold front was located in Inner Mongolia, and the dust concentrations were even greater than 500 μg kg-1, leading to a stronger dust storm than that on 9 and 14 March (Fig.3c).
The second dust event that reached the level of a dust storm occurred in China from 9 to 11 April, albeit its intensity was slightly weaker than the dust storm in mid-late March.Northern China was located just in front of the ridge and after the trough.The northerly wind favored a lot of cold air moving south.Temperatures at 500 hPa in the eastern part of Northwest China, Inner Mongolia, North China, Northeast China and Huanghuai dropped sharply with the influence of the cold air.Dust was also transported to Northwest, North and Northeast China under the action of atmospheric circulation.On 10 April, the Mongolian cyclone formed.The influence of westerly air flow and the Mongolian cyclone in middle and high latitudes enhanced the eastward transport of dust aerosols over the Taklimakan Desert and the Gobi Desert, and the near-surface dust concentrations were also much higher than 500 μg kg-1(Fig.3d).
Based on the HYSPLIT model and trajectory clustering analysis, the sources and dispersion pathways of air pollutants during these frequent dust events in northern China in March and April were analyzed in detail.Generally, Mongolia contributed 42% of dust concentrations to northern China in March and April 2023, while the Taklimakan Desert contributed 26% (Fig.4a).The highest dust concentrations were found in Mongolia, with a contribution of 30—270 μg kg-1.Among the ten dust events between March and April this year, four were mainly from the Taklimakan Desert and five were mainly from Mongolia.In the dust events of 7 March and 12—15 April, dust events in northern China mainly originated locally(Figs.4b and h).Approximately 37% of dust originated from the Taklimakan Desert from 9 to 11 April, while 27% of dust originated in Kazakhstan and reached northern China through Xinjiang of China and Mongolia (Fig.4g).In the dust event from 27 to 29 April, the main source of dust to northern China was the Taklimakan Desert (49%), while Mongolia contributed only 29% (Fig.4k).
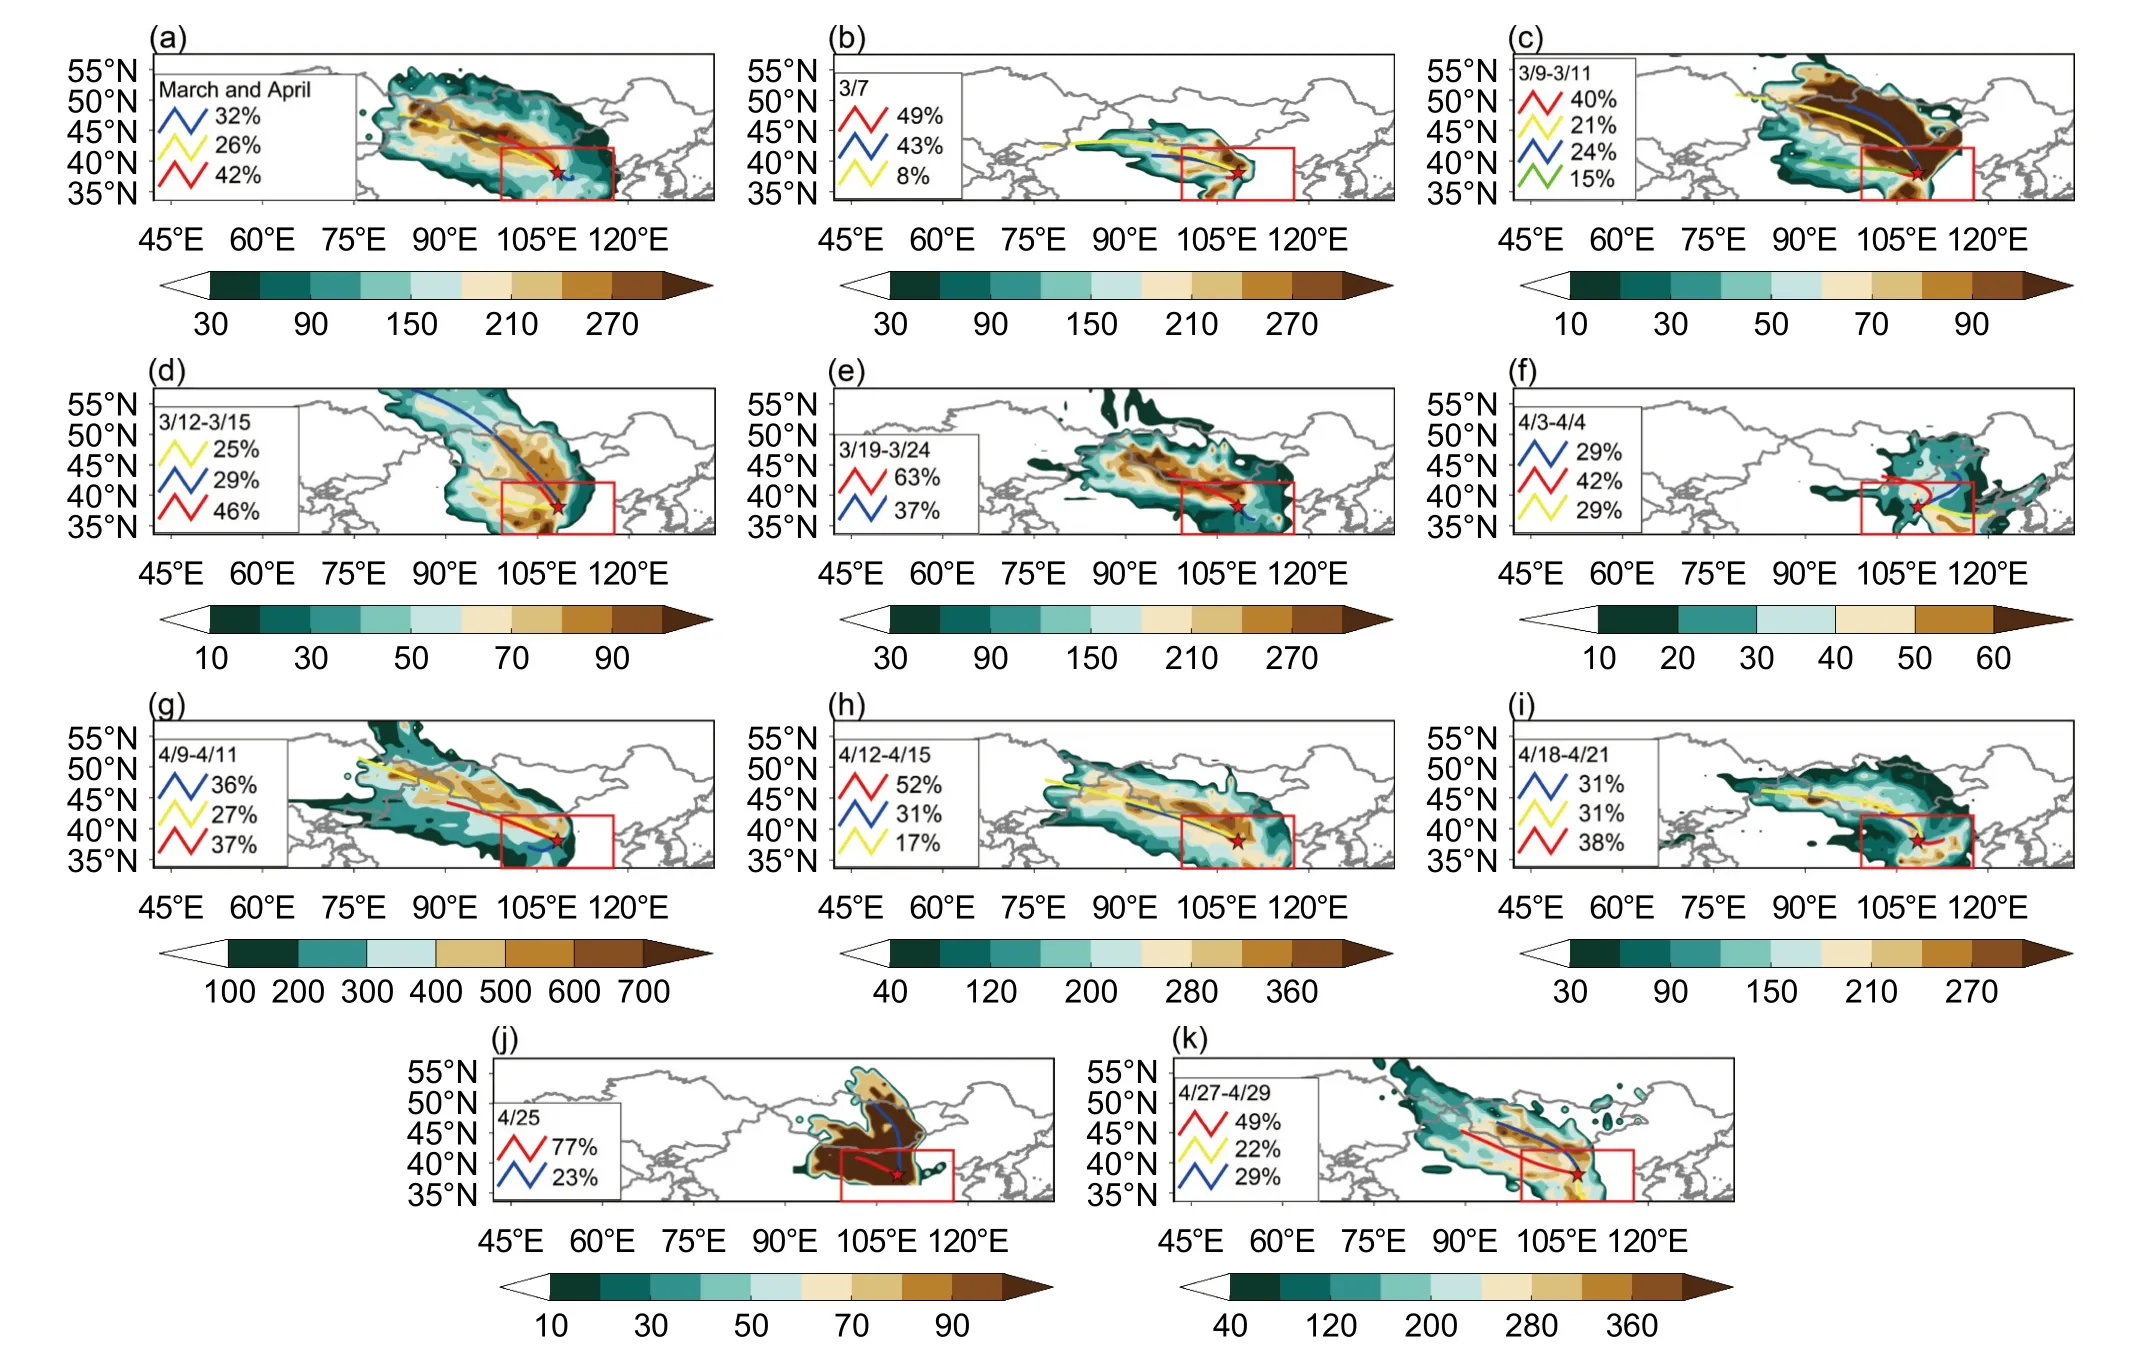
Fig.4.Dust distribution and transmission: cluster analysis of 48-h backward trajectories (colored lines represent the airflow trajectory, and numbers represent the percentage of the airflow trajectory) and WCWT analysis of dust concentrations (units:μg kg-1; filled color contours) in northern China (34°—42°N, 100°—118°E; area marked with a red border) during (a) March and April,(b) 7 March, (c) 9—11 March, (d) 12—15 March, (e) 19—24 March, (f) 3—4 April, (g) 9—11 April, (h) 12—15 April, (i) 18—21 April,(j) 25 April, and (k) 27—29 April.
In recent years, Mongolia has gradually emerged as an important source of dust that affects air quality in northern China.Taking the dust events from 9 to 11 March as an example, the contribution of dust concentrations from Mongolia to northern China reached as high as 45%, with dust concentrations of 90 μg kg-1(Fig.4c).During 12 to 15 March, the contribution of dust concentrations from Mongolia to northern China was as high as 75% (Fig.4d).From 19 to 24 March, the maximum contribution from Mongolia to the dust concentrations in northern China was more than 270 μg kg-1(63%), resulting in an extremely large dust process in the region (Fig.4e).In addition, in the remaining two dust events in April (3—4 April and 18—21 April), Mongolia was still the main contributor of dust concentrations in northern China, with contributions of 42%and 62%, respectively (Figs.4f and 3i).
5.Forecasting PM10 concentrations based on machine learning
We used the XGBoost model in combination with SMOTE sampling to forecast the PM10concentrations in China during March.Compared with the simulation results of the WRF-Chem model, both the XGBoost and XGBoost-SMOTE methods were able to optimize the numerical model, thereby achieving significant improvements in the WRF-Chem simulation of PM10concentrations.Specifically, the XGBoost-SMOTE model attained the lowest prediction error for PM10concentrations[mean absolute error (MAE) = 49.31 μg m-3], which improved the simulation effect compared with XGBoost (MAE =60.17 μg m-3).On 10 March, Lanzhou was affected by dust processes and the PM10concentration rose sharply to a peak of 891 μg m-3.During this period, both the XGBoost and XGBoost-SMOTE methods demonstrated superior simulation effects on the changes in PM10concentrations.However, the simulation effect of the XGBoost method on high concentrations of PM10concentrations was not as effective as that of XGBoost-SMOTE, yet it was still significantly improved compared to the PM10concentration simulation results obtained from WRF-Chem model (Fig.5a).At 2300 LST 14 March, most regions of China were affected by dust aerosols, resulting in a sharp increase in PM10concentrations.The PM10concentrations of most stations in Beijing, Tianjin and Hebei exceeded 250 μg m-3, while that of southern provinces such as Jiangsu, Guangdong and Guangxi exceeded 100 μg m-3.The distribution characteristics of the prediction results from XGBoost-SMOTE were consistent with the station observation results, with an MAE of 56 μg m-3(Figs.5b and c).During the first two dust processes in March, we randomly selected two time points and conducted coefficient of determination statistics on the model.The results showed that the model performed well for low values below 250 μg m-3, but gradually declined in performance as PM10concentrations increased (Fig.5d).
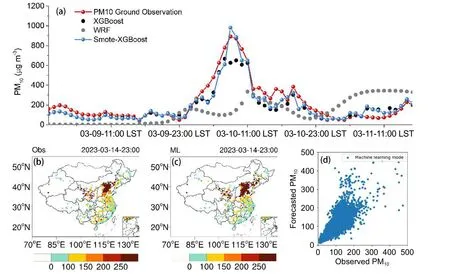
Fig.5.Time series of forecasted PM10 concentrations based on ground observations, machine learning methods, and the WRF-Chem model: (a) forecasted PM10 concentrations at Lanzhou (36.4789°N, 103.6975°E) from 9 to 11 March; (b, c) spatial distributions of PM10 concentrations at 2300 LST 14 March (units: μg m-3) based on (b) ground observations and (c) the XGBoost-SMOTE model.(d) Scatterplot of observed versus XGBoost-SMOTE-forecasted PM10 concentrations.
6.Summary and discussion
Dust storms in northern China during March and April 2023 have posed significant risks to agriculture, transportation,air quality, and public safety.This study employed a combination of multi-source and multi-scale data, synoptic analysis,and trajectory analysis to investigate the causes of this prolonged period of heavy dust pollution weather in China in March and April 2023.The Mongolian cyclone and strengthening of cold air activity were significant factors in the occurrence of dust storms in northern China in 2023.The dust spread southward with cold air to form a thick dust cloud.Dust aerosols transported from Mongolia affected most regions of northern China, with the daily average PM10concentrations at most observation stations exceeding 400 μg m-3.In March and April 2023, China experienced 10 dust events.Mongolia contributed 42% of the dust to northern China, while the Taklimakan Desert contributed 26%.The dust concentrations in southern Mongolia were much higher than 270 μg kg-1, and the dust originating from the Taklimakan Desert passed through Mongolia and reached northern China, contributing up to 240 μg kg-1to the dust concentrations in the region.
Moreover, machine learning methods were introduced to predict the PM10concentrations in this study.Through two machine learning methods introduced in this study and the experimental verification of multi-source data, it was proven that machine learning could have met the prediction requirements of the dust storms in March and April 2023.In this complex meteorological environment, the machine learning algorithm performed well in PM10prediction, and the performance indicators and output values were in line with our expectations.We utilized SMOTE to address the imbalanced category distribution in our dataset.This enabled the model to perform competitively when PM10levels were high during the dust processes.Of course, the prediction model is constantly improving; the spatial dependence of dust concentrations was not captured by the machine learning model, and we will solve that problem in the future.
Overall, the area of dust sources on the Mongolian Plateau has continued to expand in recent years, becoming the main dust source affecting the dust storms in downstream areas.However, due to the lack of a comprehensive regional collaborative observation network in Mongolia and the complex mechanism of wind erosion acting on different land covers, the ability to identify and monitor Mongolian dust transboundary transport is weak at present, and the simulation accuracy of the dust emissions scheme is low, which seriously restricts the prediction and early warning ability for China’s atmospheric environment.
In future work, it is necessary to concentrate on the long-term transport of dust in Mongolia, carry out field observation experiments, further determine the main pathway of Mongolian dust and its influencing areas, and develop intelligent identification and source tracing technology for dust.Constructing dust emission schemes for different underlying surfaces (desert,pastureland, and sparse grassland) is also key for improving the accuracy of Mongolian dust simulations.Additionally,multi-source data should be organically integrated to intelligently extract the characteristics of dust events, establish a standard sample database of dust storms, and develop a refined dust forecasting system with high spatiotemporal resolution based on machine learning in the future.
Acknowledgements.This work was jointly supported by a project supported by the Joint Fund of the National Natural Science Foundation of China and the China Meteorological Administration (Grant No.U2242209), and the National Natural Science Foundation of China (Grant No.42175106).
 Advances in Atmospheric Sciences2023年9期
- Advances in Atmospheric Sciences的其它文章
- The 17th Workshop on Antarctic Meteorology and Climate and 7th Year of Polar Prediction in the Southern Hemisphere Meeting
- Modulation of the Wind Field Structure of Initial Vortex on the Relationship between Tropical Cyclone Size and Intensity
- A Lagrangian Trajectory Analysis of Azimuthally Asymmetric Equivalent Potential Temperature in the Outer Core of Sheared Tropical Cyclones
- Coupling of the Calculated Freezing and Thawing Front Parameterization in the Earth System Model CAS-ESM
- The Processes-Based Attributes of Four Major Surface Melting Events over the Antarctic Ross Ice Shelf
- Hybrid Seasonal Prediction of Meridional Temperature Gradient Associated with “Warm Arctic-Cold Eurasia”