
Experimental and simulated investigation of microdischarge characteristics in a pin-topin dielectric barrier discharge(DBD)reactor
2022-09-06 13:04:32JunwenHE何俊文BangfaPENG彭邦發(fā)NanJIANG姜楠KefengSHANG商克峰NaLU魯娜JieLI李杰andYanWU吳彥
Plasma Science and Technology 2022年10期
Junwen HE (何俊文),Bangfa PENG (彭邦發(fā)),Nan JIANG (姜楠),Kefeng SHANG(商克峰),Na LU(魯娜),Jie LI(李杰)and Yan WU(吳彥)
School of Electrical Engineering,Dalian University of Technology,Dalian 116024,People’s Republic of China
Abstract Both experimental and simulated studies of microdischarge (MD) are carried out in a dielectric barrier discharge with a pin-to-pin gap of 3.5 mm,ignited by a sinusoidal voltage with a peak voltage of 10 kV and a driving frequency of 5 kHz.Statistical results have shown that the probability of the single current pulse in the positive half-period(HP)reaches 73.6%under these conditions.Experimental results show that great luminous intensity is concentrated on the dielectric surface and the tip of the metal electrode.A 1D plasma fluid model is implemented by coupling the species continuity equations,electron energy density equations,Poisson equation,and Helmholtz equations to analyze the MD dynamics on the microscale.The simulated results are in good qualitative agreement with the experimental results.The simulated results show that the MD dynamics can be divided into three phases: the Townsend phase,the streamer propagation phase,and the discharge decay phase.During the streamer propagation phase,the electric field and electron density increase with the streamer propagation from the anode to the cathode,and their maximal values reach 625.48 Td and 2.31 × 10¹⁹ m?3,as well as 790.13 Td and 3.58 × 10¹⁹ m?3 in the positive and negative HP,respectively.Furthermore,a transient glow-like discharge is detected around the anode during the same period of streamer propagation.The formation of transient glow-like discharge is attributed to electrons drifting back to the anode,which is driven by the residual voltage in the air gap.
Keywords: atmospheric pressure air dielectric barrier discharge,microdischarge,plasma fluid mode
1.Introduction
Atmospheric pressure air dielectric barrier discharge(APADBD) is a burgeoning method for nonthermal plasma generation and has been applied to gas-phase conversion[1-3],plasma-assisted combustion [4-6],plasma medicine[7-9],active flow control [10-12],etc.Typically,an alternating current (AC) supply with a frequency of a few kHz is applied to excite APADBD [13].It has been observed that APADBD consists of lots of microdischarges (MDs) with a diameter of a few hundred μm and a lifetime of a few ns to μs[14].Since an individual MD is the basic element of APADBD,a key aspect of APADBD reactor performance evaluation is to understand the features of the individual MD.
The behavior of MD has been studied experimentally for many years.Although the occurrence of MD seems to be temporally and spatially disordered,the appearance of MD repeats within a fixed area for hundreds of half-periods(HPs)caused by the residual charges in the discharge zone and on the dielectric surface during the dielectric barrier discharge(DBD) process [15,16].Recently,researchers have investigated the effects of the gas composition,the shape of the applied voltage,and the arrangement of the DBD reactor on the features of MDs,such as the radius of the discharge channel,the streamer velocity,and the discharge current[17-23].Despite the investigation into the MD’s features in previous studies,it is still necessary to conduct further research into the behaviors of an individual MD to develop an efficient and suitable DBD reactor.
Numerical simulation is developed as an alternative to studying discharge characteristics.Generally,numerical simulation provides results with a high spatial and temporal resolution to meet the requirements of the discharge process with rapid evolution and multiscale features.The plasma fluid model (PFM) is more commonly applied to the APADBD simulation compared to the particle-based methods since it obtains an accurate solution within a shorter time [24].The PFM is applied to obtain microscale parameters such as the spatial and temporal distribution of the electric field and particle density for the dynamic analysis of MDs.Results of the PFM have demonstrated that the process of MD is divided into three phases: the Townsend phase,the streamer propagating phase,and the decay phase [25,26].Evidence from several PFM results shows that the dielectric surface charge enables us to induce the breakdown of the air gap and affects the structure of MD [26,27].Recent developments in the simulation have shown that the initial distribution of the electron density,the flow rate in the plasma region,and the dielectric constant have an impact on the route,velocity,and morphology of streamer discharge propagation [28-32].Results of a 1.5D PFM including the simplified continuity equations have demonstrated that the average accumulation of charge density remained at the same value on the dielectric surface at different gaps [33].Although the simulation of gap discharge has been studied for decades,most of the simulation research pays attention to the microscale process of MD.However,few studies characterize MDs through the combination of the macroscale results in the experiment and the microscale process taken by the simulation.A method of combining the experiment and simulation to analyze the characteristics of dynamics of MD on the micro-and macroscale improves our understanding of the MD process.
In this work,both experimental and computational studies are implemented to gain a deeper knowledge of the formation mechanism and properties of MD.A pin-to-pin DBD reactor is developed to ensure that only an MD occurs in each HP,to investigate the characteristics of the voltampere,and discharge morphology.A 1D plasma fluid model is developed to investigate the spatial-temporal distribution of the electric field and species to precisely explore MD dynamics.
2.Experimental setup and numerical modeling
2.1.Experimental setup
Details of the experiment system is provided in figure 1.A one-end-closed quartz tube (outer diameter: 2 mm),whose closed end is a hemisphere with a 2 mm diameter and a thickness of 1.5 mm,is employed as the dielectric.The highvoltage (HV) electrode is placed inside the quartz tube,and the gap between the tube and the electrode is filled with saturated sodium chloride solution.The grounding electrode is a 2 mm diameter stainless steel pin with a tip angle of 45 degrees.The air gap is fixed at 3.5 mm.The DBD reactor is sustained by sinusoidal AC power (CTP200K,Nanjing Suman Electronics Co.,Ltd China).The applied voltage of the DBD reactor is measured with a high voltage probe(Tektronix P6015A,75 MHz).In order to measure the charge and current,a low voltage probe (Tektronix TPP0201,200 MHz) is adopted to acquire the voltage across the capacitor(22 nF)and resistor(100 Ω).All the electrical signals are recorded and monitored by a RIGOL MOS5014 digital oscilloscope(100 MHz,8 GSa s?1).The optical signals of the light collected by optical fiber are recorded by the photomultiplier tube (Sens-tech,P30A-05).The morphology of an individual MD is taken with an ICCD camera (Princeton,PIMAX 3 1024i).A synchronizing signal from the oscilloscope is applied to activate the ICCD camera.The experiment is carried out under the conditions of a peak voltage of 10 kV with a driving frequency of 5 kHz.
2.2.Numerical modeling
The PFM consists of continuity equations that represent the conversion of mass and energy.Meanwhile,the electric field distribution is acquired by computing the Poisson equation,which is based on the distribution of charged particles.A 1D PFM with photoionization is implemented in this study by using COMSOL Multiphysics software with a built-in plasma module and Helmholtz equation solver.The model in this study is described below in detail.
2.2.1.Governing equations.The continuity equation of species is given below,

Herein,ni,qi,μi,andDirepresent the number of density,charge,mobility,and diffusion coefficients for plasma speciesi(e.g.,electrons,ions,and neutral particles).Siindicates the chemical source term,and it can be expressed asdenoting the sum of speciesiproduced or consumed in the chemical reactions.Here,xjandkjare the mole fraction of the target species and the rate coefficient in the reactionj,respectively.Nnrepresents the total neutral number density.Eis the electric field vector.The electron energy density is given by the following equation.

Hereneandnεare the electron density and mean electron energy density,respectively.με,μe,De,andDεdenote the electron mobility,electron diffusivity,energy mobility,and the diffusion coefficients of electron energy,respectively.The first term on the right hand side of equation (2) is defined as the energy loss obtained by summing the collisional energy loss over all reactions,which is in terms ofrepresents the energy loss of reactionj.The second term on the right hand side of equation(2)indicates the Joule heating of the electron through the electric field and the electron flux.
The LoKI-B solver [34]is adopted to calculate the electron energy distribution function(EEDF)and the reduced electron mobility (μeNn).The electron diffusivity coefficientDe,electron energy mobilityμε,and electron energy diffusivity coefficientεDare acquired by Einstein’s relation(equation (3)),
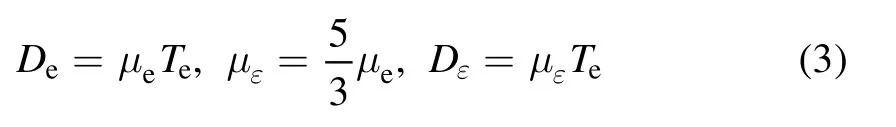
whereTeis the electron temperature described by the expressionkBTe=in whichkBis the Boltzmann constant.The diffuse coefficient of neutral particles is set up to 0.01 m2s?1.The diffusivity coefficient of ions is defined asin whichwiis the mass fraction of the ion speciesi,andDkjdenotes the binary diffusion coefficient between specieskandj.The ion mobilityμiis also obtained by calculating Einstein’s relation,μi=Tgis the gas temperature.The Poisson equation for electric potential can be expressed as

whereε0andεrrepresent the vacuum permittivity and the relative permittivity of each region,respectively.ρqdenotes the space charge density.
2.2.2.Numerical domain.A 1D plasma fluid model is adopted to analyze the axial performance of DBD and reduce the required time and resources for this work.The properties of the streamer branch,electrode shape,and surface discharge are neglected.The axis of the 1D model is illustrated in figure 1.The HV electrode is located at the origin of the axis.A 1.5 mm thick quartz with a relative dielectric constant of 7.8 is employed as the dielectric material.On the axis,the start and end of the dielectric are designated as 0 and 1.5 mm,respectively.The rest part of the axis is adopted as the air gap,which is the same as the experiment.The grounding electrode is located on the axis at 5 mm.A disk-shaped with a radius of 1.0 mm (it agrees with the radius of the experimental electrode) is assumed to be the discharge area since the geometry of electrodes is ignored in the 1D plasma fluid mode.In the plasma zone,a grid with 450 elements is adopted.The electron density varies drastically near the boundary between the plasma zone and the solid [18].Therefore,the smallest mesh is adopted at the interface between the solid and plasma region to obtain more accurate results.The size of the mesh increases in a geometric sequence with an element ratio of 10,from the boundary to the midpoint of the plasma zone.The mesh is symmetrical at the midpoint of the plasma zone.Extremely fine grids are employed on the dielectric material.
2.2.3.Initial conditions and boundary conditions.The discharge gas is the dry air with 21% O2under the initial conditions.N2satisfies the principle of mass constraint.The gas pressure and temperature are set as constant at 760 Torr and 300 K,respectively.In the numerical model,the temperature increment of the gas is ignored.The initial value of the charge density is assumed to be 5 nC cm?2on the dielectric surface to enhance the stability of the model in the initial period.
The sinusoidal voltage with the peak voltage of 10 kV and a driving frequency of 5 kHz is applied on the HV electrode to agree with the driving voltage of the experiment.The dielectric is set to charge conservation,and its surface could accumulate the charged particles.The accumulation of charge can be expressed as=n·Ji+n·Je,whereρsis the surface charge density.n·Jiandn·Jedenote the normal components of the total ion current density and the total electron current density,respectively.
The wall boundary is treated on the solid surface contracting with plasma,where the surface reactions (ions collide with the wall and return to the ground state) are considered.Due to secondary emission,the secondary electron flux and secondary electron energy flux are defined as∑p εp γp(Γp·n),whereve,this the electron thermal velocity and electron density,respectively.Here,γpdenotes the secondary electron emission coefficient from species p,andεprepresents the mean energy of the secondary electrons.The secondary electron emission induced by all positive ions is considered with the coefficient of 0.1 [35]and 0.006 on the metal electrode and dielectric,respectively.The average secondary electron energy is assumed to be 0.5 eV and 2.5 eV on the metal electrode and dielectric surface,respectively.The secondary electron emission of negative ions and neutral particles is set up to 0 in this model.
2.2.4.Chemical model.The chemical reaction process of air discharge is complex,including ionization,excitation,dissociation,etc.It is unnecessary to consider many of the reactions in the simulation because they are not crucial reactions in the discharge process.Table A1 in the appendix lists a series of chemical reactions introduced into the simulation model.The simplified chemical reaction model is based on Lin et al [33]and Poggie et al [38].In addition,the chemical reactions of electron attachment and ion-ion recombination are included in the model to improve the reliability of the simulation.The LoKI-B solver is used to compute the Boltzmann equation for acquiring the rate constant of electron collision reactions(R1-R13)[34].A total of 99 chemical reactions and 19 species are adopted in the model.

Table 1.Fitting parameters of the three-exponential fit,as obtained from Bourdon et al [44].
2.2.5.Photoionization.Oxygen molecules can be ionized by photons emitted from the quenching of excited nitrogen molecules,which produce the initial electrons in advance of the streamer head.Therefore,photoionization is considered in the model to correctly calculate the propagation of the streamer.A set of three Helmholtz differential equations proposed by Luque et al [39]is adopted to replace the classical integral model effectively [40-42].A set of three Helmholtz differential equations is included to account for the photoionization rate in this model.The Helmholtz differential equations of photoionization are given below,

Here,pO2andpindicate the partial pressure of oxygen molecules and the atmospheric pressure,respectively.pqandξ(vu/vi)stand for a quenching pressure and photoionization efficiency factor and are recommended as 30 Torr and 0.06[43,44].Sirepresents the nitrogen ionization source term.The values for the fitting parametersAjandλjare taken from the paper of Bourdon et al[44],as shown in table 1.The reaction rate of photoionization (Sph) is acquired by the summation of the results from solving the three Helmholtz differential equations.The Dirichlet boundary is applied to the wall boundary to effectively solve the Helmholtz equations[44,45].The Helmholtz equations are discretized by the four-order Lagrange scheme.
2.2.6.Numerical methods.The backward differentiation formula (BDF) method,with a maximum order of two and a minimum order of one,is used for time integration.At each step,the nonlinear system is linearized by a Newton iteration.A parallel sparse direct solver (PARDISO) is chosen as the direct linear system solver.The time steps are automatically chosen by the BDF solver,depending on the relative and absolute tolerances that control the solution error.The maximum of the time step interval is set up to 16 ps during air gap breakdown,while the time step interval is 25 ns in other phases to reduce time consumption.The relative tolerance is set to 0.1.The Galerkin method is used to discretize the governing equations of electron density and electron energy.The governing equations of charged species are discretized by the Scharfetter-Gummel upwinding.A centered difference scheme is applied for discretizing the equations of neutral species and electrostatic field.
3.Result and discussion
3.1.Electrical performance of the pin-to-pin DBD reactor
Figure 2 shows the characteristics of current-voltage and the photomultiplier signal obtained from the experiment.The behavior of current pulses in the positive HP is more dispersive than that in the negative HP,as seen in an accumulated figure of experimental volt-ampere waveforms in figure 2(a).The single-acquisition volt-ampere oscillograms shown in figure 2(b) illustrate that a current pulse usually occurs once in the negative HP.However,one or two current pulses may arise in the positive HP.Similar behaviors of MD are reported in previous studies [18,19,46].This work focuses on the situation where there is only one current pulse in the positive HP since its probability of occurrence reaches 73.6%.Therefore,the subsequent experiments show the results when only one current pulse arises in the positive HP.Besides,the typical waveforms of discharge current show that the current pulse magnitude of the positive HP is less than that of the negative HP.It is analyzed in section 3.2.The columns in figure 2(c) represent a normalized appearance probability of experimental current pulse in different temporal phases.The histogram shows that the appearance of a positive current pulse begins at 19 μs and ends at 34 μs,and the time range for the occurrence of a negative current pulse is from 115 to 134 μs.The photomultiplier signals are presented in figure 2(d) to determine the temporal behavior of discharge.Figure 2(d) shows that only a pulse of the photomultiplier signal appears in each HP,which agrees with the behaviors of current pulses.As a result,MD occurs once in each HP under the experimental condition.

Figure 1.Schematic of the experiment.

Figure 2.(a) Accumulated volt-ampere waveform of discharge,1000 cycles of volt-ampere waveforms are accumulated,(b) the typical waveforms of volt-ampere and the probability of appearance,(c)appearance probability of current pulse over a cycle under the condition of only one current pulse arising in the positive HP,(d) the typical situation of the photomultiplier signal and the applied voltage of 10 kV.

Figure 3.Average current pulses displayed with superimposed ICCD images,and four typical current pulses corresponding to discharge morphologies captured by ICCD camera in a single acquisition (2 μs) for (a) the positive HP and (b) the negative HP.

Figure 4.(a) The simulated current waveform compared with the variation of the current pulse amplitude in time.Normalized comparison between numerical and experimental current pulses in the positive HP (b) and the negative HP (c),respectively.
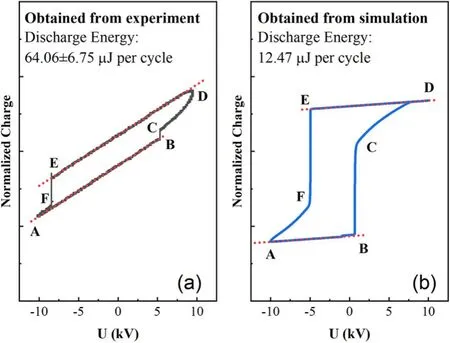
Figure 5.Comparison of the Lissajous figure taken from the experiment (a) and the simulation (b).
3.2.Discharge morphology of pin-to-pin DBD reactor
The current pulses in figures 3(a1)and(b1)are the average of the positive current pulses acquired from figures 3(a2)-(a5)and the mean of the negative current pulses obtained from figures 3(b2)-(b5),respectively.The discharge images associated with the four current pulses in figures 3(a2)-(a5) and(b2)-(b5) are superimposed to draw the discharge morphology in figures 3(a1) and (b1).Generally,MD is composed of a channel between the dielectric(the yellow cylinder on the left)and the metal electrode(the gray triangle on the right)as well as the branching channel on the dielectric surface.A comparison of all ICCD images from a single acquisition shows that the routes of the discharge channel are randomly jittery due to the random feature of MDs.Moreover,the branching channel of the dielectric surface in the negative HP is more significant than that in the positive HP.Although the discharge channel varies randomly,the region of great luminous intensity always stays at the metal electrode tip and the dielectric surface near the ground electrode.The maximal luminous intensity of the negative HP is higher than that of the positive HP under the same gate width of 2 μs.In addition,the superimposed ICCD images illustrate that the diameter of the discharge channel between the dielectric and metal electrode in the negative HP is approximately twice that in the positive HP.The higher luminous intensity and larger luminous area of the ICCD image indicate more radicals produced,which explains why the current pulse magnitude of the negative HP is higher than that of the positive HP.
3.3.Simulated model validation
The experimental current waveform and discharge energy are compared to the simulated ones to validate the model developed in this study.The simulated current is taken from the 10th cycle to remove the effect of the initial value and obtain credible results.The peak value of current pulses acquired from the simulation reaches 29.93 mA and?44.83 mA in the positive and negative HP,respectively.The current pulse magnitudes of the simulation are of the same order of magnitude as the experimental current.The comparison between the experimental and the simulated current pulses are presented in figures 4(b)and(c).The experimental current pulses in this section are taken by the average value of four current pulses in section 3.2.The simulated current peak is aligned and normalized with the experimental one to facilitate comparison.It can be seen that the rise time of the simulated current pulse is close to the measured one.Although the current oscillations of the experimental result are observed in the fall time due to circuit resonance,the simulated electric current is in good accordance with the experimental one.
In figure 5,the Lissajous figure obtained by the simulation is normalized and compared with the experimental results.Six nodes are observed in both Lissajous figures taken from the experiment and the simulation.Here,the voltages of points A and D indicate the minimal and maximal values of the external voltage,respectively.The charge varies sharply when the external voltage reaches points B and E,which means the air gap breakdown.Therefore,the Lissajous figure is divided into three phases,lines AB and DE represent the‘discharge-off’ phase when the discharge quenches,lines BC and EF represent the phase when the discharge develops fast,and lines CD and FA are the phase of discharge decay.Note that a typical Lissajous figure presents as a parallelogram,which differs from that obtained in this study [27].The different shape of the Lissajous figure between the common type and single MD is attributed to the transferring charge in the typical Lissajous figure consisting of the step-wise increase of charge transferred from lots of MDs.Besides,the sharp increase of charge is smoothed in the typical Lissajous caused by the transferred charge of the single MD far below that of a typical Lissajous figure.The average discharge energy of 100 cycles reaches 64.01 ± 6.75 μJ per cycle,around 5.1 times larger than that of the simulation (12.47 μJ per cycle).The simulated discharge energy is qualitatively consistent with the experimental one.The calculated results are obtained from the product of the discharge area and the area density of the parameters.However,the cross-sectional area of the discharge varies with its position in the air gap (shown in figure 3).The discharge area on the dielectric surface is much larger than the section area of the electrodes.The discharge area in the simulation is taken to be a fixed value.Therefore,the discrepancy between the actual and simulated cross section areas of the discharge is an important factor affecting the accuracy of the results.In general,the calculated characteristics qualitatively agree with those observed in the experiment for DBD with an individual MD.
3.4.Evolution of MD dynamics
Figure 6 shows the temporal evolution of the reduced electric field,electron density,and space charge density during the MD process at a peak voltage of 10 kV with a driven frequency of 5 kHz.The space charge density is taken by the equationin this model.The MD development can be divided into three phases: the Townsend phase,the streamer propagating phase and the decay phase.

Figure 6.Spatial-temporal phase diagrams of the reduced electric field in the positive HP(a)and negative HP(b),space charge and electron density in positive HP (c) and negative HP (d) during the breakdown.
The Townsend phase is shown in the left region of figures 6(a) and (b).It is found that the electric field distributes uniformly within the air gap and its intensity grows as time goes on.The increasing electron density is caused by the α and γ process of Townsend discharge in this phase.The Townsend phase transits to the streamer propagating phase,as the electric field grows high enough to reach the Raether-Meek criterion with each electron [47].
The results obtained from the streamer propagating phase are presented in the middle region of figures 6(a)and(b).The maximum electric field and electron density increase with time,and its position moves toward the cathode.The maximum reduced electric field and electron density reach around 625.48 Td and 2.31 × 10¹⁹m?3in the positive HP as well as 790.13 Td and 3.58 × 10¹⁹m?3in the negative HP when streamer discharge arrives at the cathode.A region of high positive charge density is formed in front of the area of maximal electron density(shown in figures 6(c)and(d)),and it acts as the virtual anode.The intensive electric field is due to the shorter distance between the streamer head and the cathode.The stronger electric field leads to more ionized particles.Subsequently,the electric field is continuously enhanced with the particle ionization in front of the streamer discharge [48].
The right hand region of figures 6(a) and (b) represents the results obtained from the decay phase.The reduction of the electric field is observed in the air gap after the streamer discharge arrives at the cathode,except for the region close to the electrode.The reduction of the electric field is attributed to charged particles accumulated on the dielectric surface.The electric field between the air gap gradually decreases with the increase in surface charge density until streamer discharge quenching.The high value of the electric field is attributed to the electron emission of the cathode near the wall boundary.
In addition to the streamer discharge,a transient glowlike discharge is found in the vicinity of the anode during the streamer propagation phase (shown in figures 6(a) and (b)).Figure 7 illustrates the temporal evolution of the electron density distribution,gap voltage,and average electron density of the plasma region during the breakdown to reveal the formation mechanism of the transient glow-like discharge.Figures 7(a) and (b) show that the electron density near the anode increases continually due to the drifting back electrons before the transient glow-like discharge is formed.The residual voltage between the air gap remains unchanged during the same period that the electron density near the anode increases before the occurrence of the transient glow-like discharge.Therefore,the occurrence of the transient glow-like discharge is attributed to electrons generated by the streamer discharge and accelerated by the residual voltage in the air gap.When the transient glow-like discharge occurs,the electron density around the anode increases sharply from 1016to 1017m?3,and the residual voltage between the air gap begins to decrease.The transient glow-like discharge extinguishes as the residual voltage decreases within the air gap.The average electron density reaches its maximum in the plasma region within a few hundred nanoseconds after the transient glow-like discharge occurs.It is suggested that the transient glow-like discharge can improve the electron density.
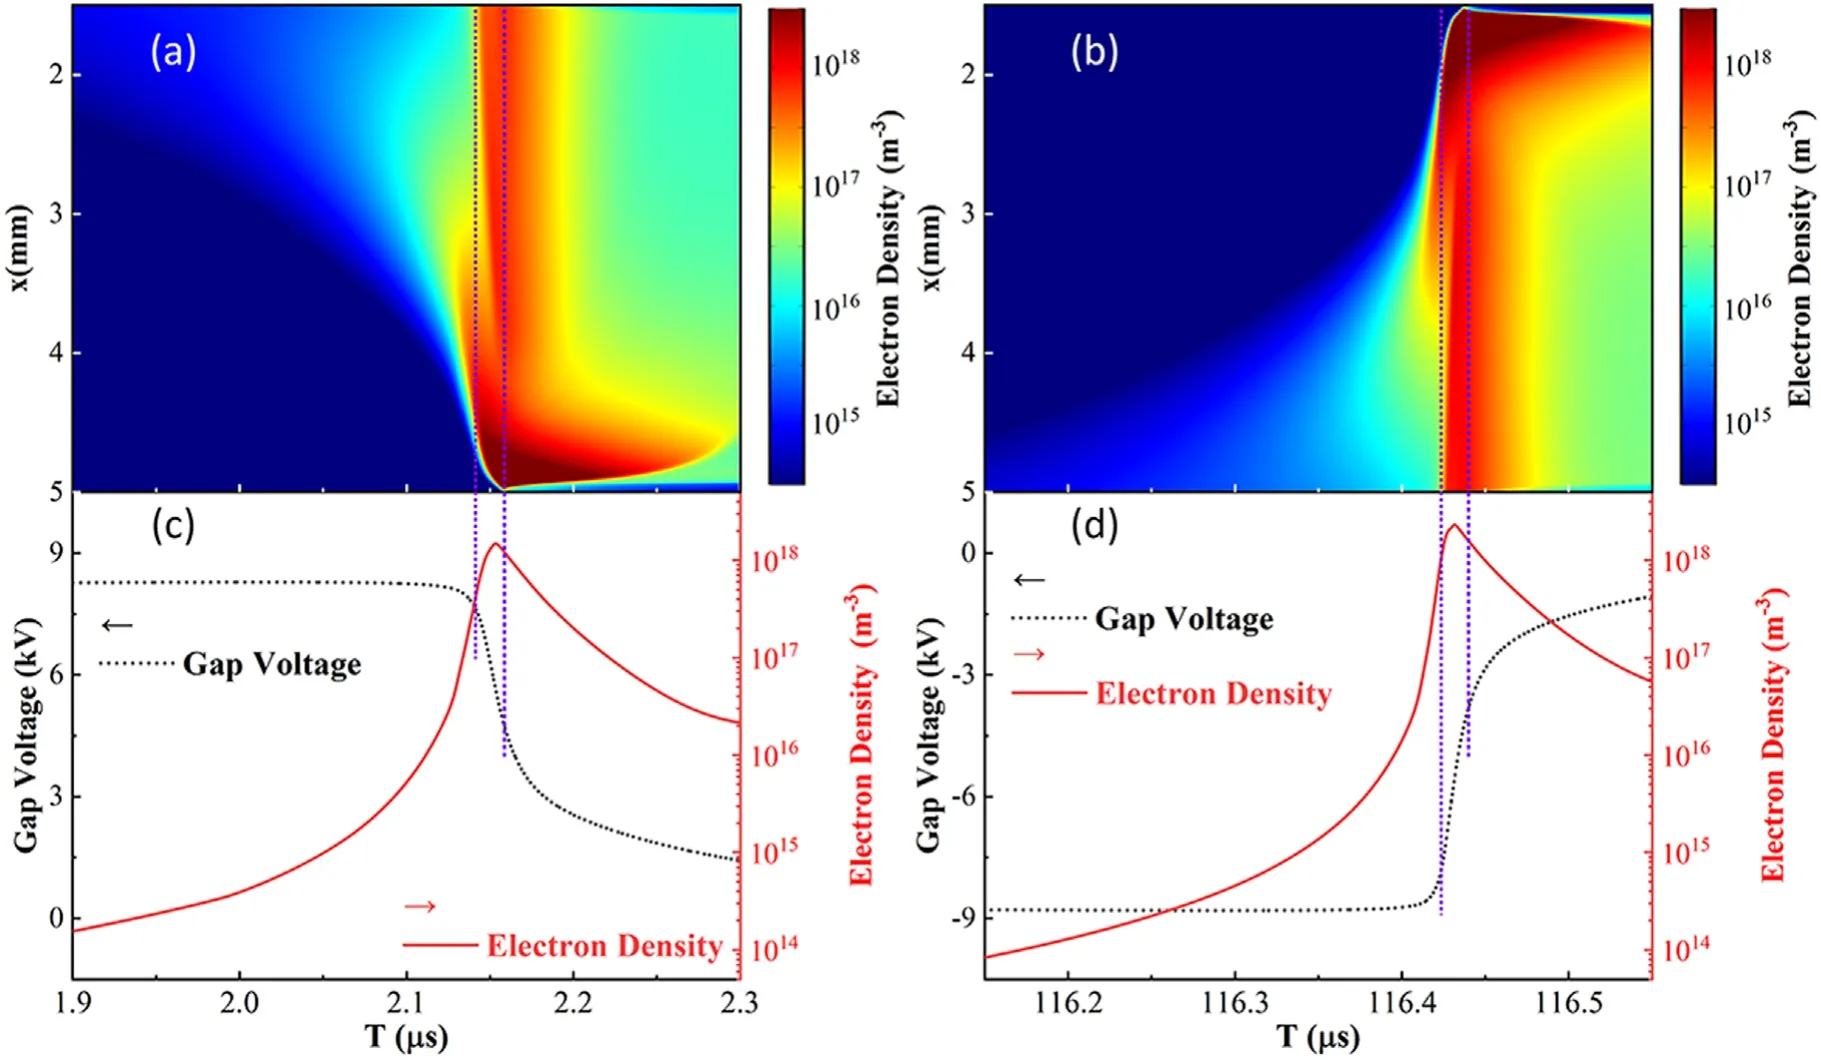
Figure 7.Temporal evolution of electron density distribution,gap voltage,and the average electron density of the plasma region in the positive HP ((a),(c)) and the negative HP ((b),(d)) during the breakdown.
The propagation velocity of streamer discharge is another essential characteristic to evaluate MDs’ performance.Figure 8 shows that the propagation velocity of the streamer discharge varies with the position of the streamer head.The propagating velocity of streamer discharge grows exponentially at the initial phase of streamer discharge propagation,and its maximum reaches 1.34 × 10⁵m s?1and 9.70 × 10⁴m s?1in the positive and negative HP until the streamer head reaches the position around 1 mm away from the cathode.The magnitude of streamer velocity in this study is lower compared to that obtained by previous studies[18,49,50].Since the propagating velocity of streamer discharge is proportional to the rising rate of applied voltage[51],the lower velocity of streamer propagating is attributed to the lower driving frequency applied in this study.

Figure 8.Propagating velocity of streamer discharge in positive and negative HP.
3.5.Accumulated charge on dielectric surface
The accumulated charge on the dielectric surface plays a critical role in the DBD process due to its enhancement of the electric field before discharge breakdown and suppression of the electric field’s continuous increase after the breakdown.Figure 9 shows the variation of the charge density on the dielectric surface in time.The charged particles are accumulated on the dielectric surface during the previous MD at the beginning of each HP.The charge accumulated on the dielectric surface with the same polarity as the external voltage improves the electric field of the air gap before the breakdown,which is contributed to obtaining plasma species faster.The surface charge density on the dielectric rapidly reduces with the occurrence of MD.Since the charge with the opposite polarity of the applied voltage accumulates on the dielectric surface,the electric field rapidly decreases.Subsequently,MD decays gradually with decreasing electric field.Each HP continues and repeats the previous process.The charge density on the dielectric surface varies from 37.54 to ?20.33 nC cm?2during the positive HP,as well as from ?20.33 to 37.54 nC cm?2in the negative HP.Therefore,the charge transferred through each MD reaches around 50.87 nC cm?2,which is of the same order of magnitude as in previous reports [16].

Figure 9.Variation of accumulated charge in ninth and tenth cycles on dielectric’s surface.
4.Conclusions
In the present study,experimental and simulated investigations of the characteristics of MDs are carried out in a pin-topin DBD under atmospheric pressure air.The main conclusions are summarized as follows:
(1) The experimental current pulses of the positive HP have more unpredictable behavior than that of the negative HP.The current pulses may arise once,twice,or three times in the positive HP under the conditions of this study.About 73.6% of all statistical results show only a single current pulse in the positive HP.The MD is made up of the discharge channel in the air gap and the branching channel on the dielectric surface from the ICCD images.The region of great luminous intensity is located at the dielectric surface and the metal electrode tip.
(2) The peak value of the calculated current pulses reaches 29.93 mA and ?44.83 mA in the positive and negative HP,respectively.The discharge energy acquired from the simulation is 12.47 μJ per cycle,which is of the same order of magnitude as the experimental results.The model developed in this work is qualitatively consistent with the experimental results.
(3) MD development is divided into three phases: the Townsend phase,the streamer propagation phase,and the decay phase.In the Townsend phase,the electric field distributes uniformly within the air gap and its intensity grows with time.In the streamer propagating phase,the streamer discharge driven by the electric field propagates towards the cathode.Moreover,the electron density and the reduced electric field continuously increase with its propagation in front of the streamer discharge.The maximal electric field and electron density reach 625.48 Td and 2.31 × 10¹⁹m?3in the positive HP as well as 790.13 Td and 3.58 × 10¹⁹m?3in the negative HP,respectively.Additionally,the transient glow-like discharge is found in the vicinity of the anode due to electrons produced from the streamer discharge being accelerated by the residual voltage within the air gap in the same period of the streamer propagation phase.In the decay phase,the quenching process is attributed to the accumulation of charged particles on the dielectric surface.The charge density on the dielectric surface periodically varies between ?20.33 and 37.54 nC cm?2due to the charge transfer during the MD process.
Acknowledgments
This research was supported by National Natural Science Foundation of China (Nos.51877027 and 51877028).This research was also financially supported by the Fundamental Research Funds for the Central Universities (No.DUT20ZD202),the Science and Technology Development Fund of Xinjiang Production and Construction (No.2019BC009),and the Dalian High-Level Talents Innovation and Entrepreneurship Project (No.2018RQ28).
Appendix.Chemical reactions included in the model of this study.

Table A1.Chemical reactions included in the model of this study.

Table A1.(Continued)
ORCID iDs
猜你喜歡
Chinese Physics B(2022年11期)2022-11-21 09:35:06
汽車實(shí)用技術(shù)(2022年14期)2022-10-19 19:30:38
應(yīng)用數(shù)學(xué)(2022年1期)2022-01-19 06:24:24
音樂(lè)天地(音樂(lè)創(chuàng)作版)(2021年4期)2021-07-12 12:02:42
源流(2021年11期)2021-03-25 10:32:07
小天使·一年級(jí)語(yǔ)數(shù)英綜合(2020年3期)2020-12-16 02:56:12
Journal of Donghua University(English Edition)(2020年4期)2020-10-27 08:15:06
小天使·一年級(jí)語(yǔ)數(shù)英綜合(2020年2期)2020-02-04 16:16:44
中華建設(shè)(2019年4期)2019-07-10 11:51:20
表面技術(shù)(2019年2期)2019-02-26 02:24:22
 Plasma Science and Technology2022年10期
- Plasma Science and Technology的其它文章
- Study of a 105 GHz short-pulse dummy load for the electron cyclotron resonance heating system with the quasi-optical method
- Cleaning of nitrogen-containing carbon contamination by atmospheric pressure plasma jet
- Impacts of laser pulse width and target thickness on laser micro-propulsion performance
- The effects of dilution gas on nanoparticle growth in atmospheric-pressure acetylene microdischarges
- The effect of nitrogen concentration on the properties of N-DLC prepared by helicon wave plasma chemical vapor deposition
- Development of low power non-thermal plasma jet and optimization of operational parameters for treating dyes and emerging contaminants