
Investigation into the thermal effect of the LIPS-200 ion thruster plume
2022-08-01 11:33:34XinweiCHEN陳新偉BijiaoHE賀碧蛟ZuoGU顧左HaiGENG耿海NingGUO郭寧YongZHAO趙勇KaiSHI史楷KaiTIAN田愷TaoCHEN陳燾andYifanMA馬伊帆
Plasma Science and Technology 2022年7期
關(guān)鍵詞:趙勇
Xinwei CHEN(陳新偉),Bijiao HE(賀碧蛟),Zuo GU(顧左),Hai GENG(耿海),Ning GUO(郭寧),Yong ZHAO(趙勇),Kai SHI(史楷),Kai TIAN(田愷),Tao CHEN(陳燾) and Yifan MA(馬伊帆)
1 Science and Technology on Vacuum Technology and Physics Laboratory,Lanzhou Institute of Physics,Lanzhou 730000,People’s Republic of China
2 School of Astronautics,Beihang University,Beijing 100191,People’s Republic of China
Abstract The distribution of the thermal effects of the ion thruster plume are essential for estimating the influence of the thruster plume,improving the layout of the spacecraft,and for the thermal shielding of critical sensitive components.In order to obtain the heat flow distribution in the plume of the LIPS-200 xenon ion thruster,an experimental study of the thermal effects of the plume has been conducted in this work,with a total heat flow sensor and a radiant heat flow sensor over an axial distance of 0.5–0.9 m and a thruster angle of 0°–60°.Combined with a Faraday probe and a retarding potential analyzer,the thermal accommodation coefficient of the sensor surface in the plume is available.The results of the experiment show that the xenon ion thruster plume heat flow is mainly concentrated within a range of 15°.The total and radial heat flow of the plume downstream of the thruster gradually decreases along the axial and radial directions,with the corresponding values of 11.78 kW m?2 and 0.3 kW m?2 for the axial 0.5 m position,respectively.At the same position,the radiation heat flow accounts for a very small part of the total heat flow,approximately 3%–5%.The thermal accommodation factor is 0.72–0.99 over the measured region.Furthermore,the PIC and DSMC methods based on the Maxwell thermal accommodation coefficient model(EX-PWS)show a maximum error of 28.6% between simulation and experiment for LIPS-200 ion thruster plume heat flow,which,on the one hand,provides an experimental basis for studying the interaction between the ion thruster and the spacecraft,and on the other hand provides optimization of the ion thruster plume simulation model.
Keywords:LIPS-200 ion thruster,plume thermal effects,thermal accommodation factor,PIC-DSMC
1.Introduction
Ion thrusters[1–3]have the potential to dramatically enhance the payload,prolong the service life and reduce the launching budget of spacecraft owing to their high specific impulse,low thrust,prolonged lifespan,and repeatable start-up etc,and have been successfully employed in missions concerning attitude control,station keeping,drag compensation,and deep space exploration.The implementation of electric propulsion technology on spacecraft will alter the plasma environment in the vicinity of the spacecraft owing to its special plume environment,resulting in a series of effects such as charged spacecraft surfaces,electromagnetic interference,and subsequent changes in the thermal properties of thermally sensitive surfaces.The ion thruster thermal effect mainly refers to the heat exchange resulting from the collision of beam energetic ions against spacecraft surfaces,which places the spacecraft in a thermal environment,causing an increase in spacecraft surface temperature and material damage[4,5].This can cause serious degradation of the working quality of the spacecraft and,in severe cases,can lead to the overall inability of the spacecraft to function and the failure of the space mission.The diagnostic measurements of electric propulsion are currently primarily conducted using Faraday probes[6],emission probes[7],Langmuir probes[8],retarding potential analyzer s(RPA)[9],and other contact diagnostic devices placed directly in the plasma plume which,in turn,can provide information such as electron density,spatial potential,ion energy distribution,plasma potential,the current density in the plasma,etc.

Figure 1.Sketch(a)and photograph(b)of the ion thruster plume thermal effect measurement system.
The thermal effect of the electric thruster plume has also been studied by a minority of scholars.In 1998,Kinget al,at the University of Michigan,used a heat flow meter to measure the heat flow of the SPT-100 Hall thruster[10]in three-degree increments at the radii of 0.5 m and 1 m,respectively.The results show that the high-energy plume region is the main distribution area of the heat flow.Also,due to the interaction of the plume with the background particles,many active neutral particles are found during the exchange of low-energy ions.In 2008,Berisfordet al,at the University of Texas in Austin,carried out a diagnostic experimental study of the thermal effects of the spiral helicon plasma discharge process using an infrared camera[11].The experimental results show that the energy loss in the insulated tube increases continuously with increasing electric field strength.However,there is very little formal published literature on the experimental diagnosis of thermal effects of the ion thruster in the plasma.
In this work,in order to investigate the specific distribution of thermal effects in the plume of the ion thruster,an experimental and numerical simulation study of the thermal effects in the plume field of a 200 mm xenon ion thruster has been carried out using a heat flow sensor diagnostic system.Combined with the ion current density determined by the faraday probe,and the ion energy of the plasma measured by the RPA probe,the thermal accommodation coefficient of the xenon plasma to the surface of the heat flow sensor is then derived from the data results that have been obtained for the total and radiated heat flow of the ion thruster plume.Furthermore,a simulation study of the thermal effect of the thruster plume was carried out with the EX-PWS software based on the Maxwell model of the thermal accommodation factor.The distribution of heat flow in the plume field of a xenon ion thruster is obtained,which,on the one hand,provides an experimental basis for studying the interaction between the ion thruster and the spacecraft,and on the other hand,provides optimization of the ion thruster plume simulation model.
The remainder of this paper is organized as follows.Section 2 characterizes the experimental apparatus and methodology,section 3 presents an analysis of the experimental results and the simulations of heat flux and thermal accommodation coefficient,and section 4 yields the conclusions of the current study.
2.Experimental setup
This experiment for the thermal effects of a 200 mm xenon ion thruster(LIPS-200)plume was carried out in the vacuum plume experimental system(PES)at the Beihang University Shahe campus.The entire experimental system was composed of five parts:the vacuum plume experimental system(PES),the 200 mm xenon ion thruster(LIPS-200),the heat flow sensor(HFS),the Faraday probe(FP),and the retarding potential analyzer(RPA)probe.The sketch(a)and photograph(b)of the ion thruster plume thermal effect measurement system are shown in figure 1.
As shown in figure 1,the HFS,FP,and RPA are placed on the movement mechanism support in a horizontal position.The center of rotation of the movement mechanism is the center of the ion thruster exit plane.The maximum travel of the movement mechanism is 1 m@360°.The total heat flow,radiation heat flow,ion current density,and ion energy distribution were available for different radii and angle points in the plume.
2.1.Vacuum systems
The PES of Beihang University principally constitutes a vacuum chamber,several pumps,a pumping system consisting of a molecular pump,a liquid nitrogen heat sink,an electrical control system,and a storage and supply system.The vacuum chamber[12,13]features a cylindrical horizontal structure with a maximum outer diameter of 5.5 m and a total length of 12.8 m composed of stainless steel.The effective internal diameter of the chamber after installation of the heat sink is 4.2 m,its length is 9.9 m and the volume is 250 m3.The vacuum chamber is capable of pumping(nitrogen)superior to 107l s?1and has an ultimate vacuum of 5×10?5Pa when the double layer heat sink is cooled with liquid nitrogen.The operating vacuum pressure of the system during the experiments was better than 9×10?4Pa.The photo of the vacuum system is shown in figure 2.
2.2.LIPS-200 ion thruster
The thruster used in this plume thermal effects test was a 200 mm diameter xenon ion thruster developed by the Lanzhou Institute of Physics,in which xenon was employed as the propellant,with the xenon purity reaching 99.9995%and the vacuum maintained at around 2.3×10?3Pa during operation.The thruster was successfully used onboard the SJ-9A[14]satellite.The performance parameters of the xenon thruster with a diameter of 20 cm are approximate:a nominal thrust of 40 mN,a specific impulse of >3000 s,and a power of 1000 W.The condition parameters of the thruster during this experiment were mainly:a discharge chamber mass flow rate of 1.24 sccm,a beam current of 814 mA,an anode mass flow rate of 11.24 sccm,a beam voltage of 1026 V.Photos of the LIPS-200 ion thruster are shown in figure 1(b).
2.3.HFS
The HFS system consists of a total and radiation heat flow meter,a signal conversion device,and a current signal acquisition system.The Schmidt–Boelter heat flow sensor was used to obtain the heat flow,which uses a thermopile based on a spatial temperature gradient to measure the temperature difference and determine the amount of total heat flow.The radiant heat flow is obtained by placing a sapphire glass sheet in front of the receiving front surface of the HFS.A photo of the HFS is shown in figure 3.When the ion thruster is in operation the HFS converts the received plume heat flow signal into a voltage signal(mV),the voltage signal is then transformed inside the chamber into a current signal(mA),this current signal is transmitted by means of a flange directly to the current acquisition system outside the chamber and finally to the computer terminal,where the total heat flow and radiation heat flow of the ion thruster plume are obtained.The relative positions of the heat flow sensor and thruster during the experiment are shown in figure 1(a).The range of the HFS is 0–10 kW m?2,with a maximum measurement of 12 kW m?2and an error of ±2% of the measured value.
2.4.FP
The planar FP[5,6,15,16]is a type of diagnostic apparatus used to identify the density of the ion current.Normally,it is composed of a planar collecting electrode(PCE)encompassed within a shield ring(SR).The collector surface of the FP used in this experiment is a molybdenum disk with a diameter of 10 mm.The material of the guard ring is stainless steel.The distance between the collector and the guard ring is 2 mm.The collector electrode and guard ring were supplied with bias voltages of ?30 V.The FP is placed on a vacuum movement mechanism.The electrical schematic and a photo of the FP are shown in figure 4.The relative positions of the FP and ion thruster during the experiment are shown in figure 1.
The ion current density(j)is derived in equation(1).
In equation(1),Vis the sampling resistor voltage,Ris the sampling resistor impedance,andArepresents the collection area.
2.5.RPA
The RPA[17,18]is principally employed to measure the energy distribution of ions in a plasma.The electrical schematic and a photo of the RPA probe are shown in figure 5.The relative positions of the RPA and ion thruster during the experiment are shown in figure 1.The RPA probe used in this experiment mainly consists of a housing,a four-layer grid,and a collection electrode,etc.The housing of the RPA consists of an inner diameter of 16 mm and a length of 22 mm stainless steel.The first electrode,the nearest plasma grid,is floating and is mainly used to reduce the disturbance caused by the plasma to the probe.The second grid has a voltage of?30 V,which aims to repel the electrons in the plasma and facilitate the entry of ions as much as possible.The third grid layer is scanned with a voltage of from 0 to 1200 V.This is mainly to screen the ions,with the aim of collecting the ion current bypassing only the higher energy ions.The fourth grid is applied with a voltage of ?30 V.The collection electrode consists of a 10 mm diameter molybdenum sheet.The ions from the plasma are filtered through the multi-layer grids,causing the higher energy ions to reach the collector surface of the RPA,where it is collected to obtain a current signal.The scanned voltage and the collected current constitute theI-Vcurve from which the ion energy in the plasma can be further obtained and its value is the magnitude of the firstorder derivative of the curve:

Figure 3.Photo and principle diagram of the HFS.
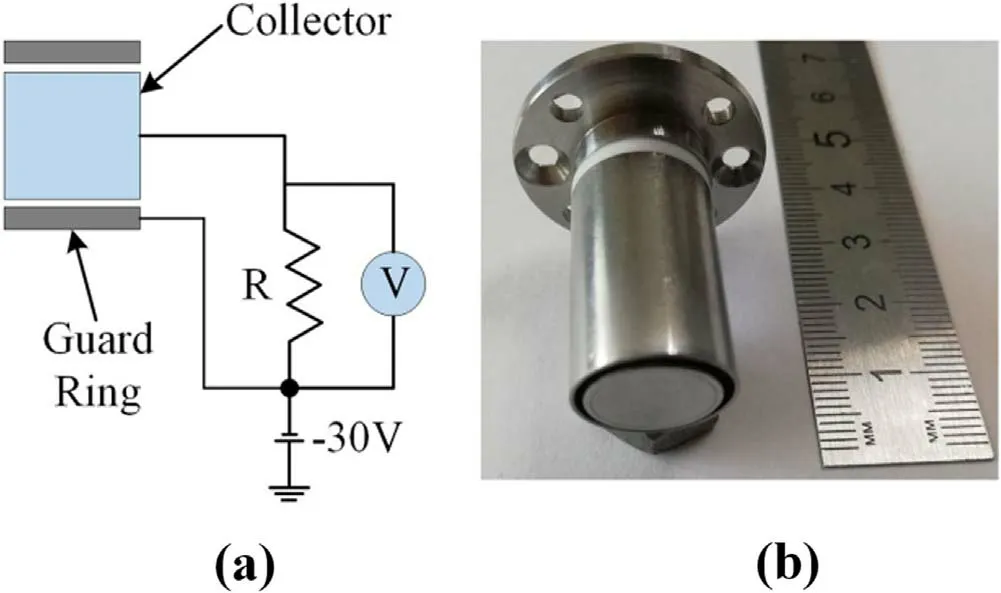
Figure 4.Electrical schematic(a)and photo of FP(b).

Figure 5.Electrical schematic(a)and photo of the RPA probe(b).

whereIandVdenote the current of the collection electrode and scanned voltage,respectively.mi,qeandedenote ion mass,species charge,and single-electron charge,respectively.Acis the area of the collection electrode andf(V)denotes a function related to the scanning voltage.

Figure 6.Schematic diagram of the composition of the heat flow from the ion thruster plume to the target surface.
3.Results and discussion
3.1.Experimental results and discussions
In conventional thermal effects measurements,heat flow sensors are often employed to detect both the energy transfer from the collision of plume particles with the sensor surface and the radiated energy transfer from the thruster and its plume to the sensor.The schematic diagram of the composition of the heat flow from the ion thruster plume to the target surface is shown in figure 6.
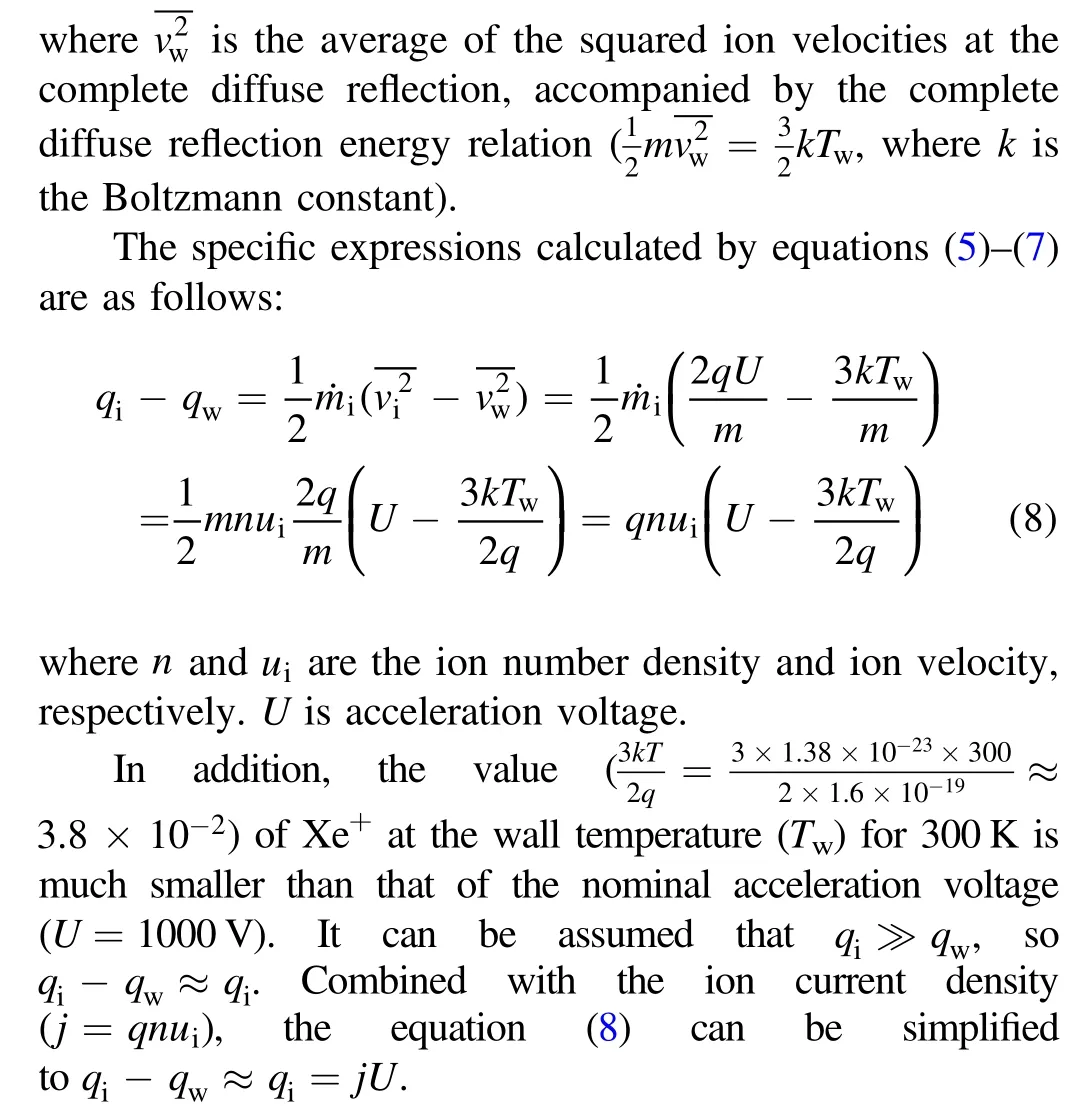
The composition of the heat flow in the ion thruster plume can be expressed as:

whereqtotalrepresents the total heat flow,which can be measured directly.Theqplumerepresents the heat flow generated by the action of the plasma plume particles on the surface.qradis the heat generated by the thruster and its plume radiation on the surface,which can be measured by adding sapphire glass to the head of the heat flow sensor.So,

In the actual action,qplumecan be expressed as the difference between the incoming energy(qi)density and the energy of elastic reflection reflected(qr)energy density.
To further investigate the incoming and reflected energy densities,we use the classical model of elastic collisions between gas molecules and walls—the Maxwell model.The Maxwell model assumes that the molecules are either fully energy-adapted diffuse reflection from a surface or mirror reflection with no energy exchange,as illustrated in figure 7.The thermal accommodation coefficient(α)is the fraction of diffuse molecules.Whenα=0 it is a complete mirror reflection and whenα=1 it is a complete diffuse reflection.
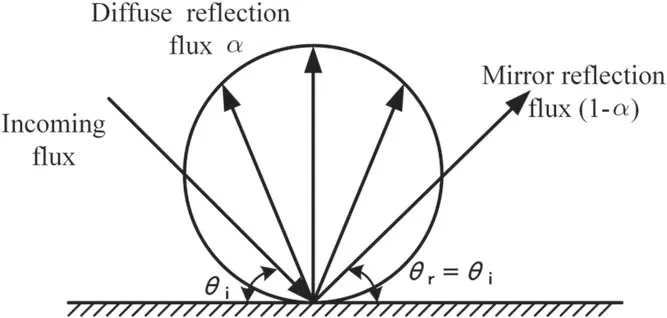
Figure 7.Schematic diagram of Maxwell’s reflection model.
According to the definition for the thermal accommodation coefficient(TAC)(α).
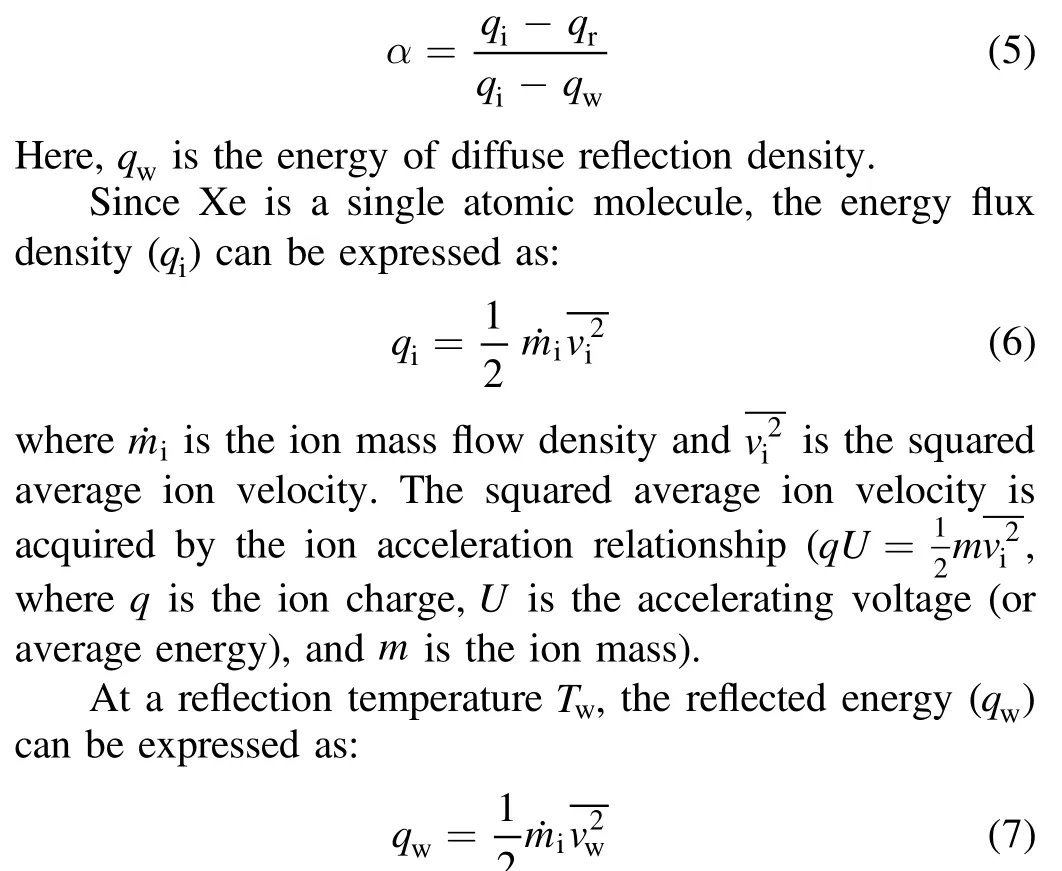

Figure 8.Schematic layout of the heat flow measurement points.
In summary,the thermal accommodation coefficient(α)in the Maxwell reflection model can be expressed as:
Since the particle current parameterjof the incoming flow can be measured by the FP,Uis available by the RPA,qtotalandqradare determined by the total and radiant heat flow meters,the thermal adaptation coefficient of the xenon plasma interacting with the wall of the heat flow sensor is finally derived.The correlation between the energy flow density of the incoming flow and the thermal adaptation coefficient is established.
3.1.1.HFS results.The experimental study of the heat flow distribution characteristics of the LIPS-200 thruster plume was carried out using a HFS.The principle of scanning from far-field to near-field,more points in the beam area than the non-beam area,and repeated measurements at crucial points were followed in the experiments.The measurement points of the probe are located at the horizontal plane consisting of the center of the ion thruster outlet plane.The specific distribution of measurement points:the distance from the thruster exit plane is 0.5 m,0.7 m,and 0.9 m respectively,and the range of 0°–60° angle with the thruster exit centerline.The center of the thruster exit plane is the center of the circle of the actual measurement point,the thruster exit centerline is 0°,and the counter-clockwise direction along the thruster exit centerline is the positive direction.The measurement points are arranged in 2.5°increments within the range of 0°–20°and angles in 5°increments within the range of 20°–60°.A schematic layout of the heat flow measurement points is shown in figure 8.
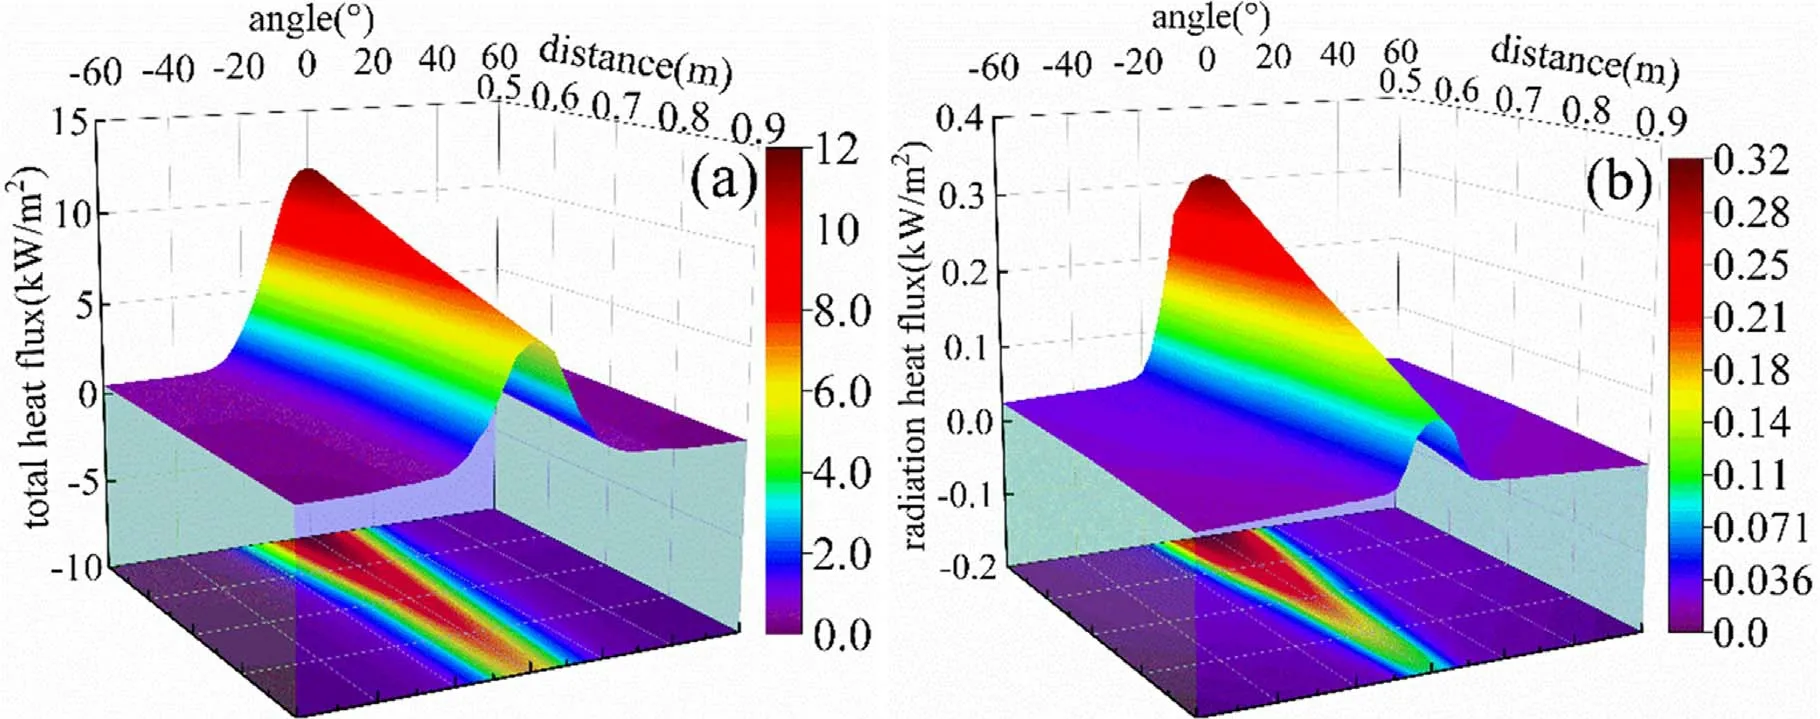
Figure 9.Contour maps of total heat flow(a)and radiant heat flow(b)as a function of distance and angle.
The magnitudes of the total and radiant heat flow densities in the plume field at different radii and angles are determined by the total HFS and the radiant heat flow meter respectively.The contour maps of total heat flow(a)and radiant heat flow(b)as a function of distance and angle are shown in figure 9.As can be seen from figure 9(a),the total heat flow at the centerline of the thruster at a radius of 0.5–0.9 m is about 6.8–12 kW m?2.At the identical angle and different radii,the smaller the radius,the larger the total heat flow;at the same radius,the total heat flow at the centerline of the thruster is the largest and decreases with the increasing angle,and then drops to the lowest at the angle of 30°,and does not change in the range of 30°–60°.Within the radius of 0.5–0.9 m and the angle of 0°–30°,the total heat flow at each radius accounts for most of the total heat flow at the respective radius,with the proportion being approximately 85%–95%.In the angle range of 30°–60°,the total heat flow at each radius ranges from roughly 0–1 kW m?2,accounting for approximately 5%–15% of the total heat flow.The analysis is attributed to the fact that the total heat flow obtained by the heat flow meter is mainly due to the ions impinging on the surface of the heat flow sensor,the kinetic energy of the ions is transformed into heat energy.Therefore,in the ion thruster beam region plasma beam density is great,the plasma velocity is high,the further away from the axis position,the plasma number density is relatively smaller as well as the ion velocity is also significantly decreased.Hence,the total heat flow density is greater in the range of 0°–30° and smaller in the range of 30°–60°.The ion action is basically in thermal motion and the heat flow density tends to be constant.
As can be seen from figure 9(b),the distribution of radiation heat flow of the thruster is similar to that of the total heat flow.The radiation heat flow at the radius of 0.5–0.9 m of the thruster centerline is approximately in the range of 0.1–0.35 kW m?2.Under the same radius,the radiation heat flow at the centerline of the thruster is the maximum,with the increasing angle,the radiation heat flow decreases,the radiation heat flow decreases to the minimum at the angle of 30°.The radiation heat flow value essentially does not change in the range of 30°–60°.From the above analysis,it can be concluded that the total heat flow and radiation heat flow of the ion thruster plume accounts for a considerable part of the corresponding total in the range of 0°–30°,beyond which the total heat flow and radiation heat flow changes are essentially small.
It is evident from figure 9 that at the same radius the radiant heat flow represents a minimal fraction of the total heat flow,around 3%–5%.At a radius of 0.5 m,the total and radiated heat flow is stable at around 30°,i.e.,at the junction of the beam and non-beam flows,which is generally consistent with the previous analysis.At a radius of 0.9 m,the radiated heat flow is stable in the region at an angle of about 15°.The possible reasons for this are the distance from the thruster,the smaller ion number density and thruster thermal radiation at this radius,and the larger sensor error.To better investigate and obtain the general law of the distribution of the thermal effect of the ion thruster plume,a nonlinear fitting of the total heat flow and the radiated heat flow in two variables,radius(r)and angle(θ)is carried out,and accordingly,the total(qtotal)and radiation(qrad)heat flow fitting equations are shown in equations(10)and(11),respectively.
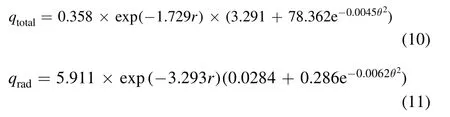
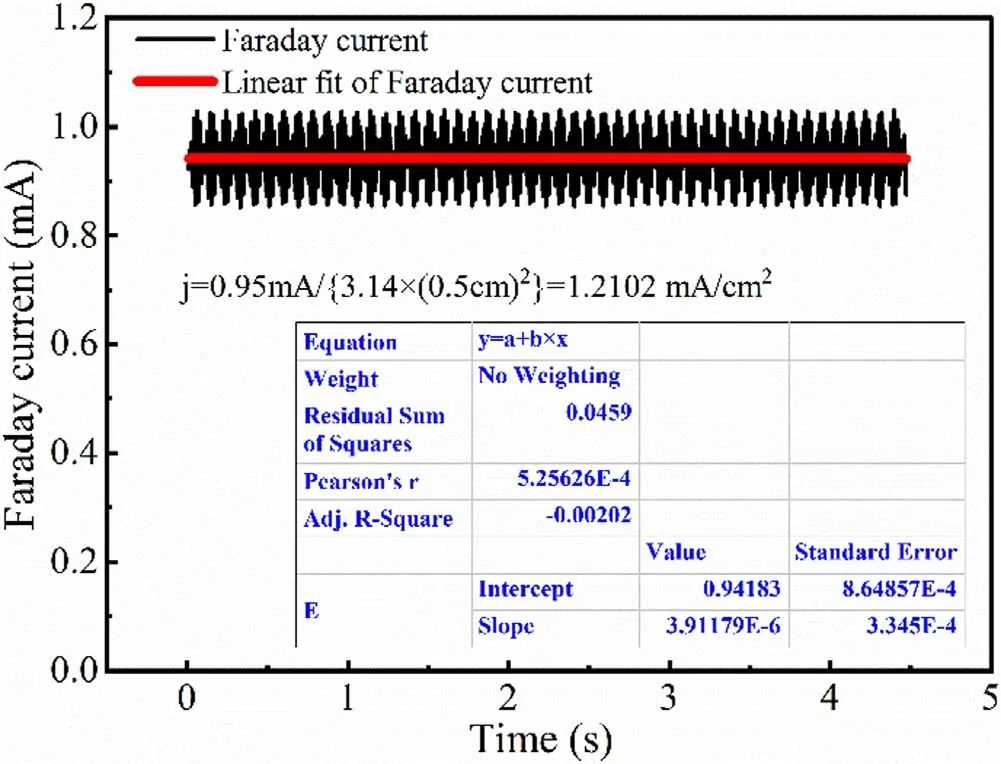
Figure 10.Diagram of raw FP data and fitted data for the position of the axis 500 mm downstream from the thruster.
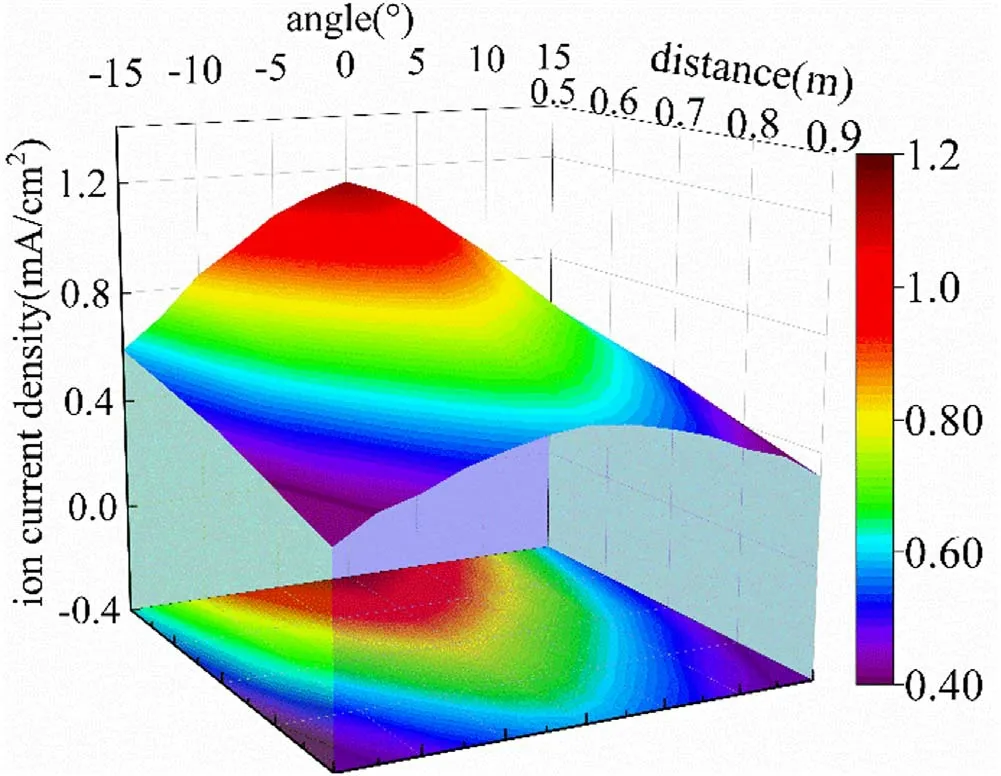
Figure 11.Contour maps of ion current density as a function of distance and angle.
3.1.2.FP results.The raw FP data and fitted data for the position of the axis 500 mm downstream from the thruster are shown in figure 10.The value of the current density measured by the Faraday probe at 500 mm on the axis does not vary with time and is a constant value,which can be inferred from the ion thruster working very steadily during the measurement process.The raw data from the experiment were averaged to obtain the current at 500 mm and then this value was divided by the effective contact area of the FP to give a final current density of 1.2102 mA cm?2at 500 mm.Similarly,combined with the moving mechanism,the current density of the Faraday probe can be determined for a radius of 500–900 mm and an axial angle of 0°–15° to the thruster,as shown in figure 11.The LIPS-200 thruster beam divergence half-angle is less than 15°[19,20].From the heat flow probe data,it can be seen that the heat flow in the plume is mainly concentrated in the beam region(within 15°)and the non-beam region accounts for about 5%,so only the ion current density in the beam region of the thruster is presented here,as shown in figure 11.As can be seen from figure 11,the ion current density in the thruster plume exhibits a gradually decreasing characteristic along with the thruster axial and radial directions.For example,the ion current density decreases from 1.21 mA cm?2to 0.59 mA cm?2from 0.5 m to 0.9 m along the thruster axis.This data is used as data input for the calculation of the thermal accommodation factor.
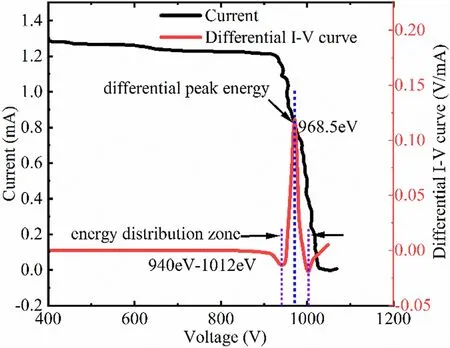
Figure 12.Schematic of the RPA probe I-V and differential curves located 500 mm from the thruster exit plane.
3.1.3.RPA results.The schematic of the RPA probeI-Vand differential curves located 500 mm from the thruster exit plane is shown in figure 12.From the preceding analysis,it is noted that the peak of the differentiatedI-Vcurve corresponds to the ion energy of the RPA at that position of the plasma.It can be seen from figure 12 that the voltages in the energy distribution region are approximately concentrated in the range of 940–1012 eV,which corresponds to a peak value of approximately 968.5 eV,the magnitude of which is the ion potential of the plasma at this location.The corresponding ion energies of the plasma at axial positions of 600 mm,700 mm,800 mm,and 900 mm are 987.6 eV,976.8 eV,982.7 eV,and 988.4 eV.Since the acceleration voltage of the ion thruster is 1024 V,it can be seen that the energy of the ion thruster plasma in the axial position is still very stable and does not essentially depend on the axial distance,which in turn leads to the basic stability of the plasma plume energy in the beam region and indirectly also reflects the excellent stability of the ion thruster performance.
3.1.4.TAC results.As can be seen from the previous information,the thermal accommodation coefficient(TAC)of the HFS surface in a xenon plasma plume can be derived from the combined results of the total heat flow meter,the radiation heat flow meter,the FP,and the RPA probe in the identical spatial location.The thermal adaptation coefficients of the xenon plasma to the surface of the HFS at various locations in the beam region are then derived,as shown in figure 13.

Figure 13.Schematic of TAC as a function of angle for 0.5 m(a),0.7 m(b),and 0.9 m(c).
It can be seen from figure 13(a)that the TAC of the xenon plasma interacting with the surface of the HFS at 500 mm does not vary with the angle,and the average value of the TAC in the range of 0°–15° in the beam region of the ion thruster is approximately 0.93.The minimum position occurs at an angle of 15°,which is considered to be at the boundary between the beam and non-beam regions.The plasma is considerably diluted and the amount of plasma and the velocity of motion is quite small,so there is a certain error compared to the core region.Similarly,it can be seen from figures 13(b)and(c)that the average TAC for both is 0.88 and 0.84 at locations with a radius of 0.7 m and 0.9 m,respectively.The TAC of the surface of the xenon plasma near the axial position is relatively high when acting with the surface of the heat flow meter,basically between 0.9 and 1.The TAC at the corresponding positions was between 0.8 and 0.9 when deviated from the axial direction.The possible reasons for this discrepancy are that the distance from the thruster(the density and velocity of the plasma cause errors in the measurement equipment),the vacuum level of the experimental process,the variation of the surface temperature of the heat flow meter during the heat flow measurement and the CEX plasma during the probe measurement all influence the measurement results.The main reason for this phenomenon is that,from the perspective of particle impact,most of the energy is converted into heat when the particles hit the surface of the heat flux meter in a vertical direction in the case of forwarding incidence,while the oblique particles have a certain outward velocity,which reduces the energy exchange.Therefore,as the angle increases,the adaptation factor is reduced.
3.2.Numerical simulation of heat flows
In this section,the thermal effects of the electric propulsion plume are simulated for the LIPS-200 ion thruster and compared with experimental results.The calculation of the thermal effects takes into account the effect of the thermometer in the flow field on the plume,in particular the fact that energetic particles hitting the surface of the thermometer are neutralized and lose energy to become slow neutral atoms,but still participate in the xenon atomic flow field.The LIPS-200 ion thrust plume thermal effect simulation was carried out with dedicated software(EX-PWS)for electric propulsion plume simulation developed by Beihang University.The plasma dynamics model and the collision dynamics model in this software are solved by the particle-in-cell(PIC)and direct simulation Monte Carlo(DSMC)approaches,respectively.The EX-PWS has been successfully used to simulate the plume flow field characteristic distribution and plume sputtering deposition effects for single ion thruster and multiple ion thrusters.

Figure 14.Schematic diagram of the calculation area mesh.
The calculation grid and boundary conditions are set as follows.The schematic diagram of the calculation area mesh is illustrated in figure 14.The computational domain is a cube with dimensions of 1.5 m×1.5 m×1.5 m.The simulated LIPS-200 ion thruster is modeled as a small cylinder.The coordinates of the center point of the thruster exit surface are set to(0,0,0).To study the flow field distribution over a range of 1.0 m including the thruster,the entire calculation area was set to 1.0 m in front of the thruster and 0.5 m behind the thruster.The number of computational grids is approximately 4 million,divided into four parallel partitions along thex-direction.The virtual heat flow meters(in practice,the boundary does not exist and the particles move directly through it)were placed at 0.5 m,0.7 m,and 0.9 m downstream of the thruster.By statistically capturing the flux of particles at the location of the heat flux meter,the energy density of the incoming flow is obtained and,using the Maxwell reflection model,the energy flow of the reflected particles is statistically calculated,and the difference between the two is obtained as the heat flow density.In this simulation,the background pressure is set to 9×10?4Pa,while all cube boundary surfaces and virtual heat flow meter are set to free boundary and Maxwell wall,considering that the gas molecules are then absorbed after impacting on the surface and removed from the calculation domain.The ratio of Xe2+to Xe1+in the plume is assumed to be 10% for the calculation.For the calculations,the time step was set to 1×10?7s,the particle weights were set to 1×10⁹,the ambient and individual wall temperatures were set to 300 K.
The EX-PWS simulates particle injection,particle movement,and particle collision physics processes of the LIPS-200 thruster as detailed in the published literatures[4,13,21,22].This article does not duplicate excessive descriptions,it just presents the calculation method for heat flow based on the Maxwell model in the EX-PWS.For incoming plasma,the heat flow is divided into two parts,namely the energy flow of the plasma translational motion and the energy flow of the plasma rotation plus vibrational internal energy(qro+vi).
The energy of plasma translational motion(qtran)can be expressed as:
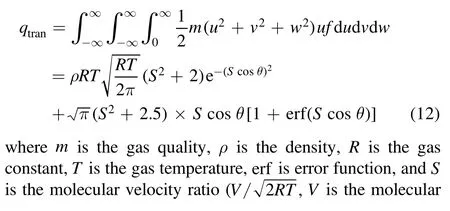

Combined with thermal accommodation coefficients obtained from experiments,direct statistics of particle fluxes at specific locations in the LIPS-200 ion thruster plume are employed to calculate the heat flow density at different locations.
The Xe+ion number density and velocity distribution are depicted in figure 15.It is apparent from figure 15 that the ion number and velocity of plume Xe+are symmetrically distributed along the axial direction of the thruster,with a characteristic maximum number(approximately 6.5×10¹⁵m?3)and velocity(approximately 36 km s?1)of Xe+in the vicinity of the center of the thruster outlet and then decreasing along the radial and axial directions.
It can be seen from the experimental results that the thermal accommodation coefficient is not constant for different regions and that it varies with angle and distance,which brings some challenges to the simulation.The experimentally measured thermal accommodation coefficients ranged from 0.72 to 0.99(close to 1).To further weigh the accuracy and speed of the simulation,three cases of the mean(0.88)and the minimum(0.72)and maximum(1)values of the thermal accommodation coefficient were adopted in this simulation for comparison with the experimental results.
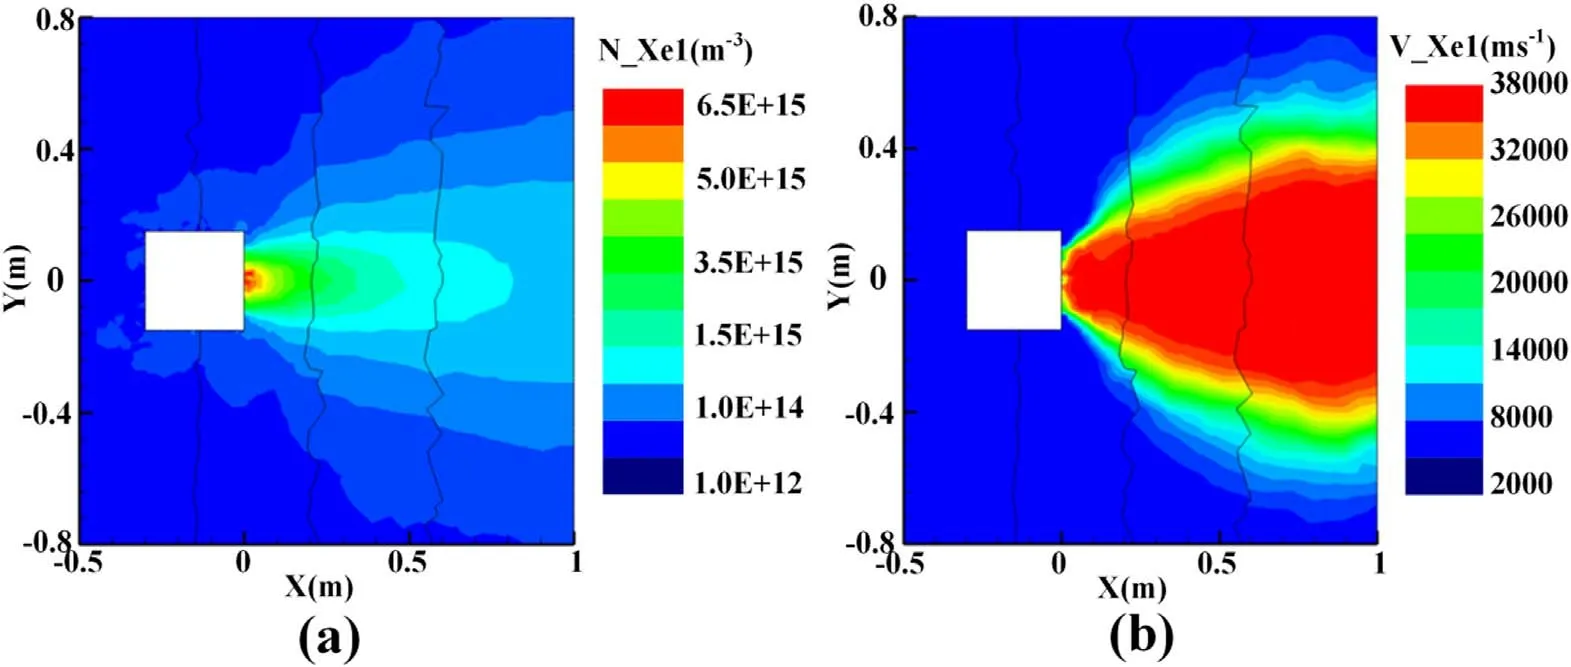
Figure 15.Xe+ ion number density(a)and velocity distribution(b).
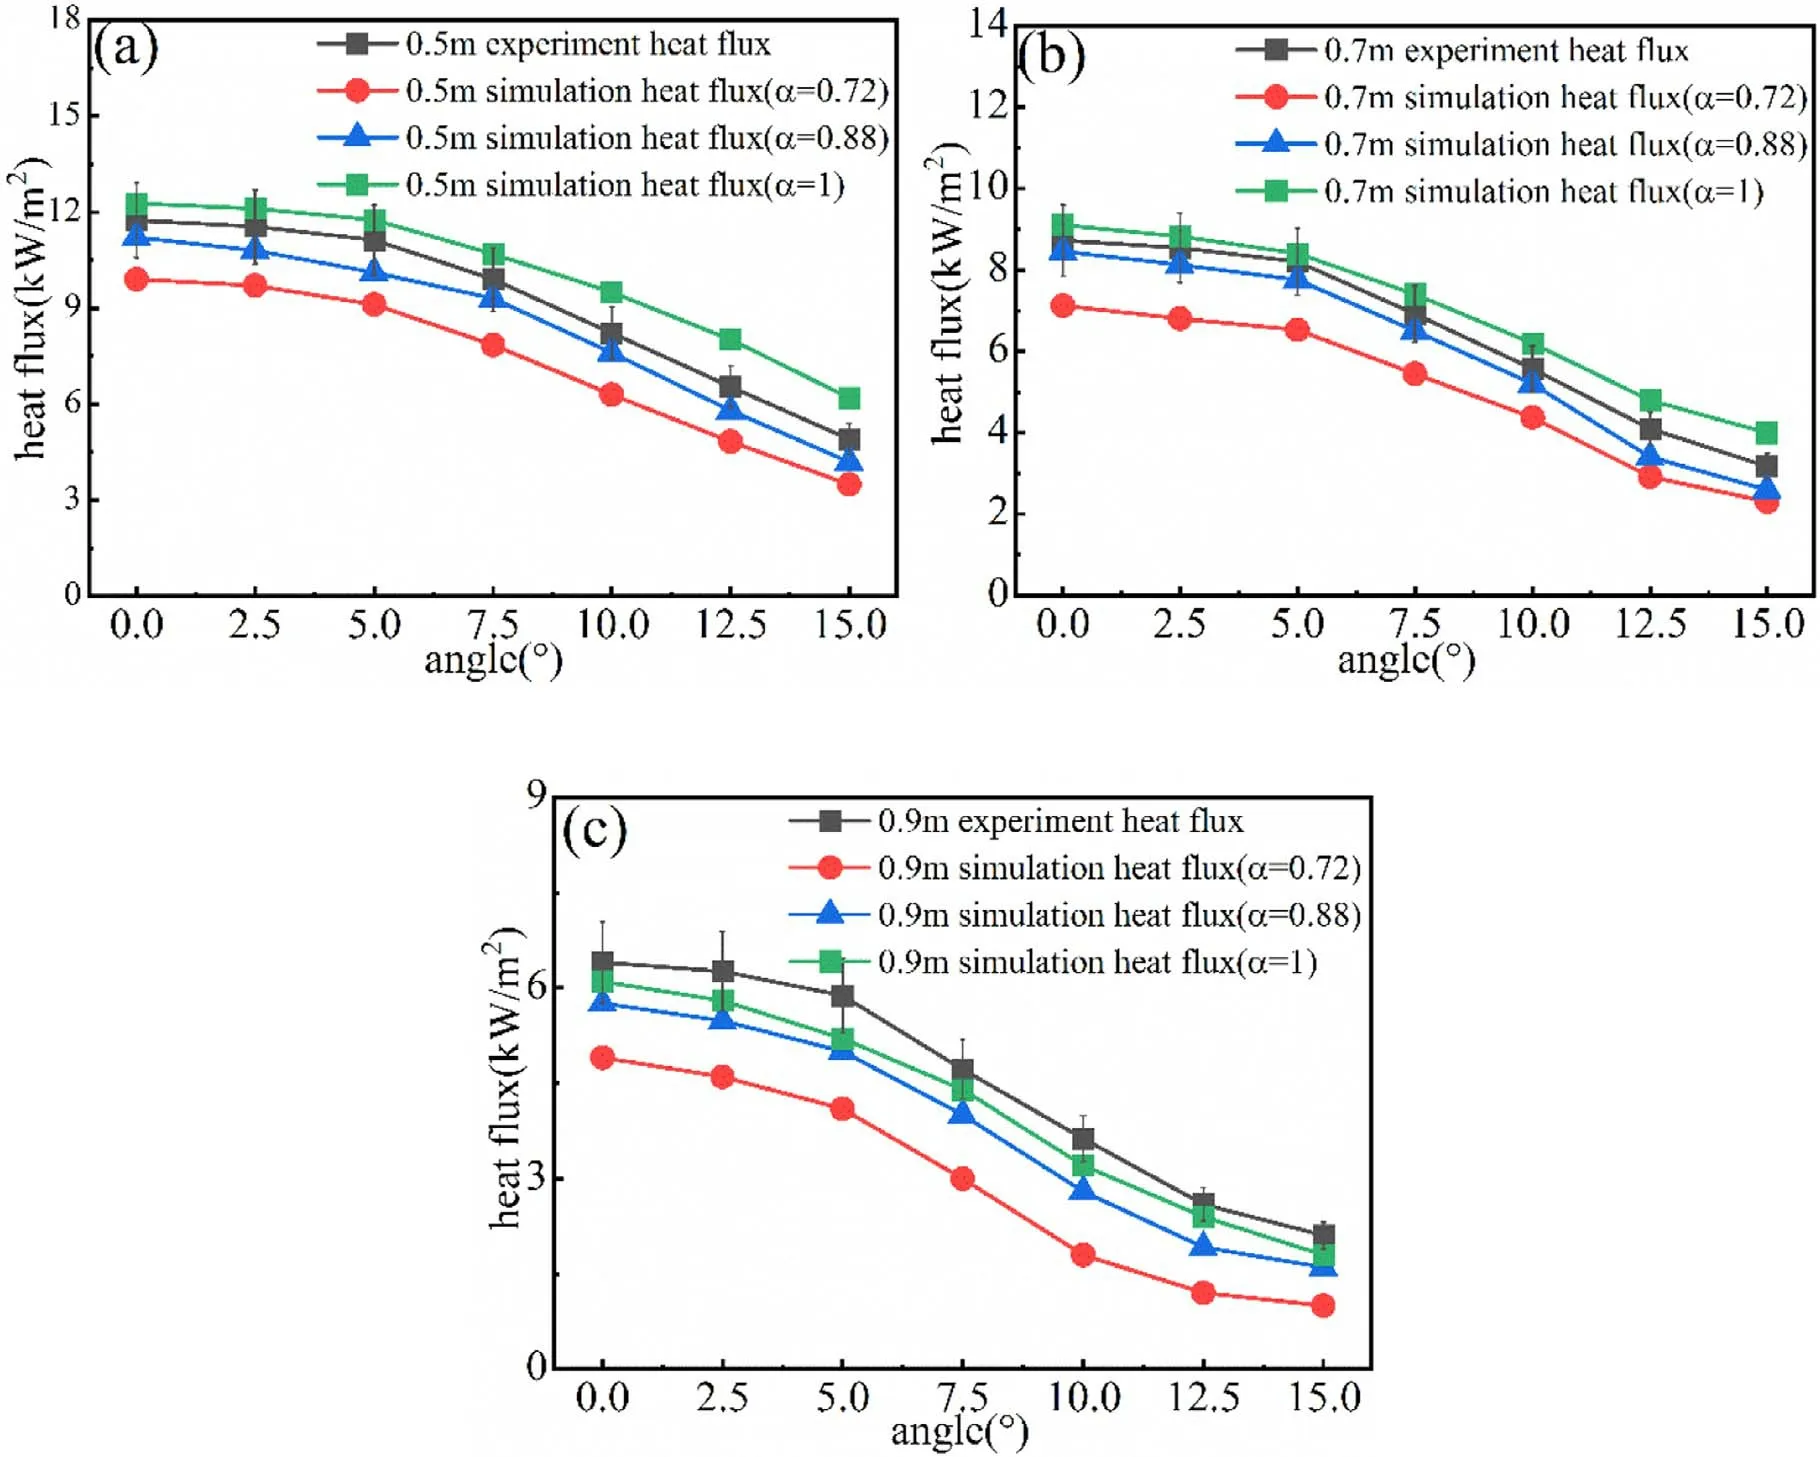
Figure 16.Simulation and experimental comparison of radial heat flow at 0.5 m(a),0.7 m(b),and 0.9 m(c),respectively,from the thruster outlet under different thermal accommodation factors.
The simulation and experimental comparison of radial heat flow at 0.5 m(a),0.7 m(b),and 0.9 m(c),respectively,from the thruster outlet under different thermal accommodation factors,is depicted in figure 16.It is evident in figure 16(a)that the experimental measurements in the plume beam region at angles from 0° to 15° are essentially smaller than the simulated values for heat flow with a thermal accommodation factor of 1 and higher than the simulated values for heat flow with a thermal accommodation factor of 0.88 and 0.72,respectively.Moreover,the heat flow error between the experiment and the numerical simulation decreases with the decreasing of the angle.The error between the experiment and the numerical simulation increases with the increasing angle,with a maximum error at the angle of 15°.The relative absolute maximum error is within 12.1%for a thermal accommodation factor of 1 and within 18.5% and 26%for the thermal accommodation factors of 0.88 and 0.72,respectively.The location of the larger error in the heat flow with a thermal adaptation factor of 1 is approximately 15°.The reason for this is that this position is the half-angle of the beam,i.e.,the junction of the beam and non-beam regions,where the plasma number density is thinner and both the simulation and experiment are difficult,hence the high relative error.The thermal accommodation coefficients of 0.88 and 0.72 have large errors in the heat flow due to the experimental mean and minimum values to calculate the heat flow,and the actual measured heat flow at different locations at 0.5 m from the thruster has a certain error,so there is a difference between the simulation and experimental heat flow after comparison.It can also be seen that the thermal accommodation coefficients of 1,0.88,and 0.72 for the simulated heat flow,respectively,fall more gently in the radial direction compared to the experimental measurements,suggesting that the accommodation coefficients used in the Maxwell model for particle-surface energy exchange should not be fixed values,rather it should vary with angle.This study is consistent with the experimentally-measured variation of the thermal accommodation coefficient with angle.Analogously,similar conclusions can be drawn from figures 16(b)and(c).The difference is that the error in the simulation and experimental comparison increases with increasing distance and angle for the identical thermal accommodation factor.For different accommodation factors,the error in heat flow between experiment and simulation is larger with smaller thermal accommodation.However,it can also be seen that the error between the simulated and experimental heat flow with a thermal accommodation factor of 0.72 is generally higher within a small radial angle at 0.9 m.This indicates that the simulation results for the low thermal accommodation factor used in the simulation differ significantly from the actual results.The position with the highest error between the heat flow simulation and the experiment is at an angle of 15°,with a thermal adaptation factor of 0.72,an error of 28.6%.The main reasons for this are the distance from the thruster at 0.9 m,the thinner plasma,and the large error between simulation and experiment.It is found experimentally that the thermal adaptation factor varies for different locations in the plume.The simulation results based on the Maxwell thermal accommodation coefficient model show that the simulation and experimental errors of the heat flow with an average thermal accommodation coefficient and a minimum thermal accommodation coefficient are small over a wide range of region for a thermal accommodation coefficient of 1.Therefore,in order to improve the efficiency of the simulation,we suggest that the thermal adaptation coefficient of the simulated ion thruster plume based on the thermal adaptation coefficient of the Maxwell simulation is taken to be 1.
To further weigh the accuracy and speed of the simulation,three values of the thermal accommodation coefficient were adopted in this simulation for comparison with the experimental results.In comparison with the experiment,the simulation results can predict the heat flow distribution of the thruster plume.In order to better predict the heat flow distribution at different positions of the thruster,the measured radial distribution values are subsequently input into the model for calculation,and the error between the simulation and calculation of the heat flow will be further reduced.
4.Conclusions
An experimental study of the thermal effects of the ion thruster plume was implemented with a total heat flow sensor and a radiant heat flow sensor in the region of 0.5–0.9 m downstream of the LIPS-200 ion thruster,with an angle of?60° to 60°.The TAC of the heat flow sensor surface in the plume is derived using a FP,a RPA,and a HFS.The PIC and DSMC methods based on the Maxwell thermal accommodation factor model(EX-PWS)were also used to simulate the thermal effects of the ion thruster plume.The conclusions obtained in this study are as follows:
(1)At the identical radius and different angles,the total and radiant heat flow is maximum at the axis of the thruster and decreases successively away from the axis.The closer to the thruster,the greater the total and radiant heat flow in the plume for different radii.At the identical radius and different angles,the radiant heat flow accounts for a minimal part of the total heat flow,approximately 3%–5%.
(2)The thermal accommodation factor,determined from the FP,a RPA,and heat flow sensor,is 0.72–0.99 over the measured region and is not a constant value depending on the angle.
(3)The PIC and DSMC methods based on the Maxwell thermal accommodation coefficient model(EX-PWS)show a maximum error of 28.6% between simulation and experiment for LIPS-200 ion thruster plume heat flow which,on the one hand,provides an experimental basis for studying the interaction between the ion thruster and the spacecraft,and on the other hand provides optimization of the ion thruster plume simulation model.
Acknowledgments
The authors are grateful to National Natural Science Foundation of China(No.12005087)and the Science and Technology Program of Gansu Province(Nos.2006ZCTF0054,HTKJ2019KL510003,and 20JR10RA478).
猜你喜歡
文萃報(bào)·周二版(2025年7期)2025-03-02 00:00:00
電訊技術(shù)(2023年10期)2023-12-03 04:53:24
Plasma Science and Technology(2023年1期)2023-03-09 05:45:42
知音(月末版)(2022年7期)2022-05-30 10:48:04
Plasma Science and Technology(2022年4期)2022-05-05 01:49:28
檢察風(fēng)云(2016年7期)2016-05-14 09:42:20
中國老區(qū)建設(shè)(2016年2期)2016-02-28 09:32:10
Transactions of Nanjing University of Aeronautics and Astronautics(2015年2期)2015-11-24 02:39:24
水動力學(xué)研究與進(jìn)展 B輯(2015年2期)2015-04-20 05:52:25
水動力學(xué)研究與進(jìn)展 B輯(2013年4期)2013-06-01 12:29:58
 Plasma Science and Technology2022年7期
- Plasma Science and Technology的其它文章
- Special issue on selected papers from CEPC 2021
- Highly efficient γ-ray generation by 10 PWclass lasers irradiating heavy-ion plasmas
- Surface properties of Al-doped ZnO thin film before and after CF4/Ar plasma etching
- Photoexcited carrier dynamics in a GaAs photoconductive switch under nJ excitation
- Molecular mechanism study of Astragalus adsurgens Pall synergistically induced by plasma and plasma-activated water
- Microwave method based on curve fitting method for high-precision collision frequency diagnosis