
Analysis of temporal and spatial distribution characteristics of ammonium chloride smoke particles in confined spaces
2022-07-27 06:40:46ChenyoushiXuBingtingZhaJiaqianBaoHeZhangHongxiaLi
Defence Technology 2022年7期
Chen-youshi Xu, Bing-ting Zha, Jia-qian Bao, He Zhang, Hong-xia Li
ZNDY of Ministerial Key Laboratory, Nanjing University of Science and Technology, Jiangsu, Nanjing, 210094, China
Keywords:Laser fuze Smoke environment Temporal distribution Spatial distribution Confined space Smoke agent
ABSTRACT In response to the demand for short-range detection of anti-smoke environment interference by laser fuzes, this study proposes a smoke environment simulation of non-uniform continuous point source diffusion and investigates an experimental laboratory smoke environment using an ammonium chloride smoke agent. The particle size distribution, composition, and mass flow distribution of the smoke were studied. Based on a discrete phase model and a k-ε turbulence model, a numerical simulation was developed to model the smoke generation and diffusion processes of the smoke agent in a confined space. The temporal and spatial distribution characteristics of the smoke mass concentration, velocity,and temperature in the space after smoke generation were analyzed, and the motion law governing the smoke diffusion throughout the entire space was summarized. Combined with the experimental verification of the smoke environment laboratory, the results showed that the smoke plume changed from fan-shaped to umbrella-shaped during smoke generation, and then continued to spread around.Meanwhile, the mass concentration of smoke in the space decreased from the middle outward; the changes in temperature and velocity were small and stable. In the diffusion stage(after 900 s),the mass concentration of smoke above 0.8 m was relatively uniform across an area of smoke that was 12 m thick.The concentration decreased over time,following a consistent decreasing trend,and the attenuation was negligible in a very short time.Therefore,this system was suitable for conducting experimental research on laser fuzes in a smoke environment. Owing to the stability of the equipment and facilities, the setup could reproduce the same experimental smoke environment by artificially controlling the smoke emission of the smoke agent.Overall,this work provides a theoretical reference for subsequent research efforts regarding the construction of uniform smoke environments and evaluating laser transmission characteristics in smoky environments.
1. Introduction
Laser detection is widely adopted in proximity fuzes owing to its high coherence, distance accuracy, rapid response, and antielectromagnetic interference [1,2]. Laser proximity fuzes have played an important role in improving the hit rate and destructive effect of modern precision-guided weapons, especially ground-toair missiles, air-to-air missiles, and anti-radiation missiles. They are widely used in conventional ammunitions and missiles; however,short-range laser detection is susceptible to interference from complex smoke environments that exist in real battlefields,leading to false alarms and early explosions [3]. Such complex smoke environments contain dust kicked up by the movement of tank armor,the hot smoke from gun muzzles after firing ammunition,the dust generated by the recoil after firing ammunition, the smoke from ammunition explosions,and the smoke pot and smoke bombs used in the tactical combat of armored clusters.Therefore,the influence of the smoke environment on laser detection cannot be ignored.The interference effect on laser-guided ammunition is mainly related to the concentration and thickness of the smokescreen, as well as the composition and size of the particles [4]. Therefore,ongoing anti-environmental interference research efforts primarily focus on evaluating the environmental smoke concentration in which laser proximity fuzes can work effectively.
There are a limited number of studies and publications describing quantitative evaluations of the smokescreen effect for laser-guided weapons interference. In particular, the interference ability of smokescreens in actual combat is not well understood.Most reports do not mention the smoke particle composition or the particle size distribution of the smoke agent [5-10]. However,different smoke particle compositions and particle sizes have distinct light reflectivity characteristics, which also lead to differences in laser penetration performance [11,12].
The currently available strategies for evaluating the interference effect of smokescreens include the experimental test evaluation method(ETEM)and the theoretical calculation evaluation method(TCEM). Based on the environmental testing conditions, the ETEM can be classified as a laboratory smokescreen box evaluation method, a small- and medium-sized wind tunnel evaluation method,or a field evaluation method.The laboratory smokescreen box evaluation method is most commonly used because of its controllable test conditions, reproducible test environment, and safety compared with the other methods. Shen et al. created a smokebox that could discharge a burning smoke agent, spraying powder, and spraying laser chaff, but the authors did not describe the smoke concentration distribution in the box[13].Xie et al.used a closed glass box filled with smoke to simulate a smoke environment [14]. Although an air quality detector was placed inside the box to measure the concentration of particles in the air, its small size limited the thickness of the simulated smoke. Zhang et al.established a 10-m-long pipe-type device to study the relationship between the laser echo signal and the thickness of the smoke.However,because of the random distribution of smoke in the pipe,the influence of smoke concentration on their conclusions was ignored [15]. In another study a quantified amount of smoke particles was blown into a closed test box[16].However,in these cases,they either replaced the actual concentration with the average arithmetic concentration or replaced the smoke concentration with the subjective visibility value, neither of which is a sufficiently rigorous approach. The real battlefield smoking environment is very complicated and the space occupied by the smoke is quite large, so it is difficult to carry out data measurement. And the smoking environment generated under the same conditions is inconsistent every time. It is impossible to carry out related experiments with laser fuzes in such an uncontrollable smoky environment. Therefore, it is necessary to establish an environmental laboratory with adjustable smoking concentration and provide an experimental environment for laser anti-smoke experiments.
Considering the complexity of the battlefield smoke environment,conventional TCEMs are not mature,and most of them adopt computer numerical simulation methods. The diffusion of smokescreens can be categorized as continuous point source diffusion(e.g., smoke agents) or instantaneous body source diffusion (e.g.,smoke bombs) [17]. Xu et al. proposed a smoke laboratory design scheme to determine the distribution of smoke concentration and the concentration over time for different cross-sections in the laboratory using the computational fluid dynamics(CFD)software,FLUENT. However, since the boundary condition was a slender rectangular inlet, this was difficult to achieve [18,19]. Hao et al.combined a CFD method with a discrete phase model to simulate the diffusion of smoke particles, and they deduced the temporal and spatial distribution of the mass concentration of an explosively-dispersed smoke bomb.However,this approach lacked experimental verification [20]. Zhou et al. studied the influence of ambient wind speed, ventilation position, and fire source on the pressure distribution and smoke movement in single- and multichamber fires through a series of numerical simulations [21].Yang et al. proposed a method for determining the temporal and spatial distribution of dust during tank movement based on CFD discrete phase dispersion theory. They studied the influence of wind direction and particle mass flow rate on dust concentration and temporal and spatial distribution [22]. Because field test conditions are harsh and uncontrollable, there is still a lack of experimental data to support such studies. Ma et al. used an instantaneous point source to simulate explosion smoke based on the Gaussian smoke model.They obtained the smoke concentration distribution law but did not consider the sedimentation effect of smoke particles [23]. Based on the mechanism of gas-solid twophase flow, Ding et al. studied the spatial diffusion of smoke in microgravity and high-vacuum environments [4]. Zeng et al. constructed a vertical smokescreen spatial scale calculation model through analytical geometric analysis,which was demonstrated to be suitable for infrared shielding smokescreens [24]. Xiao et al.proposed a method that combines the wind field results calculated by the computational fluid dynamics method with the particle system to simulate the diffusion of aerosols in a complex environment.However,this method did not provide a specific analysis of the particle forces,and the study finally obtained a graph of the transparency of the particle system, which could not get the specific particle concentration distribution[38].HE et al.established a geometric model of the flow field and derived the correlation law of wind speed and wind direction on smoke diffusion through simulation. But the study did not describe the physical characteristic parameters of smoke particle and external field experimental verification, and the correctness needs to be considered [39].
The aforementioned studies using ETEMs do not consider the temporal or spatial distribution of smoke in the smoke environment,nor do they investigate the diffusion process of smoke;these oversights mean that the smoke concentration parameters at a specified location cannot be determined. Additionally, because TCEMs are impacted by the calculation speed and the selected type of model, calculation models that ignore some influencing factors may lead to significant errors between the conclusions obtained by the TCEM and the actual experimental data. Therefore, to understand whether laser proximity fuzes can work reliably in a smoky environment,it is necessary to combine ETEM with TCEM and then set up a smoke environment laboratory to study the temporal and spatial distribution characteristics of smoke.
The rest of this article is organized as follows. Section 2 establishes a mathematical model of smoke diffusion and deduces the force equation that governs the investigated smoke particles. Section 3 analyzes the smoke particle composition, particle size distribution, and combustion mass loss distribution, and describes numerical simulations of the temporal and spatial characteristics of the smoke concentration, velocity, and temperature. Section 4 verifies the accuracy of the smoke diffusion model and numerical simulation by using a smoke environment laboratory and conducting experimental research and analysis. The described simulation supports the experimental results.Finally,Section 5 presents the conclusions drawn from the results obtained in this work.
2. Smoke diffusion mathematical model
There are two methods for studying the propagation and deposition of aerosols:the Euler method and the Lagrange method.The Euler method regards the particle phase as a pseudo-fluid that interpenetrates the fluid;this approach uses the Euler equation for both the gas phase and the particle phase. It comprehensively considers the speed slip between the two phases,particle diffusion,phase coupling, and the particles' effect on the fluid [25]. The Lagrange method emphasizes the individual behavior of each particle, and it can determine the particle trajectory according to the equation of motion. This method regards the particle phase as a discrete phase and only the gas phase as a continuous phase. In addition to the interactions between particles and gas, the interactions between particles and particles are also considered in this approach, which uses the Lagrange equation to describe particle motion and the Euler equation for the gas component[26].The movement of smoke in space is a typical gas-solid two-phase flow movement, which conforms to the discrete phase diffusion model in the Lagrange method [18].
2.1. Mathematical model of the gas phase
During its ascent,the smoke is affected by the oncoming air(i.e.,air resistance and energy exchange) and the diffusion of the upward flow itself.The diffusion process of smoke can be regarded as an incompressible ideal gas.Therefore,the appropriate equation for describing the incompressible viscous fluid adopts the Navier-Stokes equation (N-S) combined with an energy conservation equation [27]. The turbulence state of smoke can be described by the Reynolds time-averaged Navier-Stokes equation (RANS); the standard k-ε model is therefore selected. This model has high calculation accuracy and is mainly used to calculate complex turbulent flows. It is distinct from the single equation because it combines the turbulent dissipation rate ε with the turbulent kinetic energy k. The mathematical model [28-30] involves the mass,energy, and momentum conservation equations (Eq. (1)),

and the turbulent kinetic energy dissipation rate equation(Eq.(3)),continuous flow of heat in each phase;p is the flow field pressure;μ is the viscosity coefficient of laminar flow; μis the turbulence viscosity coefficient(defined as μ=ρCk/ε,where C=0.09);σand σare the Prandtl numbers corresponding to the turbulent kinetic energy (k) and the turbulent energy dissipation rate (ε),respectively(σ=1,σ=1.3);Gis the turbulent kinetic energy due to the average velocity gradient;Gis the turbulent kinetic energy generated by buoyancy (for incompressible fluids, G= 0); Yis the fluctuation caused by excessive diffusion in compressible turbulence (for incompressible fluids, Y= 0); Sand Sare defined turbulent kinetic energy; and CC, Care empirical constants(C=1.44, C=1.92, C=1).
2.2. Mathematical model of the particle phase
The discrete phase diffusion model regards the gas phase as a continuous phase and the particle phase as a discrete phase.It also considers the particle-gas and particle-particle interactions and follows the Euler-Lagrange equation. The force equation on the particle is shown in Eq. (4) [31],
In these equations, ρ is the gas density; xis the tensor representation of the turbulence model;i is the index sign of the tensor(i=1, 2, or 3, which represent the x, y, and z directions, respectively);uis the component of the flow velocity in direction i;Sis the particle mass of continuous inflow; cis the isobaric specific heat capacity;T is the flow field temperature;Sis the sum of the
The diameter dof the smoke particles is not uniform and the particle size distribution satisfies a certain distribution function f(d); and the particle composition also has an effect on the calculation.The particle size distribution of particulate systems typically conforms to a specific distribution law, most of which are twoparameter distribution functions [33,34]. Commonly used twoparameter distribution functions include the Rosin-Rammler (RR) function, the normal function, the normal logarithmic function,and the upper limit logarithmic normal function. The specific analysis is studied in Section 3.2.
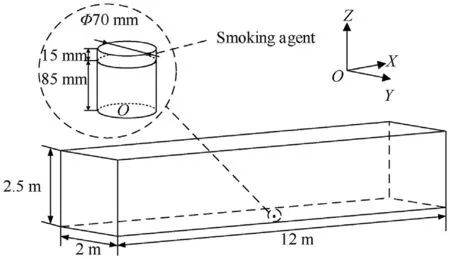
Fig.1. Physical model of the confined space smoke laboratory.
In addition,the discrete random walk(DRW)model was used to describe the random pulsating velocity in the flow field [29]. The DRW model assumes that the random pulsating speed follows a Gaussian probability density distribution. The pulsating velocity component,u,is given by Eq.(6),where ξis a random number that obeys a normal distribution.

where wand ware the normal and tangential recovery coefficients for the collisional interaction of the particle with the boundary, respectively, vand vare the normal and tangential velocity components of the particle, the subscripts 1 and 2 respectively indicate the quantities before and after the collision.A normal (tangential) recovery factor equal to 1.0 means that the particle has no momentum loss before and after the collision,i.e.,a fully elastic collision and equal to 0 means that all momentum is lost after the collision.
Based on thermal gravimetric analysis (TGA; SDTA851e), it is determined that the smoking process of the smoke agent is nonuniform, and the combustion mass loss (i.e., the mass flow rate)generally satisfies a Gaussian distribution. The mass flow rate of particles goes from slow to faster and then gradually slows down after reaching a certain peak. Therefore, the setting of mass flow rate in this paper adopts Gaussian distribution instead of the traditional uniform distribution, which makes the calculation closer to the actual value.
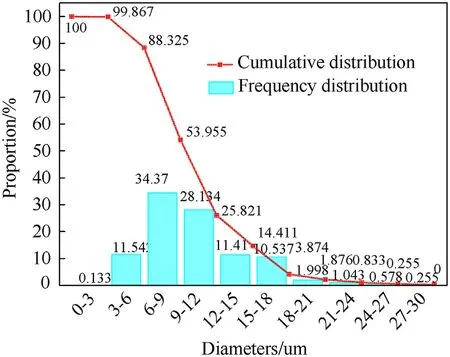
Fig. 3. Size distribution of smoke particles.
3. Numerical methods
3.1. Numerical model
As shown in Fig.1,the confined space was a cuboid with a length of 12 m,a width of 2 m,and a height of 2.5 m.The smoke agent was a cylinder with a diameter of 70 mm and a thickness of 15 mm,placed on a bracket of the same diameter.The bracket ensured that the upper surface of the smoker emit smoke normally and did not interfere with the occurrence and diffusion of smoke. The constructed confined space physical model comprised the computational domain of the numerical simulations.
The reference coordinate system O-XYZ is shown in Fig.1; the smoke agent was placed in the center of the ground in the confined space,and the bottom center of the smoke agent was located at the coordinate origin, O. Tetrahedral meshing of the geometric model was performed. To meet the requirements in terms of high mesh quality and high simulation accuracy,the convergence speed of the calculation increased as much as possible. Since the velocity and temperature gradient at the smoke agent's outlet were more significant than those in other areas,the nearby grids were encrypted.The area far from the smoke agent had relatively low requirements in terms of calculation accuracy, and the grid was gradually increased at a specific growth rate to reduce the calculation burden.The mesh model was converted to polyhedral elements and subjected to a smoothing process. In Fig. 2, the grids of the computational domain are presented.The final number of high-quality grids(154893) ensured the accuracy and convergence of the solution.
3.2. Boundary conditions
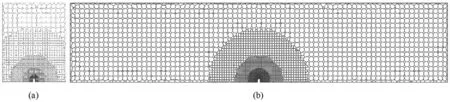
Fig. 2. Grids of the computational domain: (a) x=0 m section; (b) y=0 m section.
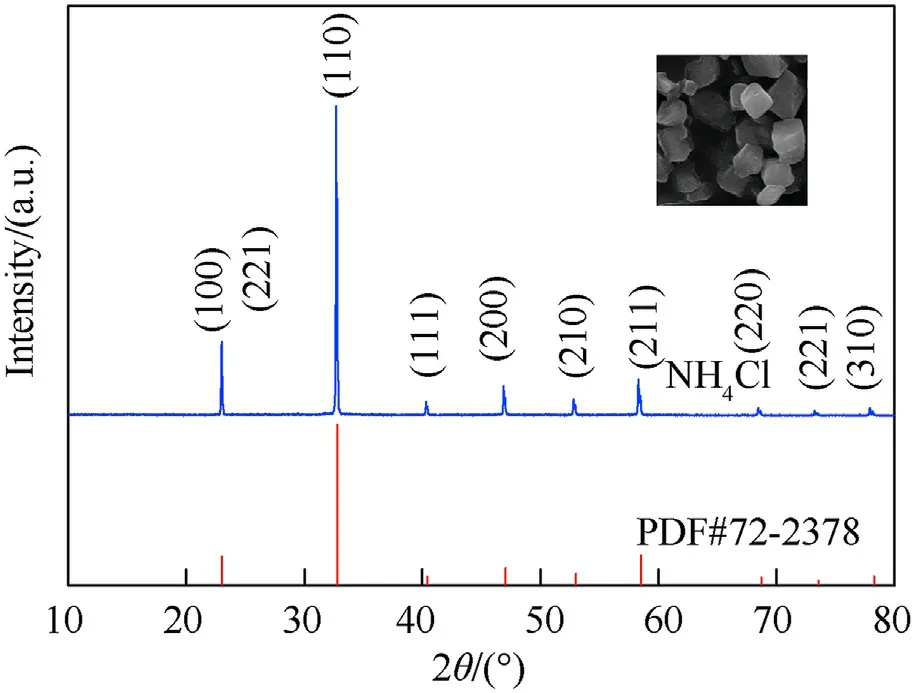
Fig. 4. Sample characterization diagram: XRD patterns and SEM image.
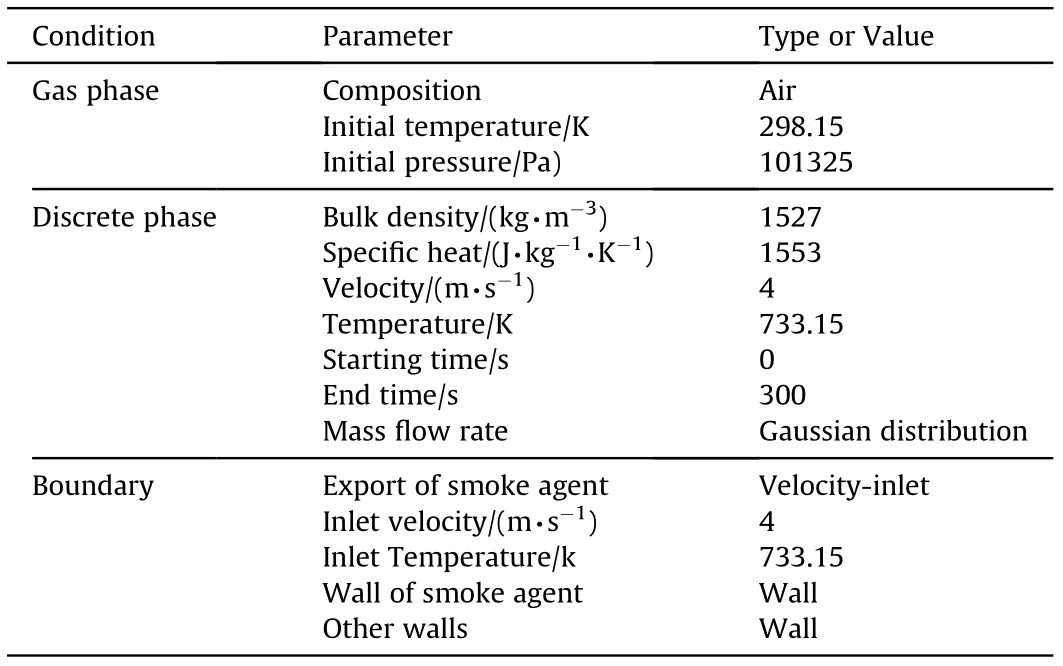
Table 1 Simulation conditions and parameters.
The smoke particles were sampled and recovered, and then, a laser particle size analyzer (HORIBA LA950) was used to test and analyze the smoke particles. The particle size distribution results are shown in Fig. 3. The smallest particle size was 2.976 μm, the largest particle size was 29.907 μm, and the average particle size was 10.723 μm.
According to the test results and Fig. 3, the particle size distribution of smoke particles should follow the R-R distribution. The differential distribution function [35,36] of this function f(d) is described by Eq. (8),
X-ray diffraction (XRD) analysis is the primary method used to study the phase and crystal structure of materials. The recovered smoke particles were observed using a Bruker D8 ADVANCE X-ray diffractometer, and the composition of the smoke particles was confirmed to be ammonium chloride(Fig.4)based on the powder diffraction cards. A scanning electron microscope (SEM; QUANTA FEG250) was used to observe the morphology of the smoke particles. In Fig. 4, the abscissa 2θ is the diffraction angle, and the ordinate is the intensity.
According to the test results, the temperature of the smoke agent while it was smoking was approximately 460C, the mass loss of ammonium chloride following the reaction was 15 g,and the smoke lasted for 5 min. Other simulation conditions and parameters are shown in Table 1. Since the smoke velocity of ammonium chloride smoke agent was obtained by high-speed photography and calculation, the discrete phase velocity was set to 4 m/s. The above mathematical model established in this paper is valid for single-component smoke screens.

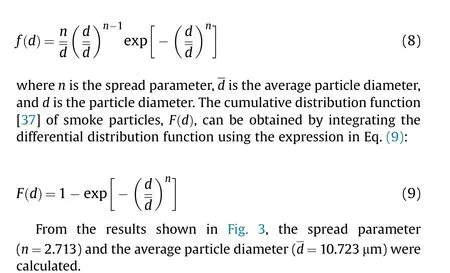
Fig. 5. Smoke concentration distribution over time (x=0 m cross-section).
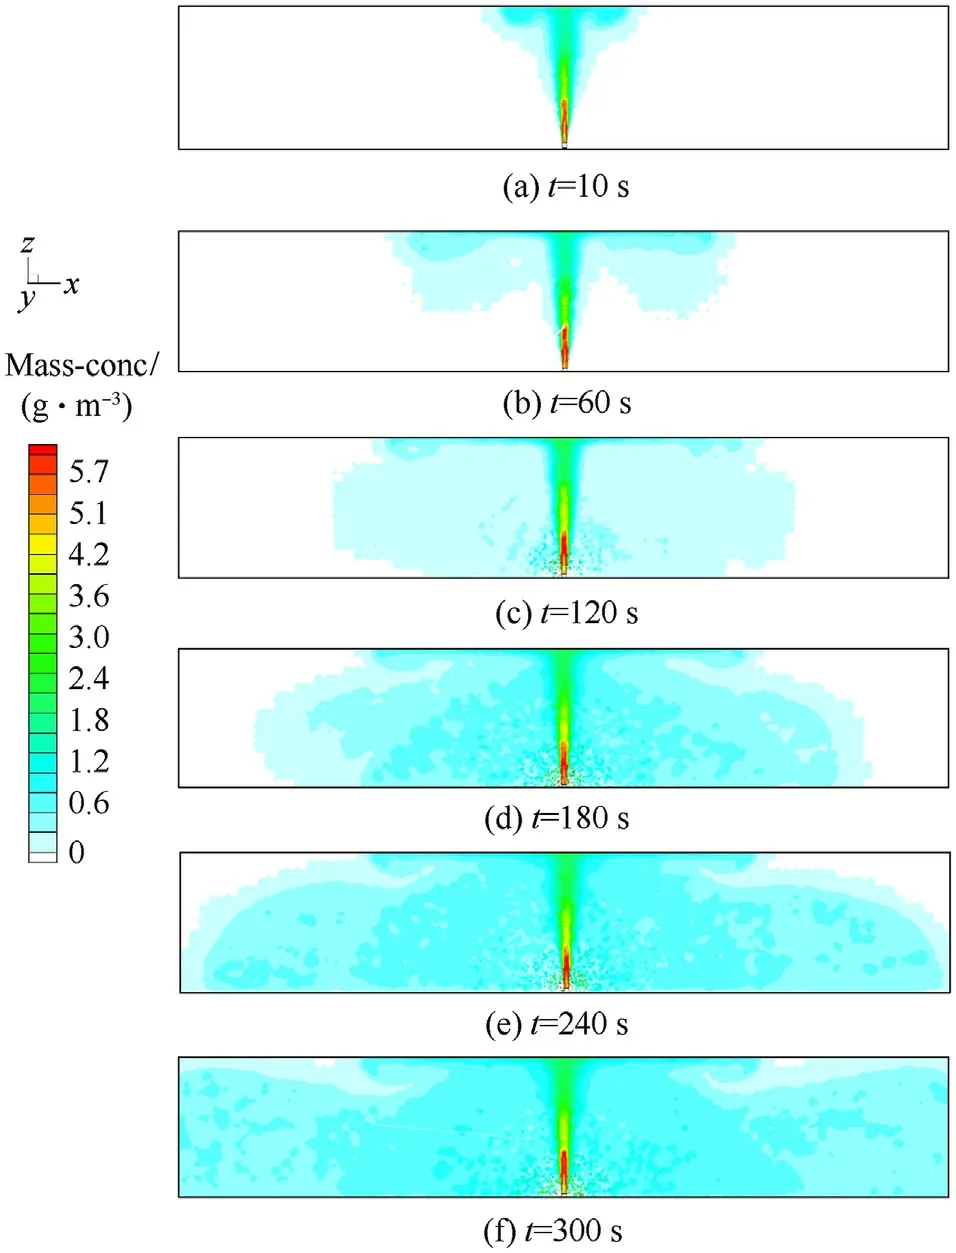
Fig. 6. Smoke mass concentration distribution over time (y=0 m cross-section).
3.3. Analysis of simulation results
3.3.1. The smoking process
The smoking process lasted for 300 s, and throughout this period, the smoke state was observed from the x=0 m crosssection and the y=0 m cross-section. The smoke mass concentration (i.e., the diffusion behavior of the smoke) distributions over time at these two cross-sections are shown in Fig. 5 and Fig. 6,respectively.Specifically,Fig.5 shows that the smoke moved along the positive direction of the z-axis in a fan shape, and the plume spread to the top surface at 5 s.The space was closed,so there was no lateral wind interference or smoke leakage. The smoke continued to generate and accumulate at the upper surface,and the plume changed from a fan shape to an umbrella shape at 10 s.The outlet of the smoke agent had the highest concentration(5.7-6.0 g/m), and the concentration decreased as the height increased.Additionally, the smoke sedimentation mainly occurred on both sides of the smoke agent's outlet. As the smoke moved away from the outlet, it began to sink gradually due to gravity. Some smoke particles exchanged momentum with newly generated smoke particles during the sedimentation process, which changed their direction of movement.In the latter half of the smoking process,the smoke had filled the entire cross-section of the space and the thickness of smoke is 12 m.The state of smoke at the smoke agent outlet was more complicated because it including the rising motion of newly generated smoke and the secondary rising motion of previously generated smoke.
The process of smoke filling the entire space is clearly shown in Fig. 6. The same plume changed from a fan shape to an umbrella shape,and then slowly spread to both sides of the x-axis.The mass concentration of the entire space decreased from the middle outward, and the smoke mass concentration distribution in the positive half axis of the x-axis was almost symmetrical with that in the opposing half axis. Overall, the mass concentrations at other locations were the same, except just above the outlet of the smoke agent.
The temperature field and velocity field distributions of the smoke agent smoking process are shown in Fig. 7 and Fig. 8,respectively. Because the space was closed, the temperature and velocity of the whole smoking process remained stable. The secondary or even later rising effects of a small amount of smoke caused the velocity field distribution in the latter half of the smoking process to vary.However,its influence could be ignored by analyzing the concentration distribution presented in Figs.5 and 6.
3.3.2. The smoke diffusion process
At the end of the smoke generation(i.e.,after 300 s), one plane was monitored along the x-axis at 1-m intervals to observe the smoke mass concentration distribution (diagram in Fig. 9),comprising a total of 13 observation surfaces. The smoke mass concentration distributions on the positive and negative semi-axes of the x-axis were similar, and the further from the x=0 m crosssection, the lower the mass concentration. The concentrations at other positions were very close, except at x=0.
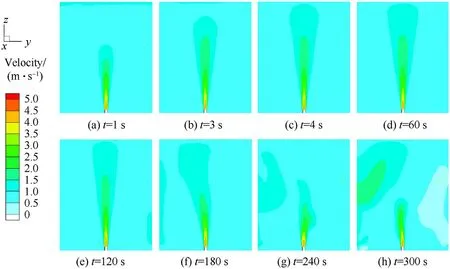
Fig. 7. Smoke velocity distribution over time (x=0 m cross-section).
Fig. 8. Smoke temperature distribution over time (x=0 m cross-section).
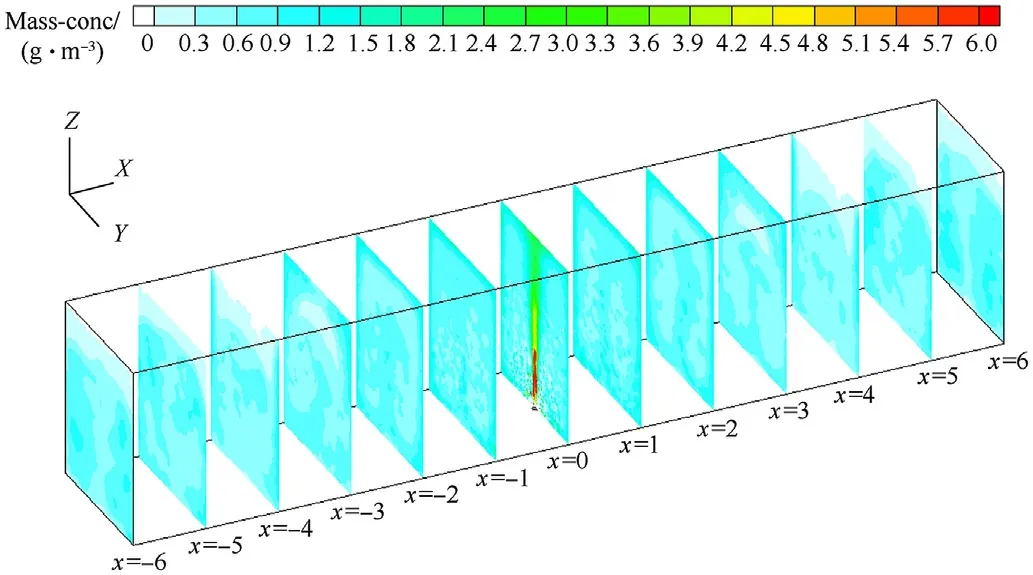
Fig. 9. Smoke mass concentration distribution along the x-axis.
The free diffusion process of smoke in the laboratory is shown in Fig.10, which describes the distribution of mass concentration at times t=500, 1500, 2500, 3000, and 3500 s. The smoke mass concentration in the space decreased over time, and it was relatively uniform at heights greater than 0.8 m. The original position where the smoke agent outlet was located had a higher mass concentration than the surrounding positions.The thickness of the smoke is continuously maintained at 12 m.
4. Experimental validation
4.1. Smoke environment laboratory
To create a relatively stable smoke environment, a smoke environment laboratory with three functional zones (i.e., control room, test room, and settling room (Fig. 11)) was designed and constructed to verify the simulation model established in this research.
Actually,smoke screen usually contains a variety of components,such as NH4Cl and ZnO. Considering that most smoke bombs and smoke pots are dangerous and toxic to humans and the environment, they do not meet standard laboratory safety regulations;Compared with other smoke components such as zinc oxide,there are more research about ammonium chloride. And NHCl smoke agent is safety and commonly used,so it is suitable for research in a closed laboratory environment. Therefore, in this study, a specific type of environmentally friendly and non-toxic white smoke agent(NHCl smoke agent) was used. In future work, the transmission characteristics of lasers in this smoke environment and the parameter mapping relationship between this smoke and other types of smoke will be studied. Additionally, the transmission characteristics of lasers in other smoke environments will be analyzed.
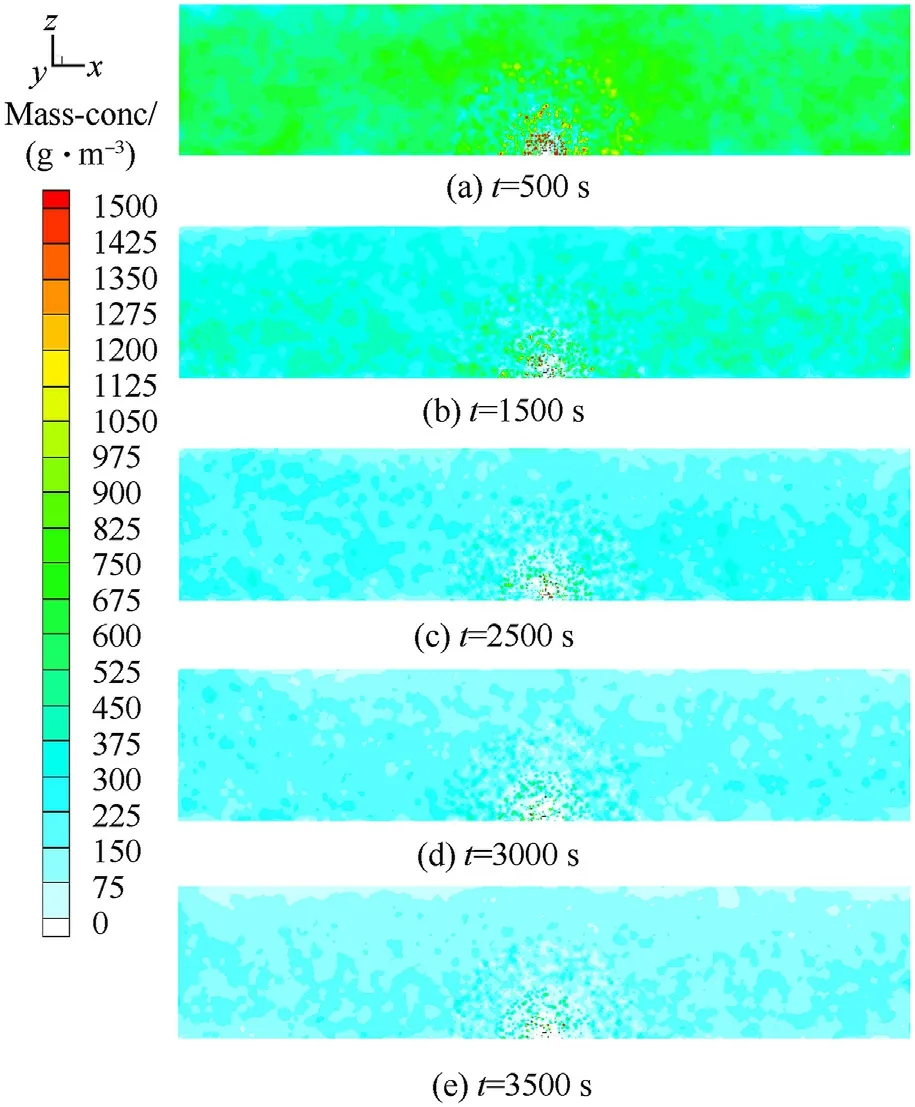
Fig.10. Smoke mass concentration distribution over time (y=0 m cross-section).
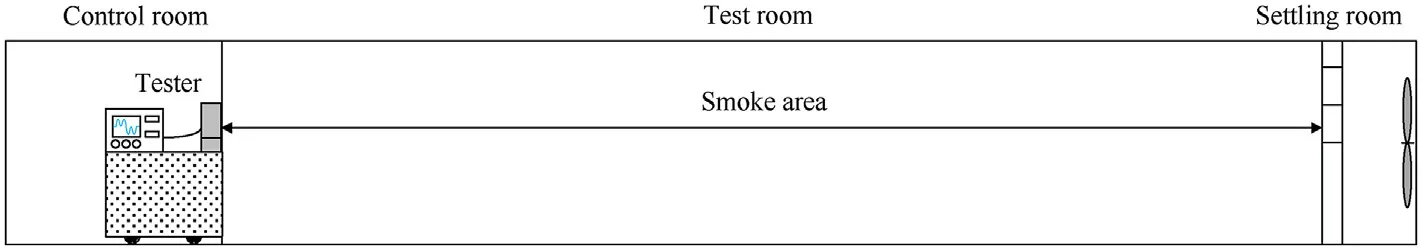
Fig.11. Layout of the smoke environment laboratory.
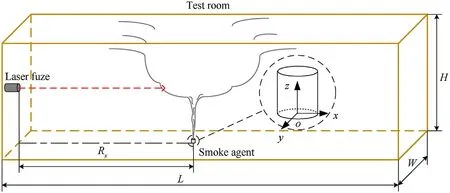
Fig.12. Schematic diagram of the smoke environment laboratory.
The required smoke environment was created by igniting a specific dose(that could be adjusted manually)of the NHCl smoke agent in the test room. Then, equipment control, experimental phenomenon observations, and recording processes were carried out in the control room.Finally,by turning on an exhaust fan in the settling room, the air in the laboratory was purified after the experiment. In addition,we could adjust the length(i.e.,thickness of smoke)of the test chamber as needed.The test room was a long and narrow space with a length of L=12 m, a width of W=2 m, a height of H=2.5 m, and R=6 m (Fig.12).
4.2. Experimental setup and procedure
The environmental mass concentration of smoke in the laboratory was measured with a real-time dust monitor (CEL-712 Microdust Pro, CASELLA) over the measurement range from 0.001 to 250 g/m. In addition, there were three fixed-concentration measuring (FCM) instruments, labelled FCM1, FCM2, and FCM3(MODEL 2030), which monitored the changes in mass concentration along the y-axis.The four devices were arranged based on the light scattering method to measure the smoke concentration(CEL-712 is more widely recognized in the industry). To reduce the relative measurement error between the devices, all of the FCMs were calibrated based on CEL-712 to achieve a unified standard in the same smoke environment before beginning the experiment.
Under identical experimental environments (i.e., same humidity, same temperature, no wind), the mass concentration of the smoke environment was measured four times,and the duration of the smoke release process in each measurement was approximately 5 min. For convenience, these four measurements were known as Smoke1,Smoke2,Smoke3,and Smoke4.In the first three measurements (i.e., Smoke1, Smoke2, and Smoke3), the CEL-712 moved steadily along the light path (x-axis) at a speed of 8 cm/s for 5 min(to minimize changes in the smoke concentration caused by movement) and the mass concentrations were recorded at specific moments. Simultaneously, the FCMs continuously measured the mass concentrations at particular locations(x=1,1.5,and 2 m, which were selected considering the dust environment tests to be carried out in future laboratory experiments) after the smoke environment was relatively stable, as shown in Fig. 13. In these measurements,the CEL-712 recorded data every second,and the FCMs recorded every 3 s.
4.3. Results of mass concentration measurements
The raw data from the mass concentration measurements are shown in Fig. 14, which indicates that the changes in the mass concentration of the smoke agent during the smoking process were complicated.However,the overall trend was that the concentration increased over time, reaching its highest value near 300 s (at the end of smoking)and maintaining it for a short period of time.After about 800 s, the smoke environment was stable, and the concentration decreased steadily with the deposition, diffusion, and adsorption of smoke.Fig.14a shows that although the CEL-172 was moved at a slower rate, it was impossible to avoid fluctuations in the smoke concentration caused by relative movement. However,due to the fixed positions of the FCMs, the fluctuations of their concentrations were relatively small (Fig. 14b-d). Because the laboratory space was closed and the temperature, humidity, and smoke agent dosage could be adjusted and controlled manually, a consistent smoke experimental environment could be obtained,although the two-phase flow of smoke particles was complex and uncertain.
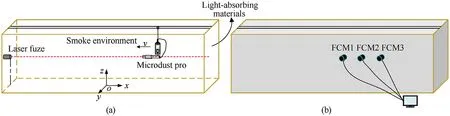
Fig.13. Experimental setup of mass concentration measurements (a) inside and (b) outside the laboratory.
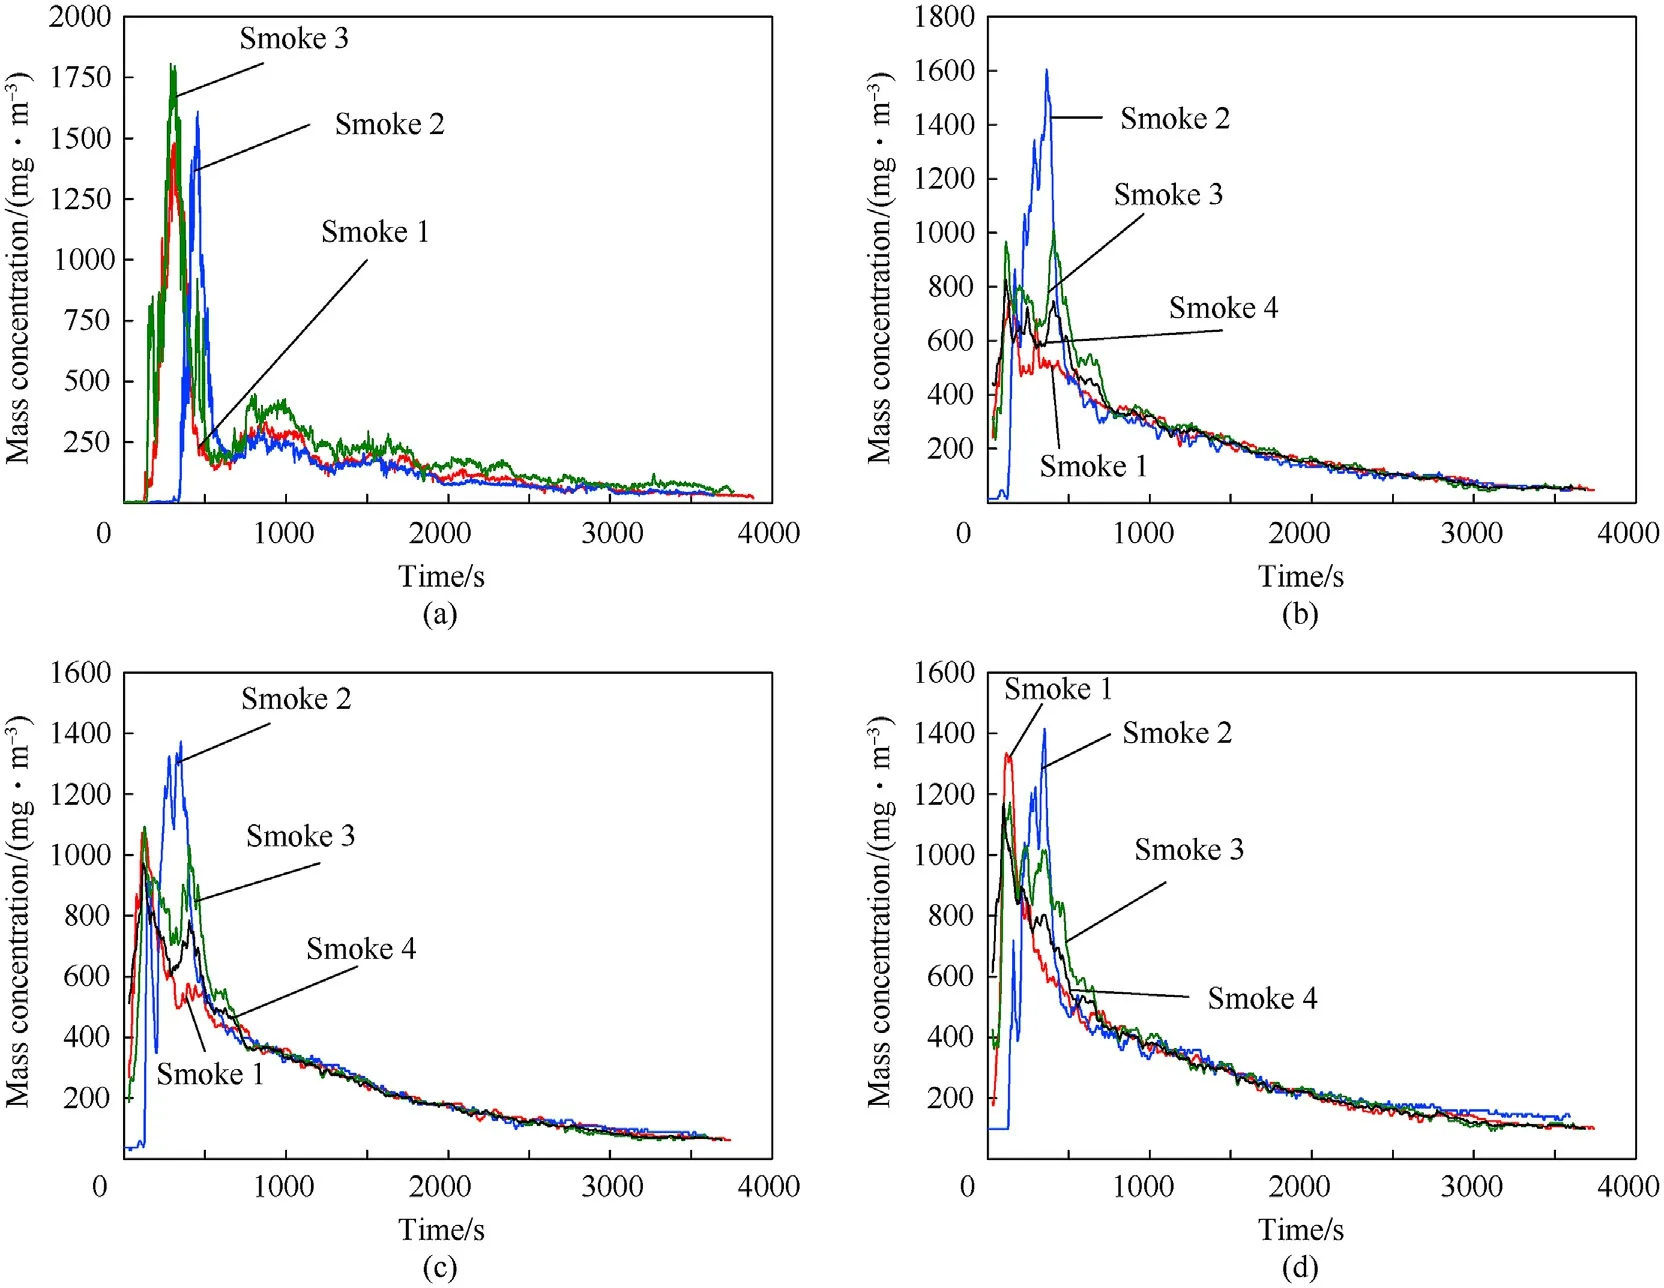
Fig.14. Mass concentration data measured by (a) CEL-172 along the xL-axis, (b) FCM1, (c) FCM2, and (d) FCM3.
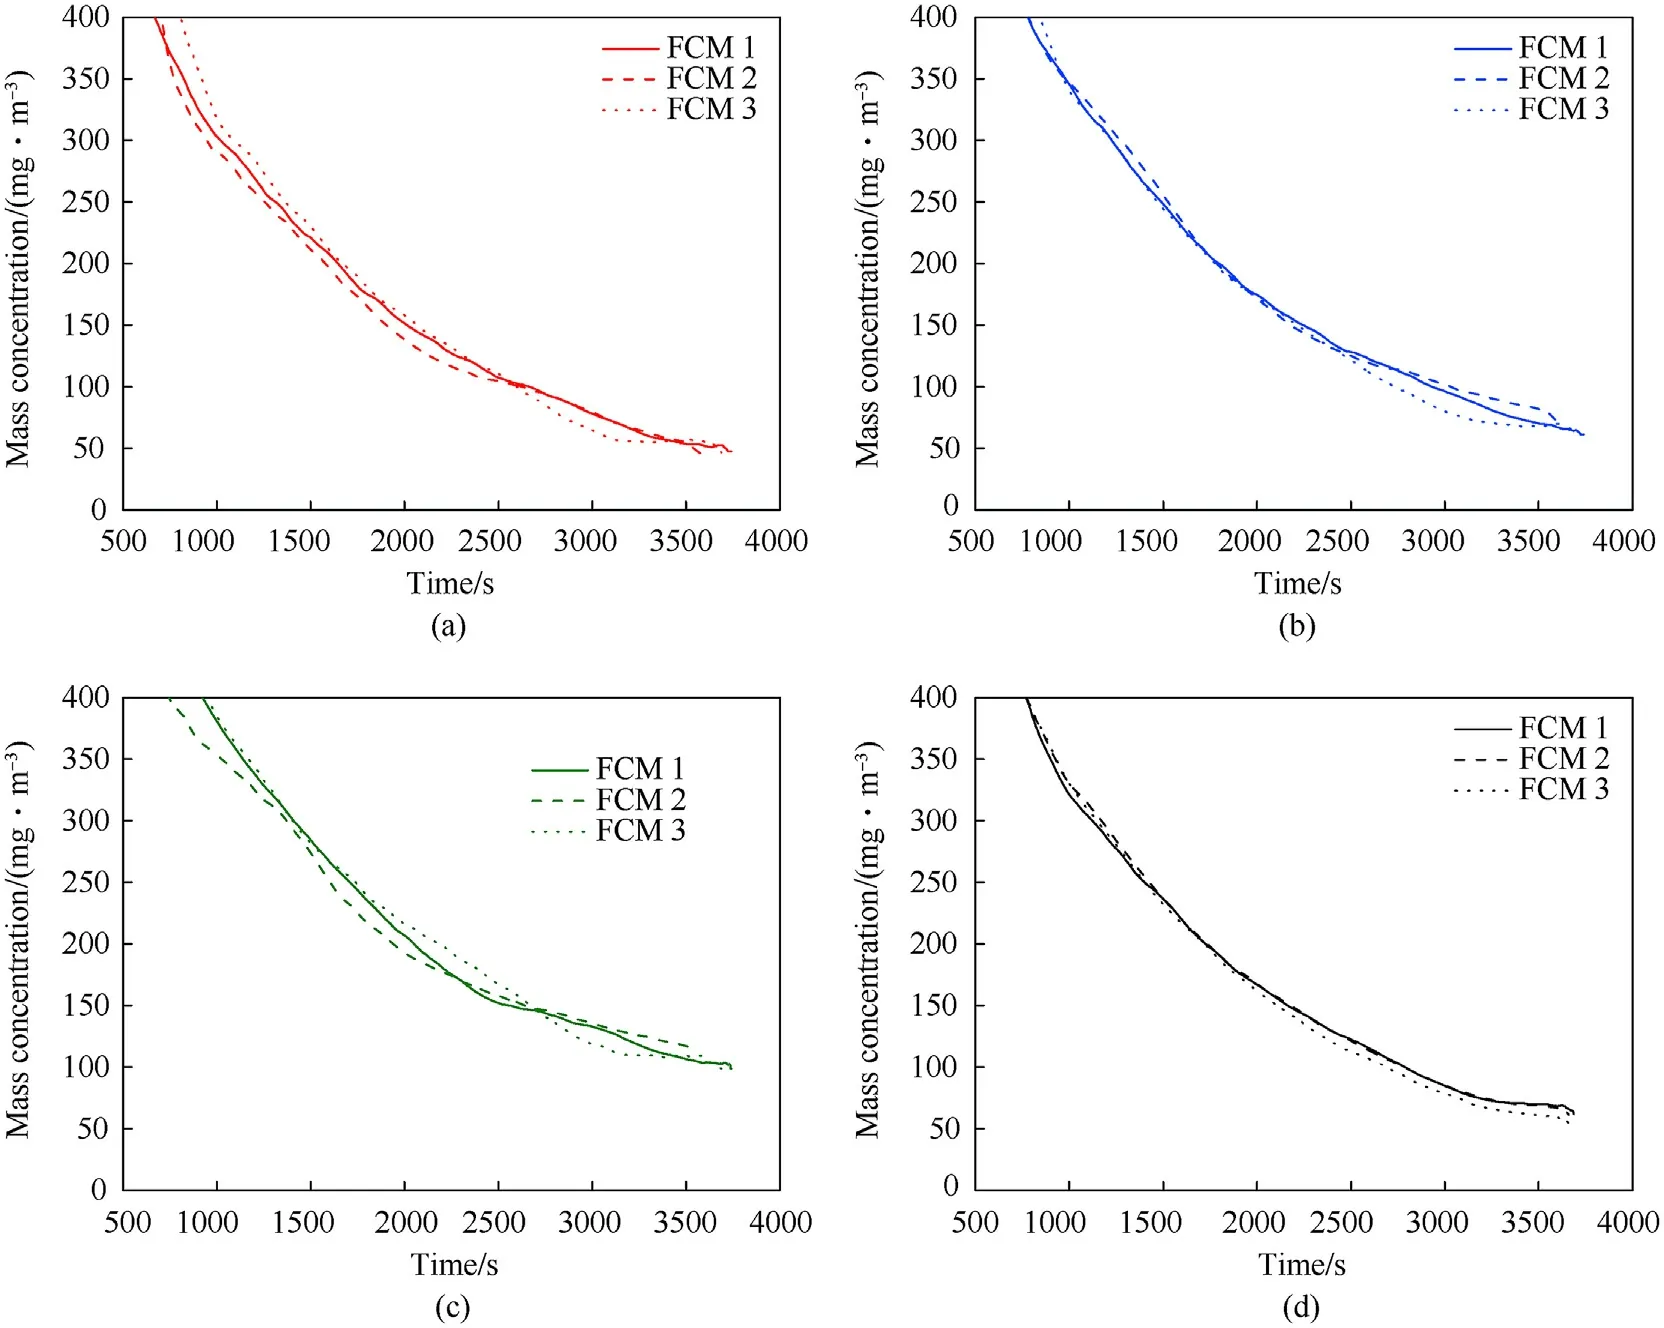
Fig.15. Mass concentration measurement data in (a) Smoke1, (b) Smoke2, (c) Smoke3, and (d) Smoke4.
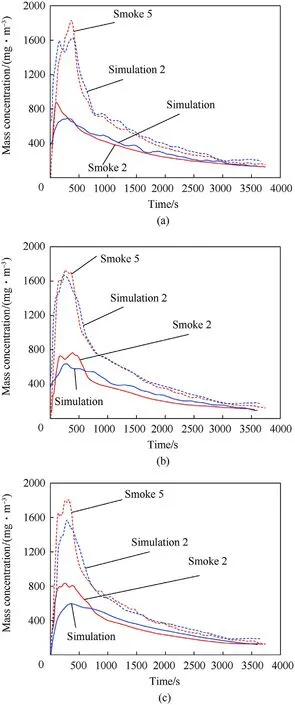
Fig.16. Mass concentration data at position (a)x=1 m, (b) x=1.5 m, and (c) x=2 m.
The variations in environmental smoke concentration measured by the three FCMs (representing three specific locations) in four experiments are shown in Fig.15. It was clear that the mass concentrations at the three FCMs were very similar, and they all exhibited a similar downward trend. In addition, the attenuation over a short time period was ignored.
Data from two simulations and experiments are presented in Fig.16. The Smoke5 experimental data were obtained by doubling the smoke agent dose, and the simulation (Simulation2) was completed using the model established in the article. The concentration data from the original simulation and Simulation2 were extracted(see Section 3.3)at the same locations as the three FCMs.The test data from the FCM1 device and the simulation data collected from the same location are shown in Fig.16a. The rising trend of the simulated and experimental concentrations during the smoking process were very similar, and the maximum concentration obtained in the experiments were generally greater than those determined in the simulation.Since FCM1 was closer to the smoke source than the other two FCMs, the diffusion effect of the smoke was more obvious at FCM1.Once its concentration reached its peak,that concentration was maintained for a shorter time than at the other two locations. In the smoke diffusion stage (i.e., during the steady decline of smoke concentration),the simulation results were consistent with the experimental results. In addition, the concentration of smoke during the smoking stage increased significantly by increasing the dose of smoke agent.However,the particles’own gravity caused the concentration during the first half of the diffusion stage(300-800 s)to decrease faster than in the second half of this phase. In contrast to the significant difference in peak concentrations during the smoking process, the smoke concentration following a double-dose of the smoke agent was only slightly higher than that of the single-dose of smoke agent at the same time(after 2500 s). The experiment paid more attention to the smooth diffusion process,relative to the smoke phase.During the diffusion process(800-3600 s),the average relative errors of the experiment and simulation at the three fixed positions were all less than 10%(9.85%,6.35%,and 7.67%,respectively).Fig.16b-c describe the same situation as Fig. 16a, showing the consistency between the three detection devices in the same experimental environment, thus verifying the stability of the smoke environment.
Therefore, it was considered that the calculation results of the simulation model established in this report and the experimental results were consistent,thus confirming that the simulation model was correct and feasible. The cost of simulation calculations is much lower than the cost of experiments, and the temporal and spatial changes in the smoke concentration in the entire space can be observed more intuitively through simulation. Therefore, we propose that future experimental processes should be conducted as follows: first, the temporal and spatial distribution of smoke and dust concentrations should be analyzed through simulation calculations. Then, the experimental conditions (temperature, humidity,smoker dose,etc.)should be set according to the simulation parameters. Finally, the ammonium chloride smoke agent can be ignited to generate an actual smoke environment and carry out experimental research and analysis.In general,it was beneficial to use the y=0 section as the optical path plane in these experiments and to select a stable and uniform smoke environment at the appropriate time for the laser fuze experiments (Fig.17).
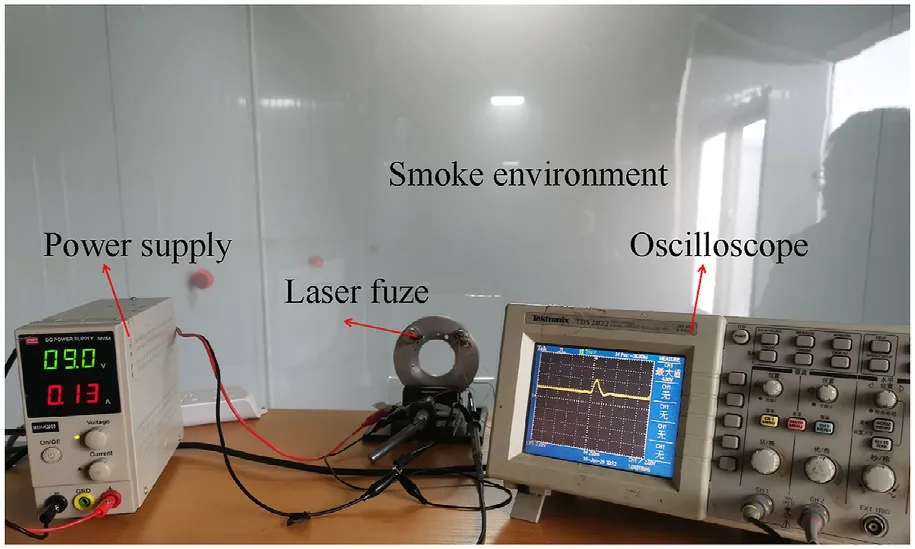
Fig.17. Experimental scene of laser fuzes.
5. Conclusions
This report detailed a numerical simulation study on the gassolid two-phase flow of smoke in a confined space based on a CFD discrete phase model. A method was proposed for creating a smoke environment using a smoke agent. This approach enabled detailed investigations of the temporal and spatial distribution of the smoke's mass concentration, velocity, and temperature during the smoking process and the diffusion stage. Following experimental verification of the smoke environment laboratory,the main conclusions are as follows:
(1) The key factors that interfere with laser detection include smoke concentration, composition, particle size, and thickness.Smoke particle collection and X-ray diffraction analysis were used to verify that the smoke particles were mainly composed of ammonium chloride.The distribution function of smoke particle size was obtained,and the thickness of the smoke environment created in this work was 12 m, which could be expanded to 18 m in the future.
(2) This work enabled clear observations of the smoke's temporal and spatial characteristics in the laboratory space.The shape of the plume changed from a fan shape to an umbrella shape and then spread around.The concentration,speed,and temperature at the smoker outlet were the highest,reaching 5.7-6 g/m, 4.0-4.5 m/s, and 657-700 K, respectively, and they all decreased as the height of the plume rose.There was almost no change in temperature or speed during the entire smoking process, so the smoking state was considered relatively stable.
(3) The simulation law was verified through multiple experiments, which confirmed that the smoke environment laboratory could generate a consistent smoky environment.After the smoke diffusion stabilized (after ~900 s), the mass concentration was very similar, and the downward trend was nearly consistent at positions higher than 0.8 m. It was also determined that the attenuation in a very short time could be ignored.
The results presented herein are of great military engineering significance, in particular, the analysis of the temporal and spatial distribution of mass smoke concentration in a confined space,creation of a stable and uniform smoke environment in a smoke laboratory, and detailed investigations of the functional characteristics of laser fuzes in such smoke environments. These aspects also represent future research directions ongoing in our laboratory.
The authors declare that they have no known competing financial interests or personal relationships that could have appeared to influence the work reported in this paper.
Acknowledgements
This work is supported by the Central University Special Funding for Basic Scientific Research (Grant No. 30918012201), the Foundation of JWKJW Field (Grant 2020-JCJQ-JJ-392), and the Postgraduate Research & Practice Innovation Program of Jiangsu Province (Grant No.KYCX20_0315).

- Defence Technology的其它文章
- A new model for the expansion tube considering the stress coupling:Theory, experiments and simulations
- Experimental and analytical assessment of the hypervelocity impact damage of GLAss fiber REinforced aluminum
- Effect of the microporous structure of ammonium perchlorate on thermal behaviour and combustion characteristics
- Modeling of bistatic scattering from an underwater non-penetrable target using a Kirchhoff approximation method
- 3,6-bis (2,2,2-trinitroethylnitramino)-1,2,4,5-tetrazine. Structure and energy abilities as a component of solid composite propellants
- Rapid preparation of size-tunable nano-TATB by microfluidics