
Measurement and analysis of species distribution in laser-induced ablation plasma of an aluminum–magnesium alloy
2022-04-15 05:13:12JunxiaoWANG王俊霄ShuqingWANG王樹青LeiZHANG張雷MaogenSU蘇茂根DuixiongSUN孫對兄QiMIN敏琦WeiguangMA馬維光WangbaoYIN尹王保andSuotangJIA賈鎖堂
Plasma Science and Technology 2022年3期
關(guān)鍵詞:張雷
Junxiao WANG(王俊霄),Shuqing WANG(王樹青),Lei ZHANG(張雷),*,Maogen SU(蘇茂根),Duixiong SUN(孫對兄),Qi MIN(敏琦),Weiguang MA(馬維光), Wangbao YIN (尹王保),* and Suotang JIA (賈鎖堂)
1 State Key Laboratory of Quantum Optics and Quantum Optics Devices, Institute of Laser Spectroscopy,Shanxi University, Taiyuan 030006, People’s Republic of China
2 Collaborative Innovation Center of Extreme Optics, Shanxi University, Taiyuan 030006, People’s Republic of China
3 National Energy R&D Center of Petroleum Refining Technology (RIPP, SINOPEC), Beijing 100728,People’s Republic of China
4 Key Laboratory of Atomic and Molecular Physics & Functional Material of Gansu Province, College of Physics and Electronic Engineering,Northwest Normal University,Lanzhou 730070,People’s Republic of China
Abstract We proposed a theoretical spatio-temporal imaging method, which was based on the thermal model of laser ablation and the two-dimensional axisymmetric multi-species hydrodynamics model.By using the intensity formula,the integral intensity of spectral lines could be calculated and the corresponding images of intensity distribution could be drawn.Through further image processing such as normalization, determination of minimum intensity, combination and color filtering,a relatively clear species distribution image in the plasma could be obtained.Using the above method, we simulated the plasma ablated from Al–Mg alloy by different laser energies under 1 atm argon,and obtained the theoretical spatio-temporal distributions of Mg I,Mg II,Al I,Al II and Ar I species,which are almost consistent with the experimental results by differential imaging.Compared with the experimental decay time constants,the consistency is higher at low laser energy,indicating that our theoretical model is more suitable for the plasma dominated by laser-supported combustion wave.
Keywords: laser-induced plasma, theoretical imaging, species distribution
1.Introduction
With the development of laser technology, the interaction between laser and matter [1, 2], including absorption and reflection of laser energy by target, formation and expansion of plasma, plasma shielding especially prevalent for nanosecond plasma and shock wave effect in the presence of background gas, has become a research hotspot, and gradually formed the research direction and application technology of pulsed laser ablation, such as laser-induced breakdown spectroscopy [3–6]and pulsed laser deposition[7–9].The plasma produced by laser ablation is transient and inhomogeneous, which can directly affect the accuracy of quantitative analysis and the quality of deposited films.Therefore, it is particularly important to study the spatio-temporal evolution of plasma.The commonly used methods are spectroscopy and transient imaging.The former can obtain the radial and axial integral intensity of plasma at different time, while the latter can obtain the size, shape and species distribution of plasma.Due to the intuitiveness of transient imaging, it has been widely used to study the expansion and evolution of multi-element plasmas in different gases.
In early works[10–12],the imaging method was used to capture whole plasma image for analysis, but this is spectral indiscernible.In recent decades, some spectroscopic imaging methods, such as acousto-optic tunable filter, liquid crystal tunable filter, Fourier transform visible spectroscopy, narrow band filter and dual-wavelength differential imaging, have been used in the study of species distribution of plasma.The first two methods implement wavelength selective imaging by placing an acousto-optic tunable filter or liquid crystal tunable filter in front of ICCD.For example, R A Multari et al used acousto-optic tunable filter to analyze the variation of species distribution of plasma ablated from metal samples with lensto-sample distance and laser incidence angle[13].D N Stratis et al investigated the distribution of lead atoms in plasma using liquid crystal tunable filter [14].Although the spectral resolution of liquid crystal tunable filter is better than that of acousto-optic tunable filter, there is still a large light loss in the medium, which reduces the imaging sensitivity.Fourier transform visible spectroscopy is to obtain the full spectrum by measuring the interference graph and taking Fourier transform, so as to draw the plasma image at a certain wavelength.For example,V Bulatov et al used it to study the distribution of Cu and Zn species in laser-induced brass plasma,and found that Zn species were mainly distributed in the outer layer and Cu species were in the inner layer, and inferred that this distribution structure depends on the melting points of elements [15].But this method is too complicated and limited to visible wavelengths.Narrow band filter can be used to realize the imaging of plasma species distribution by selecting the filter whose central wavelength corresponds to the characteristic emission line of species.For example, R A Al-Wazzan et al used it to compare the distribution of Ba II in plasmas ablated from YBa2Cu3O7target in vacuum and 180 mTorr oxygen after a long delay [16].K F Al-Shboul et al used it to obtain a two-dimensional image of C2in plasmas generated from carbon target under vacuum and helium with different pressures, and the relationship between ambient pressure and emission intensity was obtained [17].More recently,D M Surmick et al studied the shockwave effects of laser ablation of aluminum in air through the distribution of aluminum monoxide [18].C G Parigger et al obtained the distribution of cyanide in a gas mixture of N2and CO2and the spatio-temporal evolution of plasma parameters [19].However, this method is only suitable for imaging at the end of plasma evolution.On this basis, the dual-wavelength differential imaging can remove the continuous background radiation of the early plasma by adding a filter whose central wavelength is close to the species emission line, so as to obtain the species distribution image of the initial plasma.For example,J Yu et al recently used it to study the distribution of aluminum species in plasma, and also analyzed the influence of experimental parameters on species distribution, including laser wavelength, irradiance, pulse duration and ambient gas type [20–22].We also used it to investigate the relationship between the species distribution in plasma ablated from binary alloy and laser irradiance, chemical composition and miscibility [23].Although the dual-wavelength differential imaging has high image quality, it is difficult to carry out extensive research in experiments due to some factors.One of the most important is that the selection of filter is very difficult,because in the 5–20 nm bandwidth of the filter,there are almost interference lines, which easily leads to image distortion.It can be seen that the traditional plasma imaging methods are generally cumbersome, time-consuming and have less measurable elements, so new imaging methods are urgently needed to obtain the transient spatio-temporal species distribution images of all elements in the plasma more quickly and conveniently.
In this work,based on the thermal model of laser ablation and the two-dimensional axisymmetric multi-species hydrodynamics model,combined with a series of image processing algorithms of species distribution, a new theoretical spatiotemporal imaging method is proposed and verified by the dual-wavelength differential images.
2.Theoretical spatio-temporal imaging method
The proposed theoretical spatio-temporal imaging is mainly based on the thermal model of laser ablation and the twodimensional axisymmetric multi-species hydrodynamics model.Firstly, the plasma parameters are calculated, and the emission intensity of each species in the plasma is obtained according to the intensity expression under local thermal equilibrium.Then, a series of image processing is performed on the intensity distribution images, and finally the transient species distribution image of plasma is obtained.The specific process is as follows.
2.1.Calculation of temperature distribution of target
For the near-infrared laser (1064 nm), the critical electron density nccalculated by the formulais 9.86×1020cm-3.In the above formula, e is the eelectron charge, meis the electron mass, and ω is the angular frequency of the laser.When the laser irradiates the target, the target absorbs the laser energy and the temperature rises.After breakdown, the electron density soon reaches higher than the critical value at the surface and prevents laser penetration by reflection.Under the action of the nanosecond laser pulse, the spot radius (mm) of the laser beam is much larger than the heat diffusion distance, so the temperature distribution of the target can be solved by the one-dimensional heat conduction model [24]:
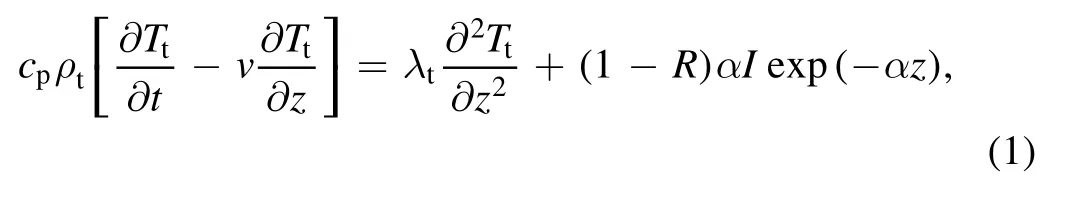
where cp, ρt, λt, R, α are the properties of the target, corresponding to specific heat, mass density, thermal conductivity,reflectivity and absorption coefficient,and Tt,v are respectively the temperature and evaporation rate of target,and I is the laser power density reaching the target surface, and z is the coordinate along the inward normal to the target surface.For an aluminum–magnesium alloy, the values corresponding to the parameters of the target are given in table 1.

Table 1.Properties of aluminum–magnesium alloy.
2.2.Calculation of plasma parameters
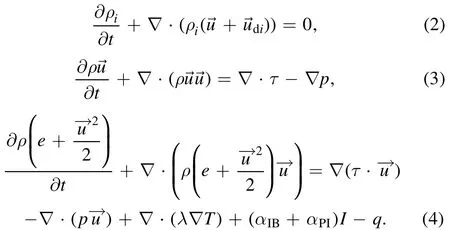
Plasma parameters include species number density, plasma temperature and so on.The expansion of laser ablated plasma is usually described by the multi-species hydrodynamics model, including the conservation equations of mass,momentum and energy [25–28]:
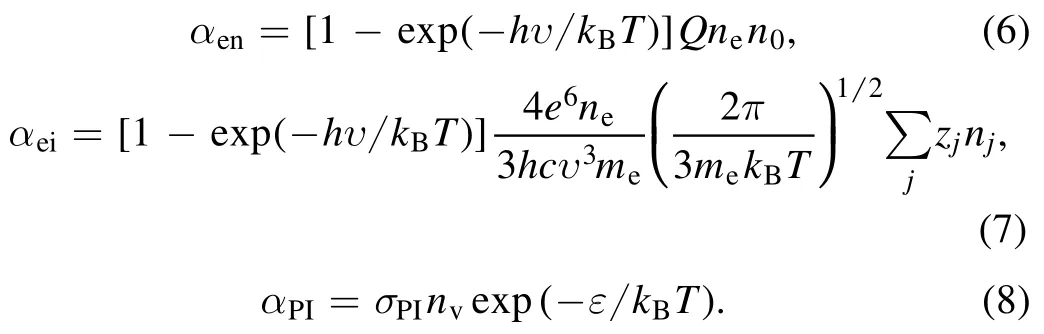
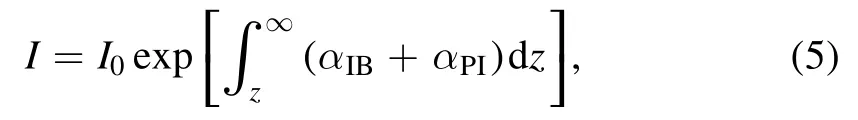
Here,ne,n0,nj,nvare, respectively, the electron density,atom number density, ion number density and vapor number density, Q is the cross section of photo absorption by an electron (10-36cm5) [32],zjis the charge number, ε is the lowest excitation energy of photoionization, υ is the laser frequency, and c, kB, h are respectively the speed of light,Boltzmann constant and Planck constant.σPI=7.9×is the cross section area [33], and EIis the ionization potential of excited state,which is considered to be equal to the photon energy of laser, and IHis the ionization potential of hydrogen.
The above conservation equations also need to be combined with the expressions of local pressure and internal energy density of ideal gas:

where Miis the molar mass of specie i, IPjstands for the ionization potential, and R is the universal gas constant.
As for the boundary conditions near the target surface, it is necessary to combine the target temperature obtained by the thermal model,and then use the jump conditions[34].This is because a thin vapor layer, namely the Knudsen layer, is formed above the target and translational equilibrium is achieved by collisions within several mean free paths in this region.Under the condition of local thermal equilibrium, the species number density can be obtained by using the Saha equations.
2.3.Calculation of line intensity of species
For the plasma in local thermal equilibrium,the line intensity of species (u–l transition) can be expressed as:
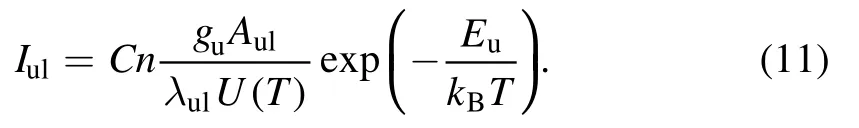
Here, C is a constant, U is the partition function, n is the species number density,g,E are the degeneracy and energy of the upper energy level,A is the transition probability,and λ is the wavelength.In this way, by substituting the species number density and plasma temperature calculated by the hydrodynamics model, the line intensity of each species can be obtained.
2.4.Image processing
Because the main distribution positions of different species in plasma are different, it is necessary to study the intensity distribution of different species on the symmetry axis to show the order of species layers.Taking three kinds of species as an example, the line intensity distribution of species along the axial direction at the center of plasma is given, as shown in figure 1(a), in which the color represents the species.Since the intensity values of different species are different, in order to describe the process more directly, the intensity is normalized first.After normalizing the line intensity of species(figure 1(b)), it can be seen that the image discrimination is poor due to the small spacing of the maximum intensity distribution and serious overlaps between different species.In order to improve the resolution,the image needs to be further processed.First,the intersection points of two adjacent curves need to be found in turn,just as the circle dots marked in the figure, and then the curves are drawn with the ordinate value of the lowest point as the limit of line intensity, as shown in figure 1(c).After a series of processing, it is obvious that the overlap can be almost ignored.For each species, a twodimensional intensity distribution image is drawn in the calculation region with all intensity values greater than the selected minimum intensity.Finally, the high-resolution species distribution image of plasma can be obtained by combining the intensity distribution images of various species at corresponding positions and color filtering.
3.Experiment
In the experiment, we used the dual-wavelength differential imaging to verify the validity of the proposed theoretical spatio-temporal imaging method.An aluminum–magnesium alloy with mass ratio of 49:1 was selected as the target,and its properties are shown in table 1.Since the mass fraction of magnesium is very small,we used the parameters of the main component aluminum instead of those of the alloy.The experimental apparatus is shown in figure 2.The pulsed laser emitted from a Nd:YAG laser (Spectra Physics, INDIHG-20S, 1064 nm, 7 ns, 20 Hz) is divided into two beams by a polarization beam splitter (PBS), one of which is focused on the target surface through a lens with a focal length of 50 mm and a focal spot radius of about 0.2 mm,and the other is used to monitor the pulsed laser energy.Here,the split ratio of the combination of PBS and half-wave plate was fixed at 1:10.Two tubes continuously blow argon to both sides of the plasma so that it is always surrounded by argon.Experiments were carried out with laser energy of 5 mJ (close to the breakdown threshold of the alloy)and 50 mJ respectively,and the plasma images were collected by an ICCD camera(Andor, iStar DH334T-18U-03).The delay time of ICCD camera was set to 100, 150 and 250 ns respectively, and the exposure gate time was 5 ns.In order to study the imaging characteristics of different species, we selected some characteristic lines of species without mutual interference.Firstly,a filter with a central transmission wavelength corresponding to the characteristic line was used, and then a filter with an adjacent central transmission wavelength was used to remove the continuous background radiation.Finally, the emissivity images of species were obtained by Abel inversion.The Abel inversion is a discrete method based on the Fourier–Hankel algorithm [35], which can transform the integral intensity images of species obtained by ICCD camera along the direction of photography into the species distribution images.The selected spectral lines are listed in table 2, and the corresponding spectral parameters are from the NIST database.
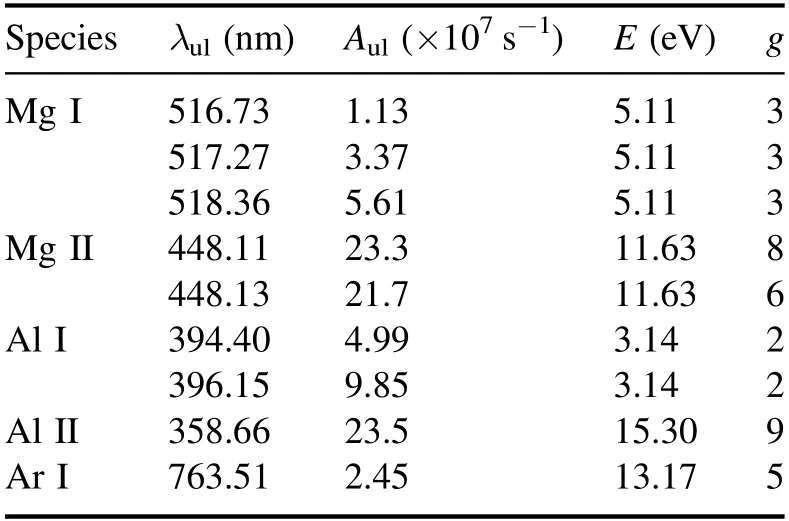
Table 2.Spectral parameters of Mg, Al and Ar species.
4.Results and discussion
The theoretical spatio-temporal imaging and dual-wavelength differential imaging were used to image the distribution of Mg, Al and Ar species in plasmas ablated by 5 and 50 mJ laser energies at 100, 150 and 250 ns, respectively, to verify the feasibility of this theoretical imaging method.
In the numerical calculation of theoretical spatio-temporal imaging, the grid step of the horizontal axis was 0.01 mm, and the grid step of the vertical axis above and below the target was 0.01 mm and 1 μm,respectively.For the consistency of calculation, the time step was 0.1 ns.The forward difference method was used to solve the heat conduction equation, and the explicit Lax–Wendroff combined with the Flux-Corrected Transport method [36] was used to solve the hydrodynamics equations.The above calculation algorithm was developed in a MATLAB environment.
We provide a detailed description of the process used in this work.The intensities of different species were obtained through the basic model, and then all the intensities were normalized with the maximum value.In order to improve the resolution of the order of species layer, in the axial spatial distribution of normalized intensity at the central of plasma at 100 ns under high laser energy shown in figure 3(a), the lowest intersection point 0.6 was taken as the limit of intensity, and the processing result is shown in figure 3(b).The intensity distributions of different species were then plotted with values greater than the minimum intensity.The same standard was used to process the species distribution images in other cases.Figure 4 shows a comparison of species distribution images at different times under different laser energies before and after processing.It can be seen that the distribution of atoms and ions in the original image overlaps seriously, especially at low laser energy, it is difficult to distinguish the order of species layers.However, in the processed image, the boundary of each species layer and the whole layer structure becomes clearer.Although the plasma size is obviously reduced,we are actually concerned with the order of species layers in the plasma.
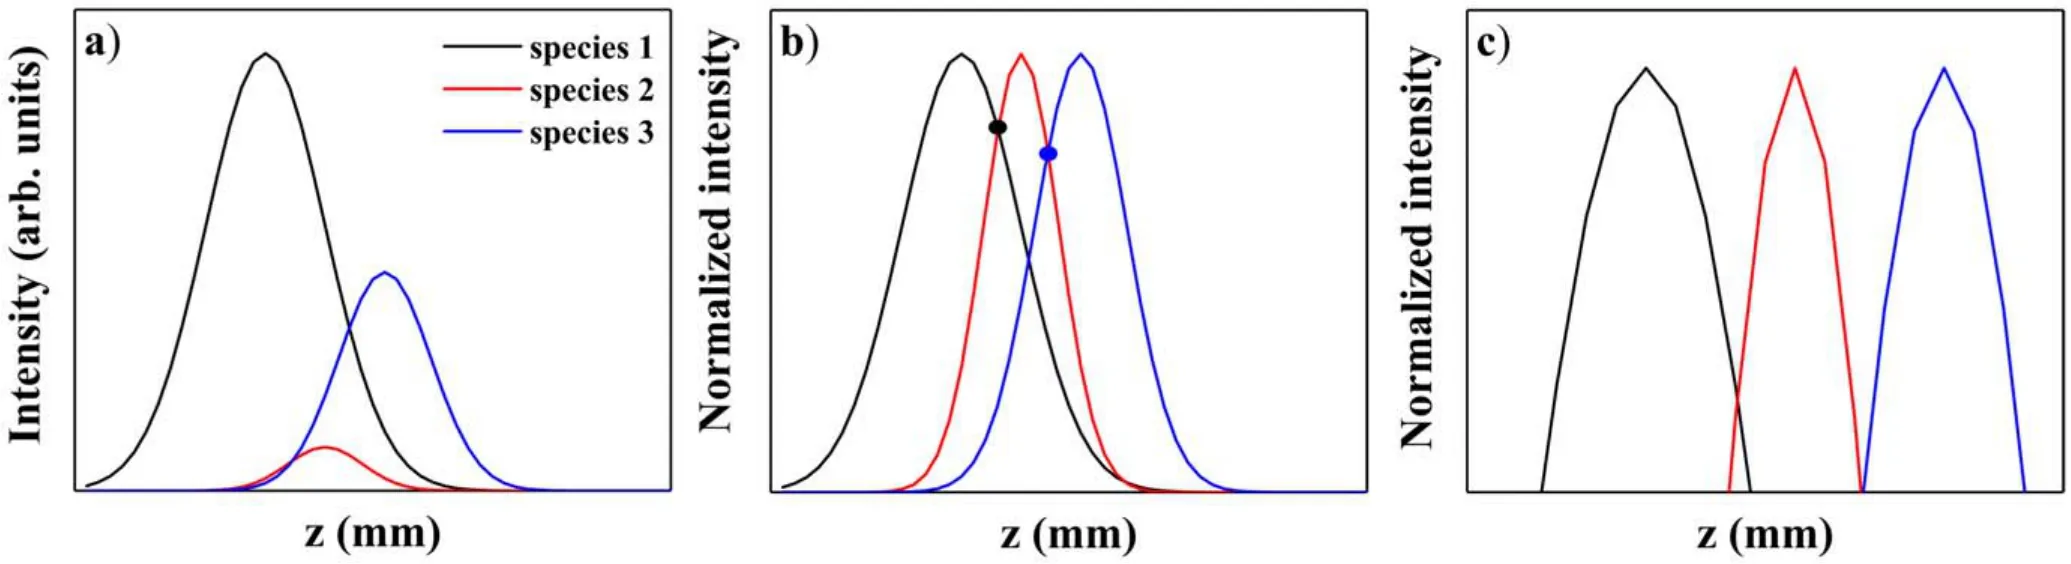
Figure 1.Image processing based on line intensity distribution, including the original intensity distribution (a), the normalized intensity distribution (b) and the intensity distribution after processing (c).
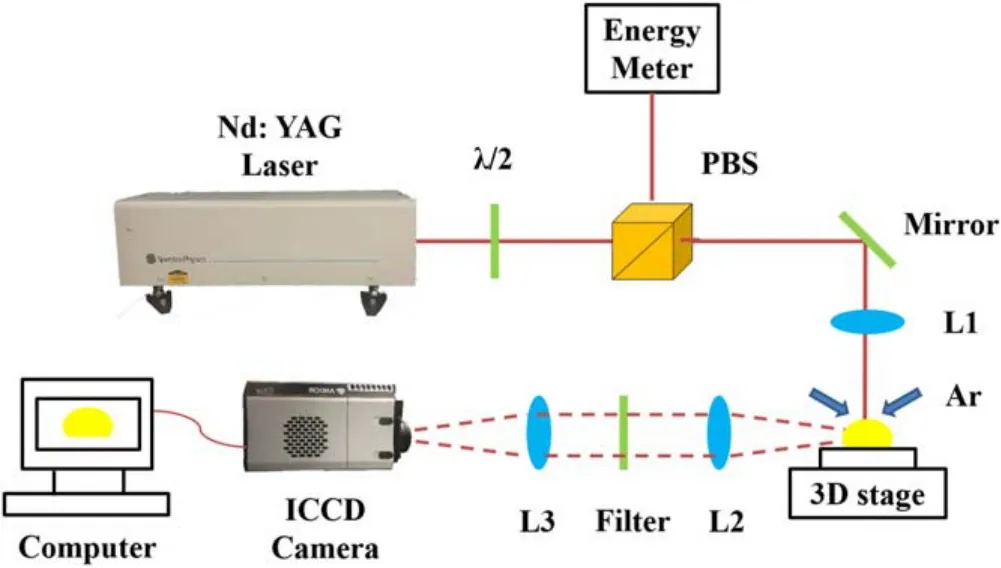
Figure 2.Experimental setup of dual-wavelength differential imaging.
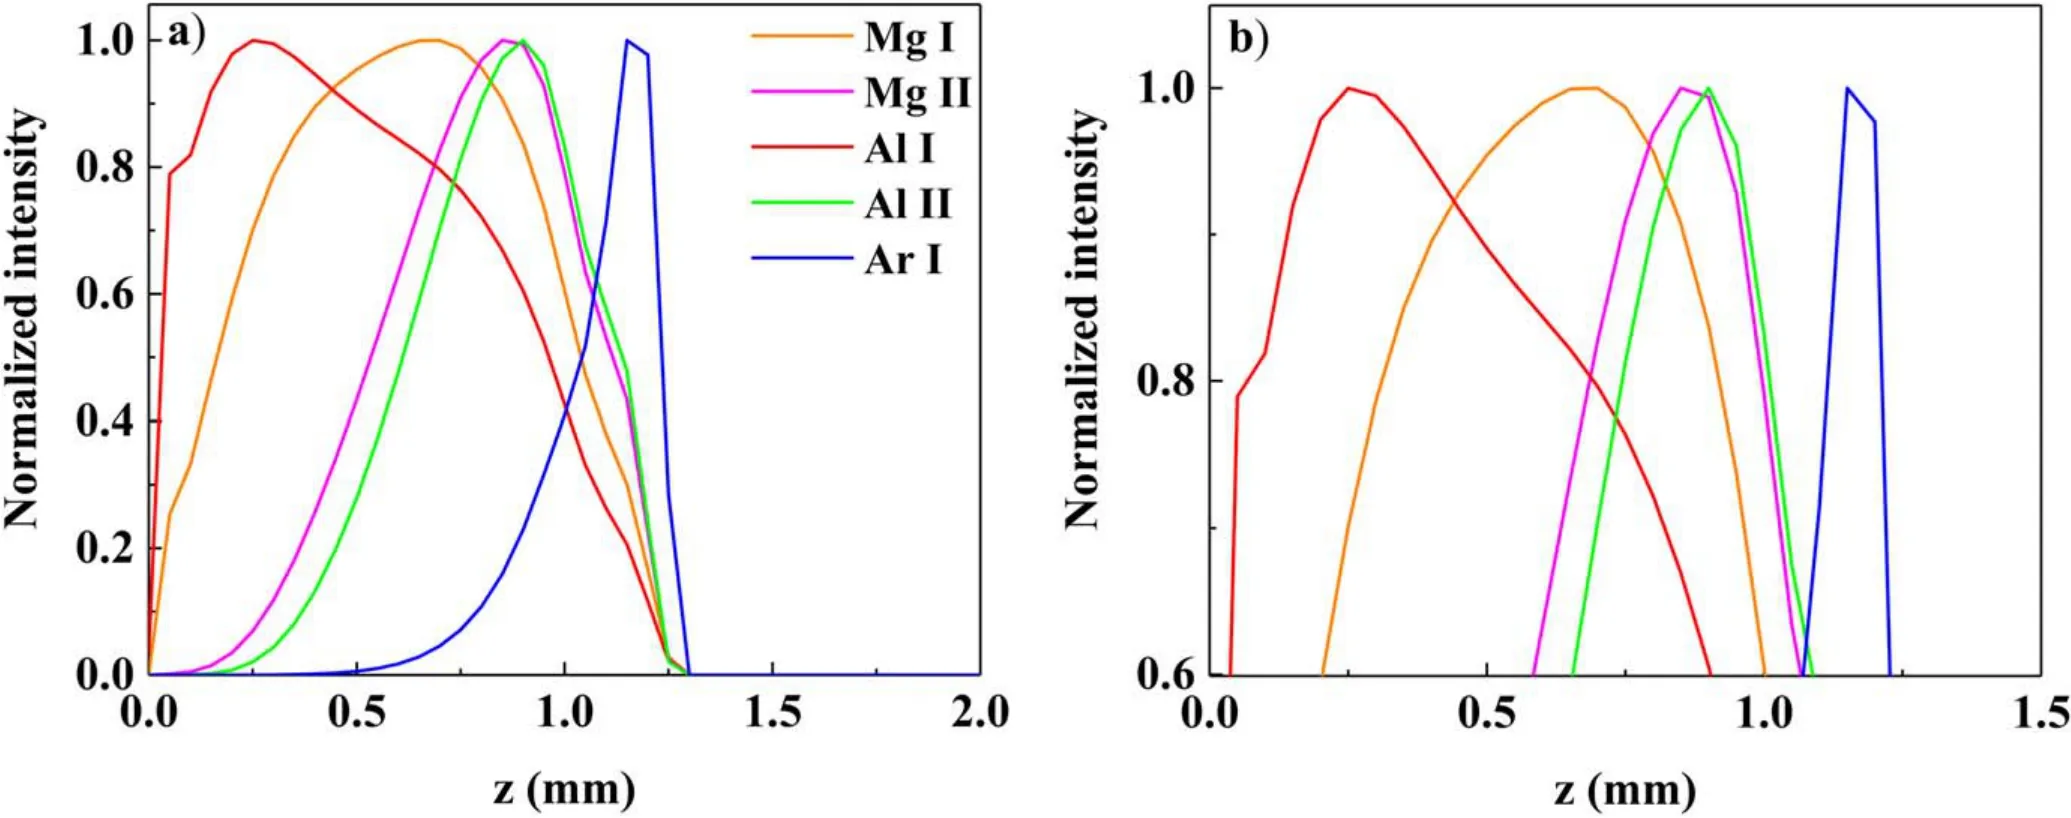
Figure 3.Processing of intensity distribution of Mg, Al and Ar species, including the normalized intensity distribution (a) and the intensity distribution after processing (b).
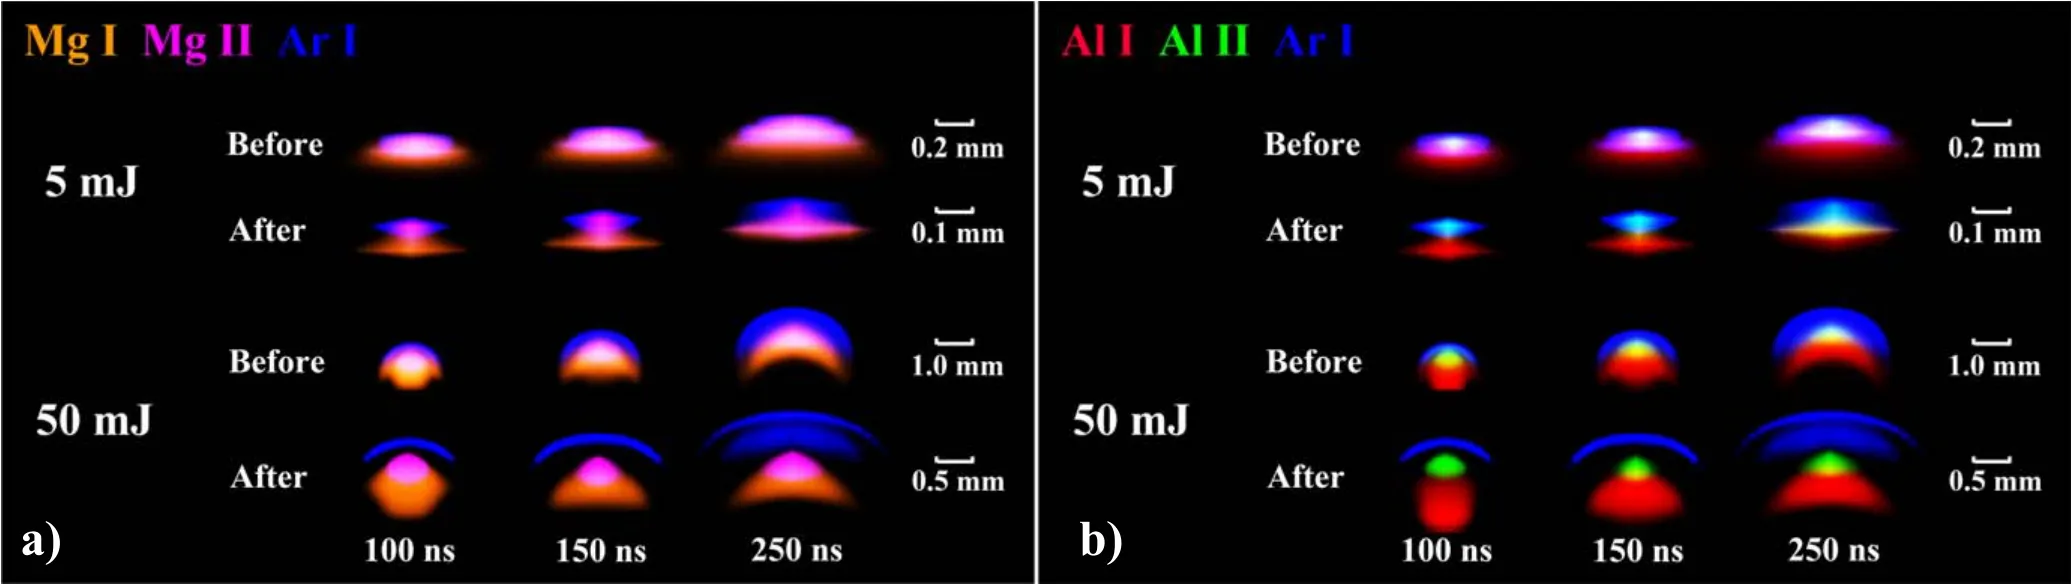
Figure 4.Comparison of species distribution images at different times under laser energies of 5 and 50 mJ (a) before and (b) after image processing.
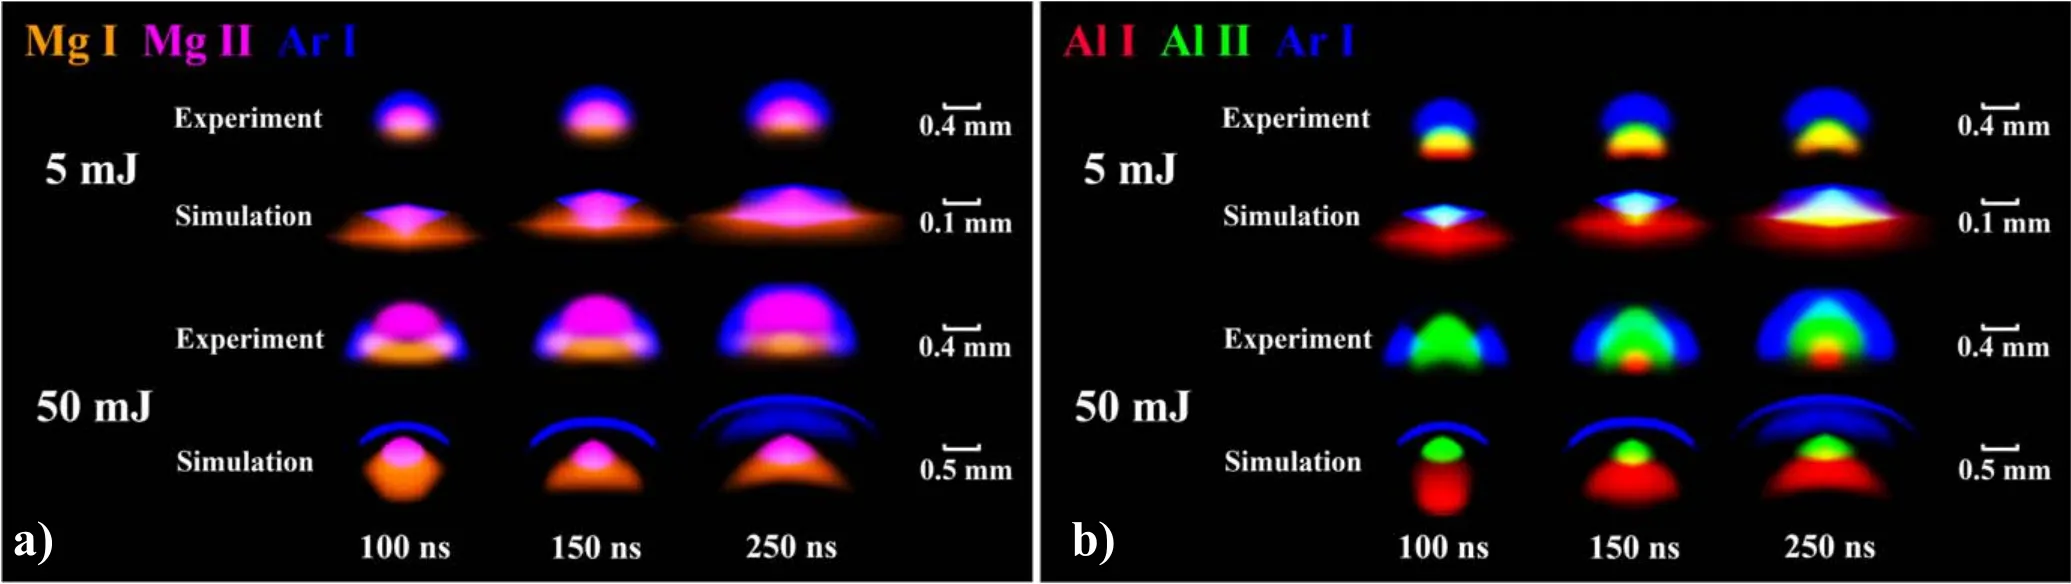
Figure 5.Comparison between the (a) theoretical spatio-temporal imaging and (b) dual-wavelength differential imaging of species distribution at different times under laser energies of 5 and 50 mJ.
The comparison of the temporal evolution of species distribution images obtained by experiment and theory under the two laser energies is shown in figure 5, where figure 5(a)shows the distribution of Mg and Ar species, and figure 5(b)shows the distribution of Al and Ar species.It is seen that the excited Ar atoms are distributed in the top, the excited Mg and Al ions are distributed in the middle,and the excited Mg and Al atoms are distributed at the bottom.This order is consistent with the experimental results and can be easily explained.Unlike plasma in a vacuum, in the presence of background gas, the vapor plasma with high pressure and velocity expands outwards,squeezes the surrounding gas and produces a compressed shock wave at the leading edge of the vapor plasma.The vapor plasma produced by the laser releases energy into the environment and excites the gas, so that the excited Ar atoms are distributed around the vapor plasma,the ions are distributed in the plasma core with higher temperature, and the atoms are distributed near the target surface with lower temperature.Comparing the theoretical and experimental results, it is found that the significant difference is that the ion distribution is dominant in the experiment.The study on the rate coefficient of early plasma [37]shows that the collision ionization process of species is relatively important, which can greatly extend the ion intensity distribution.However, in our theoretical model, the source term of species density was not considered, but this does not affect the order of species layers we are concerned about.In addition, when the laser energy increases from 5 to 50 mJ, the shape of the plasma deforms from a transversely elongated ellipsoid to a near sphere,which is more obvious in the theoretical image, indicating that the increase of laser energy has a great influence on the longitudinal velocity of the plasma.Compared with the original images in figure 4,the simulated plasma size is larger than the experimental one,which is probably due to the transmittance of the filter and the quantum efficiency of the ICCD camera.
The imaging method allows us to directly observe the changes in plasma size and morphology, but the quantitative study of the line intensity distribution of species in plasma is still inseparable from the spectroscopic method.For this reason, we also investigated the order of species layers of different elements by the spectroscopic method.Figure 6 shows the temporal evolution of line integral intensity of species near the target surface (z=0.1, 0.25 mm) under the two laser energies.In the illustration, all the peaks were enlarged to show the distribution order of species layers more clearly.At each laser energy, the spectral line intensity at 0.25 mm was normalized according to the spectral line intensity at 0.1 mm.The integral intensity of the spectral line reaches the maximum rapidly at first, and then decreases slowly.Under different laser energies and axial positions,according to the peak appearing time, the order of species is Ar I,Al II,Mg II,Mg I,Al I.In accordance with the order of species layers, the excited Ar I is pushed forward by the expanding vapor plasma, which leads to the conclusion that Ar I is the fastest and ions are faster than atoms.For atomic species, Mg I is faster than Al I, which is related to the fact that the atomic mass of Mg is less than that of Al,because the species velocity is inversely proportional to the square root of its mass.For ionic species,Al II is slightly faster than Mg II,which is related to the energy of the upper energy level of the selected spectral lines.To move from a low energy level to a high energy level, the electrons in Al II need to absorb more energy, as in the higher upper energy level listed in table 2.Therefore,Al II is closer to the front edge of the plasma with a higher temperature than Mg II.The decrease of laser energy and the increase of axial position will delay the time to reach the peak intensity.It can be seen that at 0.25 mm, all lines(especially ionic lines) at low laser energy decay in an unequal proportion,while at high laser energy,except for the enhancement of Ar line, the other lines almost decay in the same proportion.With the expansion of plasma, the species number density and plasma temperature decreased, resulting in the decrease of the intensity of most species in the far axial position.For Ar I species at high laser energy,the increase of the number density was caused by the interaction between vapor plasma and background gas, of which the effect exceeds that of plasma temperature on the intensity.Therefore, the intensity of Ar I species increases at the far axial position.
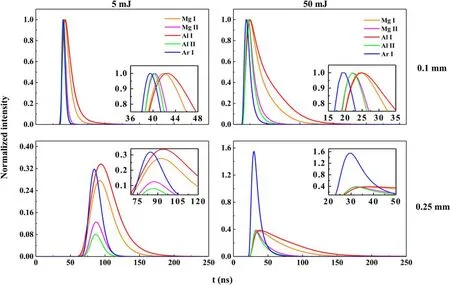
Figure 6.Model-predicted temporal evolution of axial line integral intensity of species near the target surface under laser energies of 5 and 50 mJ.
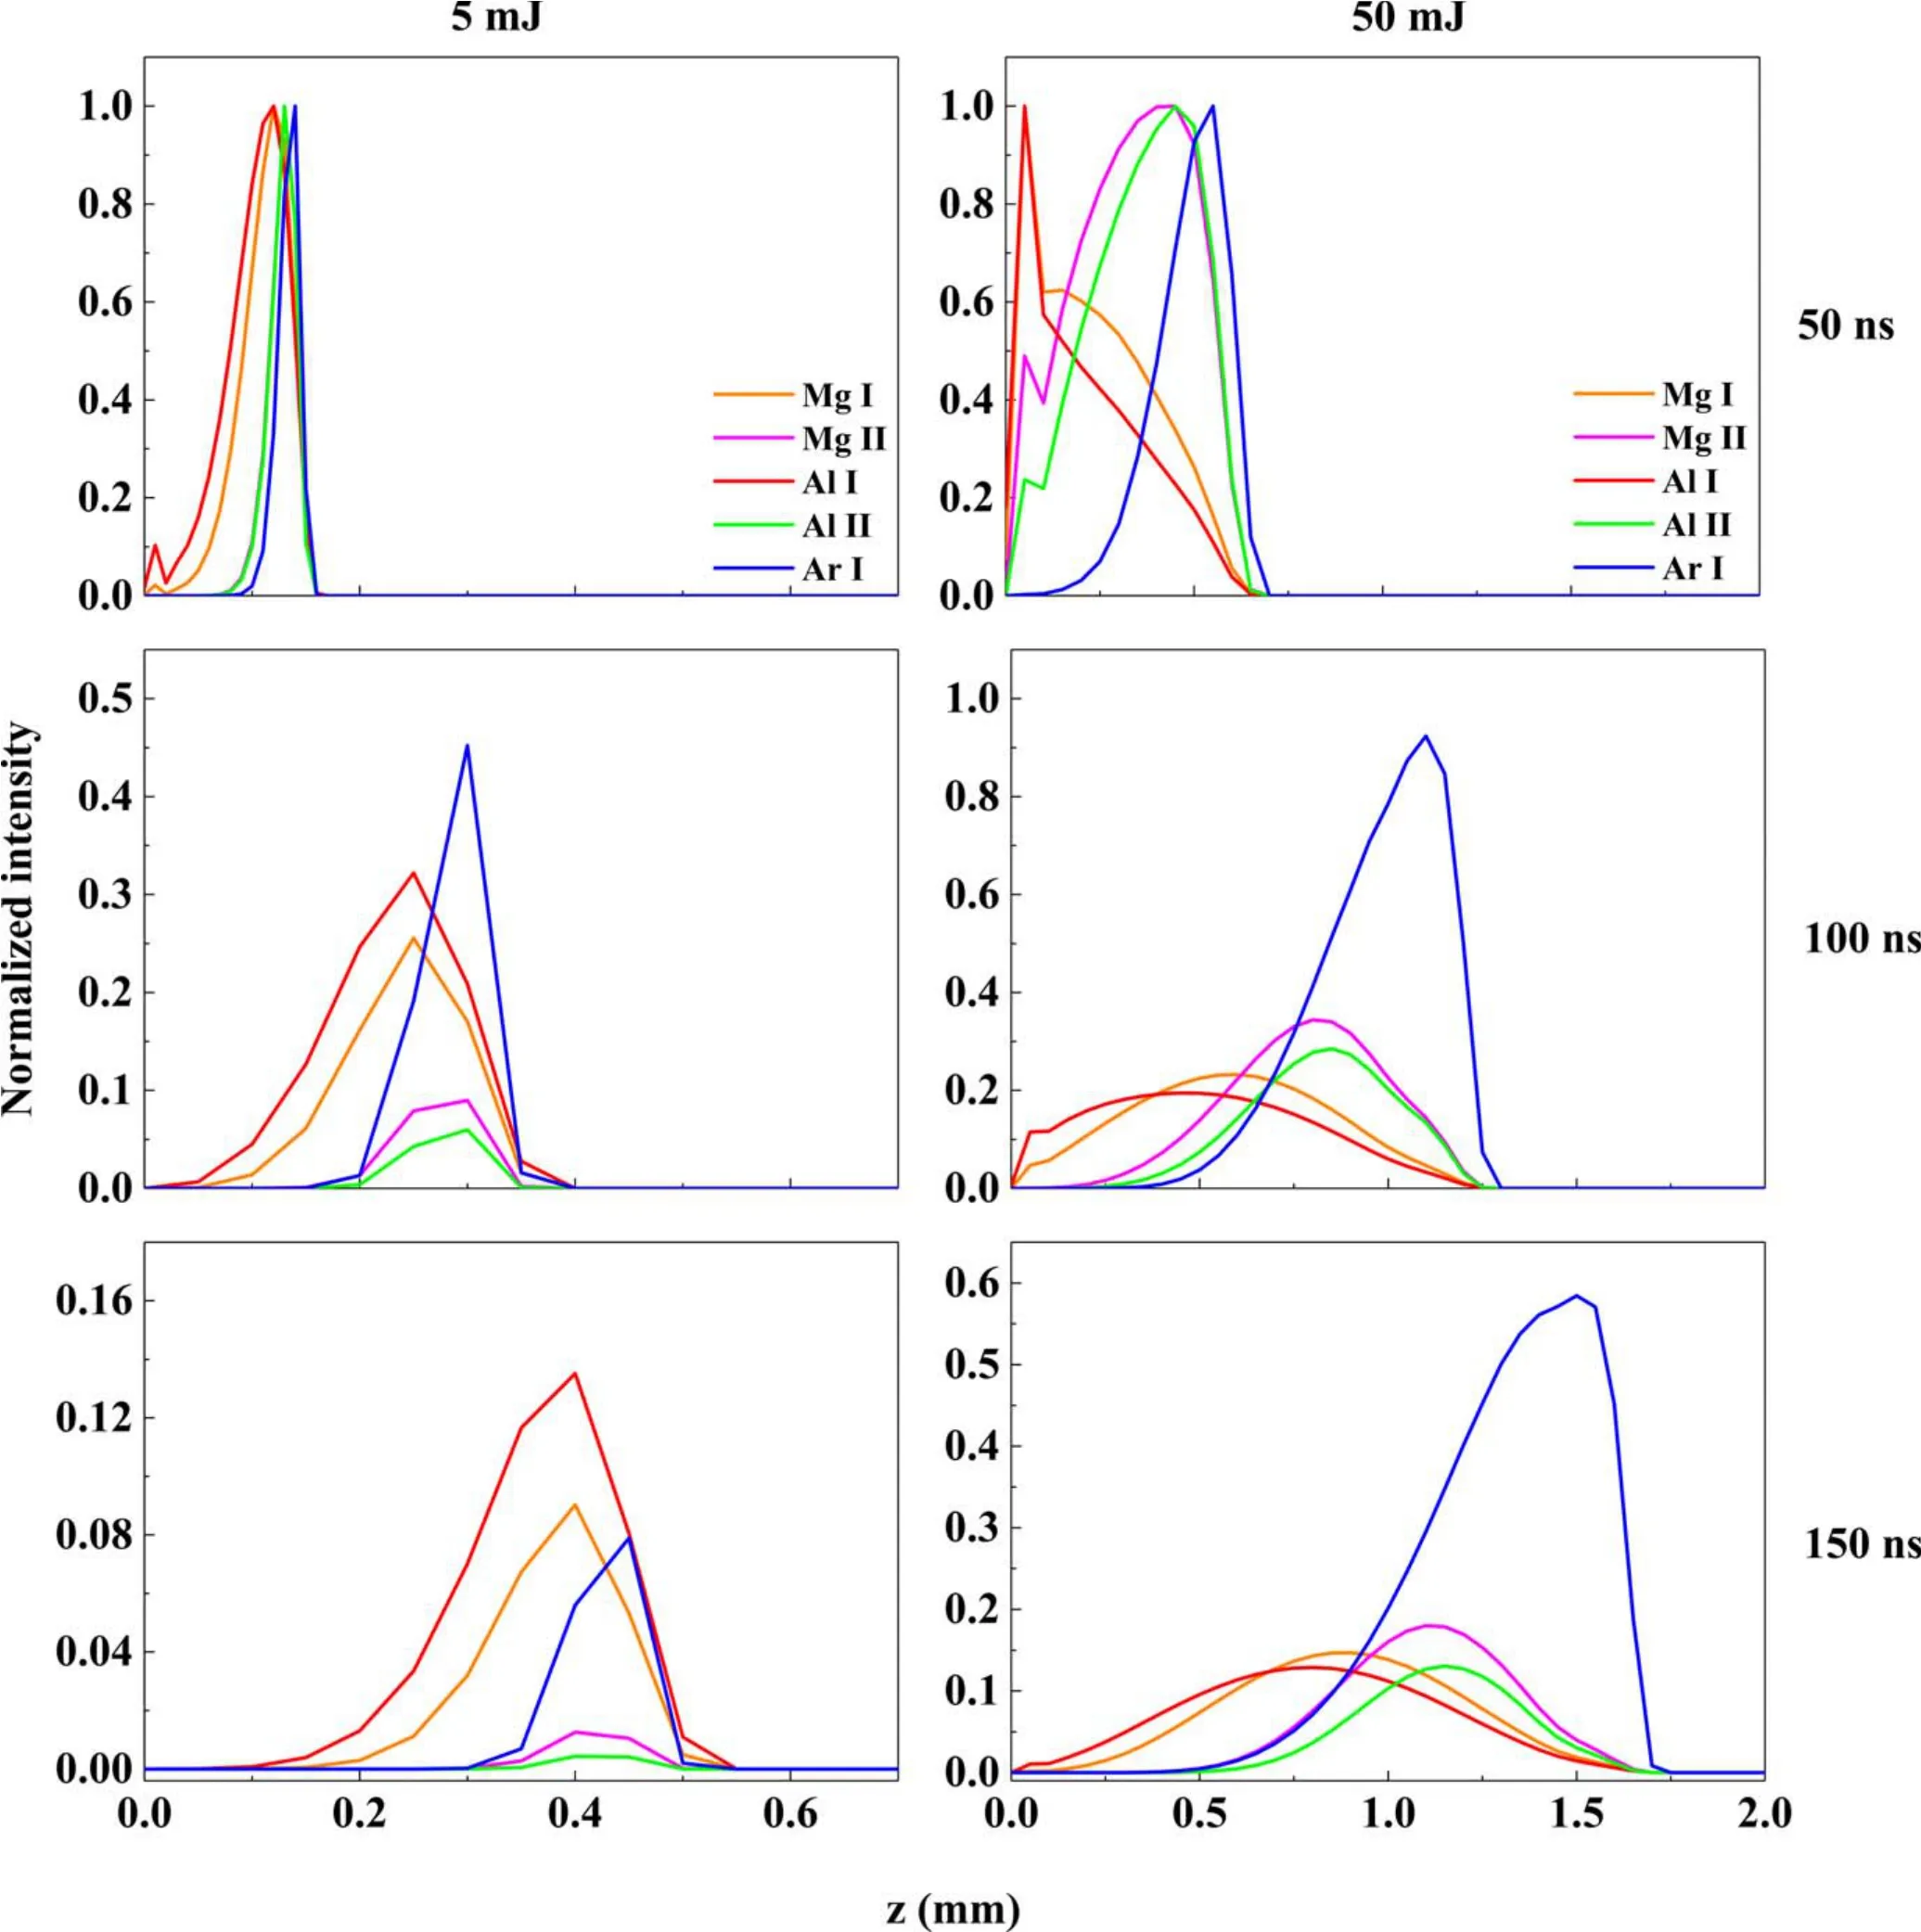
Figure 7.Model-predicted axial spatial evolution of emission line integral intensity of species at different time under laser energies of 5 and 50 mJ.
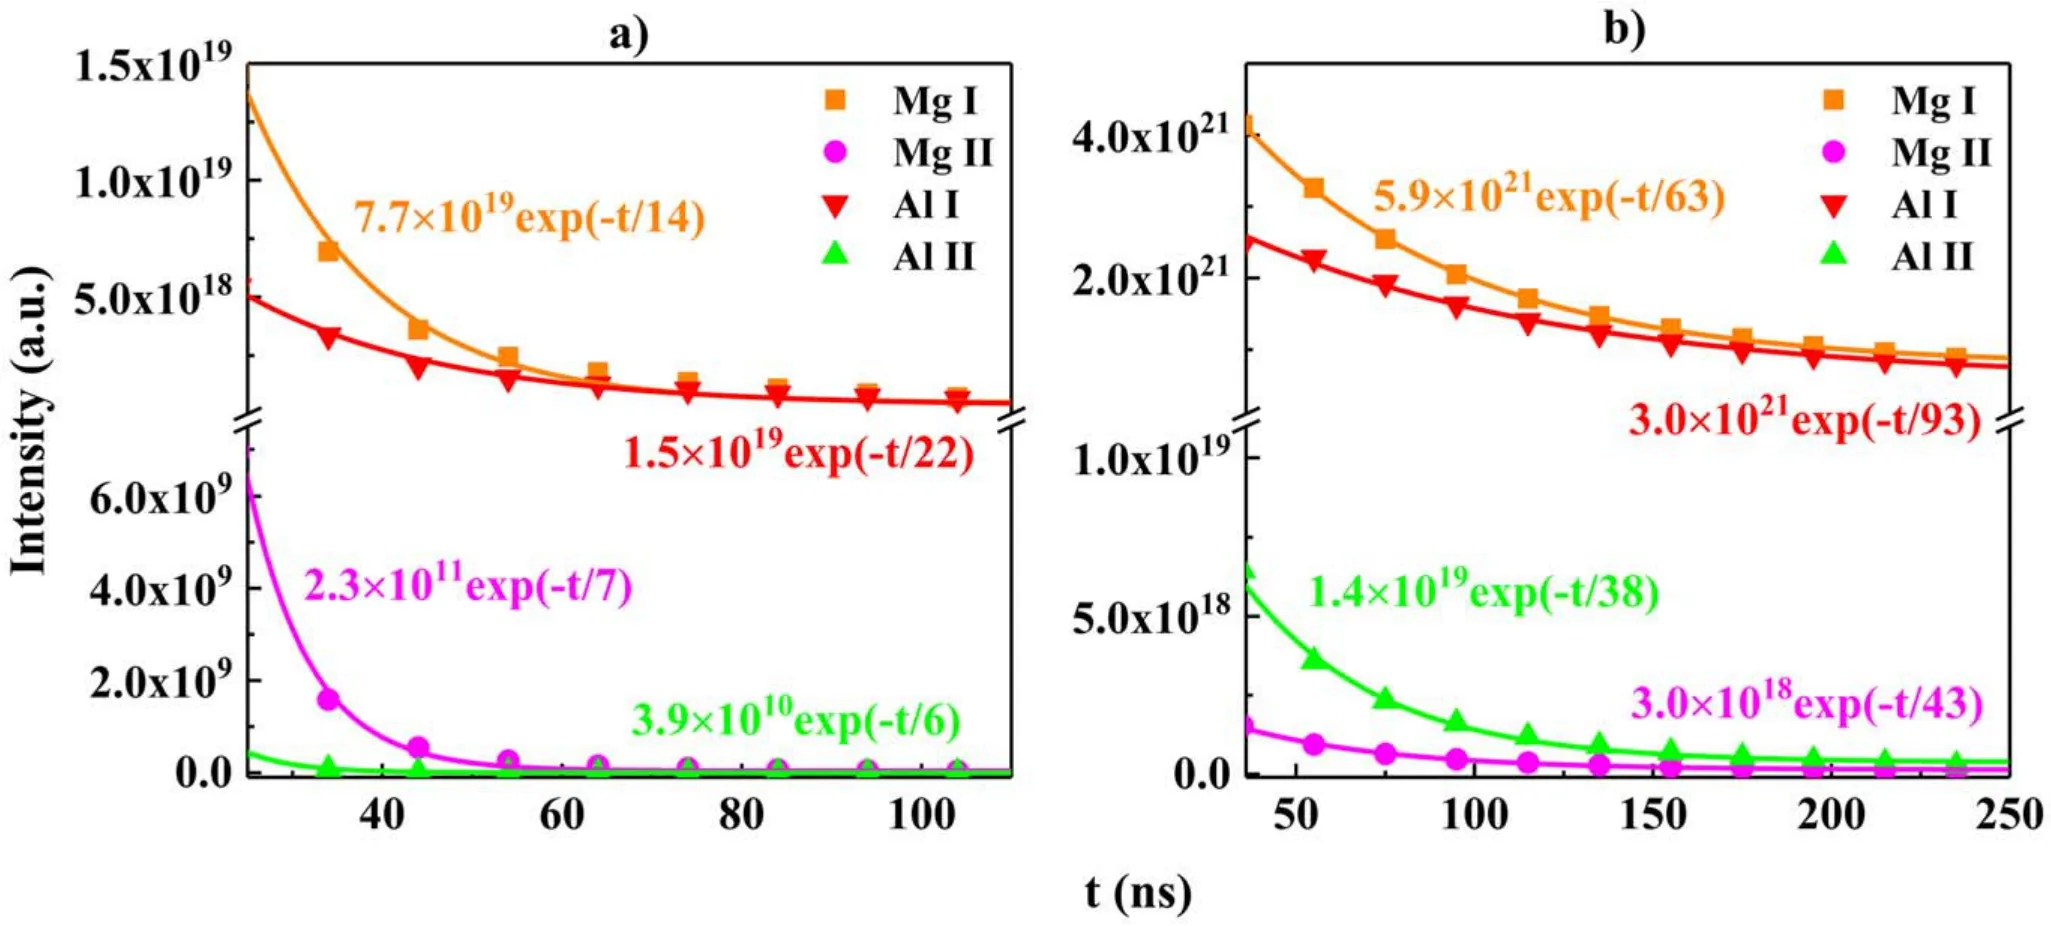
Figure 8.Model-predicted decay of species in the plasma produced by 5 mJ (a) and 50 mJ (b) laser energies.
The spatial evolution of line integral intensity of species along the vertical axis at different times under the two laser energies is given in figure 7.At each laser energy, the line intensities at 100 and 150 ns were normalized according to the line intensity at 50 ns.As can be seen, all the lines become weaker with time,and the peak of species line is farther away from the target surface.The distance between the axial position of peak intensity and the target surface is corresponding to the arrival time of peak intensity shown in figure 6.That is to say,the earlier the peak intensity appears,the faster the velocity of the species is,and the farther the peak intensity is from the target surface.At low laser energy,the decrease of peak intensity of ionic line is the most significant, while at high laser energy, the peak intensity of atomic line decreases slightly faster than that of ionic line.At both laser energies,the intensity of Ar I decreases slowly, because with the expansion of plasma,the number density of Ar I at the plasma edge increases with time.The above discussion shows that the laser energy has a certain influence on the decay of species.Then we integrated the intensity of species in the calculated region to study the decay of species in the plasma under two laser energies.The results are shown in figure 8 as scatter points, and the correlation coefficients R2of exponential fitting are all greater than 0.98.Consistent with the experimental results of aluminum–magnesium plasma in argon, the behavior of exponential decay of ionic line intensity with time was also observed.According to self-absorption studies by Surmick et al for aluminum [38] and by Sherbini et al for magnesium [39], in the early stage of plasma, there is a selfabsorption effect, that is, plasma intensity is the result of spontaneous radiation and self-absorption.The intensity of spontaneous radiation decreases exponentially with time, as does the self-absorption coefficient, which determines the evolutionary trend of actual intensity.The smaller the time constant (the denominator) [21], the faster the species decay.Moreover, ions decay faster than atoms, because in the later stage, the recombination of ions and electrons gradually becomes dominant.Species decay more slowly under higher laser energy, which implies that increasing laser energy can prolong the lifetime of plasma.
At the early stage of plasma expansion, the decay time constants of different ionic line intensities were extracted by exponential fitting.Under low laser energy, the decay time constant of Al II(59 ns)is less than that of Mg II(62 ns),that is, the decay is faster, which is consistent with the theory.In contrast to the theoretical results, the decay time constants of Al II is 190 ns and that of Mg II is 107 ns under high laser energy.The decay time constants are relatively small due to the lack of the source term of the collision ionization process in the theoretical model.Combined with the species distribution images in figure 5, there is a significant difference between the experimental and theoretical images at high laser energy, indicating that our theoretical model may be more suitable for the study of species distribution at low laser energy.At low laser energy, the plasma shielding occurs in the vapor in the middle of the plasma,and the plasma exhibits a laser-supported combustion wave, while at high laser energy, the plasma shielding occurs in the impacting gas at the front of the plasma, and the plasma exhibits a laser-supported detonation wave.At high laser energy, the impacting gas directly absorbs a lot of energy, and its backward recoil results in a significant extension of the lifetime of adjacent Al II.Through further analysis of laser-supported absorption waves at different laser energies,our model can be applied to the plasma dominated by laser-supported combustion wave.
5.Conclusion
In this work,based on the thermal model of laser ablation and two-dimensional axisymmetric multi-species hydrodynamics model, the theoretical calculation of plasma generated by laser and aluminum–magnesium alloy in atmospheric argon is carried out, thus a theoretical imaging method is proposed.After a series of image processing including normalization, determination of minimum intensity,combination and color filtering, the relatively clear species intensity distribution images are obtained.It can be clearly seen that the excited Ar atoms are distributed in the periphery due to the extrusion of the expanding vapor plasma,the excited Mg and Al ions are distributed in the central region of the plasma, and the Mg and Al excited atoms are distributed closer to the target surface,all of which have the same arrangement as the experimental layered structure.The species arrangement of different elements of the same charge state is related to the energy of the upper energy level of the selected spectral lines.Moreover, the spectral lines intensity decreases exponentially with time, and the line intensity of ions decays faster than that of atoms due to the recombination process especially at low laser energy.Similarly, the experimental decay behavior over time is observed during experimental verification of aluminum–magnesium plasma in argon.Compared with the decay time constants,the experimental results at low laser energy are in good agreement with the theoretical results, which proves the practicability of the theoretical model in the plasma dominated by laser-supported combustion wave.Compared with the traditional experimental imaging methods, the theoretical spatial-temporal imaging can simulate the distribution of multi-element species in the plasma quickly and simultaneously, help people understand the plasma more deeply, and provide theoretical support for laser ablation application.In the next work, we will use this method to further study the species distribution in plasma with a large difference in the relative atomic masses of the constituent elements.
Acknowledgments
This work is supported by National Key R&D Program of China(No.2017YFA0304203); National Energy R&D Center of Petroleum Refining Technology(RIPP,SINOPEC);Changjiang Scholars and Innovative Research Team in University of Ministry of Education of China(No.IRT_17R70);National Natural Science Foundation of China (NSFC) (Nos.61975103,61875108, 61775125, 11434007); Major Special Science and Technology Projects in Shanxi (No.201804D131036); 111 Project (No.D18001); Fund for Shanxi ‘1331KSC’.
猜你喜歡
東坡赤壁詩詞(2023年1期)2023-05-30 00:41:39
Plasma Science and Technology(2022年8期)2022-11-27 09:01:36
Chinese Physics B(2022年9期)2022-09-24 08:01:16
人民黃河(2022年4期)2022-04-07 09:03:16
Chinese Physics B(2021年12期)2021-12-22 06:46:10
東坡赤壁詩詞(2021年5期)2021-10-28 22:21:09
東坡赤壁詩詞(2020年4期)2020-09-02 09:43:47
Chinese Physics B(2019年10期)2019-11-06 00:44:14
現(xiàn)代經(jīng)濟信息(2019年8期)2019-07-29 00:33:17
女性天地(2018年3期)2018-03-27 09:55:22
 Plasma Science and Technology2022年3期
- Plasma Science and Technology的其它文章
- Design and preliminary test of a 105/140 GHz dual-frequency MW-level gyrotron
- Competitive effect between roughness and mask pattern on charging phenomena during plasma etching
- Reliability improvement of gas discharge tube by suppressing the formation of shortcircuit pathways
- A novel flexible plasma array for large-area uniform treatment of an irregular surface
- Pulsed high-current discharge in water:adiabatic model of expanding plasma channel and acoustic wave
- Comparison of double layer in argon helicon plasma and magnetized DC discharge plasma