
Effects of pulse energy ratios on plasma characteristics of dual-pulse fiber-optic laser-induced breakdown spectroscopy
2022-02-24 08:58:26YuHuaHang杭玉樺YanQiu邱巖YingZhou周穎TaoLiu劉韜BinZhu朱斌KaixingLiao廖開星MingXinShi時(shí)銘鑫andFeiXue薛飛
Chinese Physics B 2022年2期
Yu-Hua Hang(杭玉樺) Yan Qiu(邱巖) Ying Zhou(周穎) Tao Liu(劉韜)Bin Zhu(朱斌) Kaixing Liao(廖開星) Ming-Xin Shi(時(shí)銘鑫) and Fei Xue(薛飛)
1Suzhou Nuclear Power Research Institute,Suzhou 215004,China2Key Laboratory for Physical Electronics and Devices of the Ministry of Education,Faculty of Electronic and Information Engineering,Xi’an Jiaotong University,Xi’an 710049,China3State Key Laboratory of Electrical Insulation and Power Equipment,Xi’an Jiaotong University,Xi’an 710049,China
Laser-induced plasmas of dual-pulse fiber-optic laser-induced breakdown spectroscopy with different pulse energy ratios are studied by using the optical emission spectroscopy(OES)and fast imaging. The energy of the two laser pulses is independently adjusted within 0–30 mJ with the total energy fixed at 30 mJ. The inter-pulse delay remains 450 ns constantly. As the energy share of the first pulse increases,a similar bimodal variation trend of line intensities is observed.The two peaks are obtained at the point where the first pulse is half or twice of the second one,and the maximum spectral enhancement is at the first peak. The bimodal variation trend is induced by the change in the dominated mechanism of dual-pulse excitation with the trough between the two peaks caused by the weak coupling between the two mechanisms.By increasing the first pulse energy, there is a transition from the ablation enhancement dominance near the first peak to the plasma reheating dominance near the second peak. The calculations of plasma temperature and electron number density are consistent with the bimodal trend, which have the values of 17024.47 K, 2.75×1017 cm?3 and 12215.93 K,1.17×1017 cm?3 at a time delay of 550 ns. In addition, the difference between the two peaks decreases with time delay.With the increase in the first pulse energy share, the plasma morphology undergoes a transformation from hemispherical to shiny-dot and to oblate-cylinder structure during the second laser irradiation from the recorded images by using an intensified charge-coupled device(ICCD)camera. Correspondingly,the peak expansion distance of the plasma front first decreases significantly from 1.99 mm in the single-pulse case to 1.34 mm at 12/18(dominated by ablation enhancement)and then increases slightly with increasing the plasma reheating effect. The variations in plasma dynamics verify that the change of pulse energy ratios leads to a transformation in the dual-pulse excitation mechanism.
Keywords: fiber-optic laser-induced breakdown spectroscopy(FO-LIBS),dual-pulse excitation,pulse energy ratio,spectral enhancement
1. Introduction
Laser-induced breakdown spectroscopy (LIBS) is a multi-element analytical technique based on the atomic emission spectroscopy (AES). The plasma is produced by a highenergy and short-duration pulsed laser focused on a sample surface, and the peak irradiance inside the spot can reach a level of GW/cm2.[1]The plasma emission is collected for qualitative identification or quantitative analysis of the elements contained in the test specimens.LIBS has become a promising chemical analytical technique due to its numerous advantages,such as no sample pre-treatment,minimal target damage,and rapid online measurement.[2,5]However, the traditional LIBS system (with direct-focusing laser) is limited to laboratories and professional analysts, because of its complicated optical structure, weak plasma radiation and unsatisfactory sensitivity for trace elements,which makes it impractical for complex industrial fields or hazardous extreme environments.[7]
In order to improve the field applicability of LIBS, the fiber-optic laser-induced breakdown spectroscopy(FO-LIBS)was proposed,in which the pulsed laser and plasma emission are transmitted via a long optical fiber,avoiding the large-scale optical arrangement on site and facilitating the determination of terminal spectral measurement parameters. FO-LIBS has been applied in various industrial fields, such as metal smelting, soil analysis, archaeological excavation, and nuclear industry (including nuclear power and nuclear fusion).[8,9]In nuclear industry, FO-LIBS was established as a probe device for Gd detection in surrogate nuclear fuel debris under gamma irradiation to simulate the actual debris in the damaged reactors of the Fukushima Daiichi nuclear power plant.[10]Xiao analyzed corrosion on spent fuel canisters from the accumulation of chlorine (Cl) anions by demonstrating a new set of FO-LIBS system.[11]Tamura developed a compact FO-LIBS equipped with a microchip laser (MCL) to inspect the inside of nuclear reactor cores.[12]Li studied the temporal and spatial behaviors of hydrogen(H)retention on tantalum(Ta)under a vacuum condition to obtain the expansion processes of fuel elements of low-Zvalues (such as H) and the wall elements of high-Zvalues (such as Ta) on a plasma-facing component(PFC).[13]However,due to the threshold limitation at the laserfeedthrough and the top-hat homogenized profile of the output laser beam,[14]the reduced peak irradiance leads to weak plasma dynamics,short emission lifetime and thus unsatisfactory sensitivity for trace elements.
The dual-pulse excitation has been widely recognized as a highly effective and popular technique for signal enhancement in the traditional LIBS.[15]Lee reported that the collinear dualpulse LIBS can reduce the limit of detections(LOD)of B and Li in aqueous solution to 0.8 ppm and 0.8 ppb,respectively.[19]Lu developed an UV fs–ns dual-pulse configuration, and the resulting enhanced factor reached 360 as compared to a singlefs pulse apparatus on a single-crystalline silicon surface.Eland claimed 1.5 to 2-fold spectral enhancement on copper and lead samples using a dual-pulse FO-LIBS configuration.[21]It has been demonstrated that the signal enhancement depends strongly on the specific dual-pulse parameters, including the inter-pulse delay,pulse wavelength,spot size and pulse energy ratio. Ahmed noticed a better enhancement when the energy of the first pulse was one-third or half of the second one,and they suggested that the dual-pulse enhancement was not only due to the plasma reheating, but more probably to better interaction between the second pulse and the target surface by observing an inconsistency in the enhanced signal and no significant change in plasma temperature. However, no relevant research has been published on the effects of pulse energy ratios on dual-pulse FO-LIBS, and the mechanism for changes in spectral enhancement properties is still not understood.
In this work, a collinear dual-pulse FO-LIBS is developed,and the enhancement mechanism at various pulse energy ratios is studied with plasma diagnostics. Optical emission spectroscopy(OES)is employed to visualize axially the component distribution and estimate the plasma temperature and electron number density.An intensified charge-coupled device(ICCD)is utilized to exhibit the plasma morphology, and the expansion process of the plasma front can be extracted from the recorded images. The scope of this work is to understand the variation of plasma emission and dynamic characteristics at different pulse energy ratios,and to obtain the optimization scheme of enhancing spectral signal in FO-LIBS. In the remainder of the paper, the experimental setup, typical results,and corresponding discussions are presented.
2. Experimental setup
The schematic diagram of the experimental setup is depicted in Fig.1. Two Nd:YAG lasers are operated at 1064 nm with 10 Hz repetition rate and 10-ns pulse duration(full width at half maximum, FWHM). The laser firstly coupled into the fiber is referred to as beam 1 (Beijing GK Laser Technology Co.,GKNPS-1064-15-10)and the delayed laser is referred to as beam 2 (Quantel USA, Centurion+). Small fractions of both laser beams are firstly reflected to energy meters (EM1 and EM2, Nova II, P/N 7Z01550, Ophir), and to fast photodiodes (PD1 and PD2, Thorlabs DET10A2) coupled to an oscilloscope by beam splitters (BS1–BS2 and BS3–BS4), to real-time monitor the current energies and record the moments of laser action,respectively. The energies of two laser beams are controlled by a combination of a half-wave plate and a Glan polarizer (Thorlabs, VA5-1064), avoiding distortions in the spatiotemporal irradiation profile.Through a reflector(R1)and a beam splitter(BS5),two laser beams are aligned on the same direction and coupled into a high-power multimode fiber(20-m length,800μm core diameter,0.37 numerical aperture and~1 GW/cm2damage threshold for a 10 ns pulse laser)by a 40 mm focal length lens (L3). At the other end of the fiber, the output laser beams are focused on the target surface by a 32-mm focal length lens (L1) and a 16 mm focal length lens (L2). The plasma emission is directly recorded by a Czerny–Turner spectrometer(Andor SR750,fitted with a grating: 1200 groves/mm at 500 nm blaze) equipped with an ICCD detector(Andor istar DH334T)via a UV-VIS lens. Another ICCD camera(Andor istar DH334T)is used to perform plasma morphology detection simultaneously.
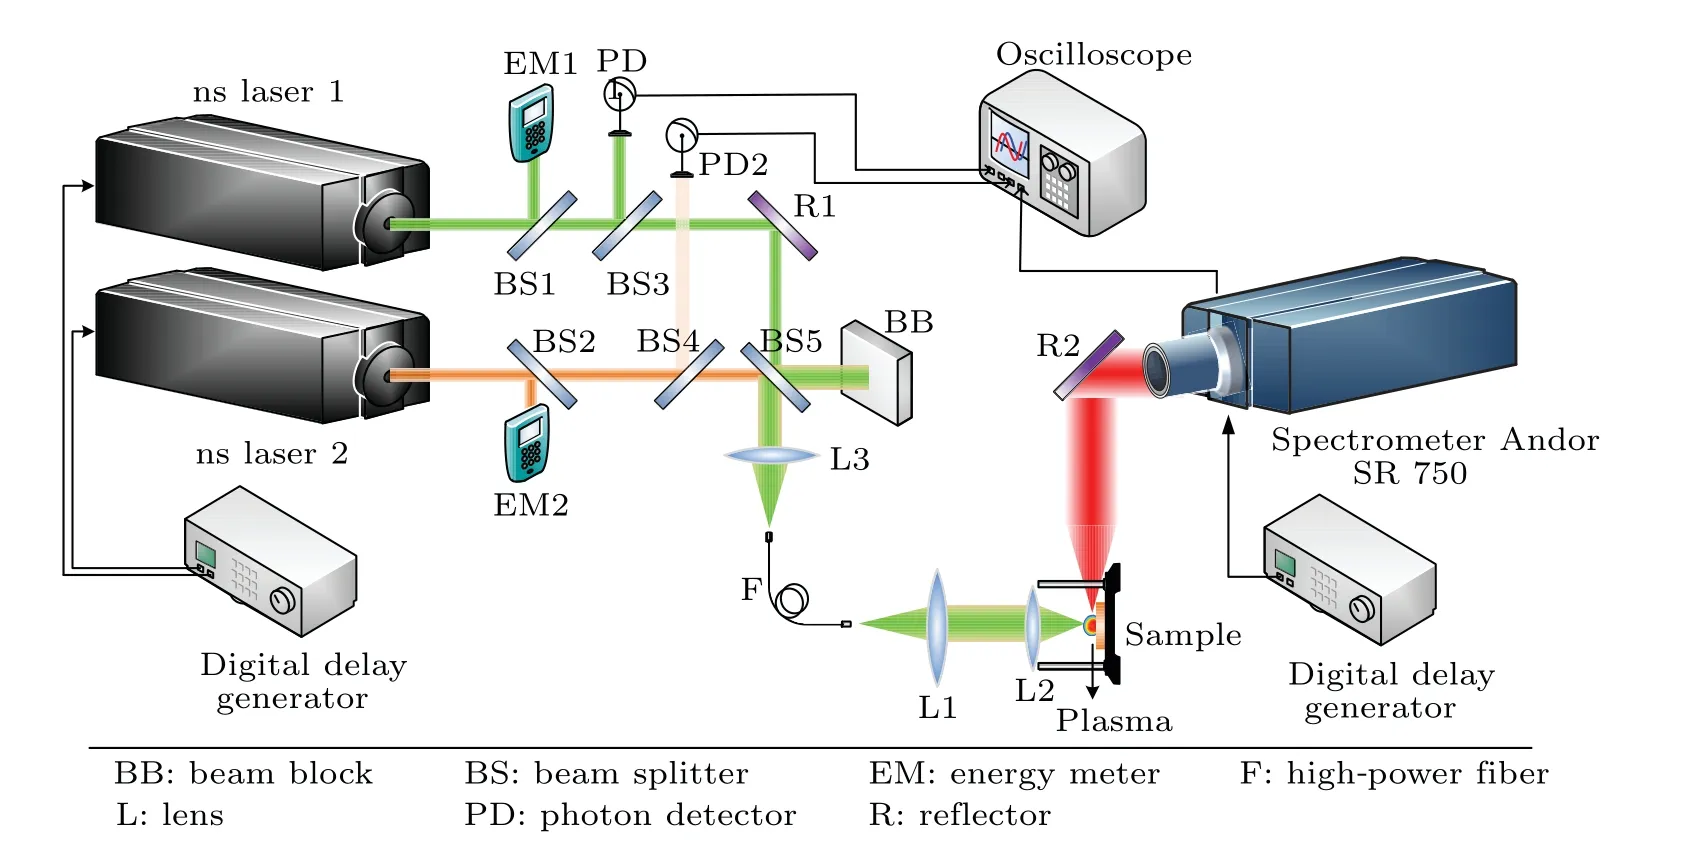
Fig.1. Schematic diagram of experimental setup for the collinear dual-pulse FO-LIBS with adjustable pulse energy ratios.
A digital time delay generator (Stanford Research Systems, DG535) is applied to trigger all ICCD cameras and lasers,as well as to fix the inter-pulse delay(i.e.,the time interval between two laser beams)to 450 ns and the gate delay(i.e.,the time interval between the second laser beam and the first falling edge of the signal from the port“Gate monitor”).A copper–tungsten alloy sample(~90%W content and~10%Cu content)is used as the target material in this work carried by a motorizedXYZdisplacement stage. The sample surfaces are polished by a sand paper(300 mesh)and then cleaned by alcohol. In order to remove contaminants or oxide layers,the target surface is cleaned with 10 pre-pulses prior to data acquisition when the focused spot is transferred to a fresh area with the cumulative number of laser shots less than 40 to prevent deep-crater effects.
3. Results and discussion
3.1. Spectral characteristics
Typical spectral images of OES for single-pulse laserinduced copper–tungsten alloy plasma in the wavelength range of 510 to 523 nm are shown in Fig.2(a),and the corresponding axial integral spectra is given in Fig.2(b). The time delay of spectral acquisition is varied from?7 ns up to 2000 ns with the gate width fixed at 3 ns.To reduce shot-to-shot fluctuation,each spectrum is accumulated from 5 laser shots,and the measurement is repeated 10 times. At the early stage of plasma evolution,plasma emission is dominated by continuum,which is mainly induced by bremsstrahlung of free-free process and radiative recombination of free-bound process. With the increase of time delay,the continuum weakens rapidly,discrete Cu I emission becomes obvious, and its signal-to-noise ratio(SNR)improves. When the time delay exceeds 800 ns,the Cu I emission intensity shows a significant weakening trend,and the spectra at this time delay are taken to study the effects of pulse energy ratios on spectral characteristics.
Through keeping the total laser energy of 30 mJ constant,the pulse energy ratio can be flexibly changed by rotating the half-wave plates. The energies of beam 1 and beam 2 are independently adjusted in a step of 2 mJ,thus 16 energy combinations are formed. To simplify the representation, the pulse energy ratios in the following are expressed in form of the first pulse energy/the second pulse energy (mJ/mJ). The intensity variation of three Cu I emission lines with different pulse energy ratios is shown in Fig.3.It is clear that the trends of these three emission lines can be consistently divided into four processes,appearing a bimodal structure. Starting from 0/30,the line intensities first increase slowly,and then sharply increase to a plateau in the interval 4/26–6/24 maintaining a high level between 6/24 and 10/20(process A).With the further increase of the energy share of the first pulse,the line intensities show a monotonically decreasing trend in the range of 10/20–16/14(process B), and the minimum values obtained at 16/14 can even be comparable to the single-pulse case(no enhancement effect). This is followed by the arrival of the second ascending stage,reaching another peak at 22/8(process C).Afterwards,the line intensities decrease again as the percentage of the second pulse reduces to extinction(process D).
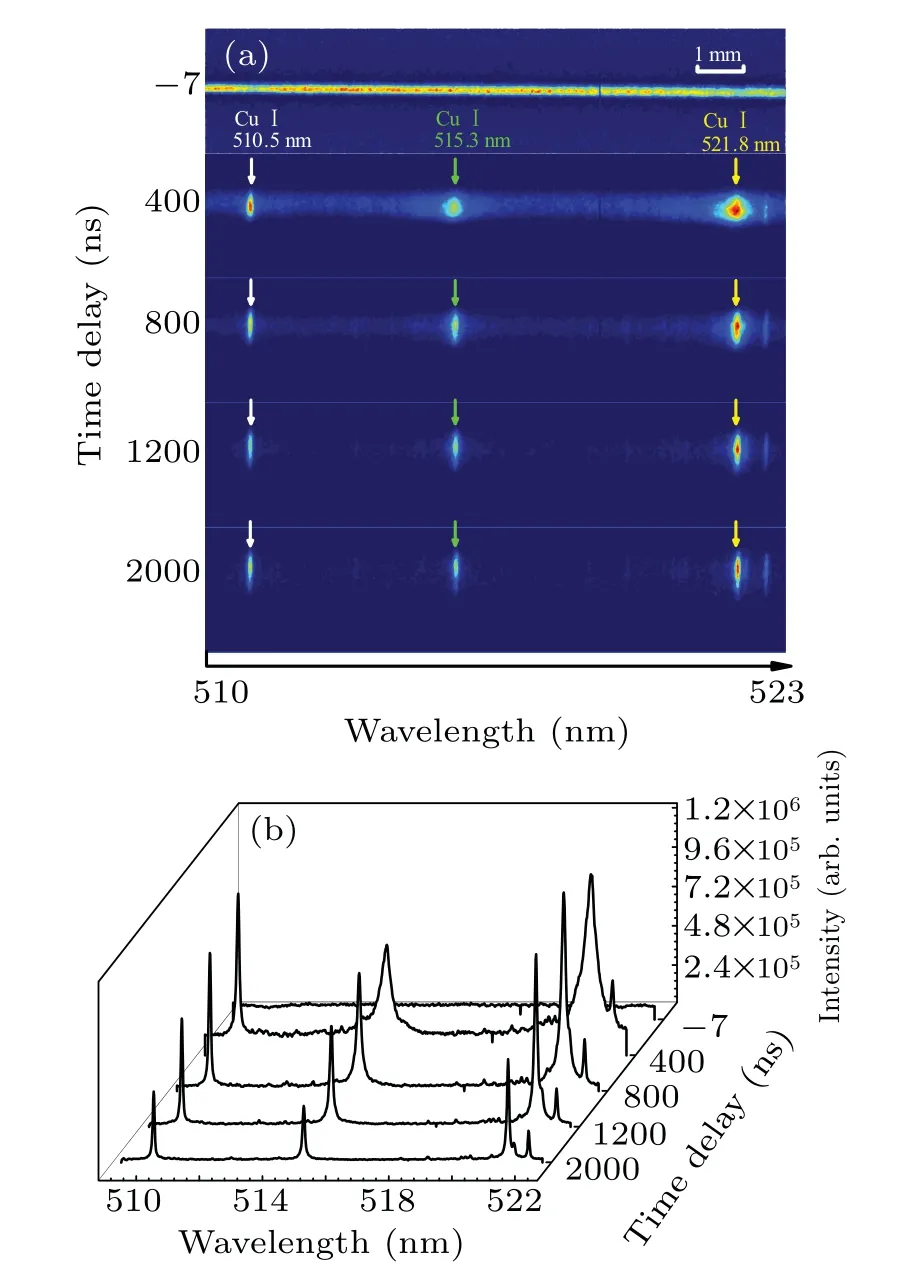
Fig.2. Spatially resolved spectral images(a)and axial integral spectra(b) of laser-induced copper–tungsten alloy plasma in the single-pulse case at different time delays.
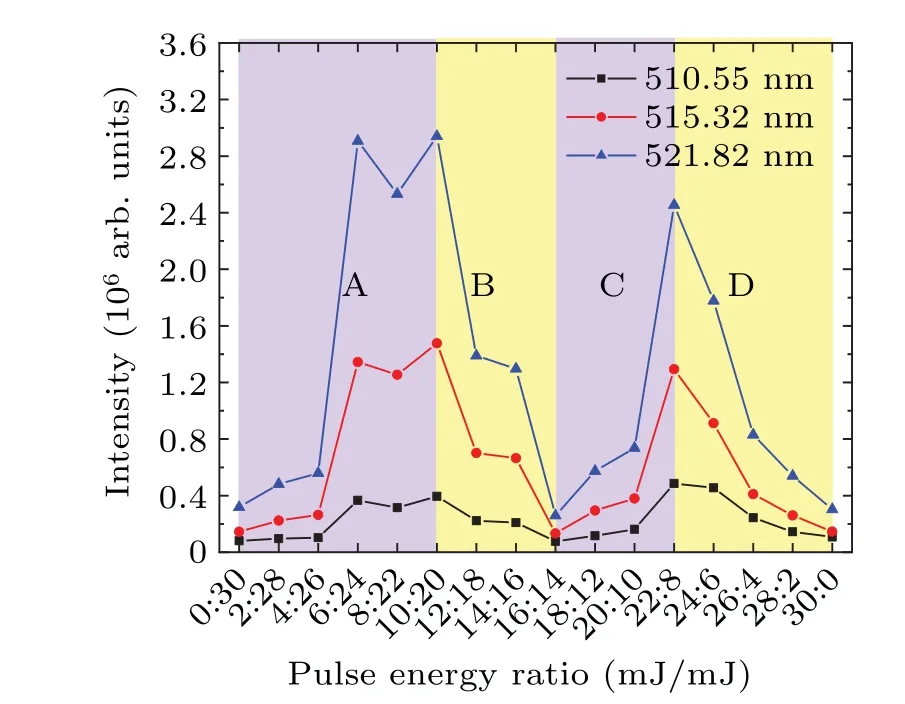
Fig. 3. Variations of the intensity of Cu I emission lines at 510.5 nm,515.3 nm and 521.8 nm with different pulse energy ratios.
The axial integral spectra at each pulse energy ratio are divided into four groups based on the above four processes,as shown in Fig. 4. Taking Cu I emission at 521.8 nm as an example, with increasing the first pulse energy, it rises to the peak 1 at 10/20, as well as the maximum, over 5 times moreintense than the single-pulse case. This result agrees well with Ahmed’s and Benedetti’s reports,[24]the maximum spectral enhancement is reached at the pulse energy ratio of~1/2,i.e.,the second pulse energy is twice of the first one(see Fig.4(a)).In the range of 10/20 to 16/14,it drops to the trough with the intensity only~16% of the peak 1 (see Fig. 4(b)). Then, it rises once more to peak 2, which is~4 times more intense than the trough. By comparison, the intensities of peak 2 are~84%,~88%, and~125% of that of peak 1, respectively,for Cu I emission at 510.5 nm,515.3 nm and 521.8 nm. Obviously,peak 1 accounts for a wider range of pulse energy ratios(6/24–10/20) (see Fig. 4(c)). Finally, the line intensity drops again since the second pulse continues to decrease from 8 mJ to 0(see Fig.4(d)). It can be seen that effects of pulse energy ratios on the change in spectral enhancement are not symmetrical, due to the nonequivalent contribution of the two laser beams.
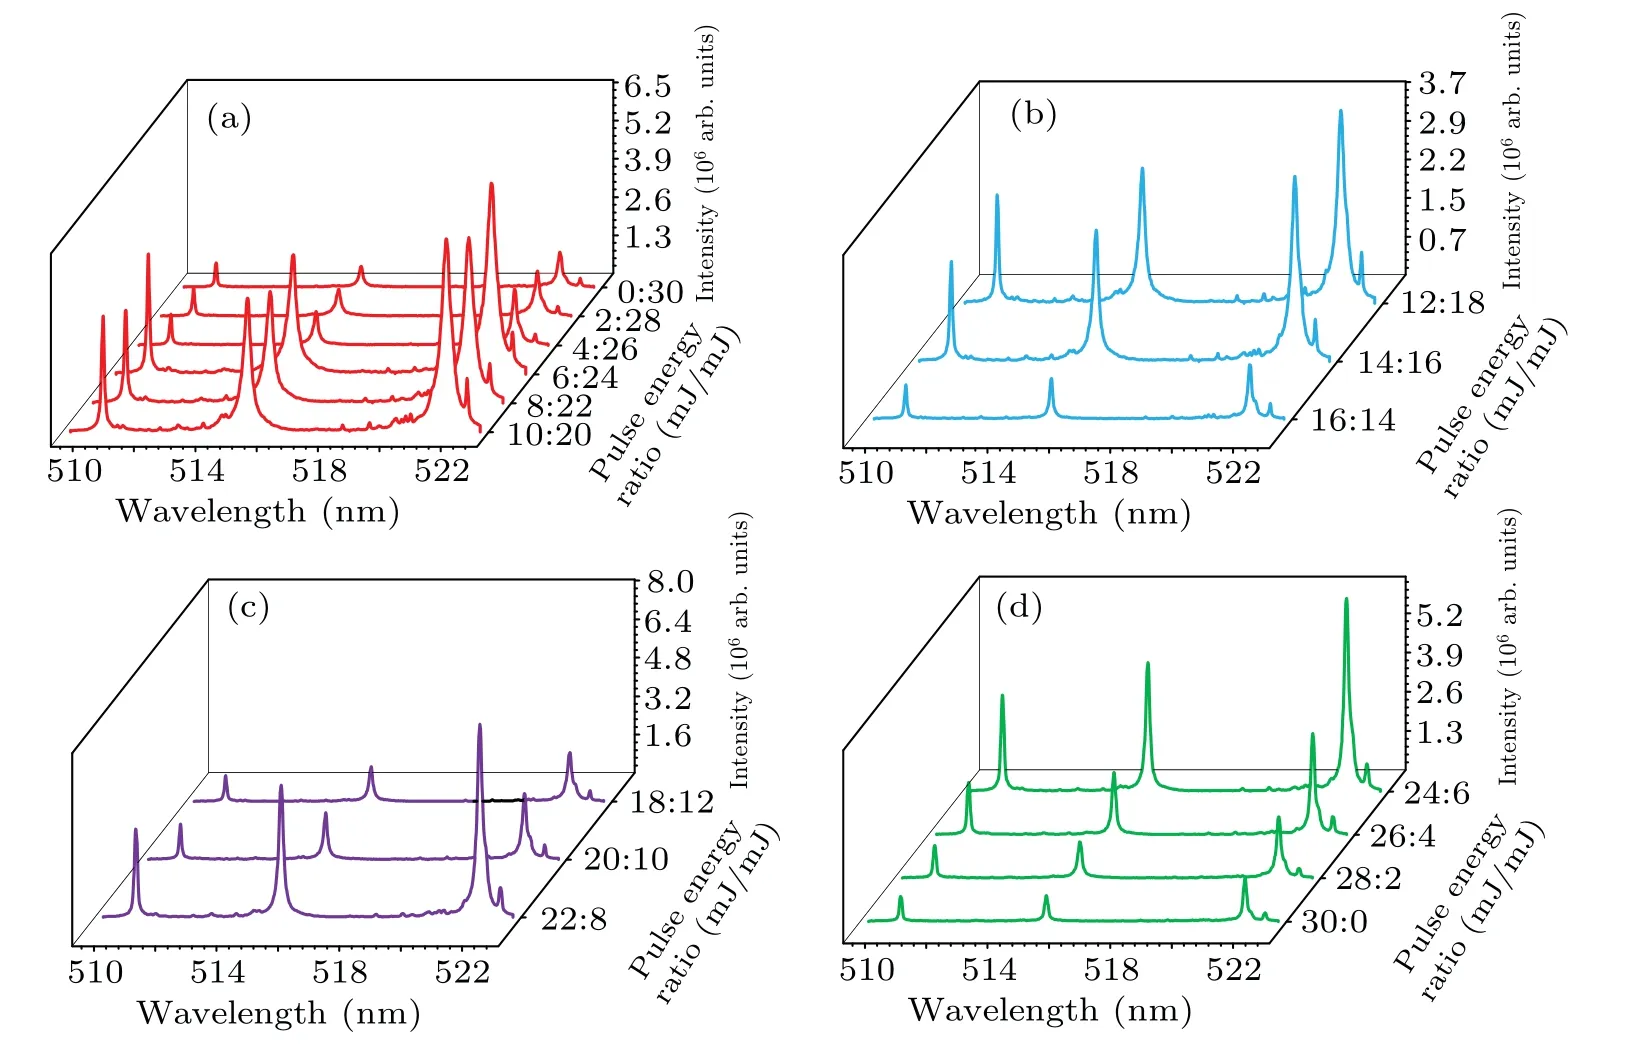
Fig.4. Variations of axially integrated spectra with pulse energy ratios for process A(a),process B(b),process C(c)and process D(d).
3.2. Plasma temperature and electron number density
In order to further explore the effect of pulse energy ratios on the mechanism of dual-pulse spectral enhancement,the variation of plasma temperature and electron number density with various time delays under 16 pulse energy ratios are calculated. By using the three Cu I emission lines, Boltzmann plots can be constructed to deduce the plasma temperature,and the relevant spectral parameters are listed in Table 1.[26]

where subscriptsijdenote the atomic transitionsi →j;nMis the atom number density;Eiandgiare the energy and degeneracy of the upper transition level,respectively,Zis the partition function;λijandAi jare the transition wavelength and transition probability;k,handcare the Boltzmann constant,Planck constant and speed of light, correspondingly;Fis an experimental factor remains constant;Ii jis the integral intensity of the emission line listed in Table 1; andTeis the plasma temperature,which can be determined from the slope of the Boltzmann plot. A typical example of constructing Boltzmann plot by linear fitting is presented in Fig.5. The temperature calculation is processed in the CGS unit system. It can be seen that the chosen lines span a large enough range in upper energy levels (abscissas) to ensure the accuracy of the temperature determination.
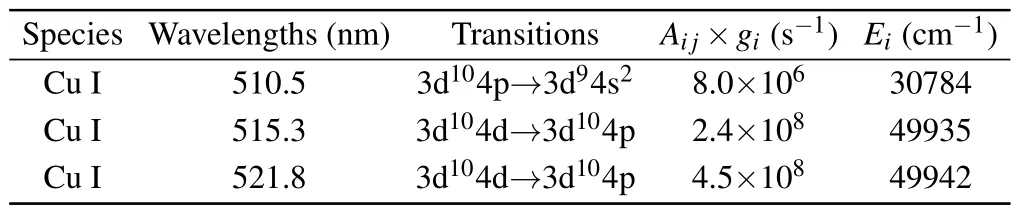
Table 1. Spectral parameters of Cu I emission lines at 510.5 nm,515.3 nm and 521.8 nm for plasma temperature calculation.
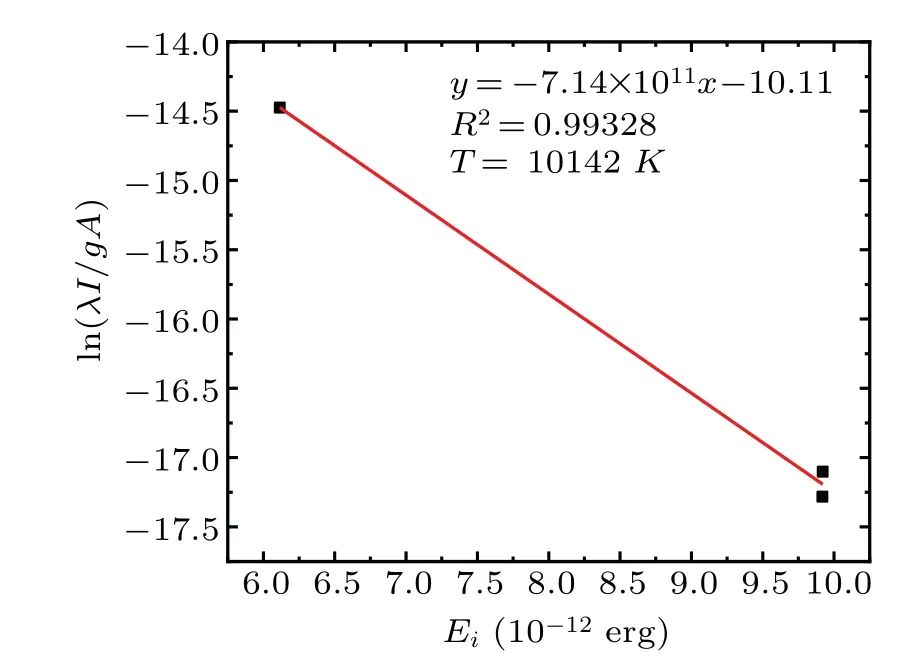
Fig.5. An example of a linear Boltzmann plot of single-pulse configuration with a time delay of 800 ns.
According to the grouping in Subsection 3.1,the plasma temperature variation with the time delay ranging from 500 ns to 2000 ns is shown in Fig. 6. For different pulse energy ratios, the plasma temperature shows an exponentially decreasing trend with increasing the time delay. From the values of the curves,as the percentage of the first pulse energy increases from 0 to 100%, it shows a similar bimodal structure as the Cu I emission intensities: it rises to peak 1 in the range of 6/24–10/20 and drops to a trough near 16/14,then rises again to peak 2 in the range of 20/10–24/6,and finally continues to drop.
For group A, the plasma temperature increases significantly with the increase of the first pulse energy share: when the time delay is 550 ns, it increases from 11307.23 K to 17024.47 K,an increase of~50%(see Fig.6(a)). As the first pulse energy increases to be comparable to the second one,it decays rapidly to 11536.56 K at 16/14,a reduction of~32%(group B,see Fig.6(b)). With further increasing the first pulse energy share, it increases slightly and achieves a maximum of 12215.93 K near peak 2 of the corresponding Cu I emission intensity, an increase of~6% (group C, see Fig. 6(c)).Regarding to group D, it shows a trend of monotonic reduction. Under time delays of 550 ns and 2000 ns,the variations of plasma temperature with different pulse energy ratios are shown in Fig.7. It can be seen that when the first pulse energy share is greater, the plasma temperature decays more slowly with time delay,showing a pattern of decreasing gap between peak 2 and peak 1, as shown in Fig. 8(a). By taking the average value of the plasma temperature for the four groups of pulse energy ratios 6/24–12/18 (near peak 1) asT1, and the average value of the three groups of 20/10–24/6(near peak 2)asT2,the variations ofT1andT2with time delay are given in Fig.8(b).
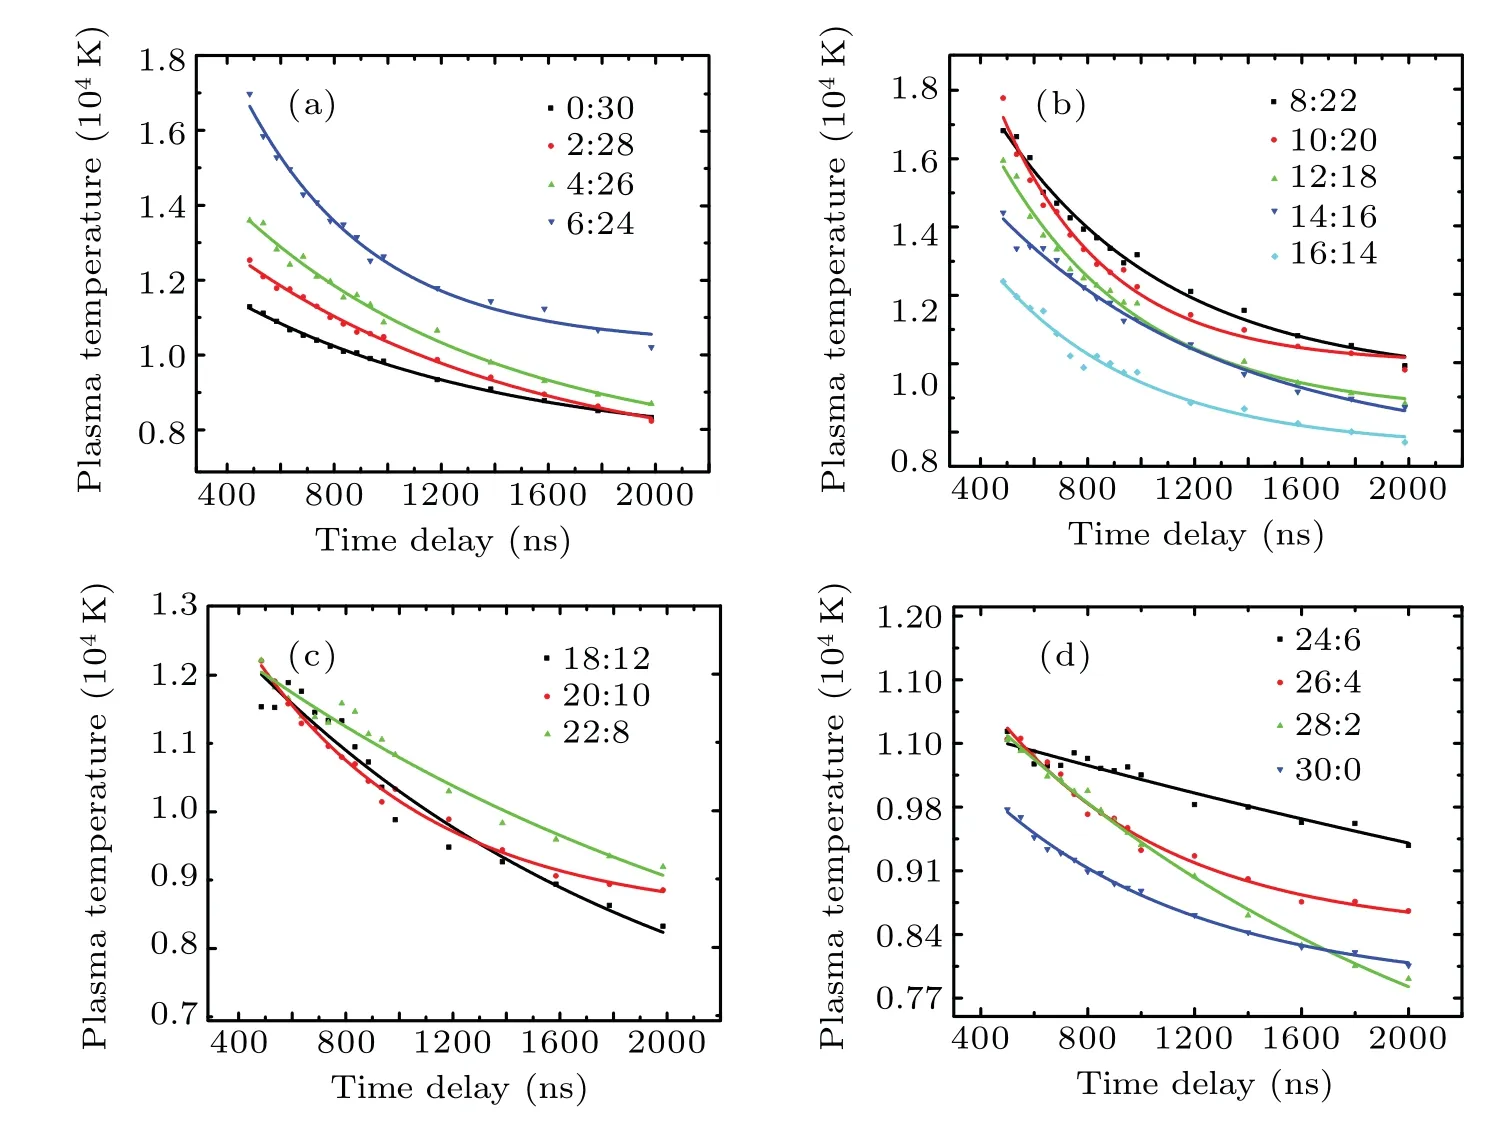
Fig.6. Variations of plasma temperature with different pulse energy ratios for group A(a),group B(b),group C(c)and group D(d).

Fig.7. Variations of plasma temperature with different pulse energy ratios at time delays of 550 ns(a)and 2000 ns(b).
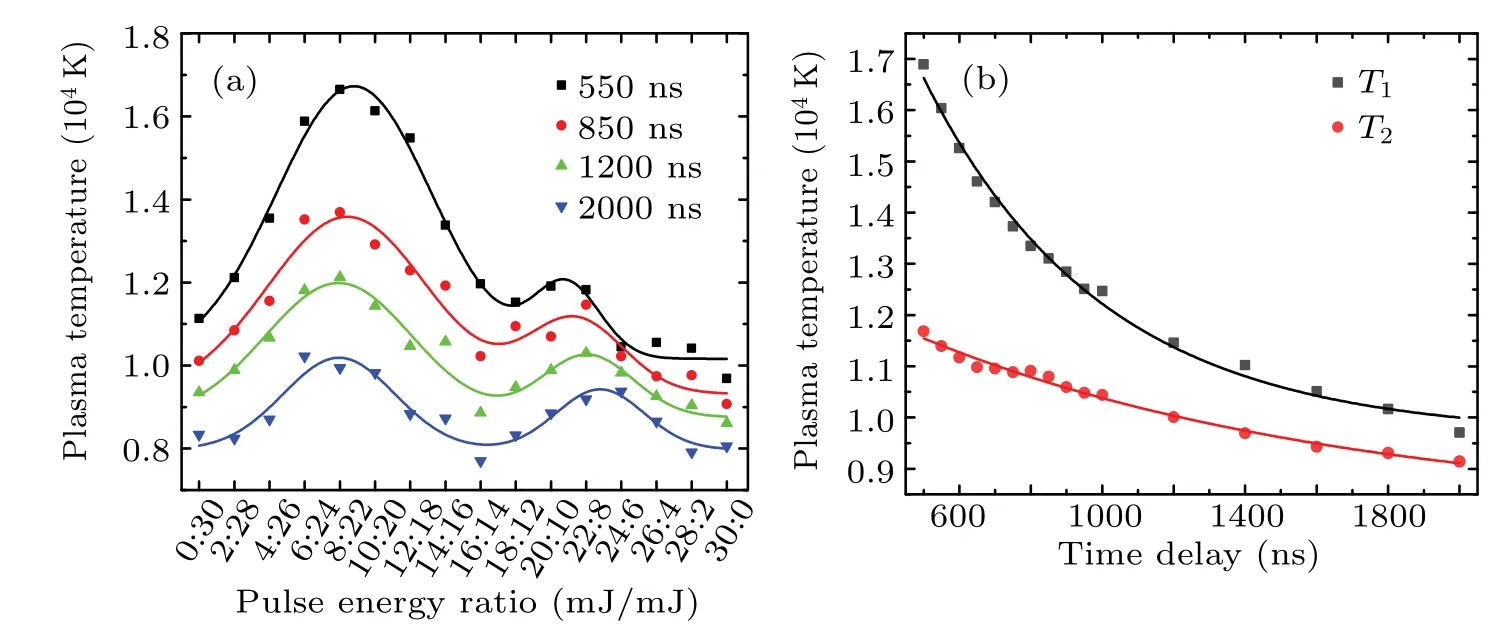
Fig. 8. (a) Variations of plasma temperature with pulse energy ratio at different time delays. (b) Variations of T1 and T2 with time delay representing the temperature peak 1 and peak 2,respectively.
Since the FWHM of emission lines is dominated by the interaction between the emitter and the micro-electric-field produced by the surrounding electrons and ions(i.e.,Stark effects), the electron number density can be deduced from the Stark broadening of emission lines, and the resulting profile always has a Lorentzian shape. In addition,the impact of electron collisions is more significant compared to that of ion collisions,thus the electron number density can be calculated from the following equation with the latter safely neglected:[27,28]
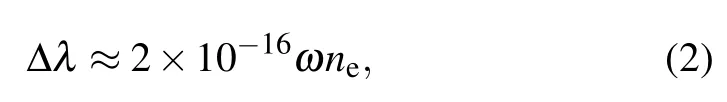
where Δλis the FWHM of the chosen line contributed by the Stark effects;ωis the Stark electron impact parameter;neis the electron number density, and the Cu I emission line at 515.3 nm is selected for the calculation. Similarly, corresponding to the grouping in Subsection 3.1,Fig.9 presents the variation of electron number density with time delay at different pulse energy ratios.

Fig.9. Variations of electron number density with pulse energy ratio for group A(a),group B(b),group C(c)and group D(d).
In group A,the electron number density increases significantly from~1.19×1017cm?3at 0/30 (single-pulse case)to~2.75×1017cm?3near the peak 1 of Cu I emission intensities under a time delay of 550 ns (see Fig. 9(a)). Then,it reduces to the trough~1.05×1017cm?3at almost dualpulse energy equalization (see Fig. 9(b)). Another small rebound is observed at 22/8, reaching~1.17×1017cm?3, after which it reduces monotonically as the first pulse energy share continues to increase to 100%(see Figs.9(c)and 9(d)).The cases of time delays of 550 ns and 1800 ns are exhibited in Fig. 10. As shown in Figs. 10 and 11(a), similar to the discussion on plasma temperature, it is observed that theelectron number density reduces more slowly with time delay.Correspondingly,the mean value of the electron number density(n1)for the four groups of pulse energy ratios 6/24–12/18,andn2for the three groups of 20/10–24/6,both of which vary with time delay are shown in Fig.11(b). It appears clear that the difference between the two peaks of electron number density decreases monotonically with time delay,n1~n2around 2000 ns.
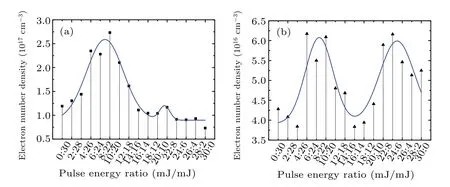
Fig.10. Variations of electron number density with different pulse energy ratios at time delays of 550 ns(a)and 1800 ns(b).

Fig.11. (a)Variations of electron number density with pulse energy ratio at different time delays. (b)Variations of n1 and n2 with time delay representing the peak 1 and peak 2 of electron number density,respectively.
In our previous work,under the condition of 450-ns interpulse delay and 18/18-mJ/mJ pulse energy ratio in dual-pulse FO-LIBS,it is demonstrated that the main mechanism of dualpulse spectral enhancement lies in the second laser improving the exfoliation of the target surface and forming a stronger second-generation plasma inside the initial plasma. Harilal claimed that the second pulse interacts with the target surface inside the initial plasma and its shockwave,which provide an appropriate low-pressure environment for the second denudation improving the ablation efficiency.[29]This is also the essential reason for spectral enhancement under extremely long inter-pulse delay(even as long as tens of microseconds). Considering that the first pulse energy in group A is much weaker,less than one-half of the second pulse, the low-density initial plasma is transparent to the incident second pulse at a time delay of 450 ns.In this context,as the first pulse energy increases from 0,the lifetime of the initial plasma is extended,improving the capacity of air compression,thus gradually being able to provide low-pressure atmosphere conditions for ablation enhancement during the second pulse of laser irradiation. Enhanced ablation can exfoliate more substance from the target surface,inducing a stronger second-generation plasma,as evidenced by the rapid increase in plasma temperature and electron number density observed in group A.As the energy share of the first pulse increases to be comparable to the second one(i.e., group B),the initial plasma density gradually increases,which causes part of the second laser to be absorbed or scattered(i.e.,plasma shielding effect)instead of reaching the target surface to participate in secondary ablation. Although the absorption of the second pulse is also conducive to spectral enhancement and plasma temperature improvement, the reduction of ablation enhancement simultaneously leads to a weak coupling of the two mechanisms,which can be the reason for the existence of the trough when the two pulse energies are comparable. When the first pulse energy is evidently higher than the second one(i.e., group C),the initial plasma density increases further,improving the absorption rate of the second pulse. In this regard,the small increase in plasma temperature is produced by significant plasma reheating effects,which also increases the electron number density.Reasonably,the plasma reheating effects tend to disappear as the energy share of the second pulse decreases to approach 0(i.e.,group D).
Based on the above work, the pulse energy ratio can be optimized to the range of 6/24–10/20 of the maximum emis-sion intensity,and the next choice is around 22/8 of the peak 2 in spectral enhancement.
3.3. Evolutionary properties of plasma dynamics
In this work, an ICCD camera is placed on the side of the plasma with the optical axis parallel to the target surface for space-time resolved acquisition of the plasma morphology.Figure 12 shows the plasma images during the first two microseconds at different pulse energy ratios with a gate width of 3 ns. The images are all averaged over 5 replicate measurements.The luminous intensity of the first 100 ns is normalized by the maximum of the images at 20-ns time delay,and that of latter 400 ns is normalized by the maximum at 400 ns.

Fig.12. Time-resolved plasma images at different pulse energy ratios.
In the case of 0/30(i.e.,single-pulse configuration),during the phase of laser–target interaction(~?7 ns to 10 ns),the plasma expands rapidly outward along the radial and normal directions to the target surface,forming a hemispherical structure. This process is mainly driven by incident laser beam and can be approximated as isothermal expansion. The longitudinal plasma luminous intensity gradually decreases with the distance from the target surface. After the end of laser irradiation,the luminous intensity of the plasma front decreases sharply due to the radiative cooling and collisions with the particles of surrounding cold air. Meanwhile, the viscous force exerted by the peripheral air on the plasma front leads to expansion deceleration. Then an oblate cylindrical plasma structure appears which has been claimed as the unique plasma morphology of FO-LIBS.[30]It has been reported the cause of this unique structure is that the laser beam fed out by the transmission fiber has a top-hat profile lowering the peak irradiance and thus reducing the ability of plasma absorbing laser energy at the early stage of its generation.[1]Therefore, the air component of the plasma front is insufficiently excited and the sharp decrease in the number density of excited particles results in a rapid dimming of the plasma front luminescence.
When the first pulse energy increases from 0 to 12 mJ,the plasma exhibits an approximately identical hemispherical structure during the laser irradiance but with diameter decreases visibly. Comparing the farthest end of the plasma front expansion at a time delay of 10 ns,the farthest distance decreases with increasing the energy share of the first pulse,which is resulted from insufficient driving of the plasma front expansion by the second pulse. After the second laser pulse ends, the overall behavior of the plasma is dominated by the second pulse,which is also evidenced by the invisibility of the initial plasma at a time delay of?7 ns.Noted that even though the luminous intensity of the initial plasma is weak to be invisible in comparison with the second-generation plasma,the initial plasma still exists, affecting the laser-target interaction and the evolution of the second-generation plasma,especially with pulse energy ratios of 8/22–12/18. In this context, the plasma gradually separates away from the target surface after a few hundred nanoseconds without forming an oblate cylindrical structure close to the target surface, which is the evidence of its generation and expansion under the low-pressure atmosphere inside the initial plasma.
As the first pulse energy is increased from 12 mJ to 24 mJ,the plasma appears as a shiny spot near the target surface after the second pulse with a time delay of 10–20 ns. After several hundred nanoseconds(>400 ns),the rear edge of the plasma near the target surface rapidly darkens,so that the plasma with a spherical structure shows a tendency to separate away from the target surface. It has been stated that the reason for the separation is that the initial plasma provides a low-pressure micro-space where the second-generation plasma generates and evolves. The low-pressure condition improves ablation efficiency and makes the overall plasma exhibit unique characteristics such as splitting and sharpening,with separation from the target surface being their specific manifestation.[25,31]In addition, compared to the case where the energy share of the first pulse is relatively small (0/30–12/18), the peak point of the plasma front position near a time delay of~10 ns becomes the trough. This is probably because the initial plasma front has expanded to a long distance(>1 mm)before the arrival of the second pulse, and the induced second-generation plasma leads to a sudden increase in the luminous intensity near the target surface,which results in the retreat of the plasma emission front after the second pulse ends. In this case,the overall behavior of the plasma is determined by the coupling of the two laser pulses.
As the first pulse energy further increases from 24 mJ to 30 mJ, the initial plasma has an oblate cylindrical shape before the arrival of the second pulse with a time delay of?7 ns.And the rear edge of the plasma is close to the target surface without separation from the target surface,due to the fact that the second pulse energy is too minimal to participate in the secondary laser ablation and drive the front expansion of the plasma. In this context, the overall behavior of the plasma is dominated by the first pulse.
Furthermore, in order to quantitatively describe the plasma front expansion process, 1/e2criterion is applied to extract the plasma front position from the recorded images:the symmetry axis of plasma is defined as the vertical line of the target surface where the maximum intensity is located,and the mean intensity of the 5 pixels on the left and right sides along the plasma symmetry axis are obtained. The plasma front is taken as the nearest position where the mean intensity is less than 1/e2of the maximum intensity. Figure 13 shows the plasma front positions with different time delays in the singlepulse case.

Fig. 13. Variations of plasma front position with time delay in the single-pulse case.
During the laser irradiation(?7 ns to 10 ns),the induced plasma expands rapidly outward with a velocity of 113.3 km/s,which is approximated as isothermal expansion.[32]When the laser irradiation ends (~20–500 ns), the emission area of the plasma front cannot obtain more energy from the incident laser, but at this time there is still radiative cooling and viscous force of the compressed air, and the temperature of the plasma front reduces significantly,thus cause luminous intensity decays rapidly. In this context,the plasma front stops expanding from the recorded images,known as the plasma stagnation phase,and the front position recedes due to the lack of air excitation in FO-LIBS, which can be considered to be a stronger plasma stagnation effect.[1]After the plasma stagnation period(>500 ns),the plasma continues to slowly expand outward,which is approximated as adiabatic expansion.[33]At this time, the continuous expansion of the plasma front leads to more air components being compressed, causing stronger reactive viscous force,which makes expansion slowly and velocity further reduced(~0.22 km/s).
Based on observation from the plasma images, the front positions with different pulse energy ratios can be divided into three groups(0/30–12/18,14/16–22/8 and 24/6–28/2),as shown in Fig. 14. In the first group, it is found that the peak expansion distance of the plasma front during laser irradiation gradually decreases with increasing the first pulse energy share at the peak values of 1.99 mm, 1.85 mm, and 1.34 mm for pulse energy ratios 0/30,6/24 and 12/18,respectively,and the corresponding expansion velocities of 113.3 km/s, 83.4 km/s and 43.5 km/s in the time-delay range of?7 ns to 10 ns. Since the expansion process is dominated by the second pulse, the decrease of the second pulse reduces the energy deposition of the second-generation plasma,and simultaneously weakens the ability to drive plasma expansion. After the end of laser irradiation,it still shows similar phenomenon of plasma front retreat with slightly reduced amplitude,but in terms of expansion distance ordering,both in the phases of plasma stagnation and the subsequent slow expansion satisfy the same rule: the larger the energy share of the first pulse,the shorter the expansion distance of the plasma front.
Regarding to the second group, when the first pulse energy becomes equivalent to the second one,instead of plasma monotonously expanding outward in the first group,the front first recedes sharply during laser irradiation and then advances rapidly shortly after the laser ends. This is consistent with observation of the plasma morphology, caused by the second pulse incidence generating a bright luminescent secondgeneration plasma near the target surface,while the luminous intensity of initial plasma front being faint. In the rapid expansion phase at the end of laser irradiance,the peak distance of plasma front expansion increases with the energy share of the first pulse,and the expansion velocity of 22/8 is the maximum in the time-delay range of 10–50 ns,reaching 6.06 km/s.The initial plasma density increases with increasing the first pulse energy, effectively improving the second pulse energy absorption to obtain greater expansion impetus. In the subsequent plasma stagnation phase with front retreat,the amplitude decreases with increasing the energy share of the first pulse,from 12.9% in 14/16 to 4.1% in 22/8. After a time delay of~500 ns, the plasma slowly expands at a similar velocity of~0.2 km/s.
In the third group, with the reduction of the secondary pulse energy from 6 mJ to 2 mJ, it is too weak to have an effect on the plasma evolution. Except for the slight retreat of the plasma front at 24/6 due to the generation of weak second-generation plasma,the plasma fronts maintain the initial plasma stagnation under the second pulse irradiation at the starting moments in the 26/4 and 28/2 configurations. After a time delay of 500 ns,the slow expansion velocity of the plasma is~0.16–0.19 km/s.

Fig.14. Variations of plasma front position with time delay at different pulse energy ratios. The first group: 0/30–12/18(a),the second group:14/16–22/8(b),and the third group: 24/6–28/2(c). The insets are enlarged views of the front positions during and after laser irradiation with time delay of tens of nanoseconds in the first and second groups.
4. Conclusions
In summary, it is found that the effects of pulse energy ratios on spectral enhancement is asymmetrical in developed collinear dual-pulse FO-LIBS. When the first pulse share increases from 0 to 100%, the variations of spectral intensities show a bimodal structure. The first peak of spectral enhancement appears in the range of 6/24 to 10/20 of pulse energy ratios,where the intensities are more than 5 times stronger than the single-pulse case. The second peak occurs near 8/22. A minimal enhancement is obtained at 16/14.
The plasma temperature and electron number density are estimated by using the spectral images from OES, both of which show a similar bimodal structure. When the time delay is 550 ns, the plasma temperatures at peak 1 and peak 2 reach 17024.47 K and 12215.93 K compared with 11307.23 K in the single-pulse case, while the electron number densities are~2.75×1017cm?3and~1.17×1017cm?3in contrast to~1.19×1017cm?3. With increasing the first pulse energy, the initial plasma first gradually strengthens, enhancing air compression to provide a proper low-pressure atmosphere for secondary ablation; then, as the initial plasma density increases, the absorption of second pulse by the initial plasma increases,weakening secondary ablation while enhancing the plasma reheating effect. Therefore, there is a transition from the ablation enhancement dominance for peak 1 to the plasma reheating dominance for peak 2,and the trough between peak 1 and peak 2 is produced by the weakening in coupling of the two mechanisms.
The evolution of plasma dynamics is tracked by using fast imaging. From 8/22 to 24/6,the rear edge of the plasma is observed to gradually separate from the target surface in a few hundred nanoseconds(>400 ns),demonstrating the existence of a low-pressure ambient micro-space induced by the initial plasma. For the plasma front expansion, from 0/30 to 12/18,the farthest distance decreases from 1.99 mm to 1.34 mm during the laser irradiation (?7 ns to 10 ns), while after the end of laser irradiation(~20 ns to 500 ns),the front fades rapidly.As for the range from 14/16 to 22/8, the plasma front fades sharply in the beginning presenting a shiny spot near the target surface, which is caused by the generation of bright secondgeneration plasma. Regarding the case of larger first pulse,the plasma almost keeps the oblate cylindrical structure of the initial plasma close to the target surface. It is demonstrated that as the energy share of the first pulse increases, the initial plasma changes from weak to intense,and the influence of the second pulse gradually weakens, suggesting a transformation of dual-pulse excitation mechanisms.
Acknowledgement
The authors are grateful for the Foundation Research Project of Jiangsu Province,China(the Natural Science Fund No.BK20190187).
猜你喜歡
課外生活·趣知識(shí)(2023年9期)2023-10-08 19:14:56
發(fā)明與創(chuàng)新(2022年30期)2022-10-03 08:40:08
發(fā)明與創(chuàng)新(2022年21期)2022-06-14 08:22:10
發(fā)明與創(chuàng)新·小學(xué)生(2022年10期)2022-05-30 10:48:04
中華養(yǎng)生保健(2022年10期)2022-05-23 03:17:39
發(fā)明與創(chuàng)新(2022年18期)2022-05-18 14:55:32
家庭科學(xué)·新健康(2022年3期)2022-05-10 00:32:13
小學(xué)生學(xué)習(xí)指導(dǎo)·爆笑校園(2021年6期)2021-07-12 18:44:04
作文評(píng)點(diǎn)報(bào)·低幼版(2014年42期)2014-11-03 23:41:00
Chinese Journal of Chemical Engineering(2014年1期)2014-07-18 11:56:06

- Chinese Physics B的其它文章
- A broadband self-powered UV photodetector of a β-Ga2O3/γ-CuI p-n junction
- High-sensitive terahertz detection by parametric up-conversion using nanosecond pulsed laser
- High efficiency,small size,and large bandwidth vertical interlayer waveguide coupler
- High-fidelity resonant tunneling passage in three-waveguide system
- An analytical model for cross-Kerr nonlinearity in a four-level N-type atomic system with Doppler broadening
- Determine the physical mechanism and source region of beat wave modulation by changing the frequency of high-frequency waves