
Surrogate potency assays:Comparison of binding profiles complements dose response curves for unambiguous assessment of relative potencies
2018-04-17 02:46:06RobertKarlssonVeronicaFridhsaFrostell
Robert Karlsson,Veronica Fridh,?sa Frostell
Purif i cation and Analysis,GE Healthcare Life Sciences,Uppsala,Sweden
1.Introduction
During early antibodydevelopment,surfaceplasmonresonance(SPR)is widely used for epitope binning and for kinetic characterization of candidates[1,2].Selected candidates may further be characterized with respect to Fcγ-receptor[3–5]and FcRn binding[6,7].An array of SPR binding data(antigen,Fc-receptors and C1q)related to the molecular mechanisms of action[8–10]may therefore be available for a candidate that enters clinical studies.This is in line with FDA guidelines on biosimilars[11],which state that functional assays should ref l ect mechanisms of action as far as possible and that multiple functional assays can be performed as part of the analytical similarity assessment.The same reasoning can be applied to any biotherapeutic medicine and is not only valid for biosimilars.When the manufacturing process is developed,and later during production,the analytical focus may shift from detailed characterization to assays that aim to ensure the maintenance of binding properties of the drug substance and drug product.By comparison to a reference preparation of the drug,it should also be possible to determine drug potency to ensure correct dosage.For this purpose,SPR assays based on dose response curves related to Fc-receptor[12],antigen[13]or hemagglutinin content in the inf l uenza vaccine[14]have been described;the Fc-receptor assay involved the capture of histidine tagged receptor;the antigen assay was based on the covalent binding of antigen to the sensor surface;and the hemagglutinin assay employed the capture of biotinylated synthetic glycans to neutravidin surfaces.
The purpose of this study is to illustrate new possibilities with SPR assays for binding activity measurements.We describe the use of reversible biotin capture to establish dose response curves for the measurement of relative potency via PLA and EC50 analysis and illustrate this using anti-TNF-α antibodies.This assay is extended to demonstrate how SPR can be used to monitor both antigen and receptor binding in a single assay setup.By combining analysis of dose response curves with sensorgram comparison,introduced[15]for single analyte comparisons and here extended to multiple injections,we demonstrate that the shortcomings of PLA or EC50 analysis,which may not always be able to detect changes in critical quality attributes,can be remedied.Finally,we describe the use of calibration free concentration analysis(CFCA)[16,17]as an alternative to EC50 analysis for the analysis of stressed anti-TNF-αantibody samples.
2.Materials and methods
2.1.Equipment and software
Biacore?T200 system(GE Healthcare,Uppsala,Sweden)with Control software version 2.0.2 and Evaluation software version 3.1 was used for interaction analysis.
2.2.Sensor chips,reagents and buffers
The Biotin CAPture Kit,including Sensor Chip CAP,Biotin CAPture reagent and regeneration solutions,Sensor Chip PEG,Recombinant MabSelect? SuRe? ligand,anti-TNF-α antibody,amine coupling kit and PBS-P+Buffer 10×(0.2 M phosphate buffer with 27 mM KCl,1.37 M NaCl and 0.5%Surfactant P20(Tween 20))were from GE Healthcare.Recombinant biotinylated human TNF-α(Val 77-Leu 233)was from ACRO Biosystems(Beijing,China),recombinant human TNF receptor I protein was from Abcam(Cambridge,United Kingdom),recombinant human FcγRIIIa Val 158 and FcγRI expressed in CHO cells were kind gifts from Boehringer-Ingelheim,and bovine serum albumin(BSA)was from Sigma-Aldrich(Stockholm,Sweden).
2.3.Biotin capture assay procedures
The sample compartment of the Biacore T200 system was set to 20 °C,the analysis temperature to 25 °C,and the data collection rate to 1 Hz.PBS-P+was used as the running buffer.In each cycle,biotin capture reagent was injected for 300 s at a f l ow rate of 2 μL/min,followed by a 30–60 s capture of biotinylated TNF-α at 1–2 μg/mL in PBS-P+with 0.5%BSA,to reach minimum capture levels of around 40 RU.Anti-TNF-α antibody,0.02–360 μg/mL in PBS-P+,was injected for 120 s and the surface was regenerated at the oligonucleotide level per kit instructions.To study antibody binding to both the captured antigen and a receptor in the same assay,an additional sample injection of receptor was included.Receptors,FcγRIIIa Val 158,FcγRI and TNF-α receptor,were injected for 60 s at concentrations of 5 μg/mL,5.4 μg/mL and 10 μg/mL,respectively.
Heat stressed antibody samples were analyzed after exposing the antibody at 1 mg/mL to 60°C for 1,2 or 3 h prior to analysis.
Data analysis was performed using Microsoft Excel as described in section 2.4 and with the sensorgram comparison functionality in Biacore T200 evaluation software version 3.1.
2.4.PLA and EC50/IC50 analysis
For PLA and EC50 analysis,response and concentration data from the Biacore assay were pasted into Microsoft Excel.
For determination of EC50 and IC50 values,the equation

was used to calculate response curves.Rhi(response high)and Rlo(response low)are response values at the upper and lower asymptotes,and A1 corresponds to EC50/IC50 and A2 to the Hill slope.A response curve was first calculated using default values for each parameter.The solver(Data/Solver in Microsoft Excel)functionality using the evolutionary solving method was then used to find parameter values that minimized the squared difference between the observed Biacore data and data calculated from the four-parameter equation.The parameter values at this minimum constitute the result.
For PLA the slope and intercepts of the parallel line were calculated using data regression(Data/Data analysis/Regression in Microsoft Excel)with input of response values(y),log(conc)(x1)and a curve differentiating parameter,(x2).X2 was set to 1 for the reference sample and to 0 for the new sample.The concentration values in PLA typically ranged from 0.5 to 1.5 times of the EC50.Relative potency values were calculated based on EC50 ratios and in PLA on the difference in intersect with the log(conc)axis.
2.5.Simulation of dose response curves
Response data for a 1:1 interaction model were calculated from the equation
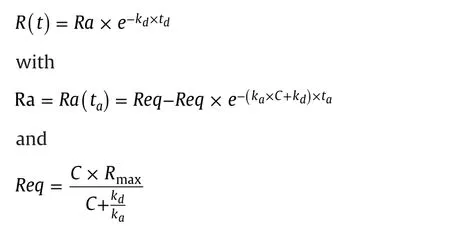
where tais the interaction time,tdis the dissociation time,Rmaxis the maximum binding capacity,C is the concentration,kais the association rate constant,and kdthe dissociation rate constant.The equations were used to calculate dose response curves in Microsoft Excel.Input parameters in the simulations were ka,kd,Rmax,taand td.From these inputs,dose response curves with 18 data pointscovering the concentration range from kd/ka:32 to kd/ka×4096(two-fold concentration change between points)were calculated.By designing for the separate input,of kaand kdvalues to one reference curve and three sample curves,four dose response curves were directly displayed in the same graph.By varying the injection time,ta,the impact of interaction time on the position of the dose response curve could be studied,and by varying the dissociation time,the effect of dissociation could be observed.
The 1:1 binding model used in simulations assumes that analyte A in solution binds to an immobilized/captured binding partner B to form an AB complex.The same model can be used in cases where the immobilized ligand has several identical binding sites,e.g.antigen binding to immobilized antibody.Only the Rmaxvalue must be adjusted to reflect this situation.However,if the analyte has multiple binding sites for the immobilized ligand,binding becomes more complex and involves several rate constants.The most striking effect is that the observed dissociation rate becomes slower as the analyte remains bound even when one binding site is released.This is typically the case for a bivalent antibody binding to an immobilized antigen.
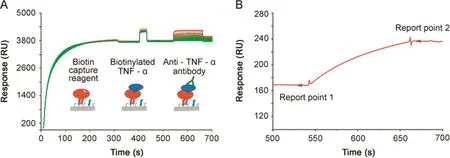
Fig.1.Biotin capture assay set-up.(A)In the biotin capture assay,the biotin capture reagent(streptavidin modified with an oligonucleotide)is first injected and hybridizes to the Sensor Chip CAP containing a complementary oligonucleotide.Biotinylated TNF-α is then injected(here 1 μg/mL)to reach a defined RU level(in this example around 40 RU)followed by the injection of an anti-TNF-α antibody at varying concentrations(range 0.02–360 μg/mL).The figure is an overlay plot of 128 analytical cycles and shows binding events in the active f l ow cell.The color coding refers to two users.(B)Samples are injected over both active and reference spots.Biotinylated TNF-α is not present on the reference spot.Reference subtraction removes the buffer effects seen as an offset during antibody injection in Fig.1A.In Fig.1B,the antibody binding part of one representative reference subtracted sensorgram is shown.The antibody response is calculated from the difference in binding levels:Report point 2 minus Report point 1.
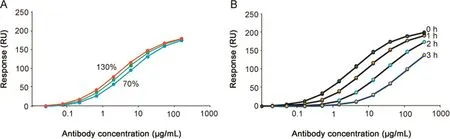
Fig.2.Dose response curves for PLA and EC50 analysis.(A)Antibody response levels,obtained with concentrations corresponding to 130%,100%and 70%of the nominal concentrations,plotted versus nominal(100%)concentration values.(B)Antibody response levels obtained with unstressed(0 h stress)and stressed samples(1,2 and 3 h)plotted versus the antibody concentration.For PLA and EC50 PLA analysis,see Table 3.
2.6.CFCA assay procedures
The sample compartment temperature of the Biacore T200 system and the analysis temperature were set to 25°C and the data collection rate to 10 Hz.PBS-P+was used as running buffer.
CFCA was performed on stressed and non-stressed antibody samples using two different ligands:TNF-αand MabSelect SuRe.With this,it was possible to compare the effects of heat stress paratope and on the Fc-domain.
TNF-αand MabSelect SuRe ligand were immobilized on the Sensor Chip PEG using amine coupling.Immobilizations were performed at 25°C per kit instructions except for the following:for immobilization of TNF-α,the surface was activated by EDC/NHS for 15 s only.TNF-α at 10 μg/mL in 10 mM acetate buffer(pH 5.0)was injected for 7 min and the remaining NHS-esters were blocked by injecting the ethanolamine solution for 7 min.For immobilization of SuRe ligand,the surface was activated by EDC/NHS for 10 s,SuRe ligand at 1 mg/mL in acetate buffer(pH 5.0)was injected for 7 min and the surface was blocked with ethanolamine for 7 min.These procedures resulted in immobilization levels of 1,550 and 730 RU for TNF-αand SuRe ligand,respectively.
Antibodies were diluted to a nominal concentration of 10 nM and further diluted 2,4 and 8 times in running buffer.Each antibody concentration was injected for 36 s using f l ow rates of 5 and 100 μL/min.
Surfaces immobilized with the SuRe ligand were regenerated with a 30 s injection of 10 mM glycine(pH 1.5),and surfaces with immobilized TNF-αwere regenerated with a 30 s injection of 3 M magnesium chloride.
The TNF-α surface required 5–10 start-up cycles with antibody injections prior to sample injections.The dilution series were globally fitted using the CFCA functionality in Biacore T200 evaluation software v 3.1.For the analysis,a diffusion coefficient of 4.0×10⁻¹¹m2/s and an antibody molecular weight of 144,000 Da were used.The concentration of non-stressed samples was set to 100%and relative concentration values were calculated for stressed samples.
3.Results and discussion
3.1.Repeatability of biotin capture procedure
The set-up of the biotin capture assay and an overlay plot comprising 128 full analytical cycles of the interaction between TNF-α and anti-TNF-α antibody is shown in Fig.1A.The color coding represents data obtained by two users and was introduced to detect user-dependent differences.User 1 and user 2 injected broad and partly overlapping antibody concentration series and used three and four replicates of the antibody injections,respectively.
At the the baseline level,the buffer flowed over the Sensor Chip CAP,a sensor chip with pre-immobilized oligonucleotide.Upon injection of the biotin capture reagent,streptavidin modified with the complementary oligonucleotide,hybridization occurred on the surface resulting in the capture of approximately 3,700 RU.Antigen was then captured(between 35 and 40 RU)following a short injection of biotinylated TNF-α at 1–2 μg/mL.Anti-TNF-α antibody at varying concentrations were then injected,resulting in conconcentration-dependent response levels.Fig.1B demonstrates how report points before and after the antibody injection were used to def i ne antibody responses that were used to create dose response curves.
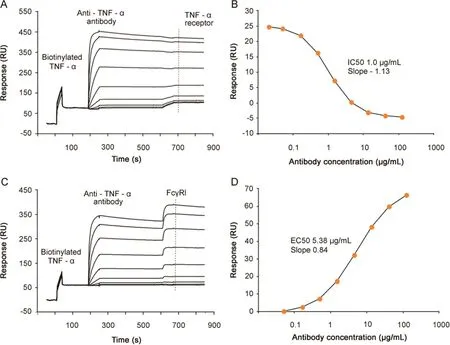
Fig.3.Dual potency assays.(A)Dual potency assay with anti-TNF-α antibody,injected at varying concentrations(0.02–120 μg/mL),binding to biotinylated TNF-α captured on the sensor surface,followed by injection of TNFα-receptor(10 μg/mL)binding to free TNF-α.The dashed line shows the position from where the receptor response is obtained.(B)Reference subtracted TNF-α-receptor response plotted versus antibody concentration.The IC50 value was 1.0 μg/mL and the Hill slope-1.13.(C).Dual potency assay with anti-TNF-α antibody,injected at varying concentrations(0.05–120 μg/mL),binding to biotinylated TNF-α captured on the sensor chip,followed by injection of FcγRI(5.4 μg/mL).The dashed line shows the position from where the receptor response is obtained.(D)Reference subtracted FcγRI response plotted versus antibody concentration.The EC50 value was 5.38 μg/mL and the Hill slope 0.84.
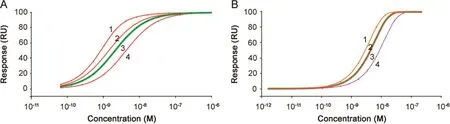
Fig.4.Simulated dose response curves.Simulated dose response curves demonstrate how changes in concentration and kinetic rate constants shift the dose response curve.Response levels were obtained after 100 s interactions on surfaces with a maximum binding capacity of 100 RU.In Fig.A,the interaction is characterized by rapid dissociation and in Fig.B,the dissociation is much slower.(A)Curve 3 marked with a thick green line is the reference.This dose response curve was obtained with ka1.2×107M-1s-1and kd2.5×10-2s-1.In curve 1,the dissociation rate constant was four times lower than that of the reference.In curve 2,the concentrations were doubled but still plotted versus the nominal concentration of the reference.In curve 4,the association rate constant was changed to half the value of that of the reference.(B)Curve 3 marked with a thick line is the reference.This dose response curve was obtained with ka1.6×106M-1s-1and kd8.5×10-5s-1.In curve 1,the concentrations were doubled but still plotted versus the nominal concentration of the reference.In curve 2,that overlaps almost completely with the reference curve,the dissociation rate constant was changed to 3.4×10⁻⁴s-1(four times faster than that of the reference).In curve 4,the association rate constant was two times lower than that of the reference,i.e.8.0×105M-1s-1.In both A and B changes in concentration and association rate constant shifted the dose response curves and hence the EC50 values.The impact of changes in the dissociation rate constant varied,and was significant for high dissociation rate constants but negligible for low dissociation rate constants.
Response levels for biotin capture reagent and biotinylated TNF-αinjections were repeatable with coefficient of variations(CV)of less than 1.2%Table 1.Very repeatable antigen capture levels are important for assay performance and were obtained here by the addition of 0.5%BSA to the TNF-αsolution.Similarly,Table 2 shows that CV values are below 1%for antibody injections except at the lowest concentrations,where response levels were very low.CVs for these concentrations were less than 15%.
These results demonstrate that antibody concentrations up to 360 μg/mL can be used for dose response curves and that three replicates are sufficient,as the assay performance was notmarkedly improved by using four replicates,although CVs were slightly lower with four replicates.
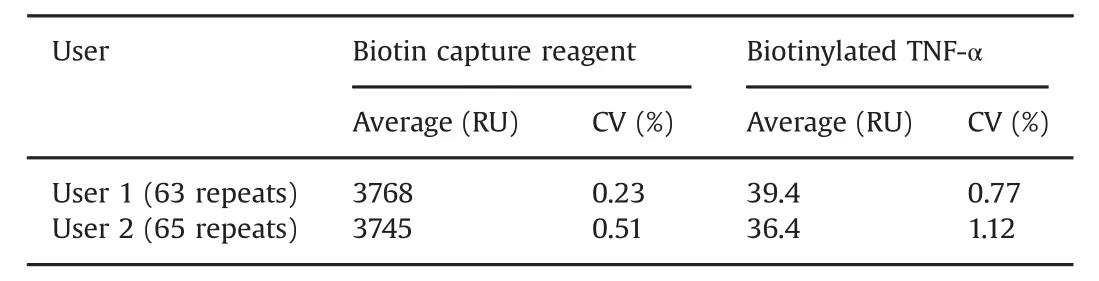
Table 1 Reproducibility of capture steps.Data were collected on two Biacore T200 systems and on two different Sensor Chip CAP.Hybridization of the biotin capture reagent shows reproducibility over Biacore systems and sensor chips.The small variation between users in capture of biotinylated TNF-α may be due to individual reagent preparations being used.
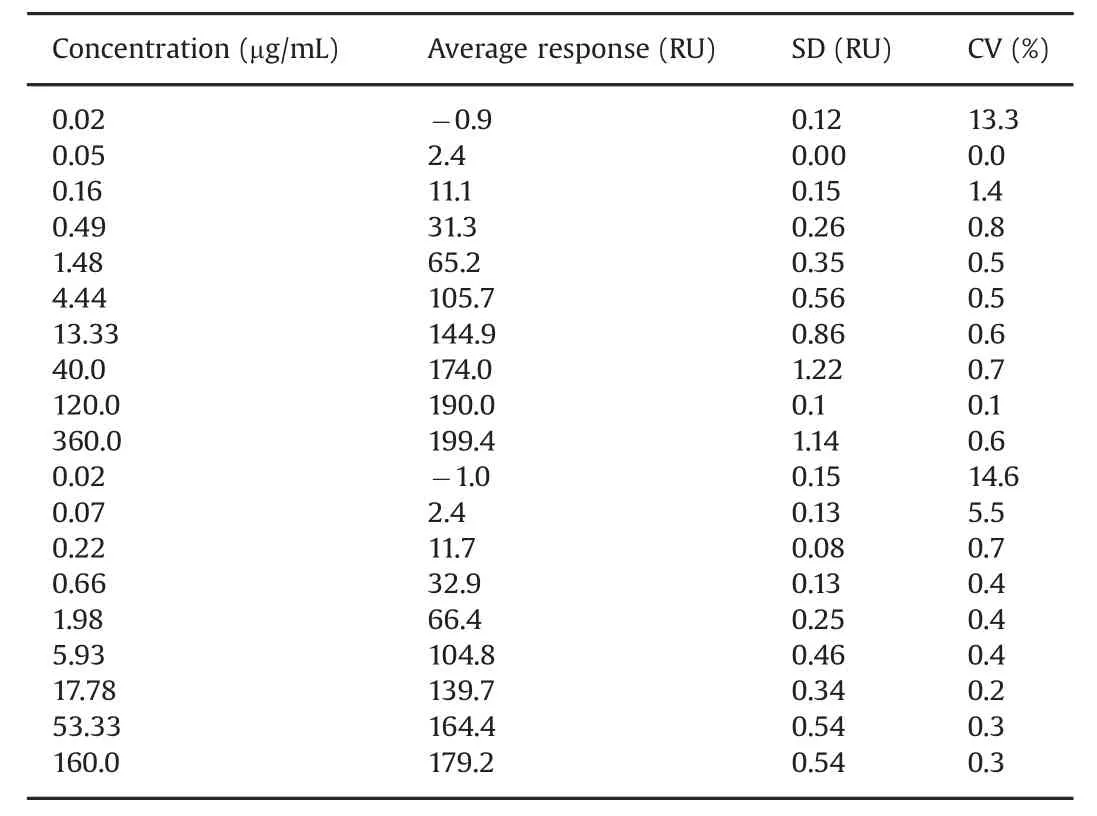
Table 2 Response values from concentration series.Data from two overlapping concentration series generated by users 1 and 2.Note that user 1 and user 2 set up the assay using slightly different concentration series and a different number of replicates for each antibody concentration.Average values for series one(0.02–360 μg/mL)were based on three replicates and for series 2(0.02–160 μg/mL)on four replicates.Except for very low response values,CVs were less than 1%.
The use of biotin capture can clearly provide reproducible data.A distinct advantage with this approach is that the need for assay development is minimized because biotin capture is reversible.This is important from a perspective of case.For assays based on covalent immobilization[13],immobilization and regeneration conditions have to be developed.Similarly,for capture of biotinylated molecules to streptavidin or neutravidin[14]regeneration conditions must be found.However,these steps are not necessary with the current approach as they are part of the kit design.In theory,histidine capture as described by Harrison et al.[12]can also reduce assay development efforts but in contrast to biotin capture,molecules captured through a histidine tag may dissociate more rapidly from the sensor surface[18];therefore,a histidine capture approach sometimes has to be abandoned.
3.2.PLA and EC50 analysis of dose response curves
The effect on the position of the dose response curve after deliberate changes in antibody concentrations was investigated Fig.2A.As expected,higher concentrations shifted the dose response curves to the left,and lower concentrations shifted the dose response curve to the right.The assay was further able to detect stress-induced changes in the antibody as shown in Fig.2B.
The relative potency dropped with increasing stress,and was about 40%of the untreated reference already after 1 h of stress.Relative EC50 and relative potency values from PLA(Table 3)concurred and indicated that the shift in relative potency was linear and that PLA could be performed over a range of antibody concentrations surrounding the EC50 value for each sample.
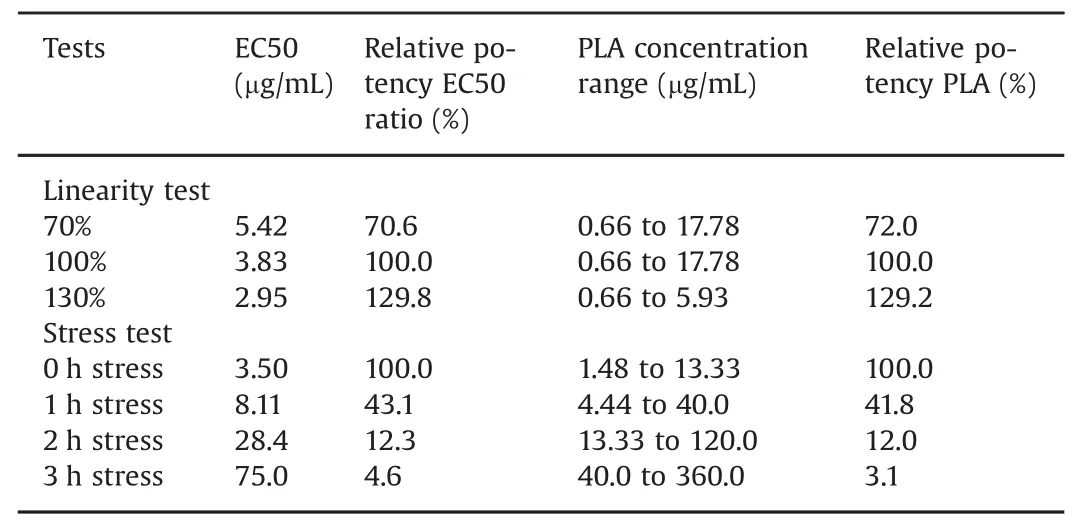
Table 3 EC50 and PLA values.PLA and EC50 analysis are in good agreement using a broad range of concentrations.In the PLA analysis,the ratio between the standard errors of slopes and intercepts with respective parameter values were calculated.The relative standard error in common slopes was less than 1%and the largest relative standard error in any intercept was 9%(range 1.2%–9.0%).In the stress test,the relative standard error in common slopes was close to or less than 1%and the largest standard error in any intercept was 7.2%(range 0.85%–7.2%).All regression coefficients were larger than 0.99.
In conclusion,the assay based on the capture of biotinylated TNF-α was repeatable and the relative potency values could be calculated from PLA and EC50 analysis.Furthermore,EC50 values proved linear with respect to changes in concentration,and relevant data were obtained with stressed samples.At this stage we considered the assay as “f i t for purpose”but not validated per ICH guidelines[19]since this would require further investigations on dependence of different lots of materials and a stricter SOP for the assay with defined acceptance criteria for different assay steps.
3.3.Analysis of several critical quality attributes in a single assay
Therapeutic anti-TNF-αantibodies function by blocking sites on TNF-α to prevent the binding of TNF-α to its receptors[20].Additionally,binding of anti-TNF-αantibodies,such as infliximab,to FcγRIIIa has been implicated in Crohns disease[21]whereas enhanced levels of FcγRI may reduce the efficacy of infliximab in inflammatory bowel diseases[22].The mechanisms of action for anti-TNF-αbiotherapeutics and the links to molecular properties may not be fully understood[23],but may potentially be linked to epitope specif i city or Fc-functionalities.
By including a second injection of receptor after the antibody injection in the biotin capture assay described above,we performed proof-of principle studies to determine potency values related to several antibody functions in a single sensorgram.
A fixed concentration of TNF-αreceptor I was injected after each antibody concentration Fig.3A.No binding of TNF-αreceptor to captured TNF-αwas seen after high antibody concentrations,whereas receptor binding was clearly visible at low antibody concentrations,verifying that the antibody could block receptor binding to TNF-α.By plotting the receptor response versus antibody concentration(Fig.3B)an IC50 of 1.0 μg/mL was determined.Similarly,binding of FcγRI increased with increasing antibody concentrations(Fig.3C)and from a plot of receptor response versus antibody concentration an EC50 value of 5.38 g/mL was determined for FcγRI-binding(Fig.3D).These results indicate that SPR can be used to quickly define an array of potency data in order to provide a comprehensive potency profile of the antibody.As long as the antibody does not dissociate from the antigen surface,this type of assay may be extended to include additional binding events.In such a scenario,receptors that dissociate rapidly,such as FcγRII,can be injected first,followed by injections of higher affinity receptors.
Sequential binding of a bispecific antibody to immobilized antigen 1 followed by antigen 2 binding has been reported previously[13].In that paper,data were combined to derive a single potency value for antibody-antigen binding.Here we extend the analysis beyond antigen binding and demonstrate sequential binding in competitive(TNF-α receptor)and secondary(FcγRI)modes.Thus,from a single assay,potency values for both antibody binding to antigen and receptor binding to antibody(Fig.3)can be derived.
3.4.Simulation of dose response curves
With potency and relative potency values determined from dose response curves,it is essential that the underlying data accurately reflect a concentration but not changes in binding properties.This is because changes in binding properties may not be compensated for by adjusting the dose.
The impacts of changes in either concentration or in binding kinetics on the shape and position of dose response curves were investigated by simulating interaction data(see Section 2.5 for equations).Two cases presented in Fig.4 were considered.In both simulations,the binding capacity was set to 100 RU,the injection time to 100 s,and the dissociation time to 0 s.These response levels and injection times reflect a practical experimental design.
In Fig.4A,response values for the reference sample were calculated based on inputs of kinetic data resembling the binding of Interferon-α 2a to its receptor[15]with ka1.2×107M-1s-1and kd2.5×10-2s-1.This represents a fairly unstable interaction with a half time of the complex of less than 30 s.Furthermore,with an injection time of 100 s,binding levels are close to steady state.In Fig.4A,curve 3 marked with a thick line corresponds to the reference.In curve 1,the dissociation rate constant was changed to 6.25×10⁻³s-1,i.e.the binding was four times more stable than the reference.The shift of curve 1 to the left and the altered slope reflect the higher affinity obtained with this condition.For curve 2,the concentrations were doubled but still plotted versus the nominal concentration of the reference.Again,the curve was shifted to the left as higher response values were obtained in the simulation.In curve4,the association rate constant was 6.0×10⁶M-1s-1,i.e.half the value of the reference.In this case the curve was shifted to the right reflecting a lower affinity.
In the second simulation,an interaction characterized by significantly higher binding stability(slower dissociation rate,Fig.4B)was studied.Input values for the reference sample resembled TNF-α binding to anti-TNF-α antibody with rate constantska1.6×106M-1s-1and kd8.5 ×10-5s-1.For this case the half time of the complex is 136 min,but with an injection time of 100 s,response levels are far from steady state.In Fig.4B curve 3 marked with a thick line corresponds to the reference sample.First,for curve 1,the concentration was doubled but still plotted versus the nominal concentration of the reference.As shown in Fig.4A,the use of a higher concentration resulted in higher response values and thus shifted the dose response curve to the left.Next,changes in the dissociation rate were simulated.For curve 2,the dissociation rate constant was increased to 3.4×10?4s-1(four times faster than the reference).For this input,the dose response curve still almost overlapped with the reference despite a fourfold lower affinity.Notably when the dissociation rate constants were instead decreased,making the interaction more stable,this change did not shift the dose response curve at all,even for a twenty-fold decrease.Finally,for curve 4,the association rate constant was two times lower than the reference,i.e.8.0×105M-1s-1.Here the dose response curve was shifted to the right as response levels were lower for each concentration.
Clearly the position of the dose response curve and hence EC50 values depend not only on changes in concentration but also on changes in kinetic properties.
Changes in concentration and association rate constants always shifted the dose response curves,but a change in dissociation rate constant gave variable results.In the second example,that is likely to be representative of many therapeutic antibodies,changes in dissociation properties can go unnoticed when only dose response curves are considered.
Simulations based on the 1:1 interaction model can be considered as an ideal case.With antigen captured or immobilized to the sensor surface,the 1:1 binding model is strictly not valid as avidity effects may impact binding kinetics.The interaction becomes more complex,but binding levels will still be determined by the kinetic properties of the interaction.Since avidity typically leads to slower dissociation,changes in dissociation rate constants may therefore be even more difficult to detect.
Therefore,these simulations demonstrate that relative potency data based on PLA or EC50 analysis will accurately ref l ect changes in concentration only if kinetic properties are unchanged and that common slope and asymptotes of dose response curves cannot be interpreted as unchanged binding properties.
3.5.Sensorgram comparison and dose response curves
Because the dose and kinetics of binding contribute to the safety and efficacy of the drug,it will be important to use an assay that is capable not only of EC50 analysis but also of kinetic analysis.In contrast to ELISA,which only provides a response that can lead to an affinity value,SPR assays inherently provide both a response and a sensorgram that can reflect not only the affinity,but more importantly,the kinetics of binding.
The sensorgram comparison tool in the Biacore software was now used to define a comparison window(Fig.5A)that reflects the binding properties of the reference anti-TNF-αantibody.The reference window was determined with replicates by using sensorgrams obtained with 4.4 μg/mL of antibody and by using the min/max algorithm to create the comparison window.With this algorithm,the upper and lower limit sensorgrams correspond to sensorgrams that give the highest and lowest response values at any given time.Distances from the median sensorgram are used for calculations of similarity scores.A sample curve that falls between the upper and lower limit sensorgrams will receive a similarity score of 100%.Samples with data outside the comparison window will receive a lower similarity score[15].
We have previously demonstrated that the analysis would be focused on curve shapes by normalizing response levels to the highest response in each sensorgram[15].The comparison window reflects an expected result,and a sample that falls inside the comparison window meets the kinetic criteria of the assay.A second preparation of reference sample running at the same concentration was within the comparison window,indicating unchanged kinetic properties(Fig.5B).
The comparison window defined in Fig.5B was very narrow.By incorporating potential errors into the analyte concentration,a wider and perhaps more realistic comparison window can readily be defined.Assuming a 10%error in analyte concentration,this would correspond to running the 4.4 μg/mL sample deliberately diluted to 4.0 and 4.8 μg/mL.
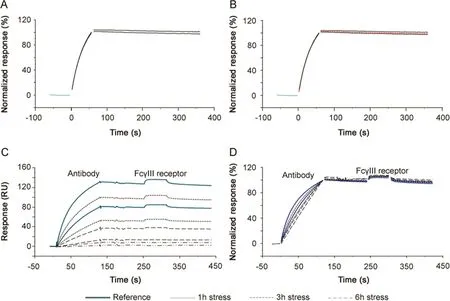
Fig.5.Sensorgram comparison.(A)Maximum and minimum sensorgrams obtained with a reference antibody using repeat injections of a constant(4.44 μg/mL)antibody concentration.(B)A new sample was within the comparison window defined by the sensorgrams in Fig.5A,demonstrating the new sample shares the kinetic profile of the reference.(C)Dual potency assay with antibody,injected at varying concentrations,binding to antigen followed by injection of FcγRIIIa Val158 at a constant concentration.The thick blue lines correspond to the reference antibody injections at 1.5 and 4.4 μg/mL.The dashed lines represent the same antibody concentrations injected after 1,3 and 6 h of stress.Stressed antibodies produced lower responses.(D)By normalizing each sensorgram from Fig.6C,all sensorgrams are displayed in the same relative scale.The reference antibody curves(thick blue lines)defined a comparison window for both antibody and receptor binding.Stressed antibodies share dissociation and FcγRIIIa binding profiles,but kinetic profiles differ during antibody binding.This can be due to changes in either antibody concentration or in the antibody association rate constant.
In Figs.5C and D,binding of heat stressed anti-TNF-αantibodies to TNF-α followed by binding of FcγRIIIa Val 158 is presented.Antigen binding of stressed antibodies was reduced(Fig.5C),and it was difficult to interpret if antibody dissociation and FcγRIIIa binding were impacted by stress.Binding curves obtained with the non-stressed antibody at concentrations of 1.5 and 4.4 μg/mL were used to define a broad comparison window using the min/max algorithm.In Fig.5D,normalized binding curves are shown.The solid blue lines represent the nonstressed sample and define the comparison window.Data from stressed samples obtained at the same two concentrations as the reference are shown as dashed lines.After 1 h of stress,antibodies started to fall outside the antibody association phase of the comparison window,but antibody dissociation and FcγRIIIa binding fell almost completely inside the comparison window.After 3 h of stress,both antibody samples were clearly outside the association phase comparison window.Since binding levels were much lower for these samples,the noise was more apparent and antibody dissociation and FcγRIIIa binding curves were shifted slightly upwards;however,the antibody dissociation and FcγRIIIa curves still resembled reference curves.Samples stressed for 6 h were characterized by low response levels and became too noisy to analyze when normalized to 100%.These curves are therefore not shown in Fig.5D.
The comparison window,defined in the sensorgram comparison tool,should ref l ect an expected outcome.With a very narrow comparison window,as in the first example(Figs.5A and B),new samples that only differ marginally from the reference,may fall outside the comparison window,and small differences may be overinterpreted.In the second example(Figs.5C and D)the comparison window was wider,and two concentrations flanking the EC50 value were used to define the comparison window.Stressed antibody samples still fell outside the antigen binding phase,indicating large effects of heat stress on antigen binding.However,antibody dissociation and FcγRIIIa binding were similar for stressed samples and the reference.
3.6.CFCA for determination of relative antibody concentration
CFCA is an independent measurement of active concentration,where results are obtained under at least partial mass transport limited conditions.Binding responses and therefore concentration values are largely independent of the kinetics of binding[24].CFCA of stressed antibodies allowed active concentration data,with respect to both TNF-α(Fig.6A)and SuRe ligand binding(Fig.6B),to be determined.The data shown in Fig.6 are for the 2 h stressed samples.In each figure,six sensorgrams are shown with two curves each for dilution factors 2,4 and 8.For each dilution the top curve was recorded at a flow rate of 100 μL/min and the lower curve at a flow rate of 5 μL/min.Data from the first 25 s of the injections were fitted and resulted in calculated concentrations of 5.8(TNF-αsurface)and 5.5 nM(SuRe ligand surface)for the undiluted sample.CFCA results can be affected by uncertainties in the diffusion coefficient and molecular weight of the sample(two parameters needed for CFCA)and by the conversion of the SPR signal to a mass value as discussed previously[17].However,these uncertainties cancel out when the ratio between a sample antibody and a reference antibody is used.Relative CFCA values were therefore calculated by setting the non-stressed antibody concentration to 100%.Interestingly,relative CFCA data for the paratope and Fc-domain were very close,indicating identical changes in active concentrations of both parts of the antibody.Furthermore, relative concentrations correlated perfectly with relative potency values determined with PLA(Fig.6C).The data strongly support the interpretation that the change in EC50 was due to changes in the active concentration and not changesin the association rate constant.Additionally,the data suggest that CFCA can be used as an alternative to dose response curves for the determination of relative potencies.This merits further investigations,as data were obtained only for the anti-TNF-αantibody,and other antigens and antibodies were not tested.
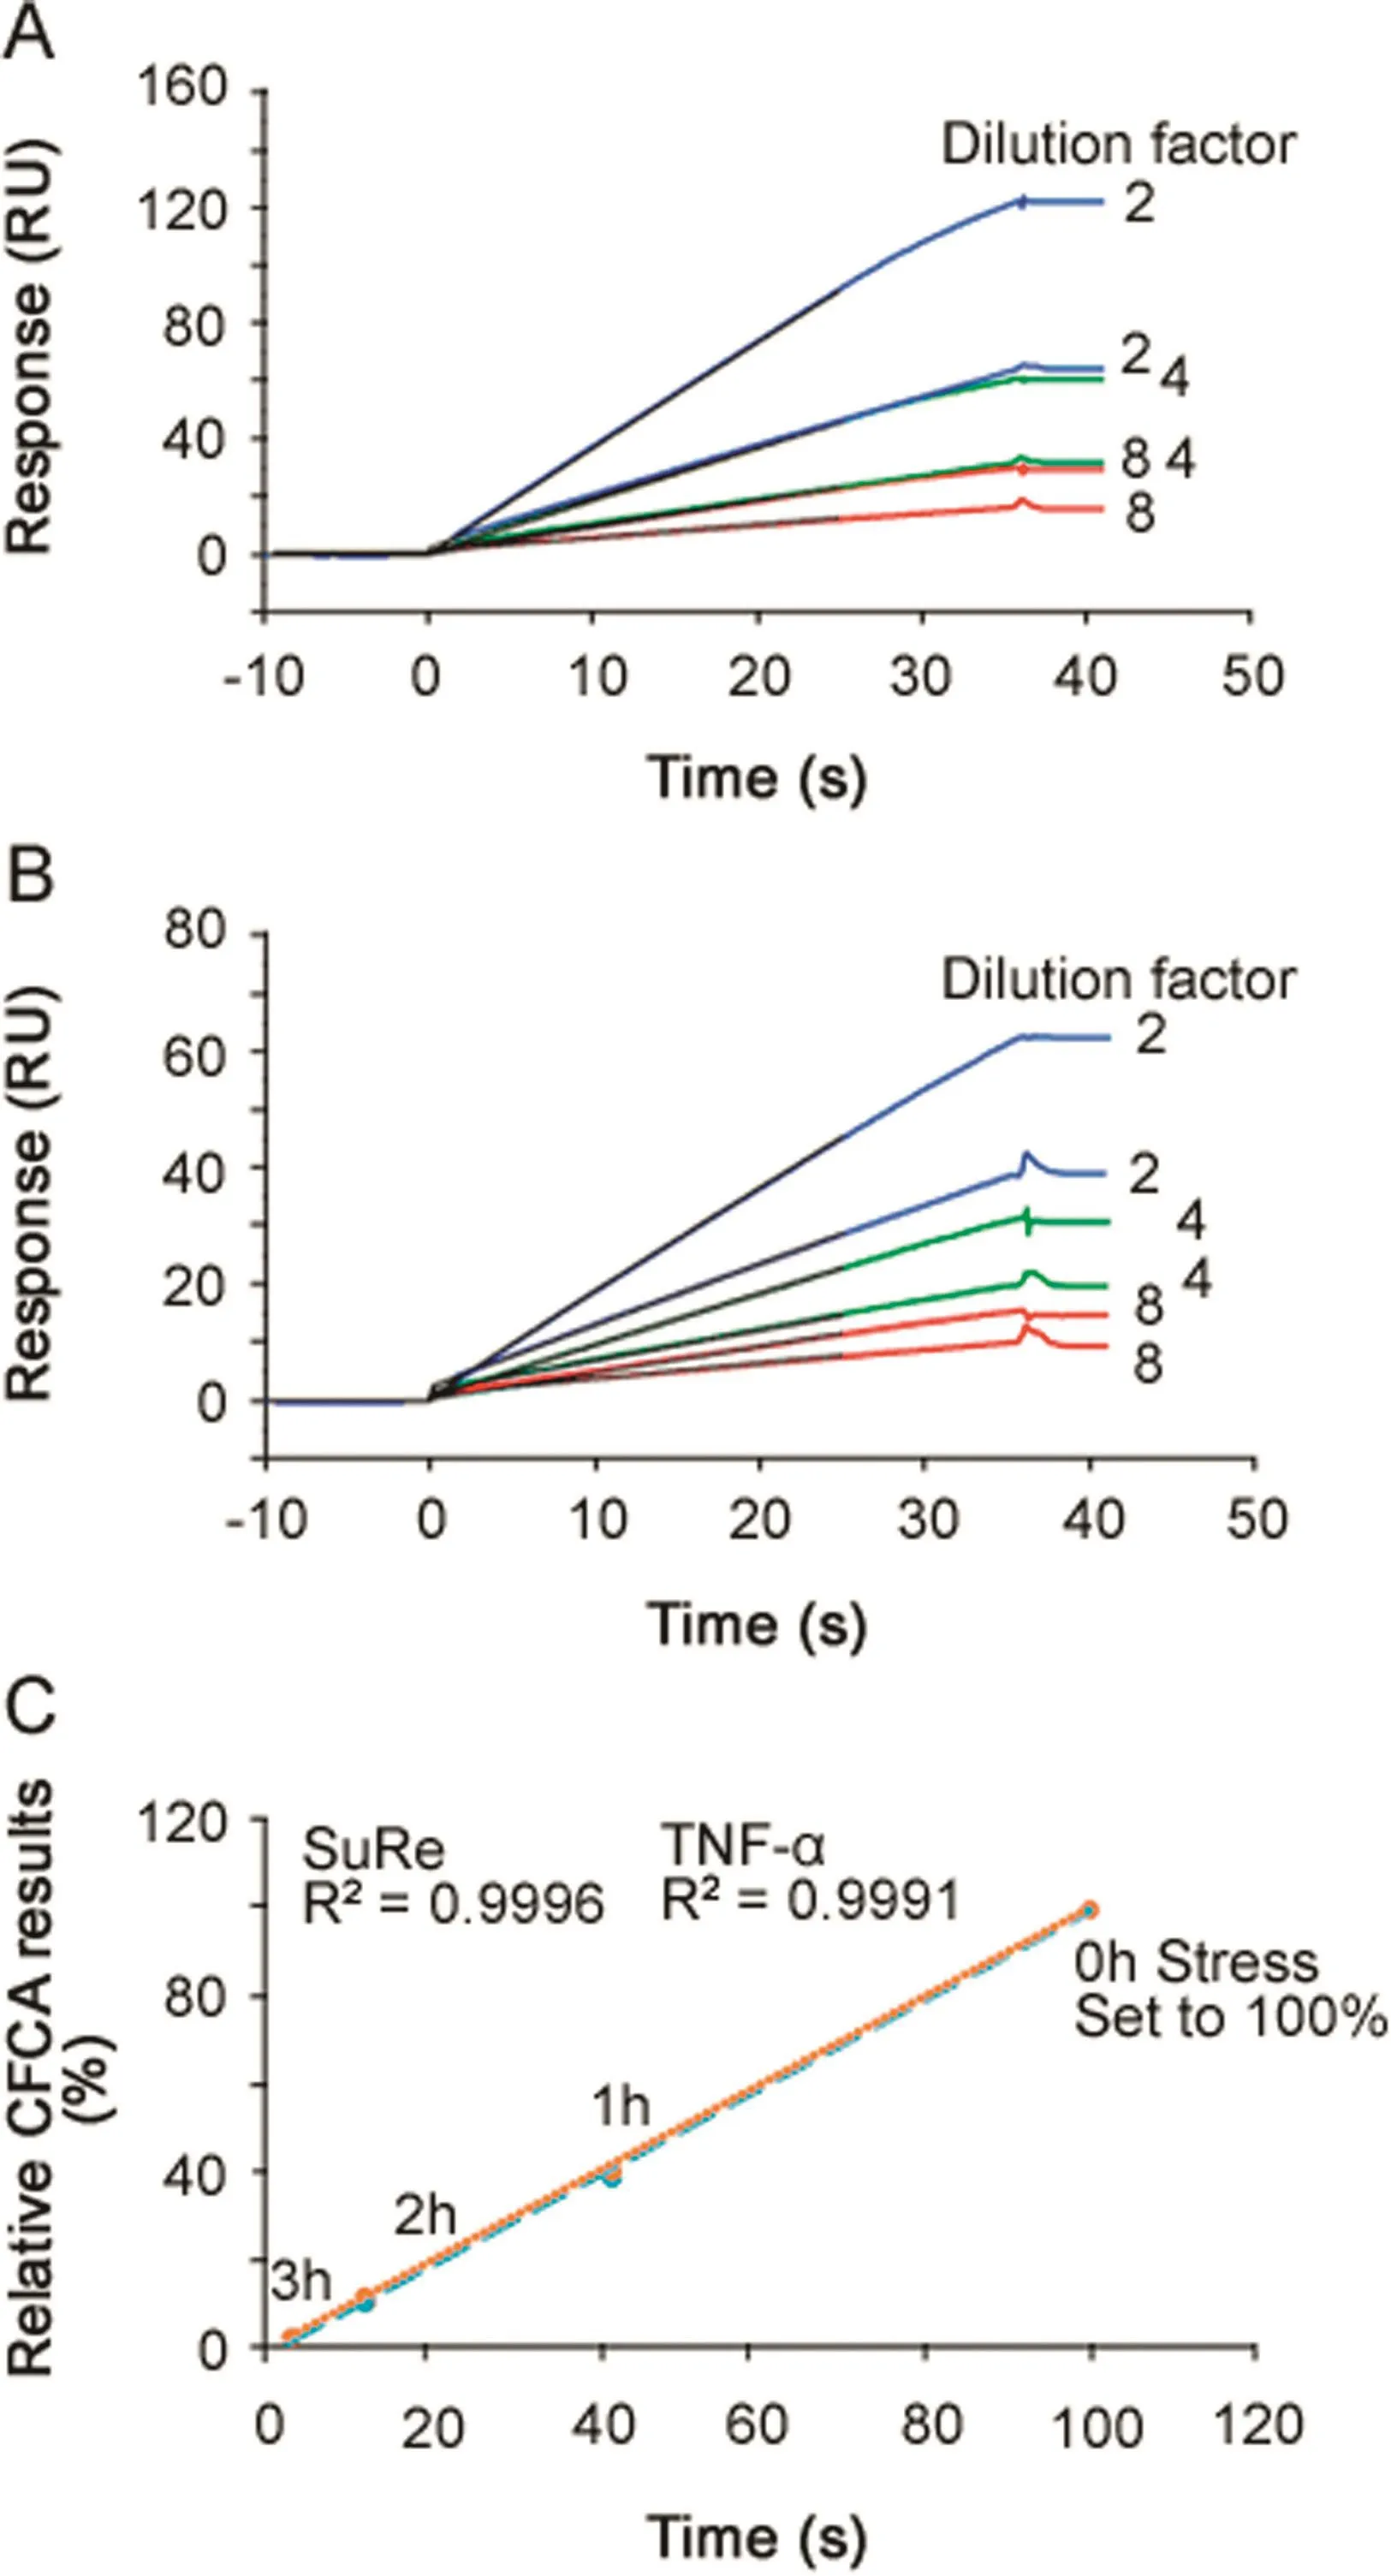
Fig.6.Calibration Free Concentration Analysis(CFCA).(A)Three dilutions of antibody,stressed for 2 h,were injected using flow rates of 5 and 100 μL/min for binding to immobilized TNF-α.The black lines,present up to 25 s into the injection,represent CFCA fitted curves.The concentration of the undiluted sample was calculated to be 5.8 nM.(B)Three dilutions of antibody,stressed for 2 h,were injected using f l ow rates of 5 and 100 μL/min for binding to immobilized MabSelect SuRe ligand(a protein A variant).The black lines,present up to 25 s into the injection,represent CFCA fitted curves.The concentration of the undiluted sample was calculated to be 5.5 nM.(C)Relative CFCA data plotted versus relative potency values determined via PLA(Table 3).Data for TNF-α and SuRe ligand binding are very close and CFCA data correlated perfectly with relative potency values.In this way,for any change in active concentration related to two different functional domains,the paratope and the Fc region of the antibody could be investigated.
4.Summary and conclusions
Potency determinations are required for the release of every lot of a therapeutic antibody[25].While the release assay is typically a bioassay,alternatives such as ELISA as a surrogate potency assay have been in use for almost four decades[26].While initially used to correlate a binding level to lethal doses of antivenoms,the use of ligand binding assays is now much greater[27],as mechanisms of actions are better understood.The potency assay format is not only used as a release assay,but can be used throughout the development process in comparability studies and formulation studies to ensure consistency between drug substance and drug product.
Compared to the panel of bioassays[23]described for anti-TNF-αbiotherapeutics,ligand binding assays as described in this paper appear far easier to set up and maintain.PLA and EC50 analysis on SPR platforms have traditionally been focused on comparison of dose response curves[12–14].Here,we have demonstrated that the position of dose response curves and therefore relative potency determinations are not only sensitive to changes in active concentration but also to changes in binding properties.Such changes may not always be compensated for by adjustment of the dose.For instance,large differences between the reference and sample in dissociation properties,which may go undetected in dose response curve analysis,can impact drug residence time and therefore potentially affect the drug efficacy [28].By complementing dose response curves with sensorgram comparisons,such deviations,can be detected as sensorgram comparison checks for compliance with kinetic properties.The analysis compares reference and sample curves directly,and can be applied to both simple and complex binding data and can be used even with slow off-rates[29].Furthermore,several injections can be compared in the software such that several critical quality attributes can be compared in a single assay.
For the current assay set-up,we used reversible biotin capture to avoid common bottle necks associated with SPR assay development such as optimization of immobilization and regeneration conditions.By using this setup,it was possible(1)to set up surrogate potency assays with the capture of biotinylated target molecules in a straightforward fashion without the need of optimizing regeneration conditions,(2)to estimate the potency related to several CQAs(antigen and receptor binding)in a single sensorgram,and(3)to combine dose response curves with sensorgram comparison to ensure consistent interaction kinetics for correct interpretation of EC50 values as a dose.
To resolve remaining uncertainties in the interpretation of dose response curves obtained with stressed anti-TNF-αantibodies,CFCA was used in an attempt to differentiate between changes due to changes either in active concentration or in association rate constants.CFCA data linked to the paratope and to the Fc-domain were close and indicated that the differences were related to changes in the active concentration.The correlation established between the relative CFCA and relative potency values further indicated that CFCA and sensorgram comparison can be used directly to determine the relative potency without the need to establish full dose response curves.Ideally,CFCA determines concentrations directly with no impact of kinetics on the concentration data.It is typically used in the concentration range from 1 to 100 nM;it is rapid,and the linearity of the assay is demonstrated by f i tting an entire dilution series to obtain a single concentration value.While CFCA data related to antigen and Fc functionalities were shown,the use of CFCA as a general potency tool still needs to be demonstrated with direct measurements of CFCA on a range of relevant antigens and Fc-receptors.If this can be demonstrated,the use of relative CFCA data and the sensorgram comparison functionality can potentially replace the use of the full dose response curves and PLA that are typically used for determination of relative potencies based on ligand binding assays.CFCA can be used to calculate relative potencies directly from the ratio between sample and reference concentrations,whereas sensorgram comparison can be used to detect unwanted changes in binding properties/kinetics.
Finally,as the links between molecular properties and clinical effects become more established,ligand binding assays may be more frequently used not only for comparabilitity and biosimilarity studies,but also for batch release.
Conflicts of interest
All authors were employed by GE Healthcare during the preparation of this article.GE Healthcare is the provider of Biacore systems,sensor chips and reagents.
[1]M.Schr?ml,M.Biehl,Kinetic screening in the antibody development process,Antib.Methods Protoc.901(2012)171–181.
[2]Y.N.Abdiche,R.Harriman,X.Deng,et al.,Assessing kinetic and epitopic diversity across orthogonal monoclonal antibody generation platforms,MAbs 8(2016)264–277.
[3]P.Bruhns,B.Iannascoli,P.England,et al.,Specif i city and affinity of human Fcγ receptors and their polymorphic variants for human IgG subclasses,Blood 113(2009)3716–3725.
[4]K.H.Heider,K.Kiefer,T.Zenz,et al.,A novel Fc-engineered monoclonal antibody to CD37 with enhanced ADCC and high proapoptotic activity for treatment of B-cell malignancies,Blood 118(2011)4159–4168.
[5]J.M.Hayes,A.Frostell,E.F.Cosgrave,et al.,Fc gamma receptor glycosylation modulates the binding of IgG glycoforms:a requirement for stable antibody interactions,J.Proteome Res.13(2014)5471–5485.
[6]W.F.Dall'Acqua,P.A.Kiener,H.Wu,Properties of human IgG1s engineered for enhanced binding to the neonatal Fc receptor(FcRn),J.Biol.Chem.281(2006)23514–23524.
[7]T.Suzuki,A.Ishii-Watabe,M.Tada,et al.,Importance of neonatal FcR in regulating the serum half-life of therapeutic proteins containing the Fc domain of human IgG1:a comparative study of the affinity of monoclonal antibodies and Fc-fusion proteins to human neonatal FcR,J.Immunol.184(2010)1968–1976.
[8]D.C.Swinney,J.Anthony,How were new medicines discovered?Nat.Rev.Drug Discov.10(2011)507–519.
[9]B.C.Barnhart,M.Quigley,Role of Fc–FcγR interactions in the antitumor activity of therapeutic antibodies,Immunol.Cell Biol.95(2016)340–346.
[10]E.S.Ward,S.C.Devanaboyina,R.J.Ober,Targeting FcRn for the modulation of antibody dynamics,Mol.Immunol.67(2015)131–141.
[11]Quality Considerations in Demonstrating Biosimilarity of a Therapeutic Protein Product to a Reference Product,FDA Guidance to Industry,April,2015.
[12]A.Harrison,Z.Liu,S.Makweche,et al.,Methods to measure the binding of therapeutic monoclonal antibodies to the human Fc receptor FcγRIII(CD16)using real time kinetic analysis and f l ow cytometry,J.Pharm.Biomed.Anal.63(2012)23–28.
[13]C.Gassner,F.Lipsmeier,P.Metzger,et al.,Development and validation of a novel SPR-based assay principle for bispecif i c molecules,J.Pharm.Biomed.Anal.102(2015)144–149.
[14]S.Khurana,L.R.King,J.Manischewitz,et al.,Novel antibody-independent receptor-binding SPR-based assay for rapid measurement of inf l uenza vaccine potency,Vaccine 32(2014)2188–2197.
[15]R.Karlsson,E.Pol,A.Frostell,Comparison of surface plasmon resonance binding curves for characterization of protein interactions and analysis of screening data,Anal.Biochem.502(2016)53–63.
[16]E.Pol,H.Roos,F.Markey,et al.,Evaluation of calibration-free concentration analysis provided by Biacore?systems,Anal.Biochem.510(2016)88–97.
[17]R.Karlsson,Biosensor binding data and its applicability to the determination of active concentration,Biophys.Rev.8(2016)347–358.
[18]L.Nieba,S.E.Nieba-Axmann,A.Persson,et al.,BIACORE analysis of histidinetagged proteins using a chelating NTA sensor chip,Anal.Biochem.252(1997)217–228.
[19]ICH Quality Guidelines.Validation of Analytical Procedures Q2(R1),November 1996.
[20]K.Lis,O.Kuzawińska,E.Ba?kowiec-Iskra,Tumor necrosis factor inhibitors–state of knowledge,Arch.Med.Sci.10(2014)1175–1185.
[21]E.Louis,Z.El Ghoul,S.Vermeire,et al.,Association between polymorphism in IgG Fc receptor IIIa coding gene and biological response to infliximab in Crohn's disease,Aliment.Pharmacol.Ther.19(2004)511–519.
[22]K.A.Wojtal,G.Rogler,M.Scharl,et al.,Fc gamma receptor CD64 modulates the inhibitory activity of infliximab,PLoS One 7(2012)e43361.
[23]A.Nesbitt,G.Fossati,M.Bergin,et al.,Mechanism of action of certolizumab pegol(CDP870):In vitro comparison with other anti-tumor necrosis factor alpha agents,Inflamm.Bowel.Dis.13(2007)1323–1332.
[24]L.H.Christensen,Theoretical analysis of protein concentration determination using biosensor technology under conditions of partial mass transport limitation,Anal.Biochem.249(1997)153–164.
[25]FDA Code of Federal Regulation Title 21FDA Code of Federal Regulation Title 21,<https://www.ecfr.gov/cgi-bin/text-idx?SID=49548554bcf36480326b d48e48599365&mc=true&tpl=/ecfrbrowse/Title21/21cfrv7_02.tpl#0>.
[26]R.D.Theakston,H.A.Reid,Enzyme-linked immunosorbent assay(ELISA)in assessing antivenom potency,Toxicon 17(1979)511–515.
[27]N.Rieder,H.Gazzano-Santoro,M.Schenerman,et al.,The roles of bioactivity assays in lot release and stability testing,BioProcess Int.8(2010)33–42.
[28]R.A.Copeland,The drug–target residence time model:a 10-year retrospective,Nat.Rev.Drug Discov.15(2016)87–95.
[29]N.Papadopoulos,J.Martin,Q.Ruan,et al.,Binding and neutralization of vascular endothelial growth factor(VEGF)and related ligands by VEGF Trap,ranibizumab and bevacizumab,Angiogenesis 15(2012)171–185.
 Journal of Pharmaceutical Analysis2018年2期
- Journal of Pharmaceutical Analysis的其它文章
- Eco-friendly reduced graphene oxide for the determination of mycophenolate mofetil in pharmaceutical formulations
- Ultrasensitive electrochemical determination of metronidazole based on polydopamine/carboxylic multi-walled carbon nanotubes nanocomposites modified GCE
- Quantitative determination of erlotinib in human serum using competitive enzyme-linked immunosorbent assay
- Anti-diabetic activity of quercetin extracted from Phyllanthus emblica L.fruit:In silico and in vivo approaches
- Structural confirmation of sulconazole sulfoxide as the primary degradation product of sulconazole nitrate
- Physicochemical characterization,the Hirshfeld surface,and biological evaluation of two meloxicam compounding pharmacy samples