
Network analysis of Chinese air transport delay propagation
2017-11-20 12:06:39MssimilinoZninSeddikBelkourZhuYnbo
CHINESE JOURNAL OF AERONAUTICS 2017年2期
Mssimilino Znin,Seddik Belkour,Zhu Ynbo
aInnaxis Foundation&Research Institute,Jose′Ortega y Gasset 20,28006 Madrid,Spain
bFaculdade de Cie?ncias e Tecnologia,Departamento de Engenharia Electrote′cnica,Universidade Nova de Lisboa,Lisboa,PortugalcAviation Data Communication Corporation,100083,Beijing,China
Network analysis of Chinese air transport delay propagation
Massimiliano Zanina,b,*,Seddik Belkouraa,Zhu Yanboc
aInnaxis Foundation&Research Institute,Jose′Ortega y Gasset 20,28006 Madrid,Spain
bFaculdade de Cie?ncias e Tecnologia,Departamento de Engenharia Electrote′cnica,Universidade Nova de Lisboa,Lisboa,PortugalcAviation Data Communication Corporation,100083,Beijing,China
Air transport;Complex networks;Delays propagation;Functional networks;Granger causality
The Chinese air transport system has witnessed an important evolution in the last decade,with a strong increase in the number of flights operated and a consequent reduction of their punctuality.In this contribution,we propose modelling the process of delay propagation by using complex networks,in which nodes are associated to airports,and links between pairs of them are assigned when a delay propagation is detected.Delay time series are analysed through the wellknown Granger Causality,which allows detecting if one time series is causing the dynamics observed in a second one.Results indicate that delays are mostly propagated from small and regional airports,and through flights operated by turbo-prop aircraft.These insights can be used to design strategies for delay propagation dampening,as for instance by including small airports into the system’s Collaborative Decision Making.
1.Introduction
The Chinese air transportation system,one of the most important and fastest-growing in the world,is receiving an increasing attention from the research community due to its distinctive characteristics and challenges.On one hand,during the last decade,China has become the second largest market,with the Beijing Capital International Airport being the second busiest airport in the world.On the other hand,China is suffering from a limited availability of airspace resources,among others due to a strong military presence.1As a result,nowadays passengers are experiencing significant delays,with an average of 40%of flights being delayed every day.According to the flight statistics of Civil Aviation Administration of China(CAAC),the appearance of delays can be attributed to one of the four main categories:airlines related(≈40%),air traffic control(≈20%),weather related(≈20%),and military uses(≈10%).These four categories are responsible for more than 90%of the flight delays in China.
In this work,we propose the use of complex network theory to understand how delays appear and propagate through the Chinese airport network.Complex networks are powerful tools to help understanding the structures and dynamics ofcomplex systems in general,2,3and of air transportation in particular.Airport networks and air route networks have been the focus of many studies around the world-see,for instance,Refs.4,5for some examples.Specifically to the Chinese system,examples include Refs.6–10.
The structure induced by delay propagation between airports can be seen as a complex network,which lies on top of the network created by flights and which is the result of the dynamics of the system.This is similar to what has been considered in neuroscience:flight networks are equivalent to the way different brain regions are physically connected(i.e.the connectome),while a delay network represents how information(here,information about delays)is transmitted and processed at each node.11Once such network has been reconstructed,it can be used to obtain relevant information about the propagation process:for instance,which are the most important airports,both for delay generation and propagation;or how different airlines interact to produce the observed dynamics.
In the line of what has already been studied for the European network,12,13we here propose to reconstruct delay propagation networks for the Chinese air transportation system by applying the well-known Granger Causality metric14,15on airport delay time series.A link between two airports will thus represent a direct delay propagation,i.e.a situation in which the delays observed at one airport are partly responsible for what we observe in a second airport.By characterising the resulting network using several established metrics,we make a first step towards the understanding of the dynamics of delay propagation in the Chinese air transport network,and towards the development of adequate strategies for improving the passengers’experience.Note that the approach here proposed is fundamentally different from standard delay studies.On the one hand,we here focus on the global structure created by delay propagation,and not on the local dynamics of individual flights and airports;16,17additionally,results are obtained by observing the real dynamics of the system,and not by inferring it from large-scale synthetic models.18,19
Beyond this introduction,this work is organised as follows.Section 2 presents the main techniques here applied,including a description of the data set(Section 2.1),the creation and preprocessing of delay time series(Section 2.2),the reconstruction of propagation networks through the Granger Causality(Section2.3),andtheanalysisoftheresultingnetworks(Section2.4).Section 3 reports the results obtained,by considering three differentnetworks:theglobaldelaypropagationone,thenetworks created by the three most important airlines,and the one created by aircraft types.Finally,Section 4 summarises our major conclusions and discusses future lines of research.
2.Methods
2.1.Data set description
The data set has been provided by Aviation Data Communication Corporation(ADCC)of CAAC,and comprises high-level information for all flights crossing the Chinese airspace during the 2015 summer peak(1st to 31st August 2015).For each flight,available information includes,among others,the scheduled departure and arrival airports,scheduled and real departure and arrival time,as well as the airline code and aircraft type.Only domestic flights,i.e.departing from and arriving at a Chinese airport,have here been considered;additionally,flights involving non-ICAO airports,marked as ZZZZ,have further been discarded.Cancelled flights were also not included in the data set,which only covers executed operations.This yielded a final data set comprising 152 airports and 45.151 flights-see Fig.1 for a graphical representation.
The delay of each flight has been calculated as the difference between the real and scheduled arrival time,and therefore represents the real delay as perceived by passengers.It has to be noted that this is different from the official announced delay,as the latter is not reported if the flight arrived within 10/15 min from the expected arrival time.
2.2.Time series pre-processing
Once the landing delay of each flight has been assessed,it is necessary to reconstruct the average dynamics of each airport,i.e.the average landing delay within one-hour time windows.An example of the resulting time series is represented in Fig.2(a),for the Beijing Capital International Airport.It can be appreciated that the time series is characterised by peaks appearing with a daily frequency-note the peaks at 24 h and multiples in the cross-correlation depicted in Fig.2(b).This is mainly due to the non-stationarity of delays,whose expected value is higher at the end of the afternoon,and lower during the first hours of the day-see Fig.2(c).
In order to reduce the non-stationarity of the time series,which may result in a biased evaluation of the Granger Causality metric,we here apply a Z-Score detrend procedure.In detail,the detrended delay time series for one airport is calculated as:
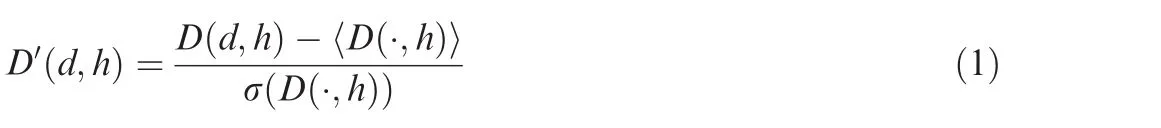
D0ed;hT being the detrended delay for daydand timeh,Ded;hT the originalaverage delay,and hD(;hTiand reD);hTT the average and standard deviation of the delays recorded at time h for all available days.A graphical representation of this transformation is depicted in Fig.3.
The resulting time series have some interesting characteristics.Firstofall,theiraveragevalueiszerobyconstruction-note that we subtract the average delay hD(;hTi from each element.Second,positive and negative delays represent how unusual(in terms of the number of standard deviations)is the observed delay with respect to the delay expected at the same hour.Also note that,while negative delay values are usually discarded in delaypropagationstudies,heretheyencodeimportantinformation,as they represent situations in which the behaviour of the systemisbetterthanexpected;theobjectivethusincludesunderstanding if such positive situations can be propagated between different airports.Finally,and as a direct consequence of the previous point,the resulting time series are detrended:if,at a giventime,ahighdelayisobserved,butthisisalignedwithwhat expected in that time window,D0will be close to zero.
2.3.Granger causality
The Granger Causality(GC)test14,15has extensively been used to assess the information exchanged between different elements of a system,and more specifically,to test for causality relationships that one might intuitively assume.GC is an extre-mely powerful tool,developed by the economy Nobel Prize winner Clive Granger14(even though a similar notion might have been introduced twenty years earlier by Weiner),that have extensively been applied to economic problems20and biomedical data analysis.21–23In this work,GC will help understanding if the dynamics of two airports are related;and,in terms of delays,if the delays observed at one of them can explain the delays appearing at a second one.
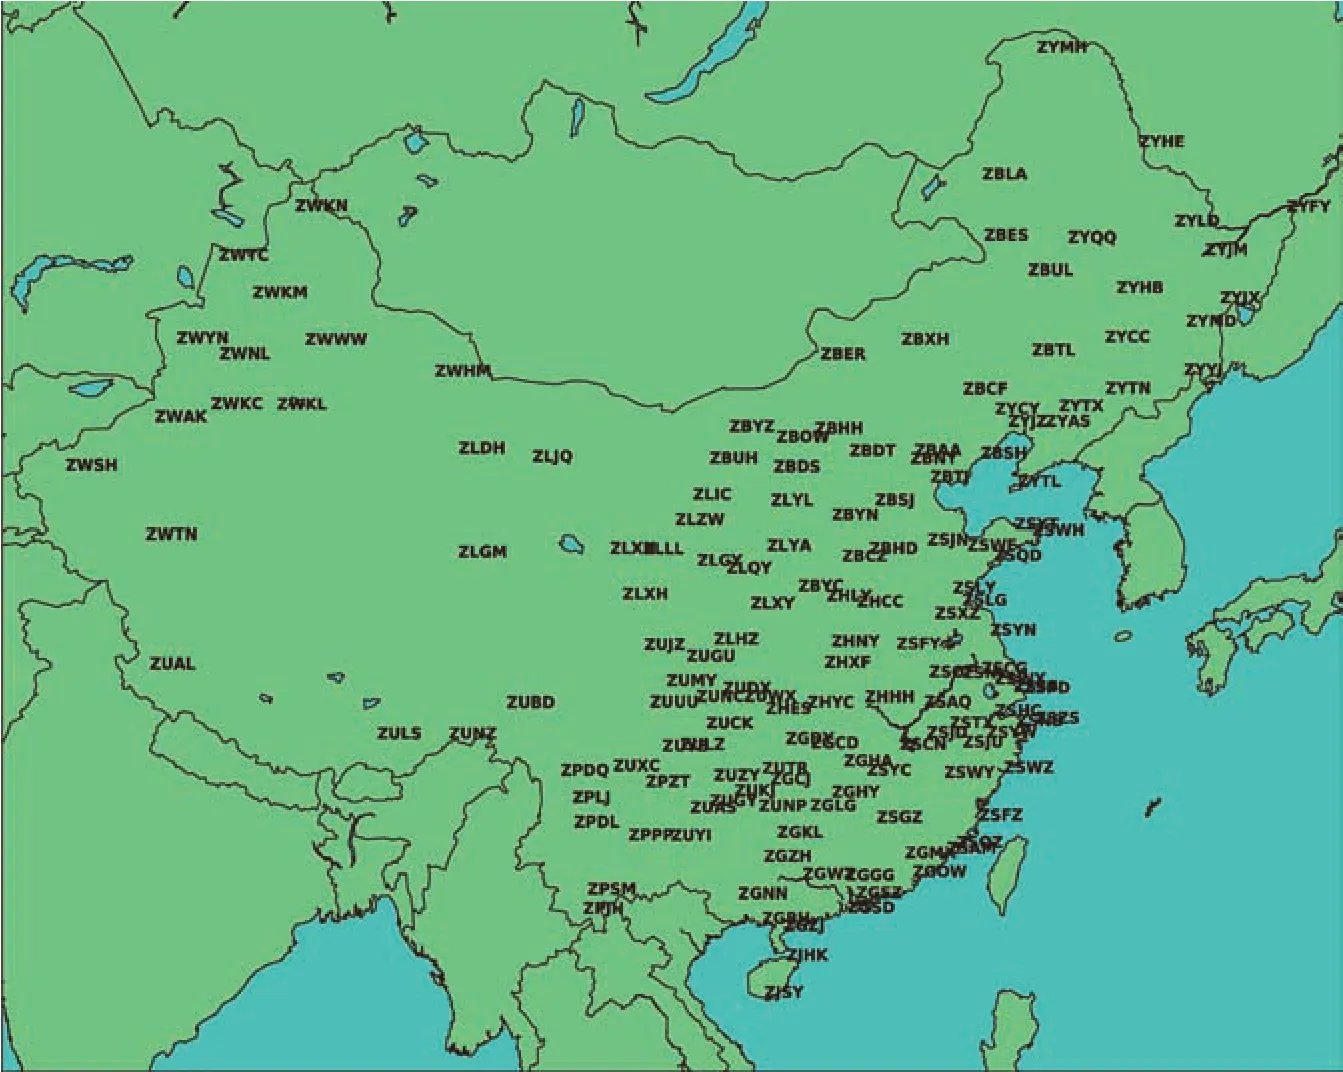
Fig.1 Map depicting the position of the 152 airports considered in this study.
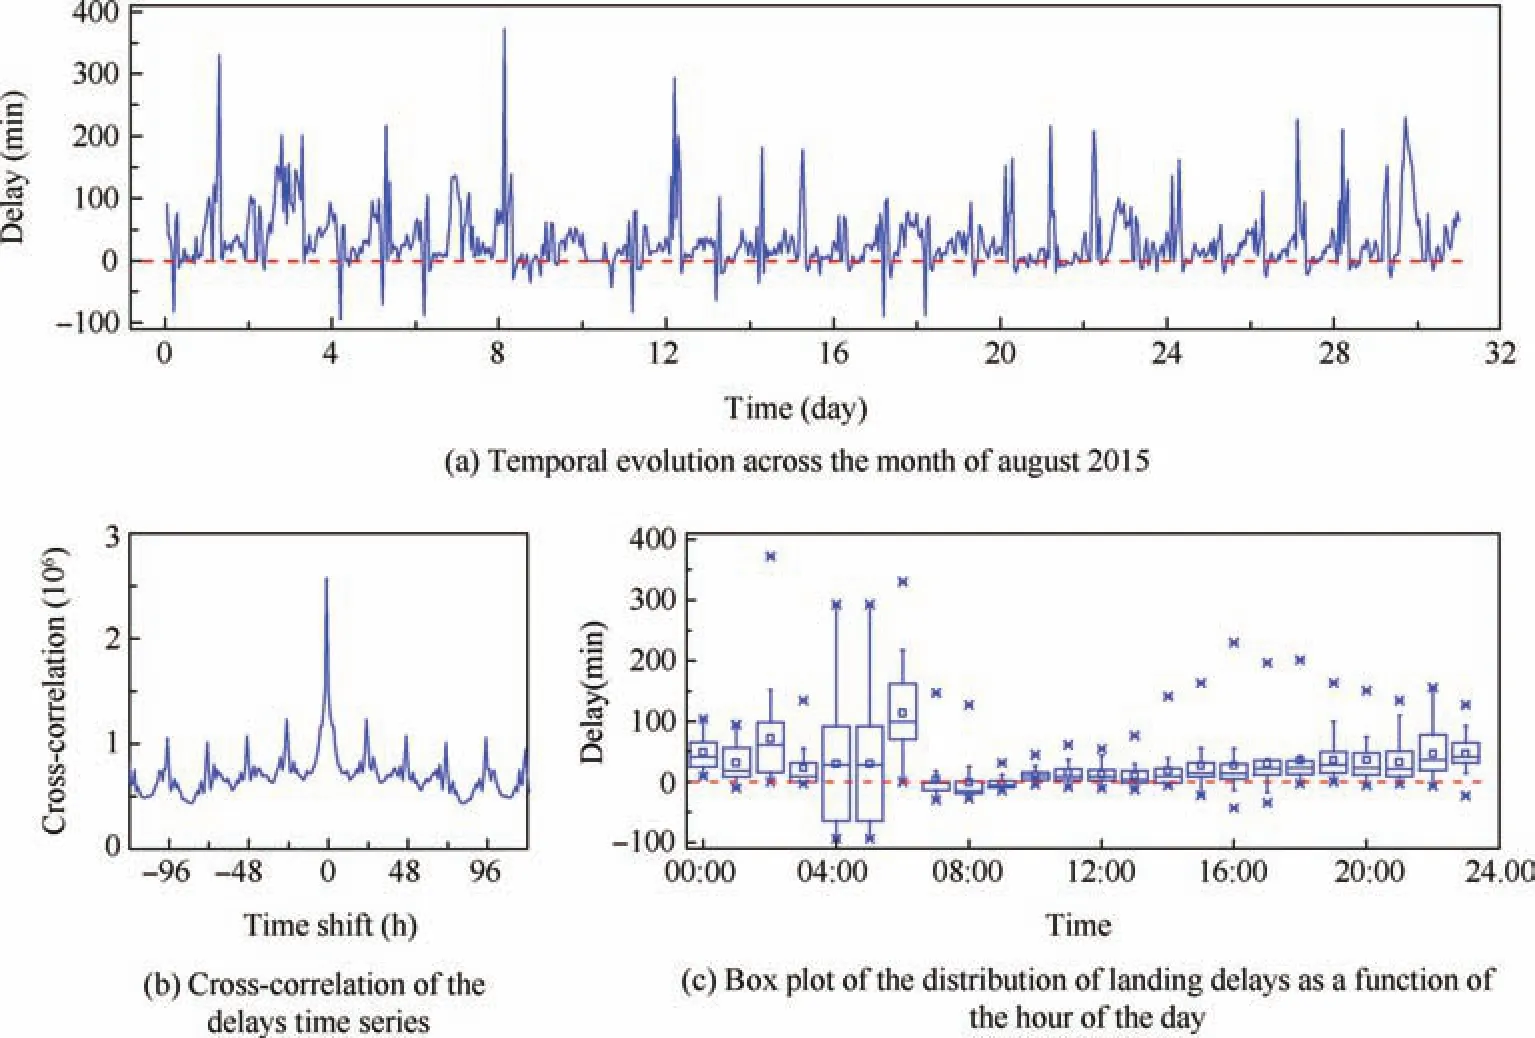
Fig.2 Average hourly landing delay at ZBAA-Beijing Capital International Airport.
The GC is based on two very intuitive concepts:first,causes must precede the corresponding effects;and second,the effect can be better predicted using the historical information related to both the cause and the effect than when just using the effect alone.This translates to our study in the following way:an airportB‘Granger-causes” another airportAif the use of past values of the delays time series ofBhelps improving the prediction of delay time series ofA.This would indicate that there is a flow of information fromBtoA,and that thusBis(partially)responsible of the delays we observe inA.
In mathematical terms,suppose that the delay dynamics of two airportsAandBcan be expressed as stationary time series.ThenB‘Granger-causes”Aif:

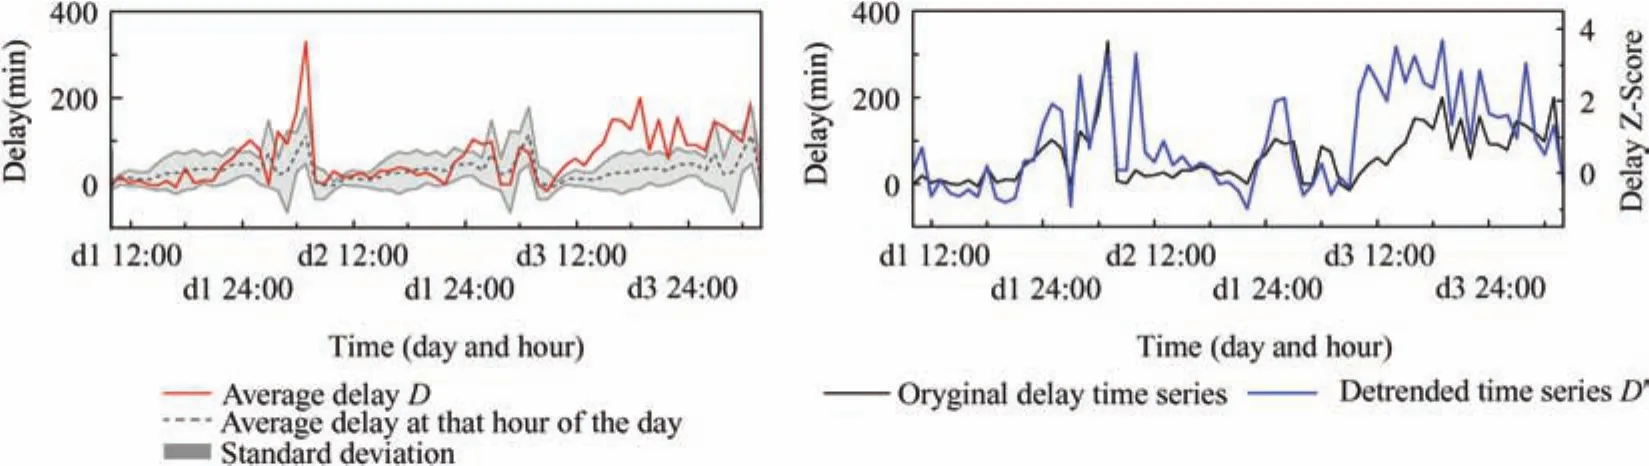
Fig.3 Example of the detrending process of the ZBAA-Beijing Capital International Airport time series.
where r2eAjU-T stands for the error(i.e.,the standard deviation of residuals)in forecasting the time seriesAusing the past information of the entire universeU,and r2eAjU-nB-T the error when the information about time seriesBis discarded.The forecast itself is done,in both cases,through an autoregressive-moving-average(ARMA)model.24AnF-test is then performed to assess the statistical significance of this inequality.
The main advantage of the GC metric is that it is able to identify true causalities and discard spurious correlations.Indeed,in the case of spurious correlations,the information contained in one time series is useless to the forecast of the other,as both would be essentially the same.On the other hand,several drawbacks have to be taken into account when analysing the results yielded by GC.25First,any claim of causality must be taken with caution as a true causality can only be guaranteed considering all possible relevant source of information,26which is not usually the case in real-world experiments.Second,GC is linear and looks for linear couplings between the time series-delays,on the other hand,are known to be driven by non-linear propagation forces.Finally,GC considers the entire time series;an abnormal delay propagation,i.e.one appearing only under some special circumstances,would be smoothed and averaged,therefore loosing its statistical significance.13
Additionally,it is necessary to stress that,while Granger Causality has successfully been applied to the study of numerous real systems,it was not designed to understand delay propagation,a process that presents several idiosyncrasies.First,delays propagate in a non-trivial way:a small delay in a flight(e.g.below 10–15 min)can usually be recovered during the enroute phase,while larger delays are linearly propagated to the destination airport.As GC is a metric that mostly detects linear causalities,it can yield unreliable results when the delay propagated is close to,or smaller than,the previously mentioned threshold.Second,a true causality can only be guaranteed considering all possible relevant sources of information,a condition that is not fulfilled when constructing a network by a pairwise node analysis.Third,the hypothesis that causes must precede the corresponding effects may not be always fulfilled in the case of delays:it is in principle possible that,due to collaborative decision making measures,future restriction capacities at one airport may generate delays in the present in another one,which,in terms of GC,would correspond to a reversal of the time arrow.Finally,GC is ill-designed to analyse time series created by discrete events;speci fically,in the case at hand,many small airports have delay values at only some speci fic times,i.e.when an aircraft arrives,such that most values of their time series are not relevant.This reduces the significance of the links detected,especially for small airports.Due to these limitations,the degree observed for small airports may be in flated;nevertheless,the global messages presented in this contribution will qualitatively be valid.
2.4.Network reconstruction and evaluation
Once a set of stationary time series has been obtained,one for each of thenairports considered,GC can be used to reconstruct the corresponding delay propagation network.Any network can be created by defining its adjacency matrix A,a matrix of sizen-nwithnbeing the number of nodes,whose elementai,jis equal to one when nodesiandjare connected,and zero otherwise.2–4Consequently,in order to reconstruct the delay propagation network,all pairs of airports(i,j)have to be tested by calculating the GCF-value between the corresponding time series,andai,jhas to be set to one if theF-value is statistically significant(significance level of 0.05).
At this stage,it is important to describe what phenomena are represented by the resulting networks.First of all,a link between two airports(i,j)indicates that the delay at landing atjis driven by the delay previously observed ati.As delays are measured at landing,each link synthesises all the elements taking place between two landings:that is,not just the flight itself,but also the turn-around process at the airporti,the potential delay generated by connecting passengers,etc.Finally,a similar result may be obtained by considering the average delay at take-off-note that,in this case,the(i,j)link would include information about the turn-around process at airportjand not ati.
Different topological metrics can then be extracted from A,each of them describing some specific structural characteristic of the network.27In this work,we consider the following ones,for being the most relevant from the point of view of delay propagation:
(1)Link density is defined as the proportion of links that are active,with respect to the total number of potential links,i.e.
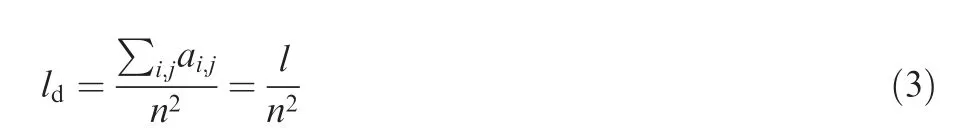
Following the standard notation,nandlrespectively denote the number of nodes and links in the network.The higherld,the more connected is the network:delays are then easily propagated through it,with less possibilities for stopping the diffusion process.
(2)Transitivity measures the presence of triangles in the
network.28It is mathematically defined as the relationship between the number of triangles in the networkNΔ(three nodes with edges between each pair of them),and the number of connected triplesN3(groups of three connected nodes):
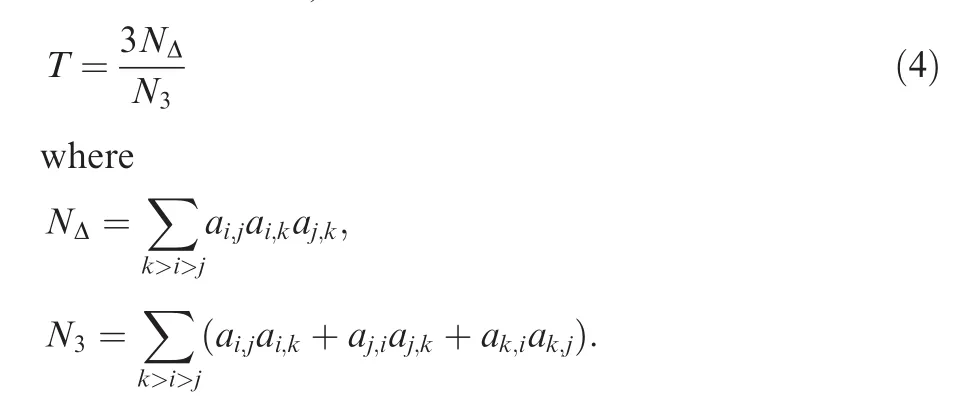
The presence of a high number of triangles indicates that groups of three airports are strongly connected,such that a delay generated in any one of them is easily propagated to the others.
(3)Assortativity representstheconditionalprobabilityP(k0|k),i.e.the probability of a link from a node of degreekto point to a node of degreek0.When expressed mathematically,it is defined as29:
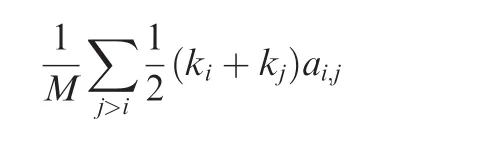
Mbeing the total number of links in the network.A positive assortativity indicates that nodes tend to connect with equally connected nodes.A negative value,on the other side,indicates the abundance of highly connected-isolated nodes links.From the point of view of delay propagation,a positive assortativity suggeststhat delay-propagating airports are preferentially connected between them,thus creating communities in which delays freely diffuse.
(4)Efficiency of a network represents how easily information(here,delays)can move between two nodes,i.e.how many transitional nodes one has to pass by in order to reach the ‘destination’.The efficiency is defined by considering the inverse of the harmonic mean of the distances between pairs if nodes30:
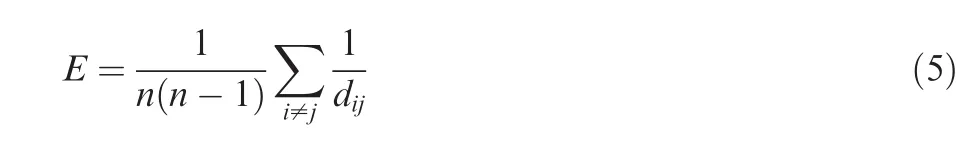
dijbeing the distance(or the number of jumps)between nodesiandj.
(5)Diameter is the greatest distance between any pair of nodes.It thus indicates how many flights are needed for delays to spread across the whole system.
(6)Information content(IC).This metric assesses the presence of regularities in the adjacency matrix,i.e.of mesoscale structures that contain small amounts of nodes.31It merges pairs of nodes that imply the lowest loss of information,until shrinking the network to a single node.This metric thus represents the amount of information encoded within the structure of the network where small values correspond to complex topology and higher values to a random-like structure.
In some cases,it is known that the value of the metric alone is not enough to understand if the associated topological feature is relevant or not.For instance,the efficiencyEstrongly depends both on the structure of the network,and on its number of links.ComparingEfor two networks is thus meaningless,unless the value is normalised with respect to the number of links composing each network.This is accomplished by creating a large ensemble(n=1000)of random Erdo¨s-Renyi(ER)graphs,32each one of them with the same number of nodes and links as in the original network.The Z-Score of the valuemof the metricMis then calculated as:
lMand rMrespectively being the average and the standard deviation of the ensemble values.As in the time series detrending process(see Section 2.2),large positive and negative values ofmZ–Scorerespectively indicate metrics significantly above or below the expected value.
3.Results
3.1.Delay propagation through airports
As an initial analysis,we consider the reconstruction of networks representing how delays propagate through different airports.To this end,a time series has been calculated for each airport,representing the average landing delay in one-hour window;pairs of airports(i.e.nodes in the network)have then been connected by a link if a statistically significant(F-value<0.05)Granger Causality is detected between the corresponding time series.As previously discussed in Section 2.4,two airports are then connected if a delay propagation is inferred from the delay time series,allowing us to reconstruct the whole structure created by delays propagation.
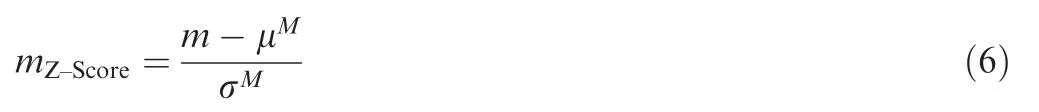
Fig.4(in all cases,the size of nodes is proportional to their number of operations,and their colour to the out-degree(from green to red))depicts the resulting network.As the network is too densely connected to allow for a visual inspection,the same figure depicts the sub-network created by the 30 busiest airports(right panel).As an initial observation,it can be appreciated that the top-30 network is relatively sparse,indicating that few delays are propagated between the most important airports.
In order to better understand the role played by the different airports,Fig.5(a)and(b)reports the out-and in-degrees of nodes,as a function of the number of flights they operated.A clear inverse relation can be observed,indicating that the most important airports in terms of delays propagation are the smallest ones.This is aligned with what observed in other air transport networks,as for instance the European33,12and USA ones.18Fig.5(c)depicts the relation between the in-and out-degree of nodes,the former representing how strongly one airport is influenced by its neighbours,the latter how strongly it can influence other airports.A direct relation between both quantities can be observed,as illustrated by the linear fit(red dashed line,slope=0.618,r=0.643).A couple of interesting exceptions can be found,as for instance ZWHM,ZLHZ and ZUKJ,which mostly transmit delays to the network;and ZUBD,which mainly receives them.Additionally,Fig.6 depicts the in-and out-degree of nodes as a function of the average delay observed at each airport.Due to the high correlation between airport sizes and delays,results are qualitatively similar to what reported in Fig.5(a)and(b).
In order to validate the previously presented results,the case of the Beijing Capital International Airport(ZBAA)has been further studied.Specifically,the time series of this airport and of the 21 airports Granger-causing its delays have been extracted,and a random noise added to them(Gaussian distribution with zero mean and variable variance).Fig.7 represents the evolution of the averagep-value of the causality between the 21 airports and ZBAA(Fig.7(a)),and the average fraction of statistically significant links(Fig.7(b))as a function of the variance of the noise.If the detected causality links were just the result of random fluctuations,theirp-value would be independent from the magnitude of the added noise.On the contrary,Fig.7 clearly shows that the noise confounds the detection of causalities,such that half of the links are lost for a noise level of 1.0(equivalent,by construction,to the standard deviation of the time seriesD0).
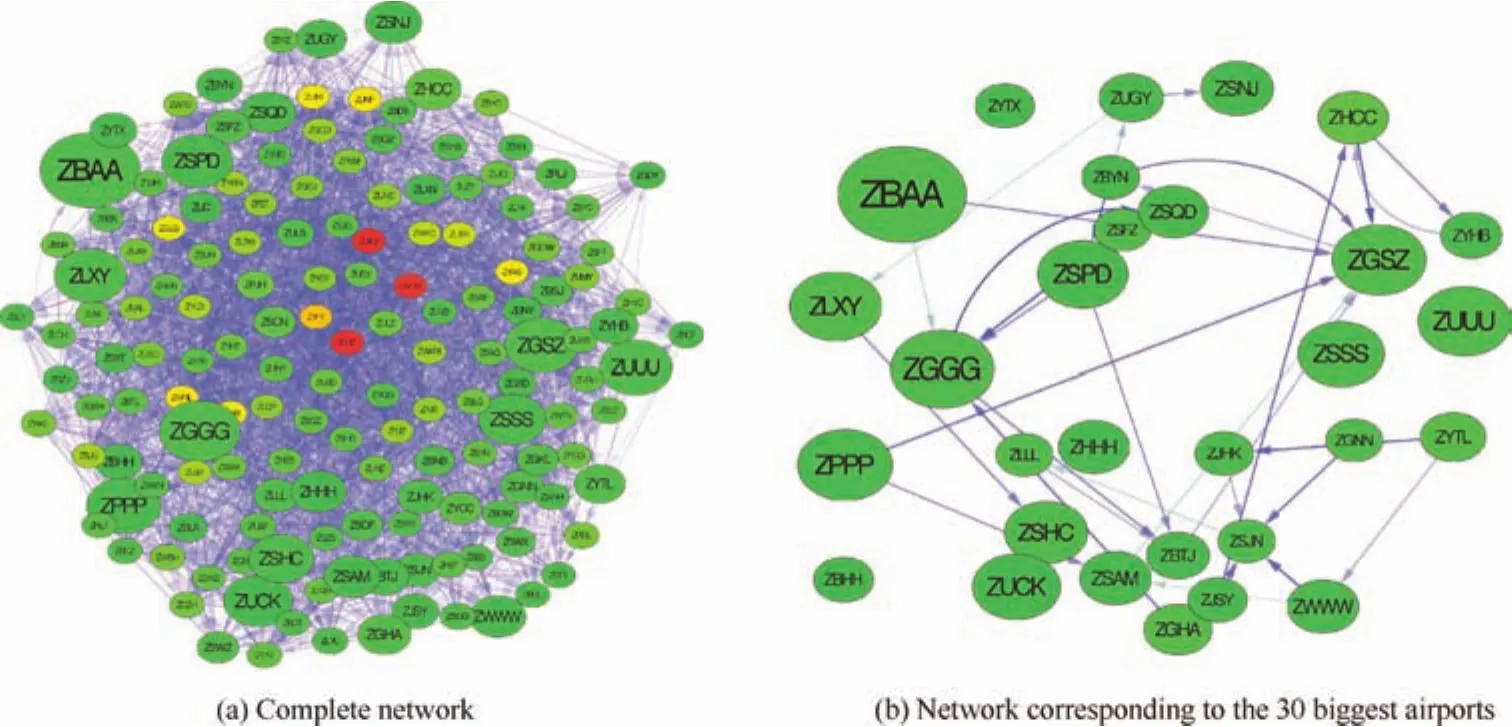
Fig.4 Airports delay propagation networks.
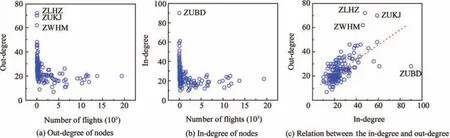
Fig.5 Analysis of nodes’role in the airport delay propagation networks.
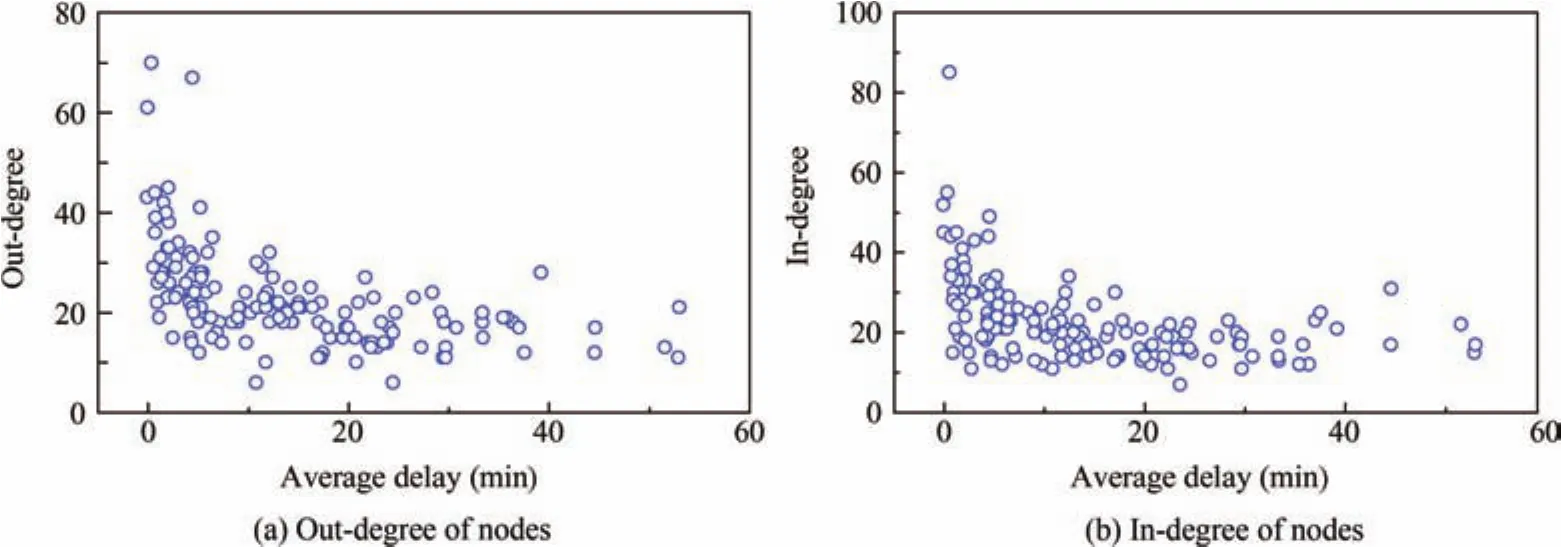
Fig.6 Out-and in-degree of nodes,as a function of the average delay observed in the corresponding airport.
Finally,Table 1 reports the information corresponding to the five most important airports for delays propagation,i.e.according to the out-degree.It is important to note that some of the most important airports detected operate a very small number of flights-for instance,Kaili Huangping Airport and Hami Airport respectively operated 7 and 6 flights in the time window considered.This issue,and the problems it may cause,will be discussed in Section 4.
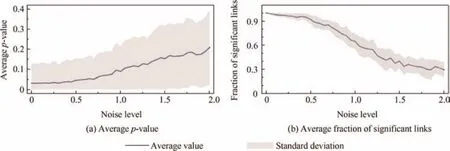
Fig.7 Average p-value and average fraction of significant links between ZBAA and the 21 airports Granger-causing it,as a function of the quantity of noise introduced in the time series.
3.2.Airlines’contribution to delay propagation
In order to shed light on the contribution of individual airlines to the global delay propagation process,in this Section we reconstruct and analyse the delays generated by the three most important ones:Air China(ICAO code CCA),China Eastern Airlines(CES),and China Southern Airlines(CSN).It has to be noted that the relationship between individual airlines and the global delay propagation network is far from trivial.Specifically,the full delay propagation process can be seen as a multi-layer network,in which each layer represents a different airline,and the global picture is obtained as the projection of all layers into a single network.34Such projection is nevertheless not linear.A propagation between airportsAandBmay be present as a global phenomenon in the complete network,but may not be statistically significant in each layer.On the other hand,delays may be propagated betweenAandBby two or more airlines,but this may cancel out when they are considered together:a link may be present in several layers,but may disappear in the global network.
Fig.8 represents the in-and out-degree of nodes for the three considered airlines,as a function of the number of flights operated by each one of them on those airports.The same inverse relation of Fig.5 can be observed,albeit stronger:most delays are generated and propagated by small airports,probably because of their lack of resources for delay mitigation,and because of their role in providing passengers to the more central hubs-an hypothesis that will be confirmed in Section 3.3.
Additionally,Table 2 presents a comparison of the most important topological metrics for the three considered airlines.While they present qualitatively similar properties,the three airlines’networks are substantially different from the global delay propagation network,as described in Table 3.Specif ically,they present a higher transitivity and a lower assortativity and Information Content.The propagation of delays within each airline is thus characterised by a less random structure,composed of many triangles centred on some focal small airports.This suggests a process in which delays are generated at small airports,for then being propagated to one of the hubs of the system and then back again to small airports.
It is also worth noting that the degree density of the individual airline networks is higher than what obtained for the global propagation network,approx.0.55 vs.0.296.Two main causes are behind such behaviour.First of all,CC is not a linear operation,such that the global network is not simply the sum of the links observed for different airlines;as an example,if one finds a causalitya-bfor one airline,and a second causalityb-afor another airline,the net result may be the absence of any causality relation betweenaandb.The interested reader may refer to Ref.34 for a throughout discussion of this problem.Second,the three considered airline networks are smaller than the global network,as no airline operated in all the Chinese airports;approx.100 vs.152 nodes.Even if all links observed for individual airlines were present in the global network,the larger size of the latter would imply a smaller link density.
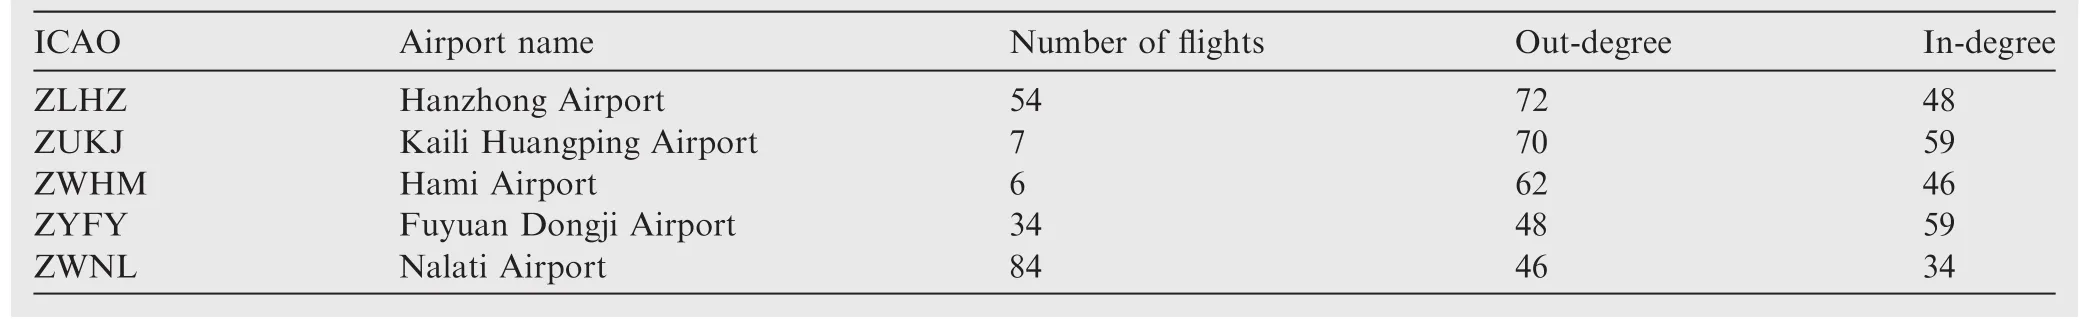
Table 1 Most central airports,according to the out-degree.
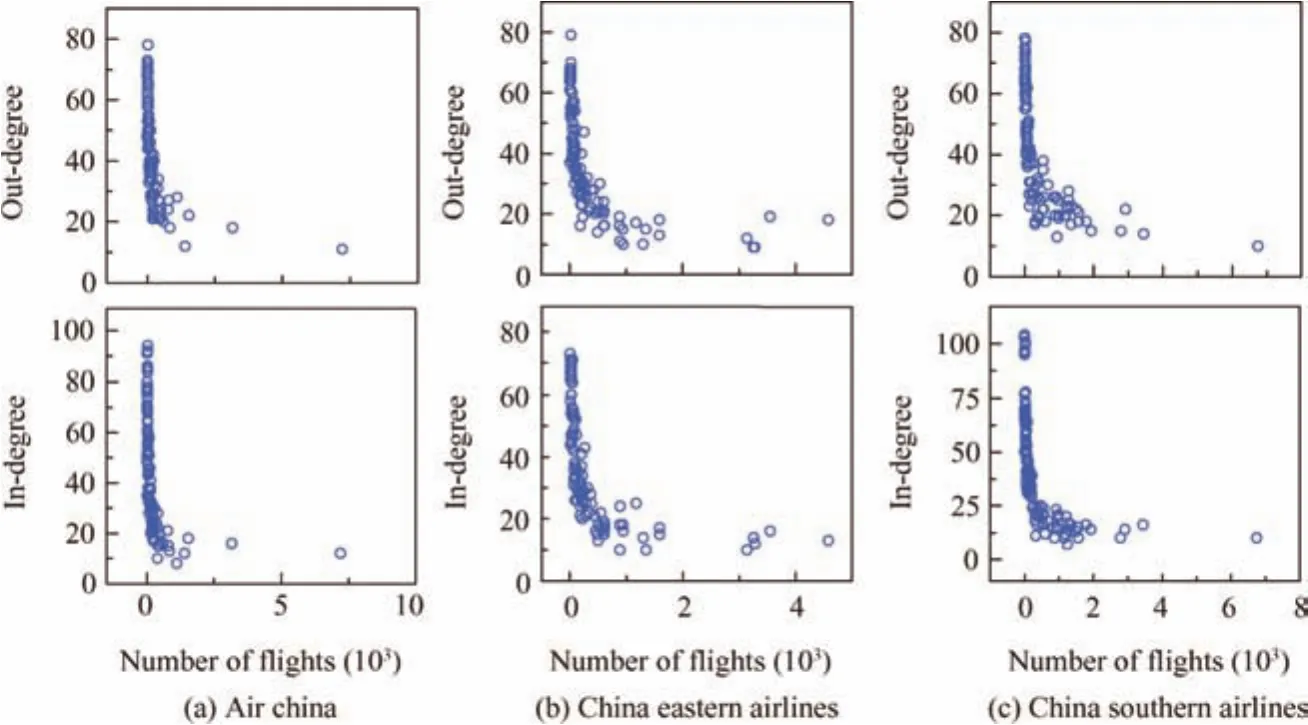
Fig.8 Degree of nodes vs number of monthly flights they operated,for the three most important Chinese airlines.
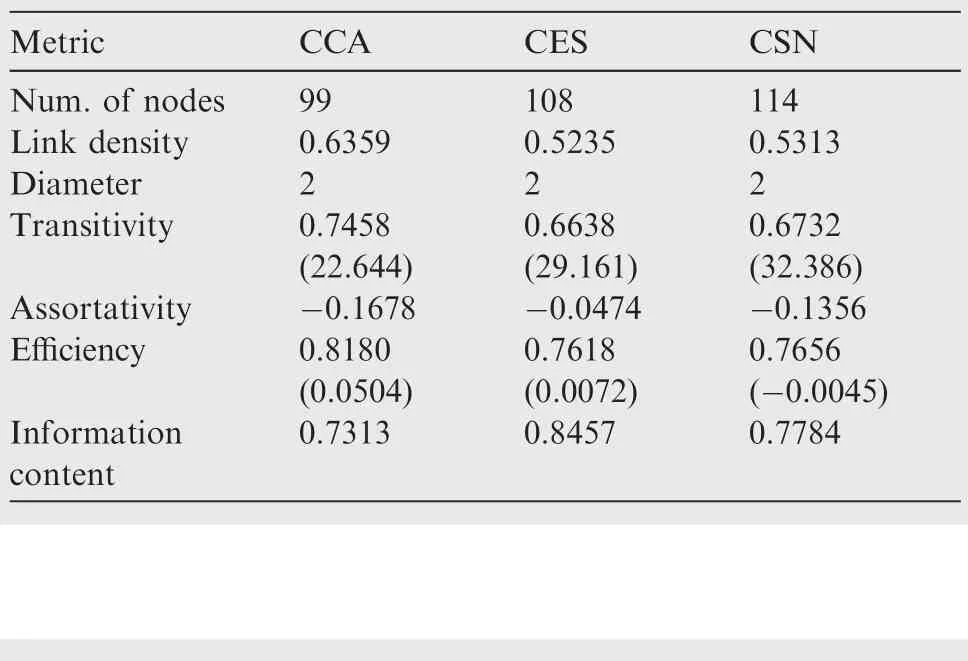
Table 2 Synthesis of airlines’topological metrics.
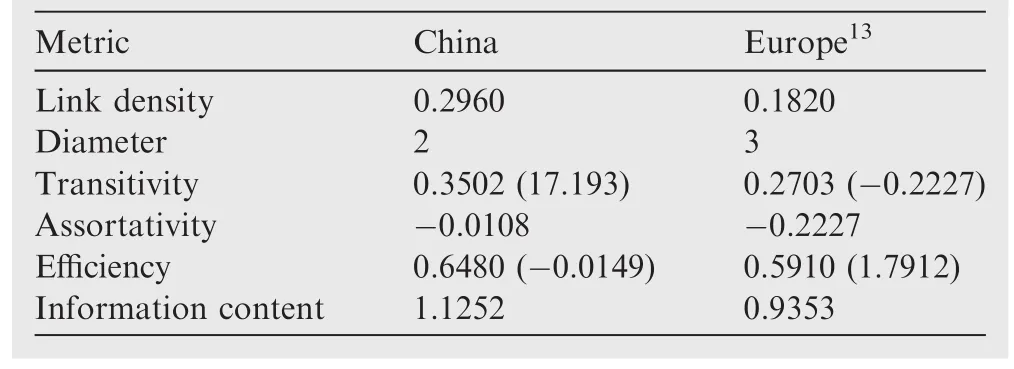
Table 3 Synthesis of topological metrics.
3.3.Delay propagation through aircraft
As a last topic,we study how delays propagate through different aircraft types.As aircraft size and engine type are related to the kind of role they execute within the network,such analyses will yield us information about which roles are most important for delays propagation.
All flights have been categorised in four groups,as described by Table 4.The fourth group,comprising mostly executive jets and very small aircraft,has been discarded for not being relevant from a commercial point of view.Afterwards,three time series have been created,corresponding to the hourly average landing delay of all flights executed by these three groups of aircraft,and the GC calculated.
The network only comprises one statistically significant link,C-B(turbo prop-narrow body,p-value of 0.0225).This suggests that there is a strong delay propagation from turbo prop aircraft,which collect passengers from small and regional airports,to medium range national flights.This is clearly aligned with the results presented in Sections 3.1 and 3.2:any delay generated in regional(thus small)airports is propagated to the whole system by the hub-and-spoke structure.Small airports are thus key to understand the driving forces behind delays propagation.
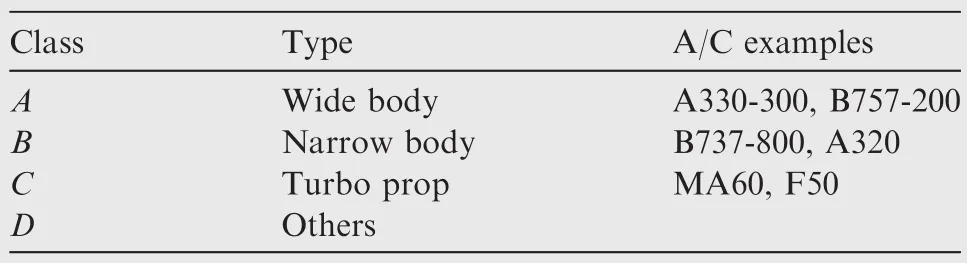
Table 4 Classification of aircraft.
4.Conclusions and discussion
In this contribution,we proposed the use of the well-known GC metric to describe the structure underlying the phenomenon of delay propagation in the Chinese air transport system.By obtaining detrended time series representing average landing delays at different airports,and by calculating the presence of a causality between pairs of them,we reconstructed the complex network representing delay propagations.Such network has then been studied using standard network metrics,to detect its specific characteristics,and the presence of notable nodes.While this approach is common in other fields of research,the most important of which being neuroscience,11,35it has seldom been used in air transport.
The proposed approach allowed us to highlight the importance of small airports,which mostly contribute to the propagation of delays.The most common scenario suggested by the presented results involves a turbo-prop aircraft arriving late at a small airport.As not enough buffers are present,the next flight will propagate the delay back to the hub-but such delay would be diluted over all the flights operating there.Finally,the same aircraft undertakes another trip,thus propagating the delay to a second small airport,and creating a causality links between the first and the last one.This has been con-firmed by the analysis of the delay propagation when considering aircraft types:a statistically significant causality relation has been detected from turbo-props to narrow body aircraft,suggesting that a delay appearing at small airports is propagated,through a flight operated by a turbo-prop aircraft,to the big hubs of the system.This behaviour has been observed in the three most important airlines,suggesting that it is not due to specific airline procedures,but is instead due to a systemic cause.
These insights can be used to design strategies to improve the system,and dampen the delay propagation.Specifically,our analysis suggests that big airports are operating correctly,and that,instead,the connections incoming from small airports should be improved.This may be achieved,on one hand,by extending the CDM process to small airports,such that delays incoming from them can be taken into account while planning flights at hubs.On the other hand,the technology available at small airports may need to be improved,in order to allow them to cope with,for instance,bad weather.
1.Dong N.Current situation,cause of flight delays and governance path of china’s civil aviation.J Beijing Univ Aeronautics Astronautics(Soc Sci Ed)2013;26:25–32.
2.Newman ME.The structure and function of complex networks.SIAM Rev2003;45(2):167–256.
3.Boccaletti S,Latora V,Moreno Y,Chavez M,Hwang D-U.Complex networks:structure and dynamics.Phys Rep2006;424(4):175–308.
4.Zanin M,Lillo F.Modelling the air transport with complex networks:a short review.Eur Phys J-Spec Top2013;215(1):5–21.
5.Lordan O,Sallan JM,Simo P.Study of the topology and robustness of airline route networks from the complex network approach:asurveyand research agenda.JTranspGeog2014;37:112–20.
6.Lin CC,Chen YC.The integration of Taiwanese and Chinese air networks for direct air cargo services.Transport Res A-Pol2003;37(7):629–47.
7.Wang FH,Jin FJ,Zeng G.Geographic patterns of air passenger transport in China.Scientia Geographica Sinica2003;23(5):519–25.
8.Li W,Cai X.Statistical analysis of airport network of China.Phys Rev E2004;69(4):046106.
9.Wang J,Mo H,Wang F,Jin F.Exploring the network structure and nodal centrality of China’s air transport network:a complex network approach.J Transp Geog2011;19(4):712–21.
10.Cai KQ,Jun Z,Du WB,Cao XB.Analysis of the Chinese air route network as a complex network.Chin Phys B2012;21(2):028903.
11.Bullmore E,Sporns O.Complex brain networks:graph theoretical analysis of structural and functional systems.Nat Rev Neurosci2009;10(3):186–98.
12.Cook A,Tanner G,Zanin M.Towards superior air transport performance metrics–imperatives and methods.J Aerospace Oper2013;2(1–2):3–19.
13.Belkoura S,Zanin M.Phase changes in delay propagation networks.Seventh international conference on research in air transport;2016.
14.Granger CW.Some recent development in a concept of causality.J Econometrics1988;39(1):199–211.
15.Granger CW.Causality,cointegration,and control.J Econ Dyn Con1988;12(2):551–9.
16.Beatty R,Hsu R,Berry L,Rome J.Preliminary evaluation of flight delay propagation through an airline schedule.Air Traf fic Control Quarterly1999;7(4):259–70.
17.Fan L,Wu F,Zhou P.Ef ficiency measurement of Chinese airports with flight delays by directional distance function.J Air Transport Manage2014;34:140–5.
18.AhmadBeygi S,Cohn A,Guan Y,Belobaba P.Analysis of the potential for delay propagation in passenger airline networks.J Air Transport Manage2008;14:221–36.
19.Fleurquin P,Ramasco JJ,Eguiluz VM.Systemic delay propagation in the US airport network.Sci Rep2013;3(3):1159.
20.Hoover KD.Causality in macroeconomics.Cambridge:Cambridge University Press;2001.
21.Brovelli A,Ding M,Ledberg A,Chen Y,Nakamura R,Bressler SL.Beta oscillations in a large-scale sensorimotor cortical network:Directional influences revealed by granger causality.P Natl Acad Sci USA2004;101(26):9849–54.
22.Kamin′ski M,Ding M,Truccolo WA,Bressler SL.Evaluating causal relations in neural systems:Granger causality,directed transfer function and statistical assessment of significance.Biol Cybern2001;85(2):145–57.
23.Roebroeck A,Formisano E,Goebel R.Mapping directed influence over the brain using granger causality and fMRI.Neuroimage2005;25(1):230–42.
24.Brockwell PJ,Davis RA.Time series:theory and methods.New York:Springer Science&Business Media;2013.
25.Bressler SL,Seth AK.Wiener–granger causality:a well established methodology.Neuroimage2011;58(2):323–9.
26.Granger CW.Testing for causality:A personal viewpoint.J Econ Dyn Con1980;2:329–52.
27.Costa LdF,Rodrigues FA,Travieso G,Villas BPR.Characterization of complex networks:a survey of measurements.Adv Phys2007;56(1):167–242.
28.Newman ME.Scientific collaboration networks.I.Network construction and fundamental results.Phys Rev E2001;64(1):016131.
29.Newman ME.Assortative mixing in networks.Phys Rev Lett2002;89(20):208701.
30.Latora V,Marchiori M.Efficient behavior of small-world networks.Phys Rev Lett2001;87(19):198701.
31.Zanin M,Sousa PA,Menasalvas E.Information content:assessing meso-scale structures in complex networks.EPL(Europhys Lett)2014;106(3):30001.
32.Bolloba′s B.Random graphs.Cambridge:Cambridge University Press;2001.
33.Jetzki M.The propagation of air transport delays in Europe[dissertation].Aachen:RWTH Aachen University;2009.
34.Zanin M.Can we neglect the multi-layer structure of functional networks?Phys A:Stat Mech Appl2015;430:184–92.
35.Zanin M,Papo D,Sousa PA,Menasalvas E,Nicchi A,Kubik E,et al.Combining complex networks and data mining:why and how.Phys Rep2016;635:1–44.
23 May 2016;revised 22 September 2016;accepted 14 December 2016
Available online 14 February 2017
*Corresponding author at:Innaxis Foundation&Research Institute,Jose′Ortega y Gasset 20,28006 Madrid,Spain.
E-mail address:mzanin@innaxis.org(M.Zanin).
Peer review under responsibility of Editorial Committee of CJA.
 CHINESE JOURNAL OF AERONAUTICS2017年2期
- CHINESE JOURNAL OF AERONAUTICS的其它文章
- High-temperature tribological behaviors of a Cr-Si co-alloyed layer on TA15 alloy
- Analysis and control of the compaction force in the composite prepreg tape winding process for rocket motor nozzles
- Impact of lubricant traction coefficient on cage’s dynamic characteristics in high-speed angular contact ball bearing
- Variable stiffness design of redundantly actuated planar rotational parallel mechanisms
- Adaptive formation control of quadrotor unmanned aerial vehicles with bounded control thrust
- Constrained adaptive neural network control of an MIMO aeroelastic system with input nonlinearities