
DNN-Based Joint Classification for Multi-source Image Change Detection
2017-10-10 11:30:59WenpingMaZhizhouLiPuzhaoZhangTianyuHuandYueWu
Wenping Ma, Zhizhou Li, Puzhao Zhang, Tianyu Hu, and Yue Wu
DNN-BasedJointClassificationforMulti-sourceImageChangeDetection
Wenping Ma*, Zhizhou Li, Puzhao Zhang, Tianyu Hu, and Yue Wu
Multi-source change detection is an increasingly presented issue and it is of great significance in environmental and land exploration. Multi-source remote sensing images are obtained by different sensors, which usually are not completely consistent in terms of spatial resolution, spectral bands number in the same region. In this paper, we propose a novel joint classification framework for multi-source image change detection, the multi-source image-pair are generated by different sensors, such as optical sensor and synthetic aperture radar, respectively. This frame-work is established for feature learning, which is based on deep neural networks. Firstly, in order to segment the optical image, deep neural networks are essential to extract deep features for clustering segmentation. Then the stacked denoising autoencoders are used to learn the capability of classification by training the reliable training examples, which are selected from optical image segmentation results that are unchanged area corresponded ground truth. Next, the other image of the image-pair is entered in the trained stacked denoising autoencoders to classification automatically. Afterwards, two images passed joint classification are obtained. Finally, the difference image is produced by comparing two images passed joint classification. Experimental results illustrate that the method can be applied to multi-source images and outperforms the state-of-the-art methods.
change detection; multi-source image; deep neural networks; feature learning
1 Introduction
Image Change detection is the process to determine and analyze the changes of regional features between two given images observing the same surface area at different times[1]. It combines corresponding characteristics and remote sensing imaging mechanism to identify and analyze the regional characteristics change, including changes in object location, scope changes and surface properties[2]. With the rapid development of remote sensing techniques, the research of multi-source image change detection is an increasingly popular issue and is of great significance in environmental and land exploration[3]and natural disaster appraisal[4]and medical diagnosis[5]etc.. Researchers can capture information of earth’s surface by using different sensors, including different aero sensors, satellite sensors etc.. These sensors present multiple information of terrestrial globe for the ground, oceans, monitoring research[6]. However, remote sensing images obtained by different sensors usually are not completely consistent in terms of spatial resolution, spectral bands number and range of wavelength and radiometric resolution[7], effective exploitation of such data is a sticky issue, the traditional change detection methods are difficult to implement directly in multi-source image[8].
The purpose of change detection is to determine the group of pixels that are inconsistent between multi-temporal images. These pixels comprise the change image[9]. Various approaches aimed at multi-source image change detection are presented[10]. For instance, the methods of data fusion and kernel-based integration are used extensively in multi-source image change detection. Li[11]proposed the fusion of remotely sensed images and GIS data for automatic change detection. Gustavo et al.[12]proposed kernel-based framework in multi-source remote sensing data change detection. Du et al.[13]proposed the method of integrating multiple features for remote sensing images change detection. Zhang et al.[14]proposed a deep architecture-based feature learning for mapping-based feature change analysis (MBFCA) for multi-spatial-resolution remote sensing images change detection. In spite of many successful cases in the detection of environmental change, there exist a lot of technological problems in multi-source image change detection.
Because of the improvement of the spatial, temporal and spectral resolution of remote sensing images, the maps in disaster area can be quickly acquired when the disaster occurs[15], and the joint analysis for various image data is essential to disaster evaluation. For instance, obtaining excellent optical images by optical sensor needs the fine condition with the absence of cloud and better solar light[16]. We cannot get high-quality optical images immediately when the disaster occurs in rainy or cloudy weather[17]. However, SAR sensor has the characteristics of active imaging, and it has no effect on the weather and illumination[18]. SAR images can be obtained immediately whatever the weather is. But, SAR images do not have enough detailed spatial information while the optical images have. Hence, the technique of joint interpretation in multi-source image has a great significance[19]. In general, image change detection can be classified into three procedures: image preprocessing, generate initial difference map and segmentation and analysis of difference map[20].
In this paper, we propose a novel method to solve the issue of multi-source image change detection. The method described here is called deep neural networks (DNN)-based joint classification (DBJC) for multi-source image change detection. We focus on developing a technique of change detection on earth’s surface based on a time series of terrene cover maps originated from different sensors. In our method, we suppose that the unchanged areas are larger than the changed areas. The method we proposed is joint classification based on DNN[21], which uses stacked denoising autoencoders to learn capability of classification by training the reliable training examples, which are selected from unchanged area corresponded ground truth in optical image segmentation results. Then the other image of the image-pair is entered in the trained stacked denoising autoencoders to classification automatically. Afterwards, two images passed joint classification are obtained. Multi-layer neural networks were proved to be successful for extracting high-level features and classification in ship detection[22].
The rest of this article is divided into four parts as follows: Section 2 suggests the description of the problem and our motivations for multi-source image change detection. Section 3 exhibits the application details of the proposed technique. Experimental results on real data set and synthetic images are shown in the Section 4. Section 5 summarizes the conclusion of our work.
2 Problem and Motivation
In this paper, the propose of multi-source image change detection is to find out the changed areas of the given image-pair derived from different sensors. One co-registered multi-source image-pair is considered, one is SAR image denoted by:IS={I(x,y)|1≤x≤M,1≤y≤N}, and the other one is optical image denoted by:IO={I(x,y)|1≤x≤M,1≤y≤N}, SAR and optical images are of sizeM×Nand are obtained in the same area at different timest1andt2. The change detection results are presented in the form of binary imageDI={di(x,y)∈{0,1}|1≤x≤M,1≤y≤N}, wheredi(x,y)=0 represents that the pixel at location (x,y) is unchanged, whiledi(x,y)=1 means it is changed.
Because of different imaging mechanisms of multi-source image, the spatial information of two images is not consistent. We consider establishing a model based on DNN to explore inner relation between two images which obtained by different sensors. Since the majority of objectives in the two images are the same, we assume they have some relation in high-level features[23]. We can find the changed areas between two images by exploring their inner connection[24,25]. We use autoencoders to extract deep feature within the local neighborhood of the pixels. The flowchart of the method in this article can be expressed in Fig.1. We use clustering results of one image to guide the classification of another image, aiming at converting two images with different types of data into the same type of data.
Fig.1Flowchartofourmethod: (1)Preprocessingistakeninthetwogivenmulti-sourceimages, (2)Deepneuralnetworksareusedtoextractthedeeplevelfeaturesforopticalimages, (3)TheclusteringsegmentationresultsofopticalimageareproducedbyfeatureclusteringandthenitisusedtoselectreliablelabelsfortrainingSDAEforlearningthecapabilityofclassification, (4)ThetrainedSDAEisusedtoclassifytheSARimage,and(5)Thechangedetectionresultsareobtainedbycomparisonoftwoimagespassedjointclassification.
2.1Unsupervisedfeaturelearningandclustering
An artificial neural network has good performance in pattern recognition and machine learning[26], and has the capability of representing non-linear function. Stacked denoising autoencoders (SDAE) are deemed to have high-performance in learning edge features of image patches via training it unsupervised[27]. We use fuzzy c-means (FCM) algorithm[28]cluster optical image. In 2006, Chuang and Tzeng presented the FCM algorithm that utilizes spatial information reducing noisy spots for image segmentation[29]. In our clustering approach, we use feature clustering, the features which are extracted in the local neighborhood of the pixels by SDAE. In the proposed clustering segmentation in 1997, Ohm and Ma used different features of pixels field, which indicated its low-complexity and reliable segmentation[30].
2.2 Joint classification
As shown Yellow-River image in Fig.2, the left SAR image is low resolution with ambiguous spatial details, however, the right optical image display its high resolution. Obviously, these two images are incommensurability directly. The model of SDAE contained a classifier shows a lower classification error in classification problem via learning useful high-level representation in image patches[31]. After clustering one image, we choose part of reliable segmentation results as the labels for training SDAE contained classifier supervised to learn the capability of classification. As a result, two images with different types of data are converted into the same type of data via guiding one image clustering results classifying the other one.
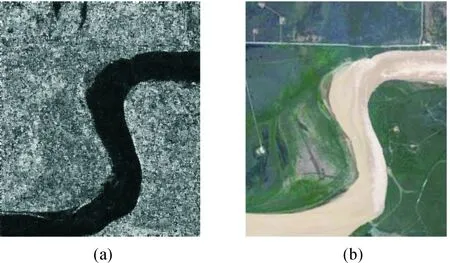
Fig.2Exampleofmultisourceimage-pairobtainedbydifferentsensors,atdifferenttimes: (a)TheSARimageobtainedbyRadarsat,and(b)TheopticalimageacquiredfromGoogleEarth.
3 Methodology
In this session, we will introduce the specific application of the proposed method in this paper. As shown in Fig.1, the flowchart presents the whole process of change detection proposed in our method. For two co-registered images obtained by different sensors, optical and SAR images are image-pair in this paper. First, image preprocessing should be taken in image-pair, and it mainly includes filtering and divides the image into patches. Second, learning deep level features is the key point for clustering optical image. Features based on the extracted previously are used to cluster optical image. Then we choose part of reliable pixels in the optical clustering results as labels, which are selected from unchanged area corresponded ground truth in optical image segmentation results. And the pixels in the SAR image corresponding position is the input of SDAE contained classifier, which is learning the capability of classification. After training SDAE, we input the SAR image patches to the trained SDAE for classifying SAR image. Finally, the difference image (DI) is produced by comparing the image-pair passed joint classification.
3.1 Stacked denoising autoencoders

A general autoencoder includes two parts as follows Fig.3: an encoder and a decoder. The encoder is trained to learn some implicit feature representation, and it is transforming vectorxinto hidden layerh. Its mathematical formula is a mapping followed by a nonlinearity:
hn=fw,b(xn)=sigmoid(wxn+b)
(1)
wherewis anm×nweight matrix andbis a bias vector of dimensionalitym. The sigmoid function is defined as follows:
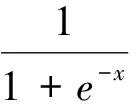
(2)

(3)
wherew′ is an n×m weight matrix andb′is a bias vector of dimensionalityn. For an autoencoder, we optimized the cost function by minimizing the average reconstruction error:
(4)
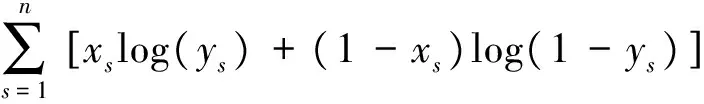
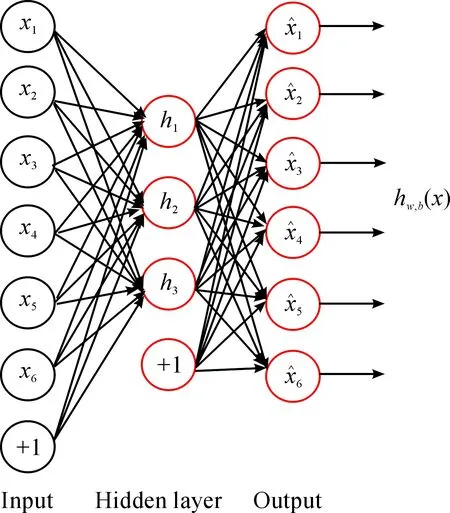
Fig.3Autoencoder(AE):Autoencoderisthebrickofdeepneuralnetworksanditconsistsofanencoderandadecode.Thefirstlayerneurondenotestheinput.Theneuronsinmiddlelayerarethecharacteristicslearningfromthefirstlayer,thethirdlayeristhereconstructedversionoftheinput.

In our method, the networks are fully connected multi-hidden layer SDAE, which is built for learning the local features. Multi-hidden layer SDAE includes multiple autoencoders. The training process is that each layer of the network is trained in layer-wise, and then the whole deep neural network is trained. The hidden layer of AE1(h(1)) is the input of AE2, as shown in Fig.4,h(1)as the first order representation,h(2)as the second order representation. The 2-hidden-layer SDAE with structure 6-3-4 is presented in Fig.5, where the deep neural networks with full structure 6-3-4-3-6. 6, 3 and 4 is the number of neurons in each layer. In our method, the second order representation is the useful features for joint classification.
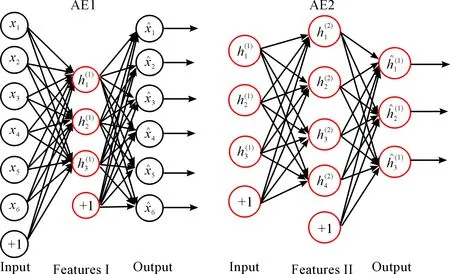
Fig.4ThehiddenlayeroftheAE1(h(1))istheinputofAE2,h(1)asthefirstorderrepresentation,h(2)asthesecondorderrepresentation.
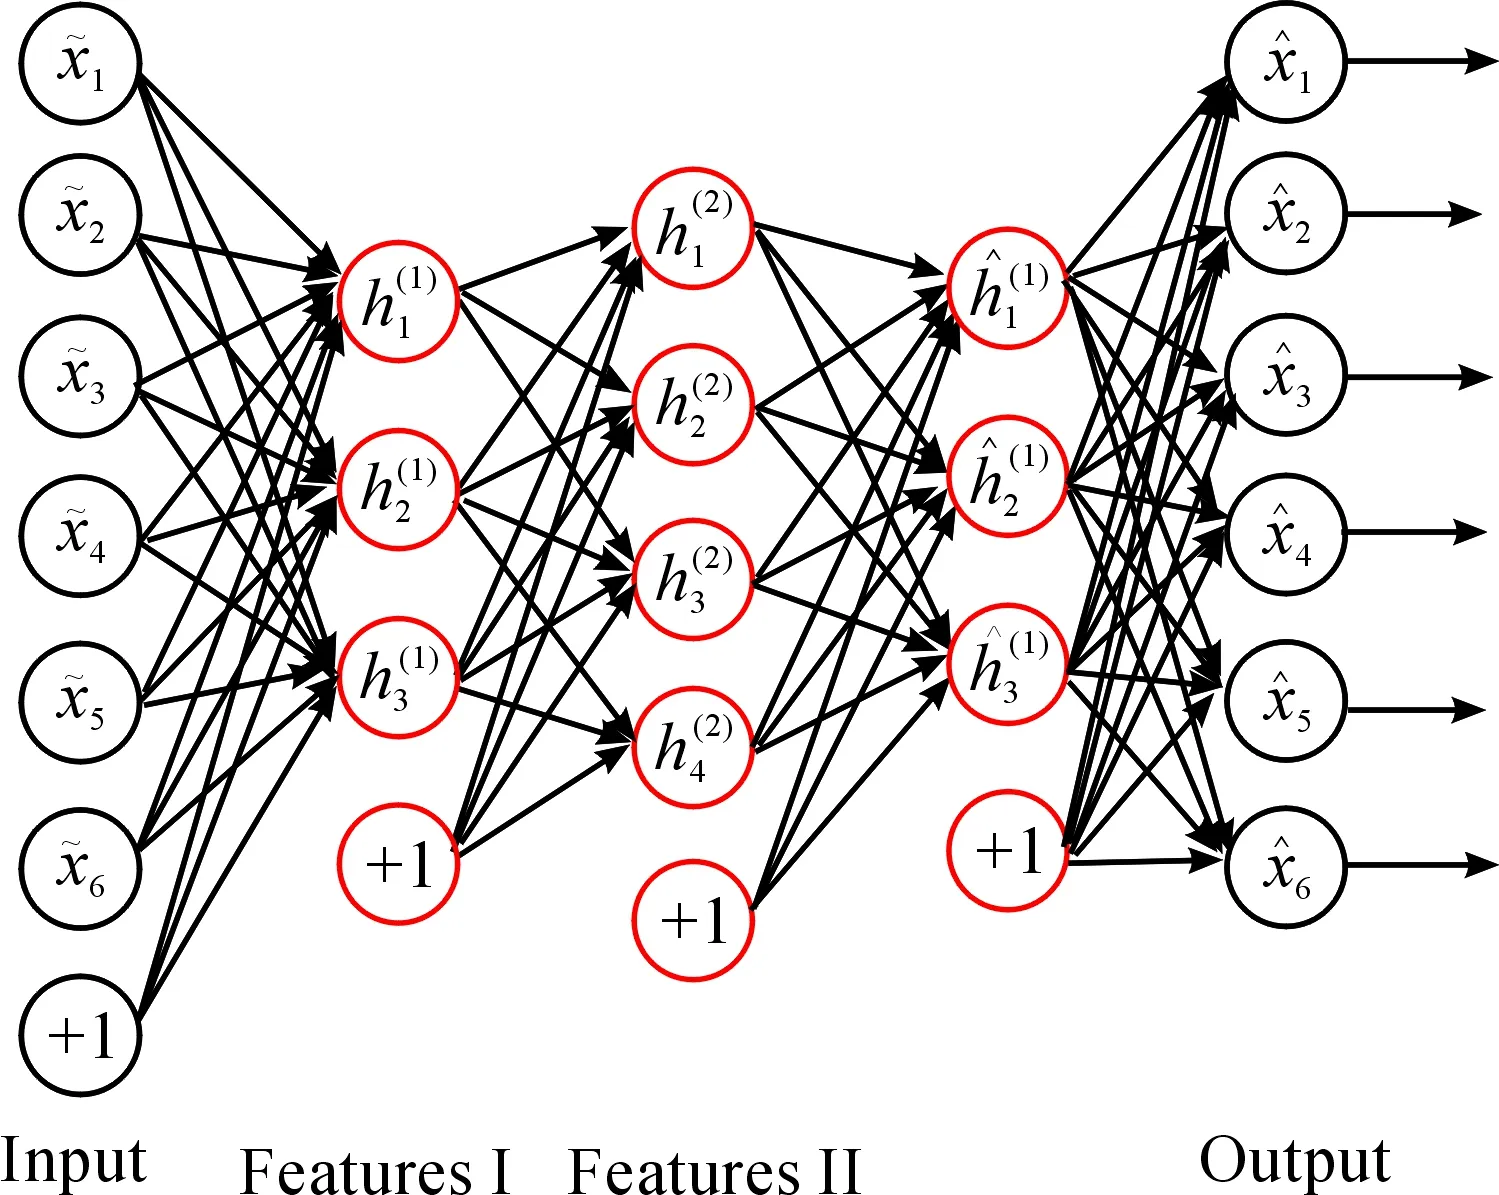
Fig.52-layerSDAEwithstructure6-3-4-3-6:theprocessofpre-trainistrainingeachDAEinlayer-wise,andthetrainingresultsasitsinitializationparameters.Fine-tuningisusedintheentirenetworksunsupervisedbybackpropagationalgorithmtoimprovetheperformance.
3.2 Classifier and fine-tuning
After training the SDAE with capability of classification, we enter the SAR image into the network to extract the deep features. Then, we input high-level representation into a classifier in SAR image classification. After pre-train layer-wise in DAE, the training results are the initialization of the entire multi-layer networks. Then fine-tuning is used in the entire networks unsupervised to improve the performance of classification. Back propagation algorithm and SGD is used in the process of fine-tuning entire network.
Fine-tuning is a common strategy in deep learning, and it can significantly enhance the performance of stacked denoising autoencoders neural networks. Form a higher perspective, the process of fine-tuning treats all layers in the stacked denoising autoencoders as a model, so the value of weight in networks can be optimized in each iteration. In this paper, we use softmax regression as the final classifier (see Fig.6). Softmax regression is generalized from the logistic regression model in multi classification problem. The class labelycan take more than two values in multi classification problem. The function of softmax regression is defined as follows:
(5)
whereθ={w,b},pis the number of classification.
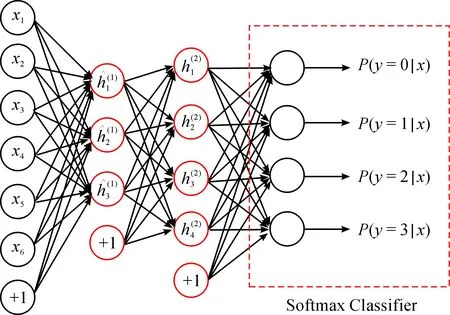
Fig.6Thesecondorderrepresentationh(2)istheinputforsoftmaxclassifier,wesetthenumberofclassificationis4inthislegend.
4 Experiments
In order to demonstrate the effectiveness of DBJC, we test one set of SAR images and three sets of multi-source images (SAR and optical images) in multi-source image change detection problem in this article. The method of mapping-based feature change analysis (MBFCA), principal component analysis method (PCA)[32]and the post-classification comparison (PCC)[33]are selected as the compared methods in this paper. In our method, first, deep neural networks is used to extract the deep level features for optical images, then the clustering algorithm used for the segmentation of optical image. Then we choose part of reliable pixels in the optical clustering results as labels, and the pixels in the SAR image corresponding position is the input of SDAE contained classifier, which is learning the capability of classification, as represented in Section 3.When we use autoencoders to extract deep feature, the size of field window in the image block is 3×3, the larger window may lead to edge blur and Image distortion. We set four different levels deep architecture for SDAE to learn features, they are two layers, three layers, four layers and five layers deep architecture respectively.
4.1 Datasets
In the experiments, there are three pairs of data sets come from Yellow River Estuary Region. The Yellow River data contains two SAR images, whose spatial resolution is 8 m, obtained by Radarsat-2 at the Yellow River Estuary Region in China in June 2008 and June 2009, which are shown in Fig.7(a) and Fig.7(b) with the size of 7666×7692. We choose three typical region a, b and c in red as shown in Fig.7.
The first dataset are two SAR images, shown in Fig.8, which are from the region of the Yellow River Estuary with 306×291 pixels. There are generally two objectives in these maps, i.e. farmland and water. Fig.8(c) is the ground truth that was arose by integrating prior information with photo-interpretation based on the input original images in Fig.8(a) and Fig.8(b).
There are two sets of multi-source images, shown in Fig.9 and Fig.11, in Yellow River Estuary Region. In multi-source images, optical images acquired by Google Earth sharing the same region as shown in corresponding SAR images. These images were co-registered by the method in [34]. The second dataset are two multi-source images, shown in Fig.9, obtained in the region b of Yellow River Estuary. The SAR image acquired by Radarsat, as shown in Fig.9(a).The other image, in Fig.9(b), is the optical image obtained from Google Earth. Two images have a size of 340×290, and Fig.9(c) is produced by integrating prior information based on images Fig.9(a) and Fig.9(b).
The third dataset as shown in Fig.10, obtained in the Mediterranean Sardinia, Italy, in which one is TM image acquired by Landsat-5 in September, 1995, and the other one is the optical image acquired from in July, 1996. Fig.10(a) is the fifth band of TM image, with the spatial resolution 30 m while Fig.10(b) is the corresponding region, optical image obtained from Google Earth, with the spatial resolution is 4 m. Fig.10(c) is the ground truth for reference obtained by manual plotting. Two images are size of 300×412.
The last dataset, shown in Fig.11(a) and (b) with the size of 333×391, consist of one SAR image and one optical. The SAR image is acquired in the region c of Yellow River Estuary, in June 2008. The optical image is acquired from Google Earth in Dec., 2013, whose spatial resolution 4 m. These two images are taken from the same area. The optical image provided by integrated image form QuickBird and Landsat-7. The major area of changed can be observed from the ground truth, shown in Fig.11(c).
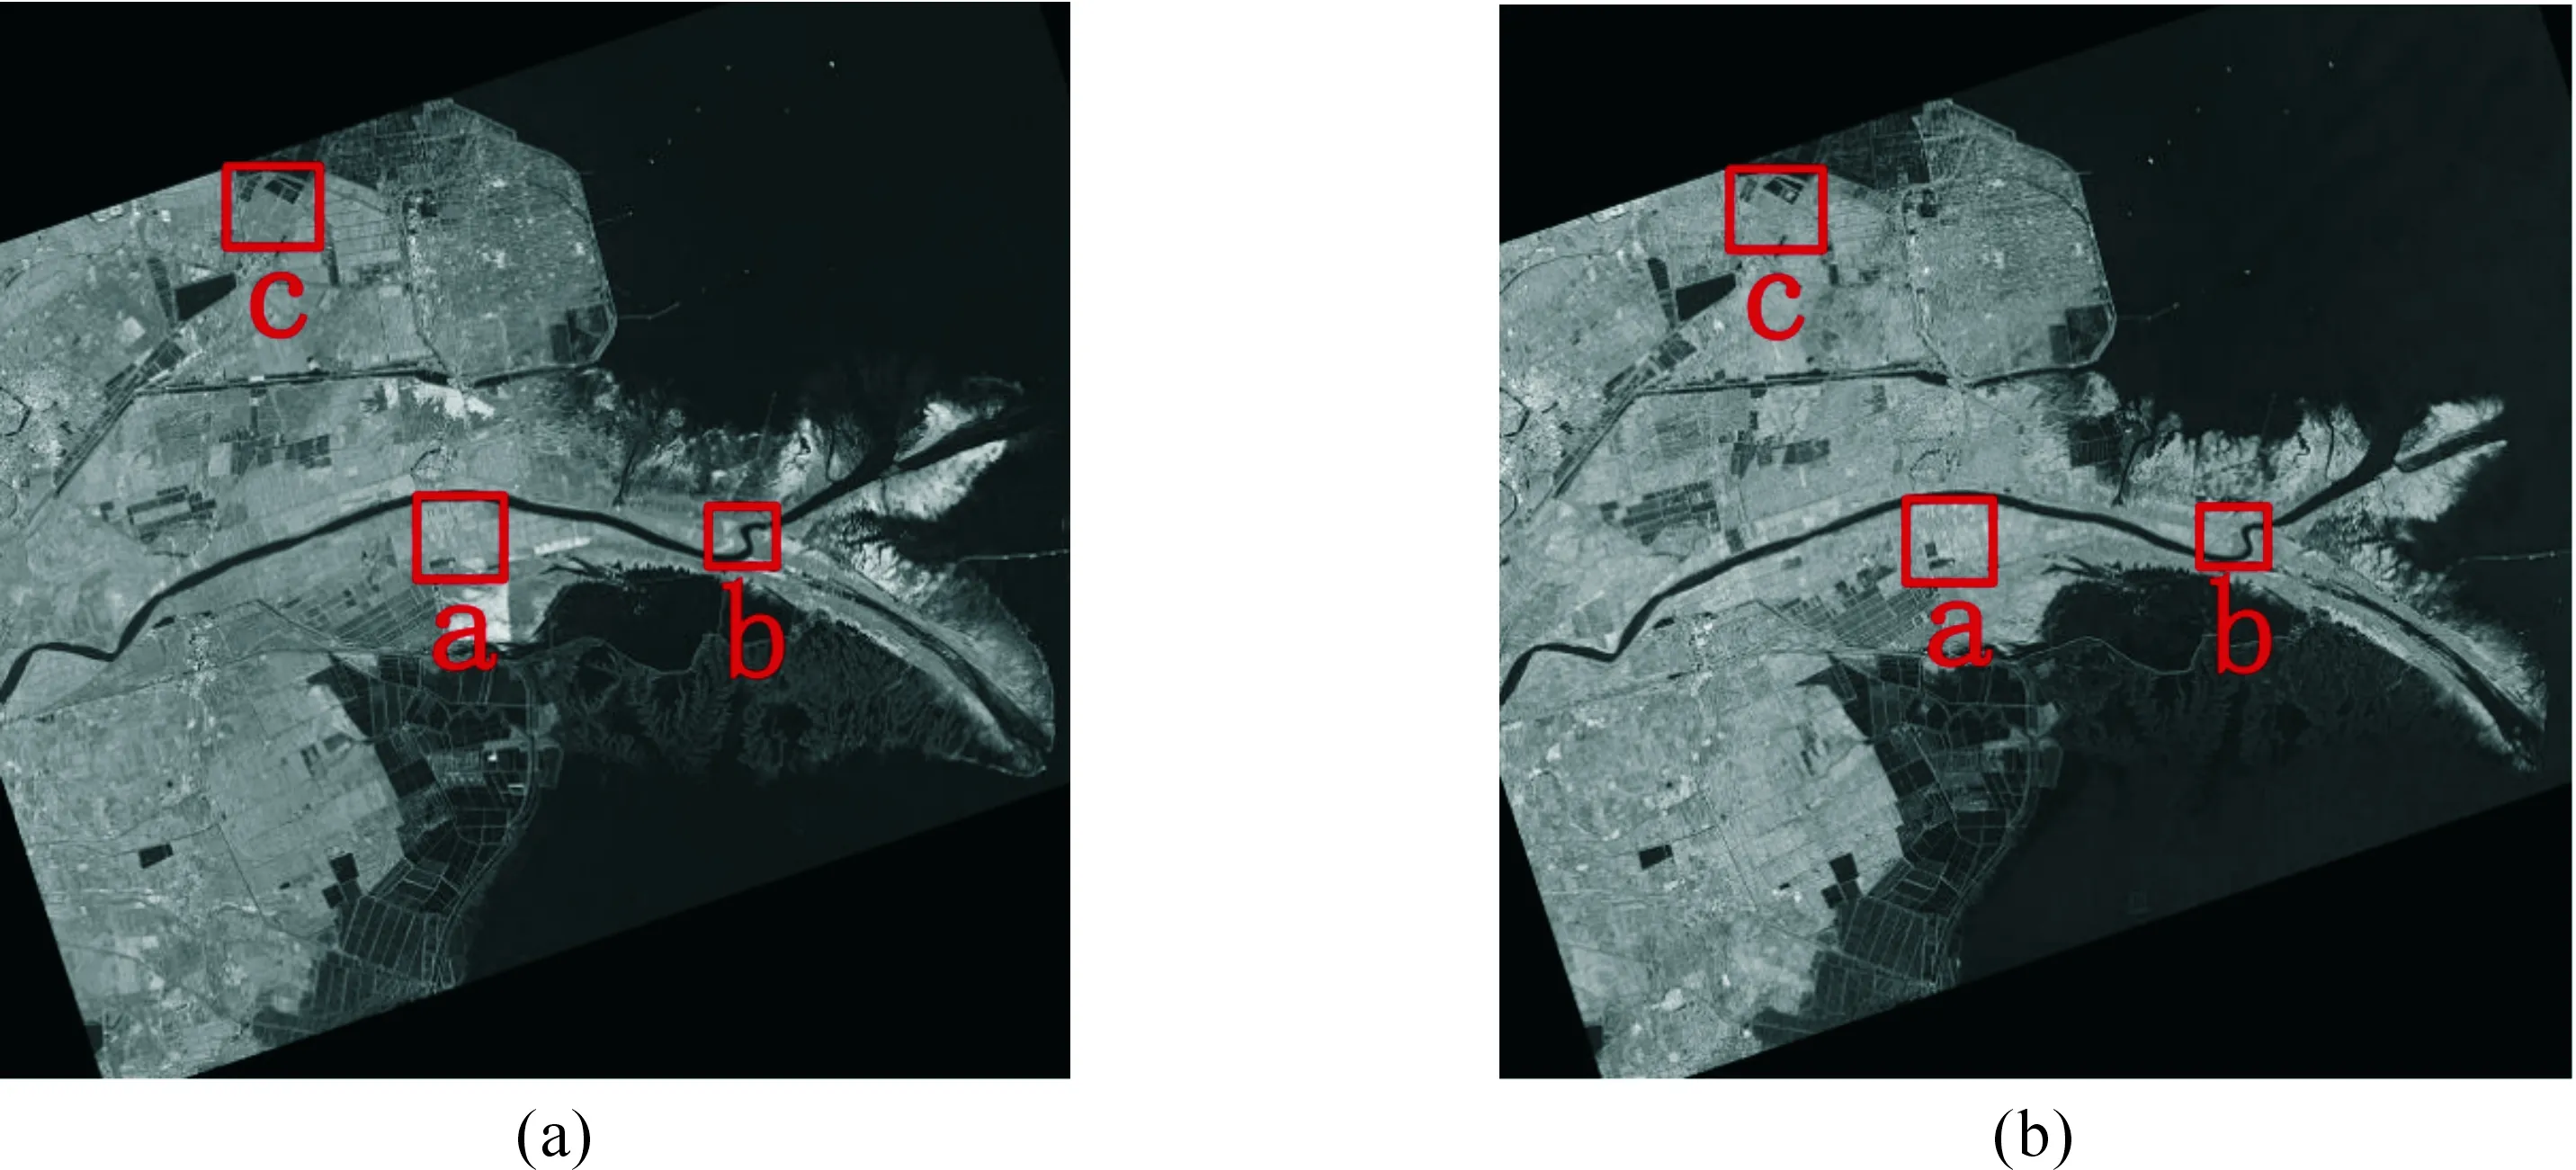
Fig.7Multi-temporalimagespairrelatingtoYellowRiverEstuary: (a)TheimageobtainedinJune2008,and(b)TheimageobtainedinJune2009.
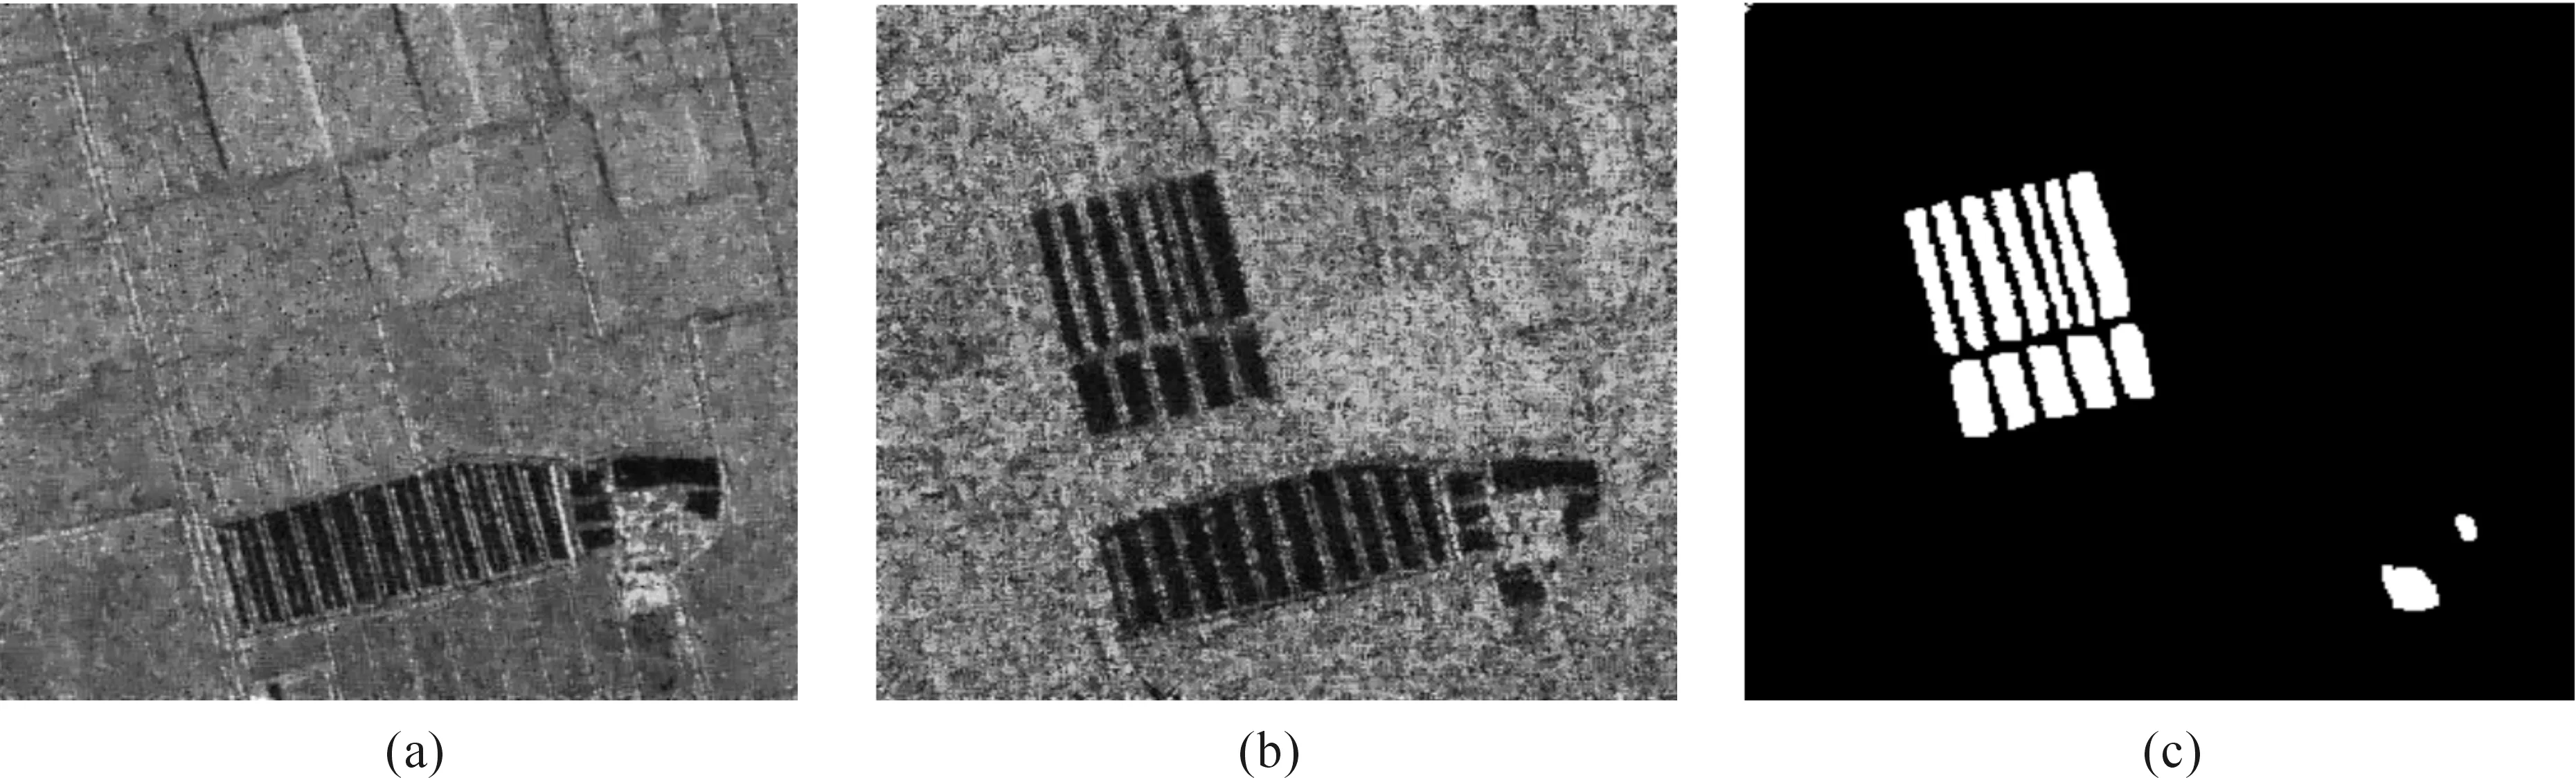
Fig.8Multi-temporalimagespairrelatingtotheregionaoftheYellowRiverEstuary: (a)TheimageobtainedinJune2008, (b)TheimageobtainedinJune2009,and(c)Thegroundtruthimage.
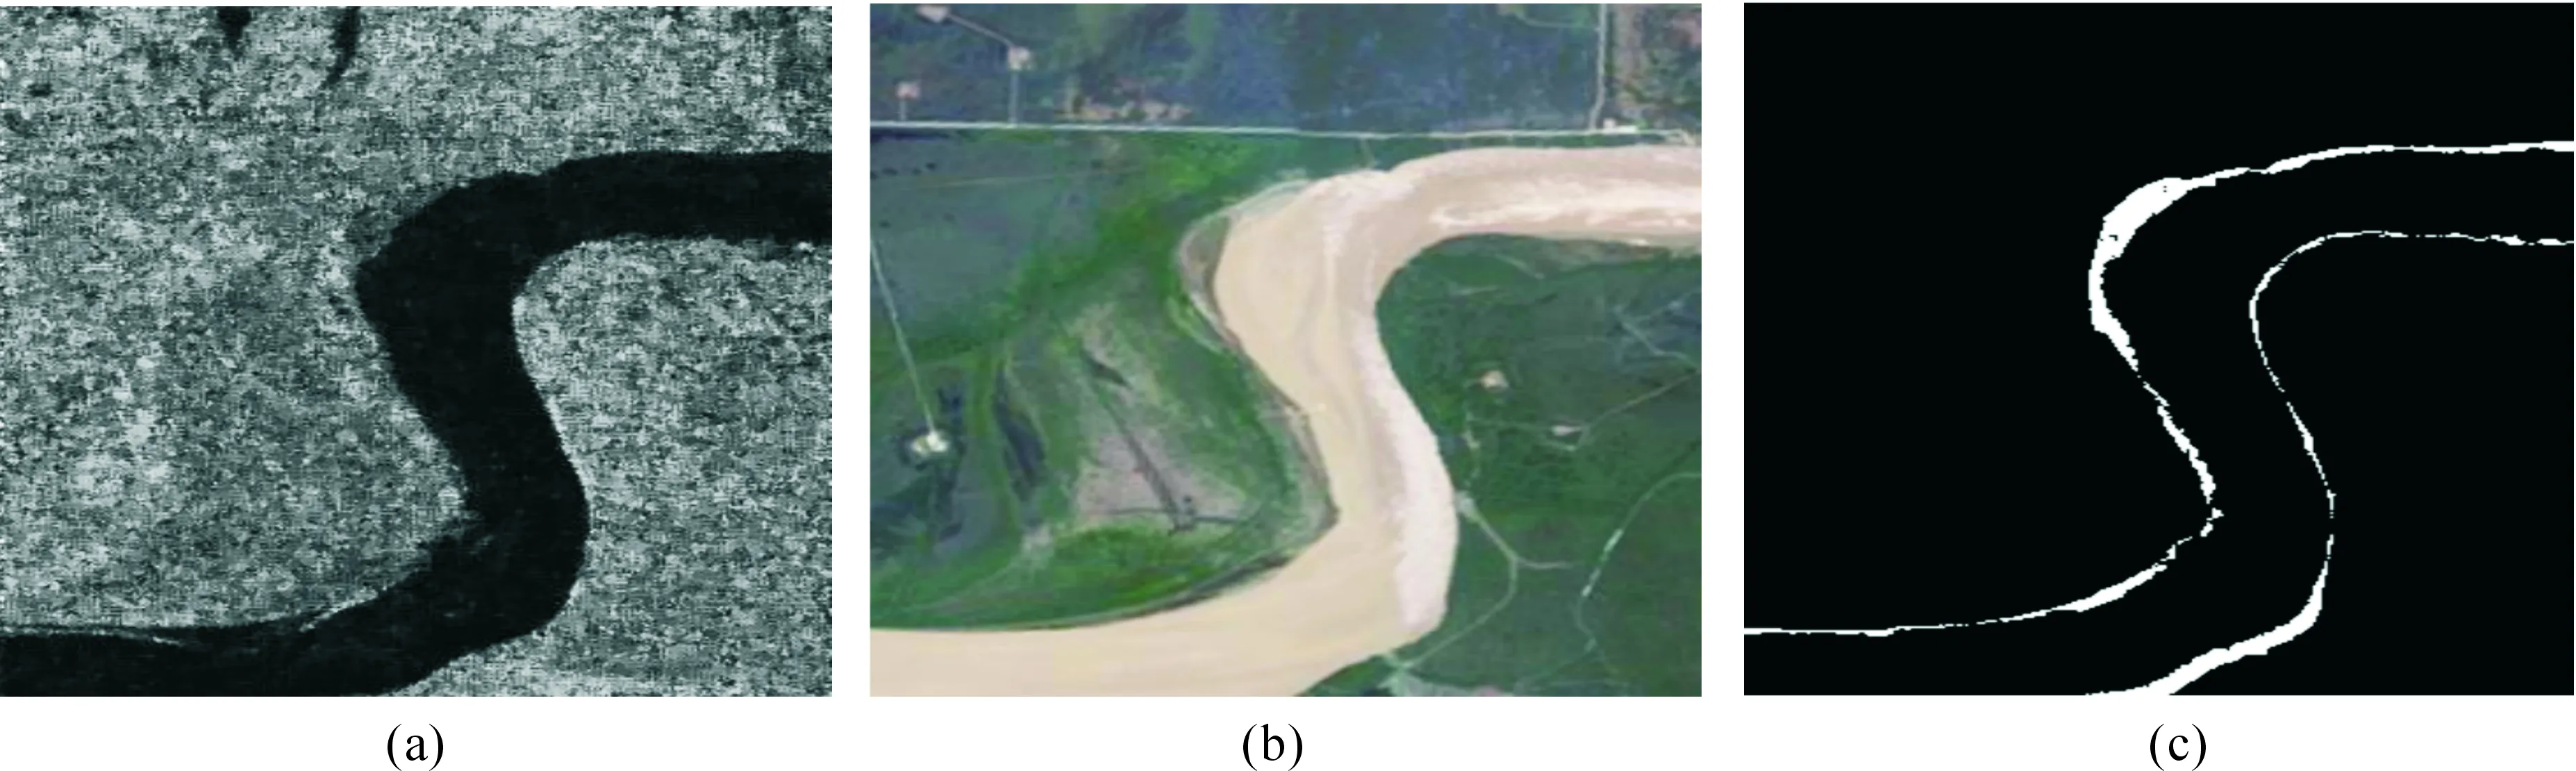
Fig.9Multi-sourceimage-pairrelatingtotheregionboftheYellowRiverEstuary: (a)TheSARimageobtainedbyRadarsat, (b)TheopticalimageacquireinGoogleEarth,and(c)Thegroundtruthimage.
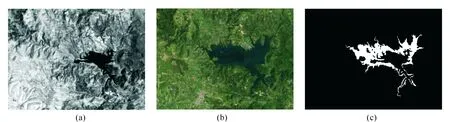
Fig.10Multi-sourceimage-pairontheMediterraneanSardiniafromdifferentsensors: (a)TheTMimage, (b)TheopticalimageobtainedfromGoogleEarth,and(c)Thegroundtruthimage.
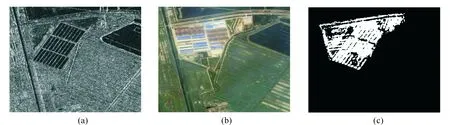
Fig.11Multi-sourceimage-pairrelatingtotheregioncoftheYellowRiverEstuary: (a)TheSARimageobtainedbyRadarsat, (b)TheopticalimageacquireinGoogleEarth,and(c)Thegroundtruthimage.
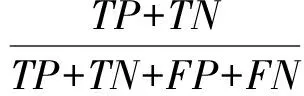
4.2 Evaluating index
4.3ResultsontheregionaoftheYellowRiverEstuary
The first experiment is launched on the region of the Yellow River Estuary. The datasets are homogeneous images, which consist of two SAR images. The change maps obtained by three contrast algorithm are shown in Fig.12(a), (b) and (c), respectively. And the change map by the proposed method (DBJC) is displayed in Fig.12(d). A detailed quantitative analysis of change maps achieved by the four methods is displayed in Table 1. According to the experimental results and quantitative analysis, the detection results obtained by our method are better performance than compared methods. In Fig.12(b), a large number of pixels are wrongly detected as changed pixels. MBFCA performs high value of PCC, which represents robust to noisy based on the feature mapping, but FP is slightly higher than the detection results by our method. From the view of Table 1, we can see theFN,FP,CCRandKCof our method achieved high performance.
Table1ComparisonofchangedetectionresultsontheregionaoftheYellowRiverEstuary.
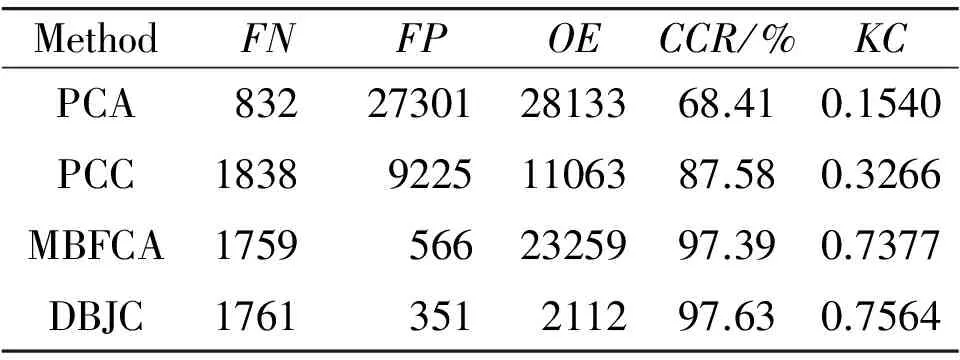
MethodFNFPOECCR/%KCPCA832273012813368.410.1540PCC183892251106387.580.3266MBFCA17595662325997.390.7377DBJC1761351211297.630.7564
4.4ResultsontheregionboftheYellowRiverEstuary
The second experiment is launched on the region of the Yellow River Estuary, which consists of two multi-source images, i.e. optical and SAR images. They are heterogeneous multi-source remote sensing images. In this dataset, we set four different levels with deep architecture for SDAE to learn feature for joint classification. These four deep architectures which contain two layers, three layers, four layers and five layers deep architecture are set for comparison. To demonstrate the effectiveness of SDAE, we take features learned by SDAE with two layers, three layers, four layers and five hidden layers respectively for joint classification. The experiment results of different levels deep architecture and compared methods are shown in Fig.13. The detection results by traditional pixel-based methods such as PCC and PCA are shown in Fig.13(a) and (b), and one feature mapping-based change detection map is displayed in Fig.13(c). The unchanged area corresponded to ground truth, shown in Fig.9(c), in optical image segmentation results, is used to select reliable training examples. After training SDAE, SAR image of the image-pair is entered in the trained stacked denoising autoencoders to classification automatically. A detailed quantitative analysis of change maps achieved by the seven methods is displayed in Table 2. As we can see in Fig.13(e), two layer SDAE have best performance in joint classification. Compared with the traditional change detection method, deep layer networks can learn more abstract features, achieved better effect on the heterogeneous images change detection.
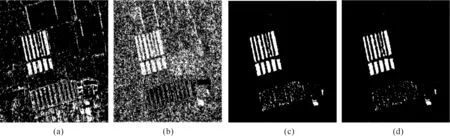
Fig.12ChangedetectionresultsrelatingtotheregionaoftheYellowRiverEstuarybyusingdifferentmethod: (a)PCC, (b)PCA, (c)MBFCA,and(d)DBJC.
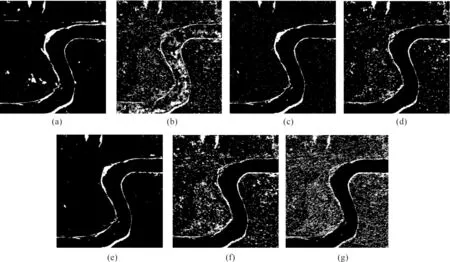
Fig.13ChangedetectionresultsbyusingdifferentdeeparchitecturesandcomparedmethodsontheregionboftheYellowRiverEstuary: (a)PCC, (b)PCA, (c)MBFCA, (d)Two-layerarchitecture, (e)Three-layerarchitecture, (f)Four-layerarchitecture,and(g)Five-layerarchitecture.
Table2ComparisonofchangedetectionresultsontheregionboftheYellowRiverEstuary.
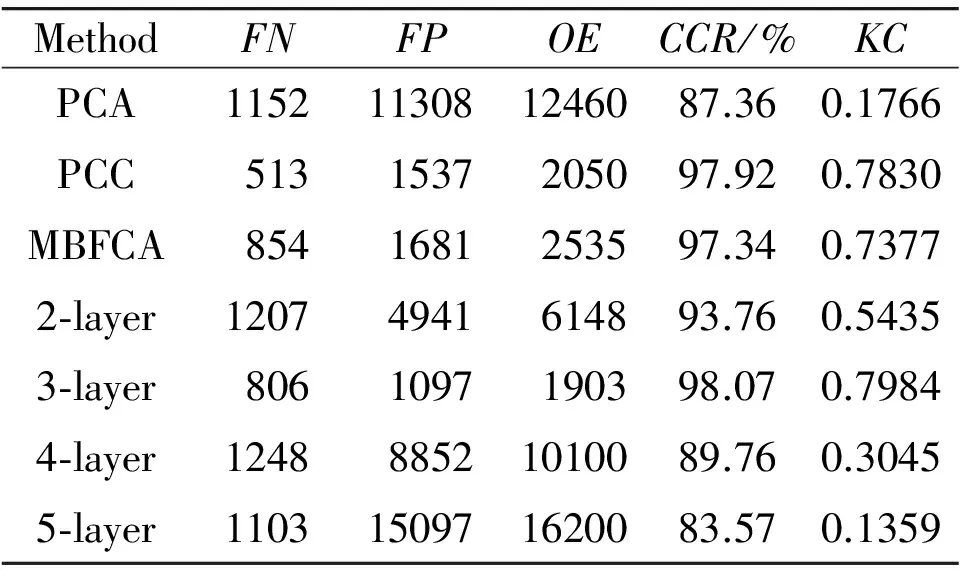
MethodFNFPOECCR/%KCPCA1152113081246087.360.1766PCC5131537205097.920.7830MBFCA8541681253597.340.73772?layer12074941614893.760.54353?layer8061097190398.070.79844?layer124888521010089.760.30455?layer1103150971620083.570.1359
4.5ResultsontheMediterraneanSardiniadataset
For the Mediterranean Sardinia dataset, we also set four different levels deep architecture for SDAE to learn the feature for joint classification. These four deep architectures which contain two layers, three layers, four layers and five layers deep architecture are set for comparison. The final change detection results are shown in Fig.14. In Fig.14(a) and (b), the change map, produced by PCC and PCA respectively, contained large amount of noise points. While the change detection results in Fig.14(c), which is produced by MBFCA,have less noise points. The change detection results with different levels deep architecture are shown in Fig. 14(d) (g). It is obvious that the architecture with too many layers, the worse the performance is. Two layer and three layer deep architecture, shown in Fig.14(d) and (e), are the best networks joint classification. Table 3 shows the quantitative results for Sardinia dataset, and it demonstrated the performance of suppressing the noise significantly on the Mediterranean Sardinia dataset.
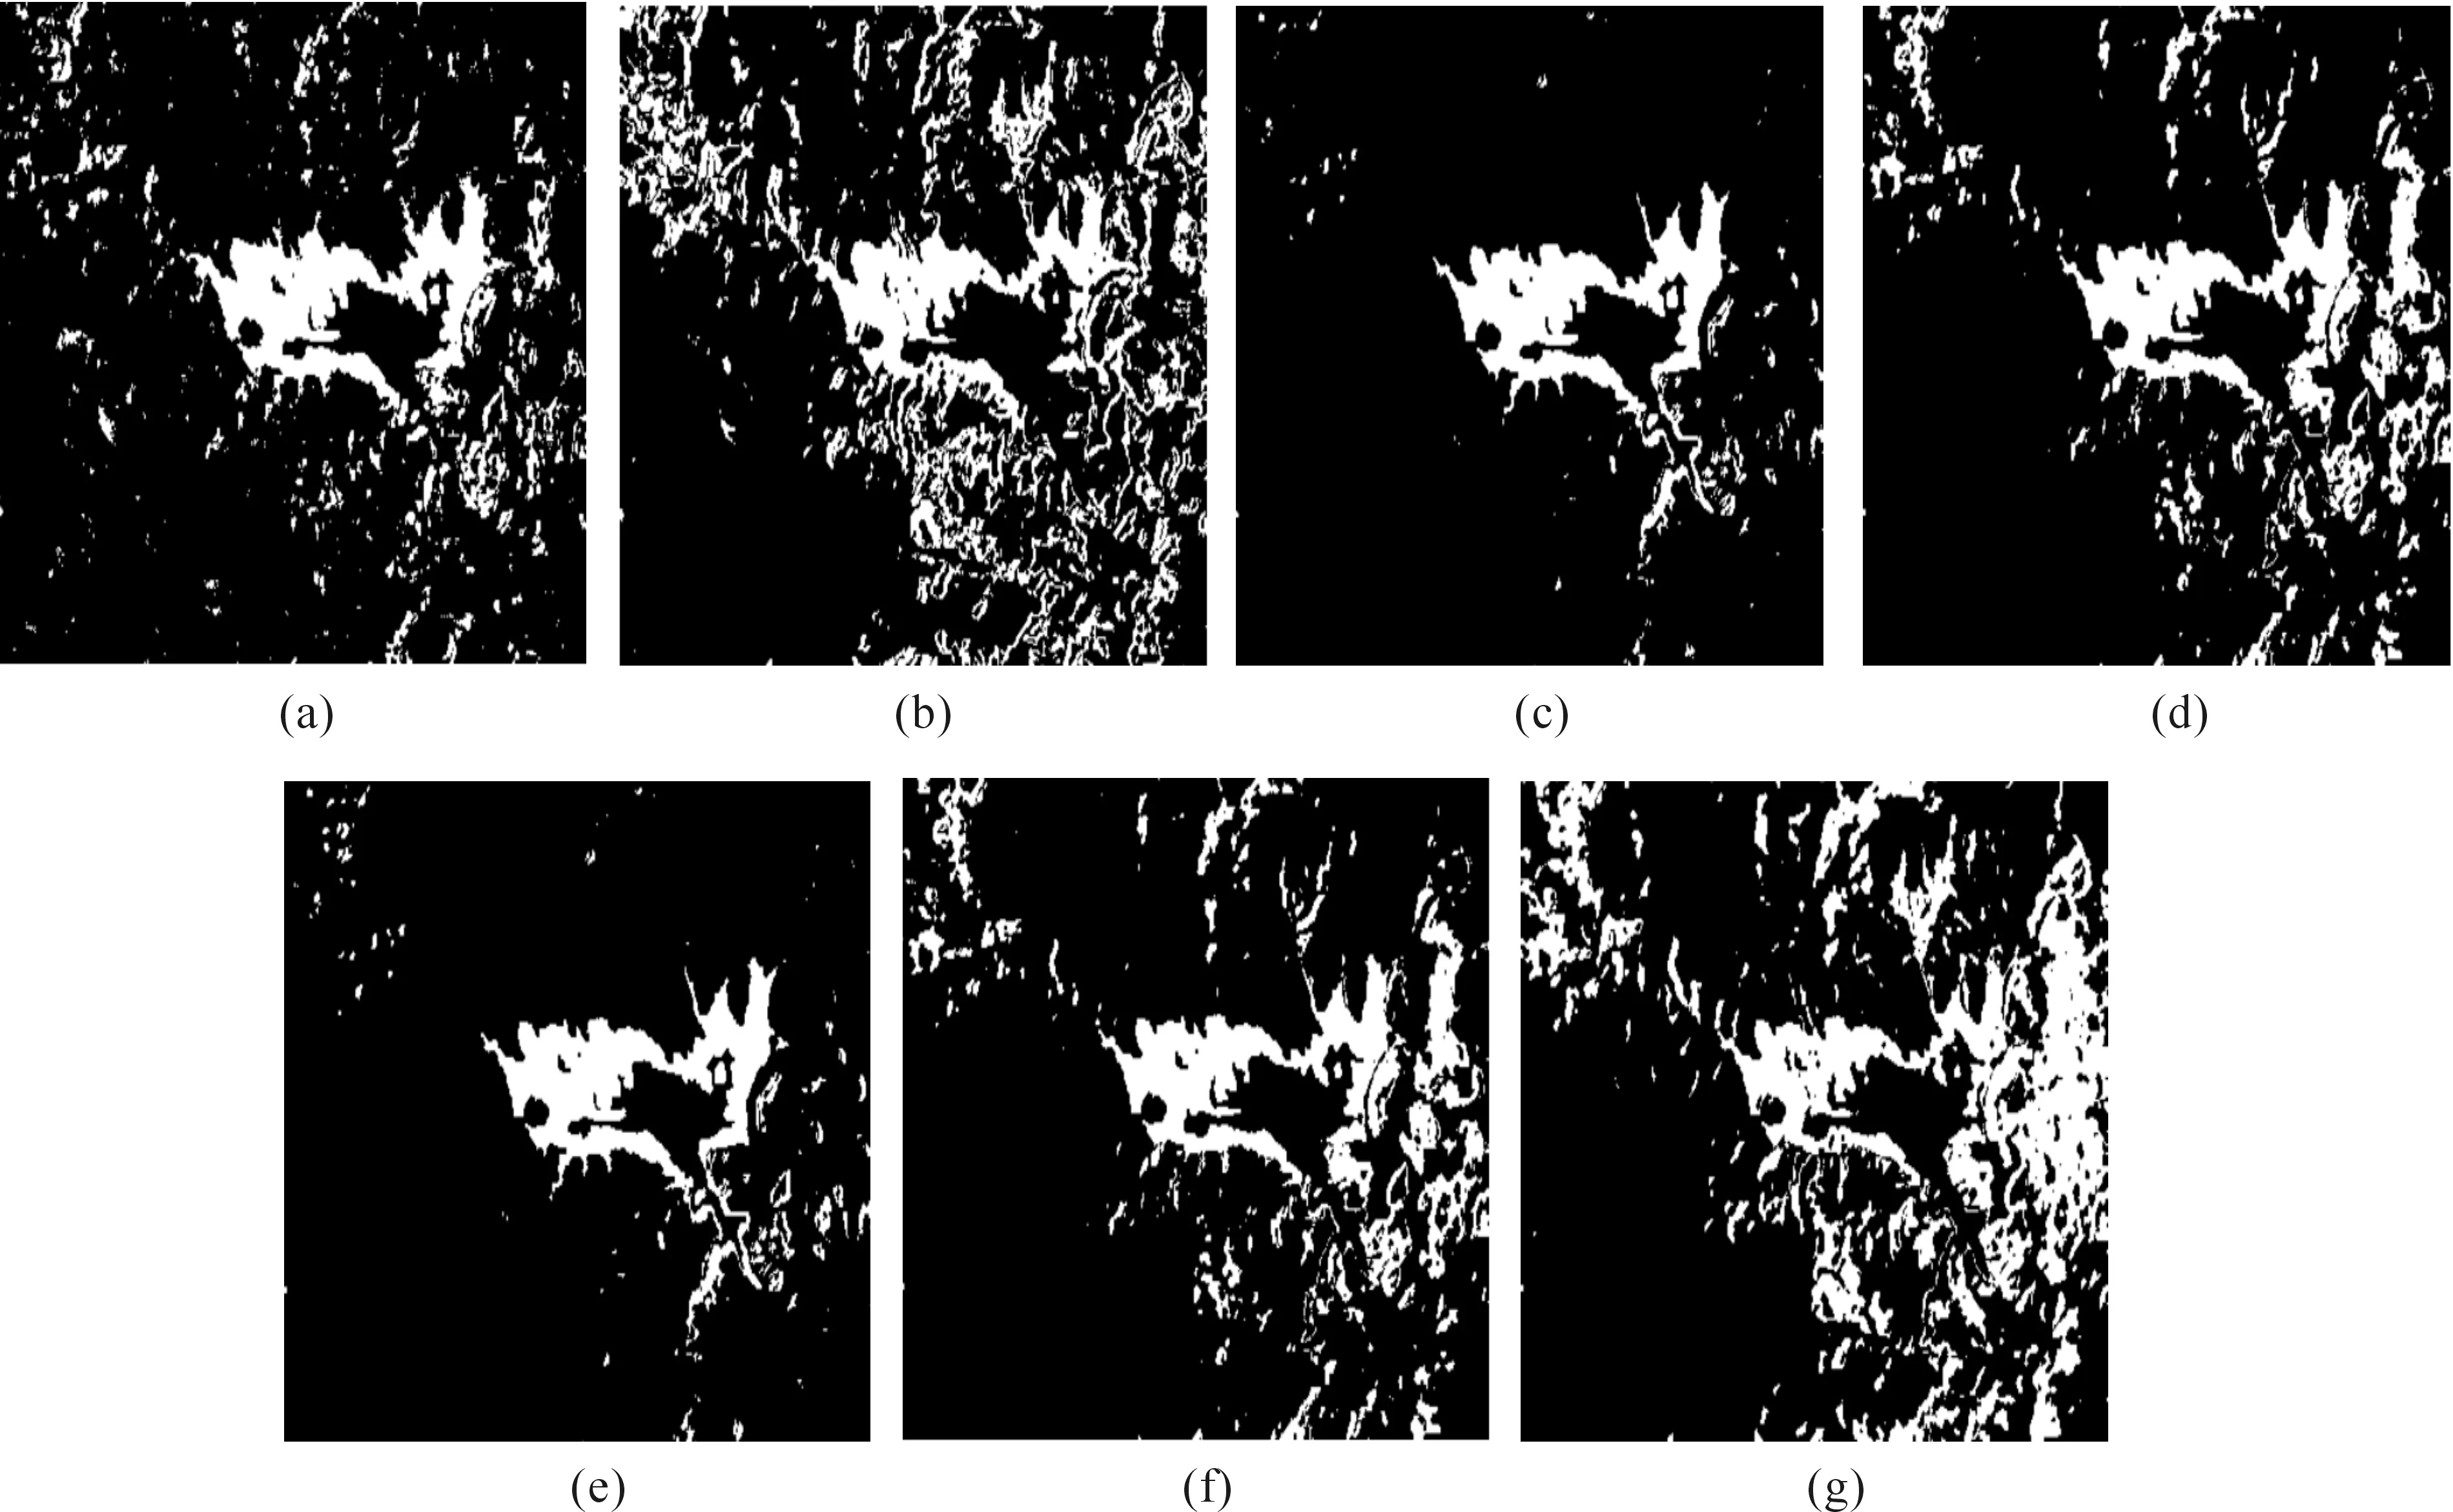
Fig.14ChangedetectionresultsbyusingdifferentdeeparchitectureandcomparedmethodsontheMediterraneanSardiniadataset: (a)PCC, (b)PCA, (c)MBFCA, (d)Two-layerarchitecture, (e)Three-layerarchitecture, (f)Four-layerarchitecture,and(g)Five-layerarchitecture.
Table3ComparisonofchangedetectionresultsonSardiniaregiondataset.
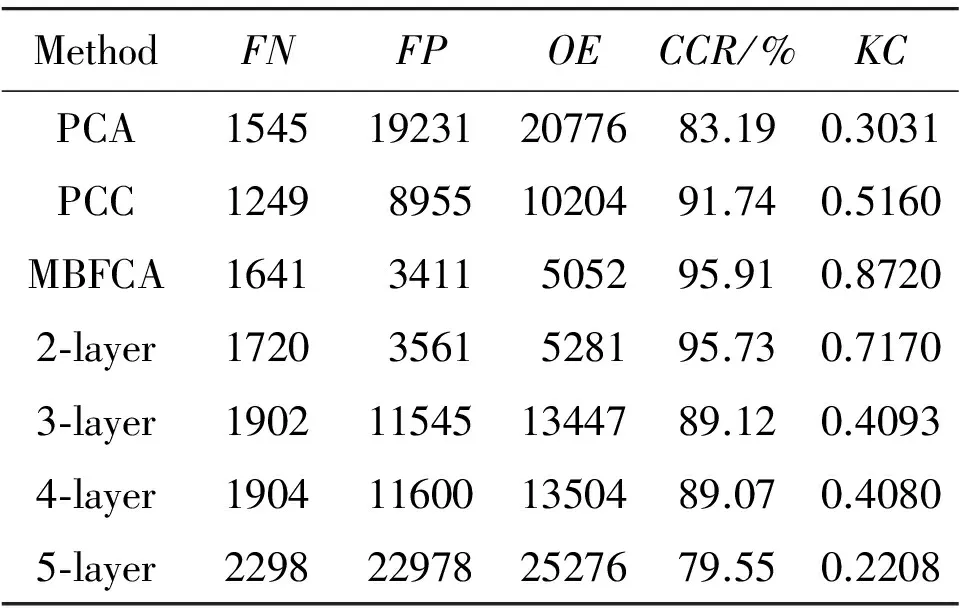
MethodFNFPOECCR/%KCPCA1545192312077683.190.3031PCC124989551020491.740.5160MBFCA16413411505295.910.87202?layer17203561528195.730.71703?layer1902115451344789.120.40934?layer1904116001350489.070.40805?layer2298229782527679.550.2208
4.6ResultsontheregioncoftheYellowRiverEstuary
In this dataset, it consists of two heterogeneous and multi-source images, i.e. optical and SAR images. The final change detection results are illustrated in Fig.13. The method of PCA used in this dataset performs well as shown in Fig.13(a). In the method of DBJC, the main FP pixels are caused by the inaccurate of co-registration. The change detection results produced by DBJC are shown in Fig.15(d). In Fig.15(c), the results generated by MBFCA display a good performance in both PCC and KC. Table 4 shows the quantitative results for the region c of the Yellow River Estuary dataset.
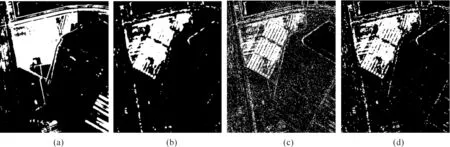
Fig.15ChangedetectionresultsrelatingtotheregioncoftheYellowRiverEstuarybyusingdifferentmethod: (a)PCC, (b)PCA, (c)MBFCA,and(d)DBJC.
Table4ComparisonofchangedetectionresultsrelatingtotheregioncoftheYellowRiverEstuary.
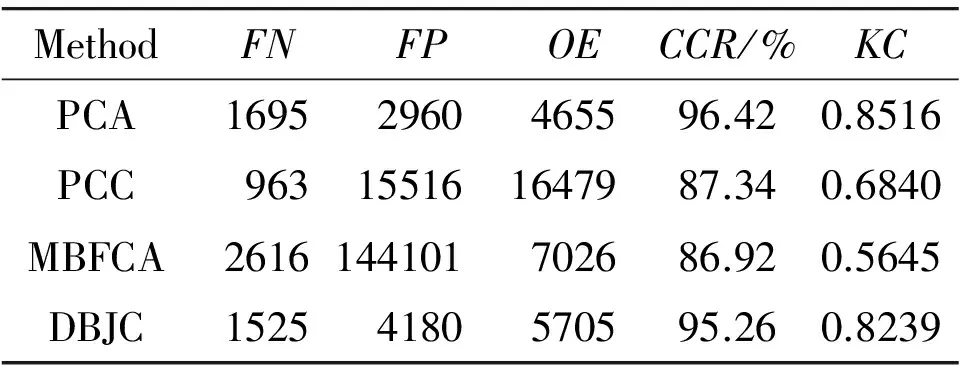
MethodFNFPOECCR/%KCPCA16952960465596.420.8516PCC963155161647987.340.6840MBFCA2616144101702686.920.5645DBJC15254180570595.260.8239
5 Conclusion
In this paper, a novel joint classification framework for multi-source image change detection is proposed. The research of multi-source image change detection is an increasingly popular issue and is of great significance in environmental and land exploration. Due to inconsistency of multi-source images in terms of spatial resolution, the traditional change detection method is difficult to use directly in the multi-source image. SDAE, an efficient network for extracting deep features, is implemented to extract features. We utilize SDAE to explore the inner relation so that we can achieve the goal of joint classification for multi-source image change detection. Deep structure can find a better representation for image texture information, and selecting reliable training sample is the key for the method. Experimental results on the real dataset illustrate that the method can be applied to multi-source image and outperform the state-of-the-art methods in terms of detection accuracy. Because of different properties of multi-source image, images are often incommensurability directly, better representations between images should be explored for multi-source image change detection, our future work will mainly focus on it.
[1]R.J.Radke, S.Andra, O.Al-Kofahi, and B.Roysam, Image change detection algorithms: a systematic survey,IEEETransactionsonImageProcessing,vol.14, pp.294-307,2005.
[2]O.Kit and M.Ludeke,.Automated detection of slum area change in Hyderabad, India using multitemporal satellite imagery,IsprsJournalofPhotogrammetryandRemoteSensing.vol.83, no.9, pp.130-137,2013.
[3]J.Chen, M.Lu, X.Chen, J.Chen, and L.Chen, A spectral gradient difference based approach for land cover change detection,IsprsJournalofPhotogrammetryandRemoteSensing, vol.85, no.2, pp.1-12, 2013.
[4]S.Stramondo, C.Bignami, M.Chini, N.Pierdicca, and A.Tertulliani, Satellite radar and optical remote sensing for earthquake damage detection: results from different case studies.InternationalJournalofRemoteSensing, vol.27, no.20, pp.4433-4447, 2006.
[5]D.M.Beck, G.Rees, C.D.Frith, and N.Lavie, Neural correlates of change detection and change blindness,NatureNeuroscience,vol.4,no.6,pp.645-500,2001.
[6]C.C.Petit and E.F.Lambin, Integration of multi-source remote sensing data for land cover change detection,InternationalJournalofGeographicalInformationScience, vol.15,no.8,pp.785-803,2001.
[7]T.Ranchin and L.Wald, Fusion of high spatial and spectral resolution images: The ARSIS concept and its implementation,PhotogrammetricEngineeringandRemoteSensing, vol.66,no.2,pp.49-61,2000.
[8]A.H.Ozcan, C.Unsalan, and P.Reinartz, A Systematic Approach for Building Change Detection using Multi-Source Data, InProceedingsof22ndIEEESignalProcessingandCommunicationsApplicationsConference,Trabzon, Turkey, 2014, pp.477-480.
[9]C.Song, C.E.Woodcock, K.C.Seto, M.P.Lenney, and S.A.Macomber, Classification and Change Detection Using Landsat TM Data: When and How to Correct Atmospheric Effects,RemoteSensingofEnvironment, vol.75, no.2, pp.230-244,2001.
[10] Y.Wen, Data application of multi-temporal and multi-source data for land cover change detection in Guam,.InProceedingsof 19th International Conference on Geoinformatics, Shanghai, China, 2011, pp.1-4.
[11] D.Li, Remotely sensed images and GIS data fusion for automatic change detection.InternationalJournalofImageandDataFusion.vol.1,no.1,pp.99-108, 2010.
[12] C.V.Gustavo, G.C.Luis, M.M.Jordi, R.A.Jos, and M.R.Manel, Kernel-Based Framework for Multitemporal and Multisource Remote Sensing Data Classification and Change Detection.IEEETransactionsonGeoscienceandRemoteSensing,vol.46,no.6,pp.1822-1835,2008.
[13] P.Du, S.Liu, J.Xia, and Y.Zhao, Information fusion techniques for change detection from multi-temporal remote sensing images,InformationFusion,vol.14,no.1, pp.19-27,2013.
[14] P.Zhang, M.Gong, L.Su, J.Liu, and Z.Li, Change detection based on deep feature representation and mapping transformation for multi-spatial-resolution remote sensing images,IsprsJournalofPhotogrammetryandRemoteSensing, vol.116, pp.24-41, 2016.
[15] A.Schmitt, B.Wessel, and A.Roth, Curvelet-based Change Detection on SAR Images for Natural Disaster Mapping.PhotogrammetrieFernerkundungGeoinformation, no.6, pp.463-474, 2010.
[16] T.A.Dickinson, J.White, J.S.Kauer, and D.R.Walt, A chemical-detecting system based on a cross-reactive optical sensor array.Nature, vol.382, pp.697-700,1996.
[17] A.Singh, Review article digital change detection techniques using remotely-sensed data,Internationaljournalofremotesensing, vol.10, pp.989-1003, 1989.
[18] D.Tarchi, N.Casagli, S.Moretti, D.Leva, and A.J.Sieber, Monitoring landslide displacements by using ground-based synthetic aperture radar interferometry: Application to the Ruinon landslide in the Italian Alps.JournalofGeophysicalResearchAtmospheres, vol.108,pp.503-518,2003.
[19] D.C.Mason, C.Oddy, A.J.Rye, S.B.M.Bell, M.Illingworth, K.Preedy, C.Angelikaki, and E.Pearson, Spatial database manager for a multi-source image understanding system,ImageandVisionComputing,vol.11, pp.25-34,1993.
[20] A.Hecheltjen, F.Thonfeld, and G.Menz, Recent Advances in Remote Sensing Change Detection—A Review,LandUseandLandCoverMappinginEurope,vol.18, pp.145-178, 2014.
[21] C.Dan, U.Meier, and J.Schmidhuber, Multi-column deep neural networks for image classification.InProceedingsof25thIEEEConferenceonComputerVisionandPatternRecognition, Washington DC, USA, 2012, pp.3642-3649.
[22] J.Tang, C.Deng, G.Huang, and B.Zhao, Compressed-Domain Ship Detection on Spaceborne Optical Image Using Deep Neural Network and Extreme Learning Machine,IEEETransactionsonGeoscienceandRemoteSensing, vol.53,no.3, pp.1174-1185, 2015.
[23] D.Erhan, Y.Bengio, A.Courville, P.A.Manzagol, P.Vincent, and S.Bengio, Why Does Unsupervised Pre-training Help Deep Learning?JournalofMachineLearningResearch, vol.11,no.3,pp.625-660,2010.
[24] M.Sato, A real time learning algorithm for recurrent analog neural networks,BiologicalCybernetics, vol.62, pp.237-241,1990.
[25] J.Cao, P.Li, and W.Wang, Global synchronization in arrays of delayed neural networks with constant and delayed coupling,PhysicsLettersA, vol.353,no.4,pp.318-325, 2006.
[26] J.Schmidhuber, Deep learning in neural networks: An overview,NeuralNetworks.vol.61, pp.85-11,2014.
[27] P.Vincent, L.Hugo, L.Isabelle, B.Yoshua, and M.P.Antoine, Stacked Denoising Autoencoders: Learning Useful Representations in a Deep Network with a Local Denoising Criterion,JournalofMachineLearningResearch,vol.11, pp.3371-3408, 2010.
[28] X.Wang, Y.Wang, and L.Wang, Improving fuzzy c-means clustering based on feature-weight learning,PatternRecognitionLetters.vol.25, pp.1123-1132, 2004.
[29] K.S.Chuang, H.L.Tzeng, S.Chen, J.Wu, and T.J.Chen,.Fuzzy c-means clustering with spatial information for image segmentation,ComputerizedMedicalImagingandGraphics, vol.30, pp.9-15,2006.
[30] J.R.Ohm and P.Ma, Feature-based cluster segmentation of image sequences, Inproceedingsof9thInternationalConferenceonImageProcessing, 1997, pp.178-181.
[31] P.Vincent, L.Hugo, L.Isabelle, B.Yoshua, and M.P.Antoine, Extracting and composing robust features with denoising autoencoders.Inproceedingsof25thInternationalConferenceonMachinelearning, Helsinki, Finland, 2008, pp.1096-1103.
[32] T.Celik,Unsupervised Change Detection in Satellite Images Using Principal Component Analysis and k-Means Clustering,IEEEGeoscienceandRemoteSensingLetters, vol.6, pp.772-776, 2009.
[33] R.Colditz, J.A.Velazquez, D.J.R.Gallegos, A.D.V.Lule, M.T.R.Zuniga, P.Maeda, M.I.C.Lopez, and R.Ressl,Potential effects in multi-resolution post-classification change detection.InternationalJournalofRemoteSensing, vol.33, no.20, pp.6426-6445, 2012.
[34] B.Zitova and J.Flusser, Image registration methods: a survey.MageandVisionComputin.vol.21, pp.977-1000, 2003.
2016-12-20; accepted:2017-01-20
?Wenping Ma, Zhizhou Li, Puzhao Zhang and Tianyu Hu are with Key Laboratory of Intelligent Perception and Image Understanding of Ministry of Education, International Research Center for Intelligent Perception and Computation, Joint International Research Laboratory of Intelligent Perception and Computation, Xidian University, Xi’an 710071, China. E-mail: wpma@mail.xidian.edu.cn.
?Yue Wu is with School of Computer Science and Technology, Xidian University, Xi’an 710071, China.
*To whom correspondence should be addressed. Manuscript
 CAAI Transactions on Intelligence Technology2017年2期
- CAAI Transactions on Intelligence Technology的其它文章
- A Multi-Objective Evolutionary Approach to Selecting Security Solutions
- Fine-grained Image Categorization Based on Fisher Vector
- Second Order Differential Evolution Algorithm
- Change Detection in Synthetic Aperture Radar Images Based on Fuzzy Restricted Boltzmann Machine
- Automated Test Data Generation Based on Particle Swarm Optimization with Convergence Speed Controller
- A Common Strategy to Improve Community Detection Performance Based on the Nodes’ Property