
Simulation of Quasi-Linear Mesoscale Convective System s in Northern China: Lightning Activitiesand Storm Structure
2016-08-12 03:41:37WanliLIXiushuQIEShenmingFUDebinSUandYonghaiSHEN
Advances in Atmospheric Sciences 2016年1期
Wanli LI,Xiushu QIE,Shenm ing FU,Debin SU,and YonghaiSHEN
1Key Laboratory ofMiddle Atmosphere and Global EnvironmentObservation,Institute ofAtmospheric Physics, Chinese Academy ofSciences,Beijing 100029
2China Meteorological Administration Training Center,Beijing 100081
3InternationalCenterfor Climate and EnvironmentSciences,Institute ofAtmospheric Physics, Chinese Academy ofSciences,Beijing 100029
4MeteorologicalObservation Center ofBeijing MeteorologicalBureau,Beijing 100089
Simulation of Quasi-Linear Mesoscale Convective System s in Northern China: Lightning Activitiesand Storm Structure
Wanli LI1,2,Xiushu QIE?1,Shenm ing FU3,Debin SU4,and YonghaiSHEN4
1Key Laboratory ofMiddle Atmosphere and Global EnvironmentObservation,Institute ofAtmospheric Physics, Chinese Academy ofSciences,Beijing 100029
2China Meteorological Administration Training Center,Beijing 100081
3InternationalCenterfor Climate and EnvironmentSciences,Institute ofAtmospheric Physics, Chinese Academy ofSciences,Beijing 100029
4MeteorologicalObservation Center ofBeijing MeteorologicalBureau,Beijing 100089
Two intense quasi-linearmesoscale convective systems(QLMCSs)in northern China were simulated using theWRF (Weather Research and Forecasting)model and the 3D-Var(three-dimensional variational)analysis system of the ARPS (Advanced Regional Prediction System)model.A new method in which the lightning density is calculated using both the precipitation and non-precipitation icemasswas developed to reveal the relationship between the lightning activities and QLMCS structures.Results indicate that,compared w ith calculating the results using two previousmethods,the lightning density calculated using the new method presented in this study is in better accordance w ith observations.Based on the calculated lightning densitiesusing the new method,itwas found thatmost lightning activity was initiated on the rightside and at the front of the QLMCSs,where the surface w ind field converged intensely.The CAPE wasmuch stronger ahead of the southeastward progressing QLMCS than to the back it,and their lightning eventsmainly occurred in regionsw ith a large gradientof CAPE.Comparisonsbetween lightning and non-lightning regions indicated that lightning regions featured more intenseascendingmotion than non-lightning regions;the vertical rangesofmaximum reflectivity between lightning and non-lightning regionswere very different;and the icemixing ratio featured no significantdifferencesbetween the lightning and non-lightning regions.
quasi-linearmesoscale convective system,Weather Research and Forecastingmodel,Advanced Regional Prediction System model,precipitation and non-precipitation ice
1. Introduction
Quasi-linearmesoscale convective systems(QLMCSs), which generally last several hours(typically longer than 10 hours)and coverhundredsofm iles,are composed of several convective cellsarranged almost in a line.QLMCSs are capableof causing a plethoraof differentsevereweather types, including strong w ind,hail,m icrobursts,and torrential rain; moreover,they are responsible fora largepercentageof lightning events,which pose great danger to the public(Feng et al.,2009).Therefore,from the last decade on,much effort hasbeenmade to understand the characteristicsof QLMCSs, including the distribution of theirmorphologies,the conditionsof their formation,their typesoforganization,and their characteristics of evolution(e.g.,Smull and Houze,1985; Rutledge et al.,1988;Parker and Johnson,2000;Zhu and Chen,2003;Lietal.,2012).
Many case studiesof QLMCSshave focused on specific featuresof the squall line.Weisman etal.(1988)found that w ithin the squall line there isa narrow band of intense thunderstorms along the boundary line that separates the raincooled air from relatively warm air.Chong etal.(1987)indicated that the precipitation of the squall line stretchesover a very w ide band,w ith the anvil typically spreading to the rear side of the system.Weisman and Rotunno(2004)and Stensrud etal.(2005)showed that the strength and longevity of squall lines are associated w ith the storm-generated cold pool and environmental shear.Moreover,the distribution of themorphologiesofQLMCSshasalso been discussed,basedon radar-observed characteristics.For instance,Parker and Johnson(2000)proposed thatQLMCSshave differentorganizationalmodes,such as convective linesw ith leading,trailing,and parallelstratiform clouds,and pointed outthatthe location ofstratiform precipitation ofevery QLMCSis roughly in accordancew ith theadvection ofhydrometeors implied by themean upper-andm id-tropospheric storm-relativew inds.
A lthoughmany featuresofQLMCSshavebeen revealed, their lightning activities are relatively poorly understood. Mazur and Rust(1983)may have been the fi rst scientists to research the cloud-to-ground(CG)lightning characteristicsof aQLMCS,and found the highestconcentration of CG flashes to be located in convective regions.Follow ing that pioneering work,increasing effortshave since beenmade to study the lightning characteristicsof QLMCSs.Storm structures and lightning activities have been described based on Doppler radarand CG lightning observations,andmostcase studies have shown that numerous negative CG strokes are clusteredw ithin and near the convective line,whilemostpositive CG strokeswould be located underneath the stratiform region(Rutledgeand MacGorman,1988;Carey etal.,2003; Lang etal.,2004b;Lu etal.,2009).Some studieshave considered that perhaps the advection of charged particles from the convective line and the generation of charge in the originalpositionm ightaccount for theoccurrenceof positive CG strokes in the stratiform region(Nielsen etal.,1994).In addition,in recent years,the evolution of the total lightning structure of QLMCSshasalso been investigated by using total lightning detection systems and radar observations(e.g., Lyons et al.,2003;Lang et al.,2004a;Carey et al.,2005). Carey et al.(2005)established a comprehensive model of the total lightning structure of a QLMCS,which possibly explainshow the very-high-frequency lightning structure is related to the dynam ical and precipitation structures.Ely et al.(2008)analyzed the total lightning structure during the lifetime ofa QLMCSusing three-dimensional total lightning data and composite radar reflectivity,and suggested that the lightning pathway extends from the convective line into the stratiform region at a relatively invariable altitude of 9 km. Liu et al.(2011)also investigated lightning activities and radar reflectivity characteristics of a QLMCS over Beijing, China,based on data from the SAFIR 3000 lightning detection system and Doppler radar.The lightningmorphology of QLMCSs has also been investigated.Lu et al.(2009)analyzed the charge transfer and in-cloud structure of largecharge-moment positive lightning strokes in QLMCSs and proposed thatmostpositiveCG flashesinMCSsinitiate in the convective region,whereas they produce strokes in the stratiform region.Moreover,Lu etal.(2013)investigated the spatial correlation between sprites and in-cloud lightning flash structure in QLMCSsand found that the large-scale structure of sprites could be affected by the in-cloud geometry of positive charge removal.
Based on observed data from Doppler radar and lightning detection systems,the aforementioned previous studies havedescribed the temporalevolution and spatialdistribution characteristics of lightning activities,aswell as the correlationsbetween lightning activitiesand radar reflectivity associated w ith QLMCSs.However,there are still some uncertainties related to QLMCS characteristics due to the lim itations of observations,especially w ith respect to the evolution of lightning activity and its relationship w ith QLMCS structures.Therefore,in order to improve ourunderstanding of the lightning events associated w ith QLMCSs,the relationship between QLMCS structures and lightning activities should be investigated in detail through othermethods,especially the connections among lightning activity,the w ind field,CAPE,the temperature field,and so on.Recently,a numericalmodelwasused to analyze the detailsof the correlationsbetween the total lightning rate and themicrophysics and kinematics in supercell storms(Kuhlman et al.,2006), and the results turned out to be credible.Therefore,the purpose of this paper is to investigate the structures and lightning activities of QLMCSs through high-resolution operationalweather prediction model outputs,in which some of the high-resolution parameters and variables,such as w ind speed,temperature,CAPE,andm ixing ratios of hydrometeors,cannototherw isebeobserved directly.Moreover,there is currently considerable controversy concerning how thunderstorms become electrified,although many researchers have accepted themechanisms involving the interaction between updraft,precipitation,and cloud particles(Keighton et al., 1991).In this study,two QLMCS cases that occurred in northern China are simulated w ith theWeather Research and Forecasting(WRF)model.The mechanisms of lightning flashesassociated w ith the QLMCSsare also analyzed.The simulation resultsare fi rstcomparedw ithobservationsin section 3,to validate the simulation.Then,the lightning densitiesare calculated w ith theWRFmodeloutputbased upon a new method,which is described in section 5.1.In sections 6.1 and 6.2,the relationshipsbetween lightning and horizontalw ind structure,CAPE,and temperaturearepresented.The electrification mechanism of lightning flashes occurring in the QLMCSs is discussed in section 7,and finally the conclusionsand a discussion aregiven in section 8.
2. Description of the radar and lightning data
The S-band Doppler radar reflectivity data from the CINRAD-SA(China Next Generation Weather Radar)of Beijing[(39.814°N,116.472°E);triangle 1 in Fig.1],Tianjin[(39.044°N,117.717°E);triangle 2 in Fig.1],and Shijiazhuang[(38.352°N,114.712°E);triangle 3 in Fig.1]and routine observations from the ChinaMeteorological Administration are assimilated in themodel to improve the initial conditions of the simulation.The radar reflectivity data of Beijing are also used to validate the simulation.Each of the three Doppler radars covers a radius of 230 km from its location and makes seven-level unique elevation scans(0.5°–3.4°)every sixm inutes.

Fig.1.(a)The fi rst nested grid and the distribution of routine observation stations(dots),raw insonde stations(squares),and locations of Doppler radars(triangles)(1,Beijing station;2, Tianjin station;3,Shijiazhuang station).Panel(b)is the same as(a),but for the second nested grid,and also shows the three SAFIR 3000 lightning detection system stationsaround Beijing (stars).
In this paper,the lightning data from the SAFIR 3000 lightning detection system,which comprises three sensors about120 km apart,with thecenterstation located at the Beijing MeteorologicalAdm inistration(locations represented by stars in Fig.1b),are used to validate the simulation.The detection efficiency of the SAFIR 3000 lightning detection system isgreater than 90%around the central regionsof thenetwork(Zheng etal.,2009),and the total lightning flash characteristics[intracloud(IC)and CG lightning]areobtained.A detailed introduction to the SAFIR 3000 detection system in Chinaand the processing of itsdata can be found in Liu etal. (2011).The SAFIR system is reported to have a high detection accuracy of 1 km(Mazur etal.,1997;Wang and Liao, 2006;Zheng et al.,2009;Liu et al.,2011).The total lightning information from SAFIR 3000 can be used to validate the calculated lightning density,in spiteof itsaccuracy being lower than that of the LMA(lightning mapping array)and LDAR(lightning detection and ranging network)(Thomaset al.,2004;Carey etal.,2005;Ely etal.,2008).In calculation, the lightning radiation sources,when they occurred w ithin 7 km in one second,were defined as one lightning flash,and the position of the fi rst radiation was taken as the lightning’s location.Therefore,in thispaper,the lightning activity refers to theentire lightning flash.
3. Numericalsimulations
Version 3.2 of the WRFmodel is used in this study.It is a non-hydrostatic and wholly compressible atmospheric model,and a terrain-follow ing hydrostatic vertical pressure coordinate is used.A detailed description of themodel is available athttp://www.w rf-model.org/index.php.It isan accessible research tool and commonly used by many operational services for short-andmedium-rangeweather prediction(Yairetal.,2010).In thispaper,in an attempt to improve the model forecast,we use the 3D-Var(three-dimensional variational)analysis system,developed w ithin the Advanced RegionalPrediction System(ARPS)model(Xueetal.,2003) framework,to assimilate the surface and raw insonde observations,and the data from CINRAD-SA.Both the reflectivity and radial velocity data from CINRAD-SA are used. Six-hourly NCEP–NCAR(NationalCenters forEnvironmental Prediction–National Center for Atmospheric Research) reanalysis data(1°×1°)are used as the background and themodel lateral boundary conditions.The 3D-Var system w ithin the ARPSmodel has been proven to be very effective for initializingm idlatitude thunderstorms inmany studies(Hu et al.,2006a,b;Zhao and Xue,2009),and the ARPS4WRF proceduresof the ARPSmodelareused to produce the initial field directly used in theWRFmodel.
A two-nested grid system w ith a center located at (116.5°N,39.8°E)isused in this study.The fi rst(outer)system extends1482 km in an east–westdirection and 1380 km in a north–south direction,w ith grid spacing of 3 km(coverage area shown in Fig.1a).The second(inner)system extends 582 km in the east–west direction and 480 km in the north–south direction,w ith grid spacing of 1 km(coverage area shown in Fig.1b).There are35 vertical levels,with the top at 50 hPa.The convection is simulated explicitly w ith this grid spacing in themodel;no cumulus parameterization isneeded.Based on a comparisonw ith differentexperiments, the cloudm icrophysics in themodel is configured to use the SingleMomentSix-Species(WSM-6)microphysicsparameterization(Hong and Lim,2006).In this scheme,water substances can be divided into six forms:vapor,cloud water, rain,ice,snow,and either graupelor hail.We use the rapid radiative transfermodel longwave radiation scheme(Mlawer et al.,1997)and a new 4th-order shortwave scheme.The Monin–Obukhov scheme is used to simulate surface layer fluxes,while the Yonsei University scheme is used to simulateboundary layer fluxes(Hong etal.,2006).
4. Synoptic analyses and simulation of the selected cases
4.1. Synoptic analysesofthe selected cases
Severe QLMCSs occur frequently in North China every summer.In this study,we select two typical cases of the region fordetailed study.The fi rstisa leading linew ith a trailing stratiform MCS(TS)thatoccurred on 13 June2010,and the second is a linear system w ith parallel stratiform MCS (PS)thatoccurred on 1 August2009.Hereafter,the 13 June 2010 case is referred to asCase1,and the1August2009 case is referred to asCase2.

Fig.2.Evolution of the QLMCSon 13 June 2010(Case1):(a)low-level radar reflectivity(dB Z)from the CINRAD-SA Doppler radar in Beijing;(b)track of the storm(solid line represents the leading line linked by low-level reflectivity over35 dB Z);(c)evolution of lightning ratew ithin 15m in.
Figure 2 illustrates the evolution of the reflectivity(Fig. 2a),the track of theQLMCS(Fig.2b),and the temporalevolution of the lightning rate forCase1(Fig.2c).The fi rstecho on Beijing’s radar appeared at 0600 UTC(not shown),and then the formation stage was characterized by rapid radarecho grow th in termsofarealextentand reflectivity intensity. More thunderstorm cells formed at 1100 UTC and the leading line of the convective region formed at 1200 UTC,w ith the reflectivity increasing rapidly.TheQLMCSmoved southeastward ata speed of approximately 33 km h?1during this stage.At about 1300 UTC,the QLMCS developed into a squall line composed of several convective cells aligned linearly at the front,and a developing stratiform region at the back,almost7 h after the time of the fi rstecho.A new supercellstorm formed in thematurestage,whichmergedw ith themother cells at1400 UTC,andmeanwhile the stratiform region behind the convective line extended approximately 75km.Next,theQLMCSmoved southeastward atan increased speed of approximately 48 km h?1.During the latter period of themature stage(soon after 1430 UTC),the reflectivity began to decrease and the reflectivity of the leading line decreased obviously at1500UTC.At1700 UTC,the thunderstorms split into three cells and disappeared quickly.Figure 2c shows the lightning rate increased slow ly in the initial stage of the QLMCS.From 1100 UTC,the increase of the lightning rate became faster than in the initial stage,and two smallpeaksof lightning rate occurred at1145 and 1215 UTC,before itgradually decreased.Subsequently,the lightning rate again increased rapidly and reached amaximum at about1400UTC.Between the period ofmaximum andm inimum lightning rate(1400–1500UTC),the total lightning rate decreased sharply.After1500UTC,the lightning ratevaried slightly before theQLMCSdissipated.

Fig.3.As in Fig.2,but for the evolution of the QLMCSon 1 August2009(Case 2).
Figure 3 shows the evolution of the reflectivity(Fig.3a), the track of the QLMCS(Fig.3b),and the temporal evolution of the lightning rate of Case 2(Fig.3c).Unlike Case 1, several isolated convective areas formed at 0700 UTC,andthen grew w ith increasing reflectivity intensity before finally merging to form a QLMCS at 0900 UTC.Compared w ith Case 1,the QLMCS of Case 2 was smaller in range and weaker in intensity,and the stratiform precipitation wasnarrower.Similar to Case 1,the QLMCS in Case 2 alsomoved southeastward.The lightning ratewasatitsmaximum at1200 UTC,then weakened,and two weak peaks appeared during the decaying stage.
Both QLMCSsoriginally formed to thenorthwestof Beijing andmoved from the northwest to the southeast.Based on the radar and lightning information,the complete lifetime of both QLMCSs is divided into three typical stages: the formation stage,the mature stage,and the dissipation stage.
4.2. Simulation of the selected cases
In the simulation,Case 1 is initialized from 0600UTC to 1800UTC on 13 June 2010,while Case 2 is simulated from 0600UTC to 1800UTC on 1August2009.Both simulations cover from the formation stage to the dissipation stage.The large time step of the integration is15 s,and the time step ratio is3.The save interval is15minutes forboth runs.On the 3 km and 1 km grid,both CINRAD-SA full-volume reflectivity and radial velocity data are assim ilated at 6-m in time intervalsbeginning at0600UTC and continuing for5 h.
4.3. Comparison ofradarreflectivity between simulations and observations
In this section,the simulation results are validated using theobservations.Sincemostof the lightning flashesoccurred in themature stage of the QLMCSs,our validation focuses mainly on thesimulationsduring thematureperiod.Thesimulated refl ectivity of Case 1 and Case 2 is shown in the right column of Fig.4,and the corresponding observationsare depicted in the leftcolumn.
The radar observations show that the linear and high reflectivity region(>45 dB Z)had formed and advanced to the south edge of Beijing at 1300 UTC in Case 1(Fig.4a).An individual thunderstorm can be identified near the north of Tianjinwith a reflectivity valuegreater than 45 dB Z(labeled“A”in the figure).The leading line of the convection region and storm A both propagated southeastward during theperiod 1300–1400UTC,w ith the reflectivity intensity of the leading line increasing and the reflectivity intensity of storm A decreasing.The stratiform region at the back of the convective line extended approximately 75 km at1400UTC.Themodel forecastat1300UTC 13 June 2010 also depictsa linearand high reflectivity region near the south edge of Beijing,and the location error between the simulation and observation is less than 10 km.A lthough the simulated coverage area of high reflectivity near thenorth of Tianjin differs from theobservation,storm A can be identified in Fig.4b.Moreover, themoving direction of the simulated QLMCS isalso southeastward.At 1400 UTC,the forecast of the location of the leading lineof convection compared to theobserved location is quite close.In some locations,the position error is less than 10 km.A lthough the simulated reflectivity of storm B is higher than observed,thepositionmatches theobserved area verywell.
From the observed reflectivity in Fig.4e,it can be seen that a linear intense reflectivity region(leading line)had formed around Beijing at 1000 UTC in Case 2,withmaximum reflectivity greater than 45 dB Z,and the stratiform region extending about10 km.The leading line of the convective region had moved southeastward by 1200 UTC,while thestratiform regionhad extended significantly parallel to the convective line.Figures 4f and 4h show that the simulation depicts themain trend and evolution of the QLMCS,albeit the simulation coversa larger region than thatof theobservation.
In addition,comparing the simulated surfacew ind fields w ith surface observations,aswell as thew ind field,temperature,and relative hum idity w ith typical soundings,we find that the simulation successfully depicts themain characteristics of the QLMCS.Taken together,asmentioned above, themodel prediction shows excellentagreementw ith observations,and thus the simulation can be used for furtheranalysis.
5. Simulation of lightning density
5.1. Calculationmethods
Barthe et al.(2010)suggested that an attractive way to predict lightning flashes in numericalmodels is to rely on the relationship between model parameters and flash rate. The noninductive charging process is induced by the collision between graupel and ice crystals(or snow crystals)in the region of supercooled liquid water.Therefore,the electric charge buildup rate of a thunderstorm is directly proportional to the concentrations of the interactive particles.Mc-Caul etal.(2009)proposed a usefulmethod to estimate the total flash rate based on the resolved upward flux of graupel in them ixed-phase region at?15°C and the gridded vertical integralof graupel,snow,and cloud ice.The results showed that the method could simulate lightning information of a spring supercell and squall line that occurred in the United States.Based on the calculation methods of lightning density in McCauletal.(2009),scatter plotsof the domain-w ide maximum for the simulated graupel flux at the?15°C level and vertical integral of graupel,snow,and cloud ice versus observed flash-rate density for Case 1 and Case 2 are shown in Figs.5a and b,and the correlation coefficient is also calculated.The correlation coefficientbetween theupward flux of graupel in themixed-phase region at?15°C and the observed flash-rate density is 0.39.The correlation coeffi cient between the observed flash-rate density and the vertical integral of hydrometeors is 0.38.From the scatter plot(Figs. 5a and b)and correlation coefficient,the observed lightning fl ash events and the m ixing ratio of graupel at the?15°C m ixed-phase region and vertical integralof hydrometeorsare poorly correlated.Therefore,in order to improve the ability to predict the lightning region associated w ith QLMCSs, necessarymodificationsaremade to the lightning calculationmethod.
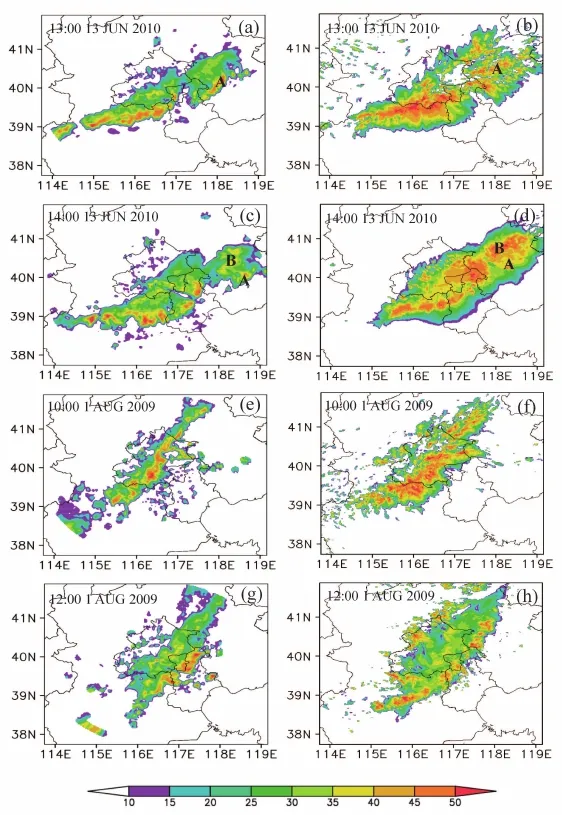
Fig.4.Low-level radar reflectivity(dB Z)observed by the CINRAD-SA Doppler radar in Beijing(left column),and theWRF-derived reflectivity(rightcolumn)on 13 June 2010(Case 1)and 1August2009 (Case2).
Based on previous published work,we know that the lightning flash rate has a good relation w ith the amount of precipitation icemass in deep atmospheric convection(Mac-Gorman and Rust,1999).The relationship between precipitation icemassand lightning flash density is relatively invariablebetween land,ocean and coastal regimes(Petersen etal., 2005).Subsequently,Deierling etal.(2008)found that precipitation and non-precipitation icemass above themelting levelboth show agood relationshipw ith total lightning activity(correlation coefficientsexceed 0.9 and 0.8,respectively) in different thunderstorms in the United States.Moreover, the relationship remains relatively unchanged in different regions.Theabove relationshipshavealso been found by other investigators.
Also based on previous published work,simulated ice-phase particles in a thunderstorm can be classified into precipitation icemass(graupeland precipitation snow)and nonprecipitation icemass(ice and non-precipitation snow).Petersen et al.(2005)showed that both non-precipitation and precipitation icemass above the?10°C isotherm w ithin regions of radar reflectivity greater than 18 dB Z possess a good relationship w ith lightning flash density.In this study, in order to estimate lightning density more effectively,the precipitation ice mass is computed from the model output by vertically integrating the mass of precipitating ice between the?10°C and?50°C isotherm w ithin regions of radar reflectivity greater than 35 dB Z.The non-precipitation icemass is computed by vertically integrating themass of non-precipitating ice from the?10°C isotherm to themodel top and w ithin regions of radar reflectivity greater than 20 dB Z.Figures 5c and d present scatter plots of the domainw idemaximum for the simulated precipitation icemassand non-precipitation icemassversustheobserved flash-ratedensity for Case 1 and Case 2.The correlation coefficient between the maximum observed flash-rate density and simulated maximum precipitation ice mass is 0.71.The correlation coefficient between the maximum observed flashrate density and simulated maximum non-precipitation ice mass is 0.62.Therefore,both the precipitation and nonprecipitation ice correlate wellw ith the observed lightning flash rate.Thus,the regression equation derived by fi tting the observed lightning flash eventsand both the precipitation and non-precipitation ice isused to predict the lightning regions.
From the finding in Fig.5c,we propose that the functional relationship between precipitation icemass and lightning density can be described by the linearequation
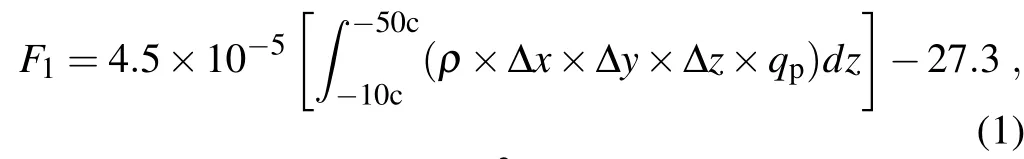
where F1is flashes per km2per 15 min(save interval is 15 m in in themodel);ρis the density of air;Δx,Δy and Δz are the grid spacings in the x,y and z directions,respectively;and qpis the mixing ratio of precipitating ice.is the precipitation icemass in ourstudy.
From the findings in Fig.5d,we also propose the functional relationship between non-precipitation ice mass and lightning density can be described by the linearequation

Both regressionsare found to besignificantatthegreater than the99%confidence level.
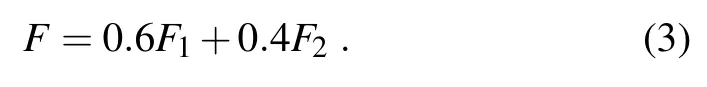
Both precipitation and non-precipitation icemasspossess good relationshipsw ith the lightning density(Table 1),and thus they are both used for its estimation.Accordingly,we construct a blended WRF lightning threat index that retains F1and F2.This is a sim ilar approach to whatMcCaul etal. (2009)did in their lightning prediction scheme.Ourgoalis to offeran alternative,whichhas thepossibleadvantageofusing the integrated precipitating ice in our formulation overa layer rather than using model output values at a particular layer.

Fig.5.Scatterplotsof the domain-w idemaximum for the simulated(a)graupel flux at the?15°C level(m s?1) (Flux 1 represents),(b)vertical integral of graupel,snow,and cloud ice(kg)(Flux 2 represents),(c)precipitation icemass(kg)and(d)non-precipitation icemass(kg)versus observed flash-rate density(flashes per 15 m in)for Cases1 and 2.
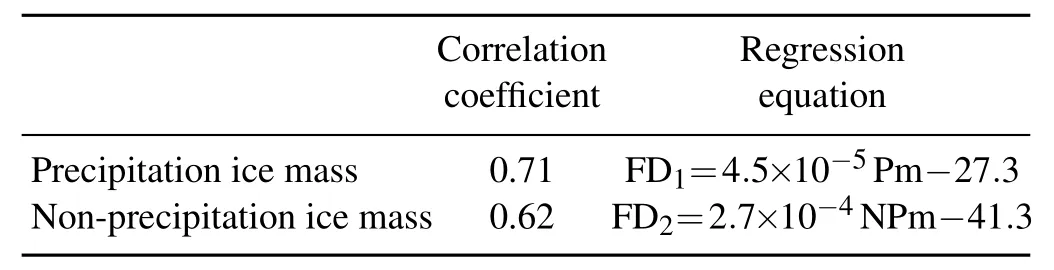
Table 1.Correlation coefficientsand equationsof the regression performed between themaximum observed flash-rate density and simulated storm parameters forCase 1 and Case 2.
Therefore,this lightning threat index is similar to the lightning potential index(LPI),which also integratesovera layer, but justw ithin the convective region.Both the schemes from Yair etal.(2010)and McCauletal.(2009)used the vertical velocity asan estimation factor.In contrast,ourschemedoes notuse the vertical velocity as an estimation factor directly. Instead,term F1includes the effects of the vertical velocity, because both the vertical velocity and the terminal velocity of the ice particle are calculated when determining the precipitating ice particles.Both F1and F2are calibrated against the maximum lightning density,and their peaks should be coincident in space and time.Therefore,any weighted combination of the two designed WRF lightning threat indexes in this study isalso properly calibrated.Based on the results of sensitivity testsof the effectsof variousweightchoiceson themaximum lightning densities and the areal coverage,we suggest thataworkableweighted combination equation is
Equations(1–3)areused to compute the lightning density and estimate the location of lightning flashes based on the outputof theWRFmodel.The calculated lightning densities are comparedw ith observations in the follow ing section.
5.2. Comparisons ofsimulated lightning densitywith observations
The calculated lightning density w ith the simulated precipitation and non-precipitation ice mass in this study is named the PNP.In thissection,the observed lightning densities from the SAFIR 3000 lightning detection system in Beijing areused to validate the PNP.The LPI,defined by Yairet al.(2010),isalso used for the validation.The PNPand LPI, aswellas theobserved lightning densities in Case1 and Case 2,are shown in Fig.6.The PNPsof Case 1 and Case 2 from theWRFmodel are plotted in them iddle column of Fig.6, and the corresponding LPIand observed lightning density are plotted in the rightand leftcolumn,respectively.
In Case1,theobserved lightning flashesmainly occurred along the adjacentarea of Beijing and Tianjin at1300 UTC, and then the lightning region moved southeastward,being mainly located over central Tianjin and to the south of Beijing at 1400 UTC.Both the PNP and LPIpresent themain trend and locations of actual lightning activities,and the errors of lightning location between the calculated region(including the PNPand LPI)and theobserved one are less than 30 km.Moreover,using ourmethod,the lightning flash region ismore sim ilar to the observed one in size.In Case 2, possibly due to the low detection efficiency,only one band of the lightning region,along theadjacentareaof Beijing and Tianjin,wasdetected.Inboth thePNPand LPI,two lightning regions are clear:one near the north boundary of Beijing, and the other corresponding to theobserved lightning region. Thesouthern branch of the calculated lightning region in both methodspresents themain trend and locationsofactual lightning,w ith theerrorsof lightning location at less than 30 km. It should be noted that the lightning region estimated by the PNP is superior in size to that of the LPI.From the lightning distribution and radar reflectivity in Case 1 and Case 2, the simulation and observation both show that the lightning mainly occurred in strong radar echoes,and was located entirely in the convective cores in thematurestage.The leading line of the convective region was formed and the frequency of lightning increased.When the frequency of lightning decreased,theMCSdissipated(figuresnotshown).
The lightning area fractions according to observations and both estimationmethodsare shown in Fig.7.The lightning area fraction is the ratio of the area coverage between lightning and radar echo.In Case 1(Fig.7a),the PNP and LPI both reflect the maximum of the actual lightning area fraction;however,theweakmaximum in the subsequentperiod ismissed by bothmethods.In Case2,theestimateusing the PNP is also better than that using the LPI for themaxima of actual lightning area fraction.Taking allof the above into account,itisclear that,comparedw ith the LPI,the PNP ismore suitable for the simulated cases,and the estimation w ith the PNP reflects themain characteristicsof the lightning event.However,it should be noted that the LPImay also be a suitable scheme for forecasting the lightning density over North China.Moreover,Fig.7 showsthatthe LPIand w2(the square of vertical velocity)featured very sim ilar trends,and the non-precipitating ice also featured a sim ilar trend as the w2.The precipitating ice,which is vital in triggering lightning events,isnotso sensitive to the variation of the vertical velocity.Therefore,in the PNP scheme,the influence of the vertical velocity and the distribution of various particles are also taken into consideration to asuitableextent.
6. Relationship between lightning activities and storm structure
In order to analyze the dynam ic and thermodynamic structures of the lightning flash region and find the parameters favorable for the formation of lightning flash in QLMCSs,lightning flashesare superposed on thehorizontalw ind field,CAPE,and temperature field.The crosssectionsof dynam ic andm icrophysical fieldsbetween the lightning region and non-lightning region arealso shown.
6.1. Dynamic structureand lightning activity

Fig.6.(a)15-m in averagesofobserved lightning density[km?2(15m in)?1](leftcolumn),and(b)PNP-(m iddle column)and (c)LPI-predicted lightning density(rightcolumn)forCase 1 and Case 2.
Figure 8 shows the total lightning distribution corresponding to the horizontal w ind near the surface and the?15°C level in themature stage(1400 UTC 13 June 2010 and 1200 UTC 1 August 2009)in Case 1 and Case 2.Petersen etal.(2005)proposed that lightning bears a close relationshipw ith the large-sized precipitation ice in them ixedphase region at?15°C,and thus the horizontalw ind fields at?15°C levels are shown in this section.From Figs.8a and c,strong convergence occursat lower levelsahead of the QLMCS,while divergence appears in the stratiform region, which is located at the rear of the QLMCS.Most lightning fl ashes are located on the right side and at the front of theQLMCS,where the surface w ind field converges obviously. Very few lightning flashes initiate in the stratiform region. Compared to previous studies,Liu etal.(2011)also showed thatmost lightning occursat the frontof QLMCSs,based on theanalysisof aQLMCS thatpassed over Beijing.However, Ely etal.(2008)found thata smallquantity of lightning can appear in thestratiform region,and suggested thatchargeadvection of small ice crystals is the predom inantmechanism for the charge structure of the stratiform region.

Fig.7.Time series plots of area fractions of observed lightning density(Obs)(red dotted line),PNP-predicted lightning density(PNP)(green line),and LPI-predicted lightning density (LPI)(yellow line),non-precipitation icemass predicted lightning density(No Pre)(blue line),precipitation icemass predicted lightning density(Pre)(black line),and the time series plots of the average square of the verticalvelocity(w2)(purple dotted line)in(a)Case 1 and(b)Case 2.
Lightning is superposed on the CAPE field,as shown in Figs.9a and b,and it revealszonesof intense CAPE located mainly in the direction of the QLMCS’movement;while in the stratiform region of the QLMCS,there are low CAPE zones due to the release of CAPE.Lightning eventsmainly occur in the regionswith a large CAPE gradient.
6.2. Thermodynam ic structure and lightning activity
In order to study the relationship between lightning activity and thermodynamic structure of QLMCSs,the lightning density is superposed on the surface temperature field, as shown in Figs.9c and d.The distribution of lightning coincides with the area where the gradient of temperature is obvious.Ahead of the QLMCS arewarm zones at the surface,while in the stratiform region of the QLMCS there are cold areas due to the evaporation of precipitation.Lightning eventsmainly occurat the rearof thewarm regions.
6.3. The difference of dynam ic and m icrophysical characteristics between the lightning region and nonlightning region
Asmentioned above,lightningeventsinQLMCSsmainly occur in regionsw ith intense horizontal convergence and intensegradientsof CAPE and temperature.In thissection,the difference of vertical dynamic andmicrophysical characteristicsbetween the lightning region and non-lightning region are discussed in detail.
According to the specific distribution of lightning locations,the typical lightning flashes region in Case1 is located along 39.21°N,spanning 115.5°–117°E,and the typicalnonlightning region is located along 39.85°N,spanning 116°–117.5°E.In Case 2,the typical lightning region is located along 38.8°N,spanning 115°–117°E,and the typical nonlightning region is located along 39.8°N,spanning 115.5°–117.5°E.
Figure10 showsa comparison of the verticalspeed,radar reflectivity,graupelmixing ratio,and ice mixing ratio between the lightning regionsand non-lightning regions in case 1.The figures that show the same comparison in Case 2 are not included in this paper.Figures10a and b show a comparison of the vertical speed between the lightning regions and non-lightning regions in Case 1.As can be seen,the lightning regionspossessmore intenseascendingmotion than the non-lightning regions in both cases;moreover,the vertical speeds in lightning regions are higher by one order ofmagnitude than those w ithout lightning events.In Case 1,the maximum vertical velocity in the lightning region is greater than 30m s?1,while themaximum verticalspeed isapproximately 5m s?1in thenon-lightning region.In Case2(figures notshown),themaximum verticalspeedsin the lightningand non-lightning regionsare14m s?1and 4m s?1,respectively. At lower levels of the non-lightning regions,downwardmotionsaredominant;whereas for the lightning regions,intense updraftsareobvious.
From the radar reflectivity comparison(Figs.10c and d), itcan beseen thatthe intensitiesof reflectivity in the lightning and non-lightning regionsdiffer from each otherslightly,and themaximum reflectivity in both instances is approximately 50 dB Z.However,the vertical rangesof themaximum reflectivity in the lightning and non-lightning regions are significantly different.The regionsw ith themaximum radar reflectivity in the lightning regionsextend from approximately 700 hPa to 250 hPa,while the corresponding regions fallw ithin the vertical range of only 750–500 hPa in the non-lightning regions in Case1 and Case2.
Based on the above,it can be concluded that the storm structures of lightning regions and non-lightning regions in QLMCSs have significant differences.Figures 10e and f show comparisons of themixing ratios of graupel betweenthe lightning regions and non-lightning regions in Case 1. Figures10g and h show comparisonsof themixing ration of ice between the lightning regions and non-lightning regions in Case 1.

Fig.8.Lightning flash regions(colored)and surface horizontal w ind(m s?1)in(a)Case 1 and(c)Case 2. Lightning flash regions(colored)andw ind field at the?15°C level in(b)Case1 and(d)Case2.
Figures 10e and f show that them ixing ratios of graupel in the lightning regions aremuch larger than those in the non-lightning regions.In Case 1,themaximum graupel m ixing ratio in the lightning region is greater than 8 g kg?1and hasa larger coveragearea;while in thenon-lightning region,themaximum graupelm ixing ratio isapproximately 4 g kg?1and hasa smaller coverage area.In Case 2(figuresnot shown),themaximum graupelm ixing ratios in the lightning and non-lightning regionsare above 8 g kg?1and 2 g kg?1, respectively.Moreover,many graupel particles in lightning regions reach a higher level(about 200 hPa)than those in non-lightning regions.
Figures 10g and h show a comparison of the ice particlemixing ratiosbetween the lightning and non-lightning regions,from which it can be seen that the distributions of ice m ixing ratio in both regions presentno obvious differences. Themajority of ice crystal is located in the vertical range of 300–200 hPa in both the lightning and non-lightning regions. Moreover,the ice particlem ixing ratio in the non-lightning region coversa largerarea than in the lightning region in Case 2(figuresnotshown).
7. Discussion and conclusion
In this study,two QLMCSs in northern Chinawere simulated using theWRFmodel,which incorporated the3D-Var of the ARPSmodel to assim ilate theobserved data.The simulations reproduced thegeneralcharacteristicsof convection, including surface horizontalw ind,verticalevolution of temperatureand hum idity,aswellas the radar reflectivity characteristics.A lthough the specific location of convection did not alwayscorrespond to theobservations,themaximum location errorwas less than 50 km.Asa result,themodelpredictions showed good agreementw ith the observations.
Themain objectives of this work were to calculate the lightning density w ith simulationsof theQLMCSs,and then investigate the relationship between the lightning locations and the dynam ic and thermodynam ic structuresof QLMCSs in northern China.Themain findings can be summarized as follows:
Most lightning takes place on the right side and at the frontof the QLMCSwhere the surfacew ind field converges obviously;whereas,very few lightning flashes initiate in the stratiform region.Lightning eventsmainly occur in regions w ith a large CAPE gradient.The distribution of lightning coincidesw ith the areawhere the gradientof temperature is large.Lightning eventsmainly occur behind the warm regions.
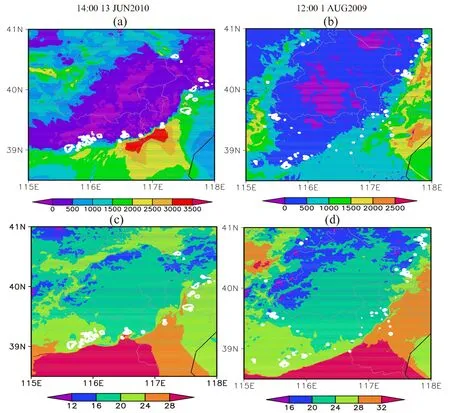
Fig.9.The lightning flash regions(white areas)and CAPE(Jkg?1)(color shaded)in(a)Case 1 and(b)Case 2. Lightning flash regions(white areas)and surface temperature(°C)(color shading)in(c)Case 1 and(d)Case 2.
The lightning regions possess more intense ascending motion than thenon-lightning regions;moreover,theascendingmotion in lightning regionsisgenerally oneorderofmagnitude greater than that in non-lightning regions.The vertical ranges of maximum reflectivity stretch much higher in regions w ith lightning events than those w ithout.Furthermore,themixing ratioofgraupel in lightning regionsismuch larger than that in non-lightning regions,mainly due to the obvious difference in ascendingmotion between the two regions.However,the distributions of the icem ixing ratio in lightning and non-lightning regions present no obvious differencessince the iceparcel isakind ofsmallparcel thatcan be transported to higher levelsof the tropospherebymoderate or even weakerascendingmotions.
Most previous studies have shown that the lightning flash ratebearsa close relationshipw ith cloudmicrophysics. Nowadays,cloud-resolvingmodels such as theWRFmodel can simulate the temporal and spatial distributions ofmultiple speciesof hydrometeorsw ith high resolution,which can then be used to estimate the lightning flash rate(McCaulet al.,2009;Yair et al.,2010).In this study,we developed a new method using the simulated precipitation icemass and non-precipitation icemass to establish the regression equation and estimate the lightning density effectively.According to thecomparisonsbetween simulationsand observations,we conclude that the lightning rate can be credibly estimated by the simulated precipitation and non-precipitation icemasses. Blyth etal.(2001)and Latham etal.(2004)used analytic calculations and yielded the prediction that the lightning flash rate is roughly proportional to the productof the downward fl ux ofgraupeland theupwardmass flux of non-precipitation icemass.Ourmethod furtherproves that there isagood correlation between the total lightning rate and themasses of precipitation and non-precipitation ice.

Fig.10.Comparison of(a,b)verticalspeed(colorshading)(m s?1),(c,d)radar reflectivity(colorshading)(dB Z),(e,f)graupel m ixing ratio(color shading)(g kg?1),and(g,h)icem ixing ratio(color shading)(g kg?1)between the lightning flash region and non-lightning flash region in Case 1 at1400UTC 13 June 2010.The leftcolumn represents lightning flash region,and the rightcolumn represents thenon-lightning flash region.Black contour lines represent temperature(°C).
Based on the high resolution output of theWRFmodel, the relationshipsbetween storm structureand lightning activity in QLMCSsover Chinawere investigated.In contrast to previousstudies,we focused on the correlation between lightning flashes and the dynam ic structure,including horizontal surface w ind,CAPE,and temperature.The results showed that lightning flashesmainly initiate in the intense convergence region ahead of the QLMCS,in regionsw ith a large gradientof CAPE,and in the regionsbehind thewarm zones. Many previous observations have found thatmost lightning flashes are located in the convective reflectivity core(Carey etal.,2005;Ely etal.,2008;Liu etal.,2011),which in reality corresponds to the intense convergence region.The relationship between lightning flashesand CAPE proves that thelocations of lightning flashes can be used to forecast the direction of the QLMCS’movement(CAPE is closely related to the path of the QLMCS).On the other hand,the lightning locations can reflect the position of the convective line and warm zone,and this could be used to improve prediction of severeQLMCSweatherevents,especially in regionsw ith littleorno radar coverage.
The cross section of vertical speed,radar reflectivity, graupelmixing ratio,and icemixing ratio between the lightningand non-lightning regionhavealsobeendiscussed in this paper.The analysis showed that electrification,and hence the occurrence of lightning flashes,is correlated w ith w ind field convergence,updraft volume,and the concentration of graupel.The results are in agreementw ith previous observational(Wiens et al.,2005)and modeling(Kuhlman et al., 2006)studies,which also show strong correlation between the lightning flash ratioand graupeland updraftvolumes.Our study explored the differences between lightning and nonlightning regions in detail,the results of which enhance our understanding of lightning events.According to the noninductivecharging theory,under favorablemoistureconditions, intense convergenceand updraftproducemoregraupelparticles in the charging zone,thus leading to agreaternumberof collisions between graupel particles and ice(snow)crystals, which produce charge separation and subsequently result in increased lightning activity.
In this paper,the regression equation developed to forecast the lightning activities of QLMCSswas credible in the two cases,but itmay need to be tuned based on additional case study results.The relationships between the lightning distribution and dynam ic andm icrophysical fieldshave been analyzed indirectly by a regression relationship.This is the fi rststep.In the future,we intend to investigate the relationship between three-dimensional lightning activity and storm structuremore thoroughly based onmoreWRF simulations.
Acknow ledgements.The research was supported jointly by the National Key Basic Research and Development(973)Program of China(Grant No.2014CB441401)and the National Natural Science Foundation of China(Grant Nos.41405007,41175043, 41475002,and 41205027).We sincerely thank Dr.Christelle BARTHE from France for her valuable suggestions regarding the calculation of precipitation and non-precipitation icemasses.
REFERENCES
Barthe,C.,W.Deierling,and M.C.Barth,2010:Estimation of total lightning from various storm parameters:A cloudresolvingmodel study.J.Geophys.Res.,115,D24202,doi: 10.1029/2010JD014405.
Blyth,A.M.,H.J.Christian Jr.,K.Driscoll,A.M.Gadian,and J.Latham,2001:Determ ination of ice precipitation ratesand thunderstorm anvil ice contents from satelliteobservationsof lightning.Atmospheric Research,59–60,217–229.
Carey,L.D.,M.J.Murphy,T.L.McCorm ick,and N.W.S.Demetriades,2005:Lightning location relative to storm structure in a leading-line,trailing-stratiform mesoscale convective system.J.Geophys.Res.,110,D03105,doi:10.1029/2003JD 004371.
Carey,L.D.,S.A.Rutledge,and W.A.Peterson,2003:Evolution of cloud-to-ground lightning and storm structure in the Spencer,South Dakota,tornadic supercell of 30 May 1998. Mon.Wea.Rev.,131,1811–1831.
Chong,M.,P.Amayenc,G.Scialom,and J.Testud,1987:A tropical squall line observed during the COPT 81 experiment in West Africa.Part1:Kinematic structure inferred from dual-Doppler radardata.Mon.Wea.Rev.,115,670–694.
Deierling,W.,W.A.Petersen,J.Latham,S.Ellis,and H.J.Christian,2008:The relationship between lightning activity and ice fluxes in thunderstorms.J.Geophys.Res.,113,D15210, doi:10.1029/2007JD009700.
Ely,B.L.,R.E.Orville,L.D.Carey,and C.L.Hodapp,2008: Evolution of the total lightning structure in a leading-line, trailing-stratiform mesoscale convective system over Houston,Texas.J.Geophys.Res.,113,D08114,doi:10.1029/ 2007JD008445.
Feng,G.L.,X.S.Qie,J.Wang,and D.L.Gong,2009:Lightning and Doppler radar observations of a squall line system. Atmospheric Research,91,466–478.
Hong,S.-Y.,and J.-O.J.Lim,2006:TheWRF single-moment6-classmicrophysics scheme(WSM6).Journal of the Korean Meteorological Society,42(2),129–151.
Hong,S.Y.,Y.Noh,and J.Dudhia,2006:A new verticaldiffusion packagew ith an explicit treatmentof entrainmentprocesses. Mon.Wea.Rev.,134,2318–2341.
Hu,M.,M.Xue,and K.Brewster,2006a:3DVAR and cloud analysisw ithWSR-88D Level-IIdata for theprediction of the fort worth,Texas,Tornadic Thunderstorms.Part I:Cloud analysis and its impact.Mon.Wea.Rev.,134,675–698.
Hu,M.,M.Xue,J.D.Gao,and K.Brewster,2006b:3DVAR and cloud analysisw ithWSR-88D Level-IIdata for theprediction of the fortworth,Texas,Tornadic Thunderstorms.Part II:Impactof radial velocity analysis via 3DVAR.Mon.Wea.Rev., 134,699–721.
Keighton,S.J.,H.B.Bluestein,and D.R.MacGorman,1991:The evolution of a severemesoscale convective system:Cloudto-ground lightning location and storm structure.Mon.Wea. Rev.,119,1533–1556.
Kuhlman,K.M.,C.L.Ziegler,E.R.Mansell,D.R.MacGorman, and J.M.Straka,2006:Numerically simulated electrification and lightning of the 29 June 2000 STEPS supercell storm. Mon.Wea.Rev.,134,2734–2757.
Lang,T.J.,and Coauthors,2004a:The severe thunderstorm electrification and precipitation study.Bull.Amer.Meteor.Soc., 85,1107–1125.
Lang,T.J.,S.A.Rutledge,and K.C.Wiens,2004b:Origins of positive cloud-to-ground lightning flashesin the stratiform region of amesoscale convective system.Geophys.Res.Lett., 31,L10105,doi:10.1029/2004GL019823.
Latham,J.,A.M.Blyth,H.J.Christian Jr.,W.Deierling,and A.M. Gadian,2004:Determ ination of precipitation ratesand yields from lightningmeasurements.J.Hydrol.,288(1–2),13–19.
Li,J.,B.Wang,and D.H.Wang,2012:The characteristics of Mesoscale Convective Systems(MCSs)over East Asia in warm seasons.Atmospheric and Oceanic Science Letters, 5(2),102–107.
Liu,D.X.,X.S.Qie,Y.J.Xiong,and G.L.Feng,2011:Evolution of the total lightning activity in a leading-lineand trailing stratiformmesoscaleconvectivesystem over Beijing.Adv.At-mos.Sci.,28,866–878,doi:10.1007/s00376-010-0001-8.
Lu,G.,and Coauthors,2013:Coordinated observations of sprites and in-cloud lightning flash structure.J.Geophys.Res.,118, 6607–6632,doi:10.1002/jgrd.50459.
Lu,G.,S.A.Cummer,J.B.Li,F.Han,R.J.Blakeslee,and H.J.Christian,2009:Charge transfer and in-cloud structure of large-charge-moment positive lightning strokes in a mesoscale convective system.Geophys.Res.Lett.,36, L15805,doi:10.1029/2009GL038880.
Lyons,W.A.,T.E.Nelson,E.R.Williams,S.A.Cummer,and M. A.Stanley,2003:Characteristicsof sprite-producing positive cloud-to-ground lightning during the 19 July 2000 STEPS Mesoscale Convective Systems.Mon.Wea.Rev.,131,2417–2427.
MacGorman,D.R.,and W.D.Rust,1999:The Electrical Nature ofStorms.Oxford University Press,New York,422 pp.
Mazur,V.,andW.D.Rust,1983:Lightning propagation and flash density in squall lines as determ ined w ith radar.J.Geophys. Res.,88,1495–1502.
Mazur,V.,E.Williams,R.Boldi,L.Maier,and D.E.Proctor, 1997:Initial comparison of lightning mapping w ith operational time-of-arrival and interferometric systems.J.Geophys.Res.,102(D10),11 071–11 085,doi:10.1029/97JD 00174.
McCaul,E.W.Jr.,S.J.Goodman,K.M.LaCasse,and D.J.Cecil,2009:Forecasting lightning threatusing cloud-resolving modelsimulations.Wea.Forecasting,24,709–729.
Mlawer,E.J.,S.J.Taubman,P.D.Brown,M.J.Iacono,and S.A. Clough,1997:Radiative transfer for inhomogeneous atmospheres:RRTM,a validated correlated-kmodel for the longwave.J.Geophys.Res.,102(D14),16 663–16 682.
Nielsen,K.E.,R.A.Maddox,S.V.Vasiloff,1994:The evolution of cloud-to-ground lightning w ithin a portion of the 10-11 June1985 squall line.Mon.Wea.Rev.,122,1809–1817.
Parker,M.D.,and R.H.Johnson,2000:Organizationalmodes of m idlatitudemesoscale convective systems.Mon.Wea.Rev., 128,3413–3436.
Petersen,W.A.,H.J.Christian,and S.A.Rutledge,2005:TRMMobservationsof theglobal relationship between icewatercontent and lightning.Geophys.Res.Lett.,32,L14819,doi: 10.1029/2005GL023236.
Rutledge,S.A.,and D.R.MacGorman,1988:Cloud-to-ground lightning activity in the 10-11 June 1985 mesoscale convective system observed during the Oklahoma-Kansas PRESTORMproject.Mon.Wea.Rev.,116,1393–1408.
Rutledge,S.A.,R.A.Houze Jr.,M.I.Biggerstaff,and T.Matejka, 1988:TheOklahoma-Kansasmesoscaleconvectivesystem of 10–11 June 1985:Precipitation structure and single-Doppler radaranalysis.Mon.Wea.Rev.,116,1409–1430.
Smull,B.F.,and R.A.Houze Jr.,1985:Amidlatitude squall line w ith a trailing region of stratiform rain:Radar and satellite observations.Mon.Wea.Rev.,113,117–133.
Stensrud,D.J.,M.C.Coniglio,R.P.Davies-Jones,and J.S. Evans,2005:Comments on“‘A theory for strong long-lived squall lines’revisited”.J.Atmos.Sci.,62,2989–2996.
Thomas,R.J.,P.R.Krehbiel,W.Rison,S.J.Hunyady,W.P. Winn,T.Ham lin,and J.Harlin,2004:Accuracy of the lightning mapping array.J.Geophys.Res.,109,D14207,doi: 10.1029/2004JD004549.
Wang,K.Y.,and S.A.Liao,2006:Lightning,radar reflectivity,infrared brightness temperature,and surface rainfall during the 2–4 July 2004 severe convective system over Taiwan area.J. Geophys.Res.,111,D05206,doi:10.1029/2005JD006411.
Weisman,M.L.,and R.Rotunno,2004:“A theory forstrong longlived squall lines”revisited.J.Atmos.Sci.,61,361–382.
Weisman,M.L.,J.B.K lemp,and R.Rotunno,1988:Structure and evolution ofnumerically simulated squall lines.J.Atmos. Sci.,45,1990–2013.
Wiens,K.C.,S.A.Rutledge,and S.A.Tessendorf,2005:The 29 June2000 supercellobserved during steps.Part II:Lightning and charge structure.J.Atmos.Sci.,62,4151–4177.
Xue,M.,D.H.Wang,J.D.Gao,K.Brewster,and K.K. Droegemeier,2003:The advanced regional prediction system(ARPS),storm-scale numerical weather prediction and dataassimilation.Meteor.Atmos.Phys.,82,139–170.
Yair,Y.,and Coauthors,2010:Predicting the potential for lightning activity in Mediterranean storms based on theWeather Research and Forecasting(WRF)modeldynamic andmicrophysical fields.J.Geophys.Res.,115,D04205,doi:10.1029/ 2008JD010868.
Zhao,K.,and M.Xue,2009:Assim ilation ofcoastalDoppler radar dataw ith the ARPS 3DVARand cloud analysis for thepredictionofHurricane Ike(2008).Geophys.Res.Lett.,36,L12803, doi:10.1029/2009GL038658.
Zheng,D.,Y.J.Zhang,Q.Meng,W.T.Lv,and X.Y.Yi.,2009: Total lightning characteristicsand electric structure evolution in a hailstorm.Acta Meteorologica Sinica,23,233–249.
Zhu,G.F.,and S.J.Chen,2003:Analysis and comparison of mesoscale convective systems over the Qinghai-Xizang (Tibetan)Plateau.Adv.Atmos.Sci.,20(3),311–322,doi: 10.1007/BF02690789.
17December2014;revised 5 June 2015;accepted 24 June 2015)
:Li,W.L.,X.S.Qie,S.M.Fu,D.B.Su,and Y.H.Shen,2016:Simulation of quasi-linearmesoscale convective systems in northern China:Lightning activitiesand storm structure.Adv.Atmos.Sci.,33(1),85–100,
10.1007/s00376-015-4170-3.
?Corresponding author:Xiushu QIE
Email:qiex@mail.iap.ac.cn
 Advances in Atmospheric Sciences2016年1期
- Advances in Atmospheric Sciences的其它文章
- Revisiting the Second EOFMode of Interannual Variation in Summer Rainfallover East China
- Evolution of Instability before and during a Torrential Rainstorm in North China
- Radiative Effectson TorrentialRainfallduring the Land fallof Typhoon Fitow(2013)
- Verification and Correction of Cloud Base and Top Height Retrievals from Ka–band Cloud Radar in Boseong,Korea
- Effectsof Surface Flux Parameterization on the Numerically Simulated Intensity and Structureof Typhoon Morakot(2009)
- Teleconnected Influenceof the BorealW inter Antarctic Oscillation on the Somali Jet:Bridging Role of Sea Surface Tem perature in Southern High and Midd le Latitudes