
Teleconnected Influenceof the BorealW inter Antarctic Oscillation on the Somali Jet:Bridging Role of Sea Surface Tem perature in Southern High and Midd le Latitudes
2016-08-12 03:41:32WenjingSHIZiniuXIAOandJianjunXUE
Advances in Atmospheric Sciences 2016年1期
Wenjing SHI,Ziniu XIAO,and Jianjun XUE
1DepartmentofAtmospheric Science,Nanjing University of Information Science&Technology,Nanjing 210044
2State Key Laboratory ofNumericalModeling for Atmospheric Sciencesand Geophysical Fluid Dynamics, Institute ofAtmospheric Physics,Chinese Academy ofSciences,Beijing 100029
3Training Center,China Metrological Administration,Beijing 100081
4Cooperative Institute forMeteorologicalSatellite Studies,University ofWisconsin–Madison, Madison,WI53706,USA
Teleconnected Influenceof the BorealW inter Antarctic Oscillation on the Somali Jet:Bridging Role of Sea Surface Tem perature in Southern High and Midd le Latitudes
Wenjing SHI1,2,4,Ziniu XIAO?1,2,and Jianjun XUE3
1DepartmentofAtmospheric Science,Nanjing University of Information Science&Technology,Nanjing 210044
2State Key Laboratory ofNumericalModeling for Atmospheric Sciencesand Geophysical Fluid Dynamics, Institute ofAtmospheric Physics,Chinese Academy ofSciences,Beijing 100029
3Training Center,China Metrological Administration,Beijing 100081
4Cooperative Institute forMeteorologicalSatellite Studies,University ofWisconsin–Madison, Madison,WI53706,USA
The teleconnection impact of the borealw inter Antarctic Oscillation(AAO)on the Somali Jet(SMJ)intensity in the follow ing spring and summer isexam ined in this paper.The variability of the borealw inter AAO is positively related to the SMJintensity in both spring and summer.The analyses show that the SST in southern high andmiddle latitudes seems to serveasabridge linking these two systems.When the AAO is in strong positive phase,SST over the Southern Ocean cools in thehigh latitudesandwarms in themiddle latitudes,which persists into summer;however,the variability of SST in southern high andm iddle latitudes isalso closely correlated to SMJintensity.
A possiblemechanism that links SST variability w ith the AAO–SMJ relationship is also discussed.The AAO in boreal w inter produces an SST anomaly pattern in southern high andmiddle latitudes through the air–sea coupling.This AAO-related SSTanomaly patternmodulatesthe localFerrelcellanomaly in summer,followed by the regionalHadley cellanomaly in tropics.The anomalous verticalmotion in tropics then changes the land–sea thermal contrastbetween the tropical Indian Ocean and the Asian continent through the variability of low cloud cover and downward surface longwave radiation flux. Finally,the land–sea thermal contrastanomaly between the tropical Indian Ocean and the Asian continent changes the SMJ intensity.The results from Community Atmosphere Model experiments forced by the SST anomaly in southern high and m iddle latitudesalso confi rm this diagnostic physicalprocess to some extent.
Antarctic Oscillation,Somali Jet intensity,teleconnection influence,sea surface temperature,longwave radiation flux
1. Introduction
In boreal summer,equatorial regions are characterized by large-scale northward cross-equatorial flows(CEFs),of which the Somali Jet(SMJ)(Findlater,1969;Krishnamurti and Bhalme,1976)is the strongestand largest.This jetoriginates from the Mascarene High and Australian High in the SH and turnsanticyclonically in the NH,resulting inwesterlies thatsweep over the Indian Peninsula.Its peak low-level w ind speeds typically occur near the east coast of Somalia. The factors involved in the variability and formation of the SMJ have been studied based on statistical and simulation techniques since Findlater(1969)discovered this CEF.Using a one-level prim itive equation model that incorporated detailed orographic features of the east A frican mountains, Krishnamurtietal.(1976)highlighted the importance of the land–sea thermal contrast,East Africanmountains,and beta effect on the simulation of the SMJ.Besides,in the simulations of Chakraborty etal.(2009),the SMJoccurred even in the absence of A frican orography,which only strengthened the CEFs;the longitudinal location of the jet depends on the diabatic heating of the Indianmonsoon,while the vertical structure depends on thewestern boundary current due to the EastA frican highlands.
As an important component of the Asian summermon-soon system,the SMJisusually connected to Indian summer monsoon rainfall as well as rainfall in China.Commonly, positive relationships are seen between the SMJ strength and the amount of rainfall in most regions of India,especially in the monsoon regions at both interannual and interdecadal timescales(Halpern and Woiceshyn,2001;Cong et al.,2007).In fact,the energy of the SMJmay be dispersed northeastwards,bringing largeamountsofwatervapor to the East Asian summermonsoon(EASM)regions(Wang and Xue,2003;Shi and Xiao,2013;Dai and Xiao,2014), butonly am inor relationship is found between the SMJand EASMrainfall(Leiand Yang,2008;Zhu,2012).Instead,the Australian CEFs,anothersetof CEFs to theeastof the SMJ, play an important role in the EASMrainfalland rainfallover China(Zhu,2012;Liand Li,2014).
Asa leadingmode of the extratropicalatmosphere in the SH,the Antarctic Oscillation(AAO)has become a focus of attention recently.The AAO is a“seesaw”pattern between the pressures or geopotential heights in the subtropics and higher latitudes.Many studies have verified that the AAO variability isnotonly associated w ith the climate systemsat high andm iddle latitudesof the SH(e.g.,Ummenhoferetal., 2008),butalso relates to the climate in the NH.Forexample, strong positive AAO events in spring are followed by aweak EASM,and vice versa(Nan and Li,2003;Gao etal.,2003). Ho etal.(2005)also showed that the large-scaleatmospheric circulation in the SH,which is related to the AAO variability, m ightmodulate tropicalcycloneactivity in thewestern North Pacific during the typhoon season.Besides,aspointed outby Gao et al.(2013),the AAO in borealw inter has a significantprecursory influenceon the tim ing of the Asian summer monsoon onset.They suggested that in stronger AAO years, both the Mascarene High and Australian High in March are strongerow ing to the“seesaw”circulation structureover the southern subtropicsand higher latitudes,and the ITCZ isenhanced.Thus,the pressure gradientbetween the subtropical and tropical regions increases and accelerates the establishmentof the SMJin spring,resulting in an accelerating onset of the Asian summermonsoon.
Theaboveworksshow that the SMJplaysa bridging role in the effects of the AAO on the climate in the NH or on themonsoons.Thus,it ismeaningful to verify the hypothesis that the remote southern atmospheric oscillation may also significantly affect the variability of the SMJ strength in tropical regions.And ifa relationship existsbetween these two components,what is the possible physical process involved?Addressing these aspects could provide useful information on precursory signalswhen attempting to predict themonsoon climate in an operational setting.The paper is organized as follows:Details about the datasetandmethods used are described in section 2,followed by an exam ination of the relationship between the SMJ strength and AAO in section 3.The possible linkagemechanism is discussed in section 4,based on both statistical and simulation analysis. Finally,a summary of the study’s key findings is provided in section 5.
2. Data andmethods
Several datasets are used in this paper.The monthly mean atmospheric reanalysis dataset w ith a resolution of 2.5°×2.5°is from the National Centers for Environmental Prediction–National Center for Atmospheric Research (NCEP–NCAR)(Kalnay et al.,1996)for the period 1951–2012.The variables include horizontalw ind(u and v),surfaceair temperature(SAT),sea levelpressure(SLP),and verticalvelocity(ω).Monthlymean SST dataare from National Climatic Data Center Extended Reconstructed SST dataset (Sm ith and Reynolds,2004),w ith a 2°×2°resolution and covering the period 1951–2012.Becauseof the slow process of change in the ocean,we also use themonthly subsurface ocean temperature from version 2.1.6 of the Simple Ocean Data Assim ilation reanalysis for the period 1958–2008,w ith a 0.5°×0.5°×40-level grid(Carton et al.,2000a,b).The interpolated outgoing longwave radiation(OLR)data on a 2.5°×2.5°grid,used to infer tropical convection,are provided by theNationalOceanic and Atmospheric Adm inistration(NOAA),and areavailable from June1974 onwardw ith am issing period betweenMarch and December in 1978(Gruberand Krueger,1984).The surface radiation fluxesand low cloud cover on a 2.5°×2.5°grid from ERA-40(the European Center forMedium-RangeWeather Forecasts40-yrReanalysis)(Uppala et al.,2005)cover the period 1958–2002. Meanwhile,the surface radiation fluxeson the Gaussian grid (192×94)from the NCEP–NCAR reanalysis cover the period 1951–2012.To confi rm the results diagnosed from the observational and reanalysis data,version 5 of the Community AtmosphereModel(CAM5)(Nealeetal.,2010)isused.
The SMJ intensity index(SMJI)is defined as the areaaveragedmeridionalw ind speed overSMJregions(40°–55°E at the equator)from the surface to 700 hPa(Shi and Xiao, 2014).It is calculated by using the NCEP–NCAR reanalysis data for the period 1951–2012.The AAO index(or SH Annular Mode Index)(1951–2012)is the difference in the normalized zonal-mean SLP(from NCEP–NCAR)between 40°S and 70°S(Nan and Li,2003),which ismodified based on the AAO index defined by Gong and Wang(1999).The Ni?no3.4 index is adapted from NOAA’s Climate Prediction Center for1951–2012.Thebasicmethodsused include composite,simultaneous and lead–lag correlation analyses.The high and low casesof composite analysisare selected based on the fluctuations of the index beyond one standard deviation.The Student’s t?test isapplied for checking the significance of the results.
3. Relationships between SMJ intensity and borealw inter AAO
3.1. SMJ intensity and AAO
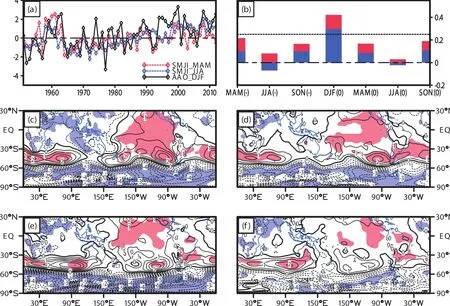
Fig.1.(a)Normalized time seriesof SMJIin spring(red dashed line)and summer(blue dashed line)and AAO index inw inter (black solid line).(b)Lead–lag correlation of spring(red bars)and summer(blue bars)SMJIw ith the seasonal AAO index.A minussign after the season abbreviation,e.g.,MAM(?),represents thepreceding season,whilea zero,e.g.,DJF(0),represents the follow ing season.The dashed line indicates correlation coefficients significant at the 95%confidence level.Composite differencesof thewinter SLP(units:hPa)between thehigh and low(c)spring and(e)summer SMJIcases.(d,f)As in(c,e) butw ith the ENSO signals removed.The red and blue shaded areasare significantat the 95%confidence level for positive and negative differences,respectively.The counter interval is0.5 hPa.
Figure1ashows thenormalized timeseriesof theSMJIin spring(March–May,MAM)and summer(June–August,JJA) and the AAO index in boreal w inter(December–February, DJF).The temporal variationsof these three indicesaregenerally in phase,which is stronger around 1960 and after the m id-1980s butweaker during the intervening period.Aswe know,thepositive trendsin theSMJIand AAO aresignificant in recentdecades(Thompson andWallace,2000;Hoerling et al.,2004;Gao etal.,2013;Shiand Xiao,2014).From calculations,we find that the increasing trends of the SMJI in summer and the AAO index in w inter are significant at the 99%confidence level;thus,linear trends are removed from allstatisticalanalysis datasets in this paper in order to isolate the contribution of the trends from thatof natural variability (Nan etal.,2009).
To confi rm the important impactof the AAO on the SMJ intensity in subsequent seasons,we calculate the lead–lag correlation of the SMJI in spring and summer w ith the seasonalaverage AAO index(Fig.1b).Significant correlation only appears in the correlation w ith the w inter AAO,w ith values of 0.422 and 0.278 for spring and summer SMJI(Table 1),respectively,which are beyond the 95%confidence level.However,after removing ENSO-related signals,the correlation coefficientsof spring and summer SMJIw ith preceding w inter AAO index are still pronounced,w ith values of 0.314 and 0.364(Table 1),respectively,which become slightly smaller forspring SMJIbut larger forsummer SMJI.
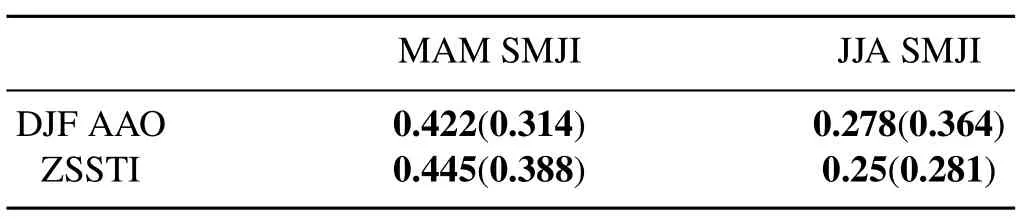
Table 1.Correlation coefficientsbetween MAM/JJA SMJIand DJF AAO and simultaneous correlation coefficients of MAM/JJA SMJI w ith zonal-mean SST index(ZSSTI)in spring and summer for the period 1951–2012.Bold font indicates significance at the 95%confidence level.Bold and italic font indicates significanceat the 99% confidence level.Values in brackets represent the resultswhen the ENSO-related signalsare removed.
The composite differences of the SH SLP anomalies in w interbetween thehigh and low spring(summer)SMJIcases are presented in Fig.1c(Fig.1e).The 10(6)highestspring (summer)SMJI years are 1956,1958,1959,1960,1961, 1963,1999,2001,2004,and 2008(1958,1959,1960,1961, 2000 and 2008).The 12(10)lowest spring(summer)SMJI years are 1957,1964,1965,1966,1967,1972,1976,1983, 1987,1992,1993 and 2003(1966,1968,1969,1972,1974, 1975,1977,1979,1995 and 1997).The significant positive values cover the southernm iddle latitudes at30°–50°S, while the significantnegative valuesdom inateover the SouthPole regionsbeyond 60°S.These two patternsover thesouthern extratropical regions resemble the feature of the positive AAO phase.Many previous studies have suggested that the SMJand AAO demonstrate various correlationsw ith ENSO (Chen et al.,2005;Nan et al.,2009;Zheng and Li,2012; Zhu,2012).The positive SLP anomalies in the equatorial central-eastern Pacific are noticeable in the composite result for the strong spring and summer SMJIcases(Figs.1c and e).To sortout the relationshipsamong the SMJI,ENSO and AAO,we remove the ENSO-related signals in both the SMJ intensity and SLPusing linear regression analysis.The recalculated composite differences of w inter SLP anomalies between strong and weak SMJIcasesare shown in Fig.1d for spring SMJIand Fig.1f for summer SMJI.The procedures for removing the ENSO-related signals(Li and Li,2014) used in our analysisare as follows:First,the ENSO-induced anomaly is determined by using the regression between the interannual time series of the SMJI,together w ith the SLP in each grid,and the Ni?no3.4 index time series.Second,the original interannual SMJI(SLP)m inus the ENSO-induced anomaly yields the ENSO-removed SMJI(SLP).After removing ENSO-related signals,the remaininggeneralpatterns ofw inter SLPanomaliesare sim ilar to the raw onesbutw ith a remarkable decrease in the positive SLP anomalies in the equatorial central-eastern Pacific.This implies that thew inter AAO isamain causeof the influenceof the SMJintensity in the follow ing spring and summer,and is independent of the ENSO signal.
3.2. Bridging role ofSST over southern high andmiddle latitudes in the AAO–SMJ relationship
The next important question is how the boreal w inter AAO influences the SMJ intensity in the following spring and summer.The ocean is known for having a“memory”to store and then release climatic signals.It seems to play an important role in transporting the signal from w inter to summer.Our previouswork also revealed that the southern SST anomaliesmay actas an“oceanic bridge”in this physical process(Shiand Xiao,2014).More detailed analysis of the role of the southern SST anomaly w ill be carried out in the follow ing subsection.
Previous studies(Wu et al.,2009;Zheng and Li,2012) suggest that a strong positive phase of the AAO in w inter is followed by warmer SST anomalies over the ocean in the southernmidlatitudesbutcolder SST anomaliesover the southern high latitudes,and vice versa.Here,similar results are presented.Correlations between the w inter AAO index and southern SSTanomalies inw inter,springand summerare shown in Figs.2a–c.The large-scalesignificantpositive correlationsappearover the southernmidlatitudes from 30°S to 45°Sbutnegativeonesoccuroverhigh latitudes from 50°S to 65°S.In fact,this correlation pattern can persist into the follow ing summer.Although the correlations become weaker in the follow ing spring and summer,the pattern is similar. For convenience of analysis,(ZSSTI)is defined follow ing Zheng and Li(2012),which is the normalized differences of thezonal-mean SSTover30°–45°Sand 50°–65°S.A positive (negative)ZSSTImeans the zonal-mean SST over30°–45°S iswarmer(colder)than thatover50°–65°S.
To begin,lead–lag correlation isemployed to analyze the relationship between the different seasonal AAO index valuesand the 3-monthmoving-mean ZSSTI.As shown in Fig. 3a,for the AAO index,significantcorrelationsemerge in the preceding autumn(September–November,SON)and reach a maximum value of larger than 0.6 in w inter,while the relationship between w inter AAO index and the ZSSTIcan persistinto the follow ing summer.This isconsistentwith the resultsshown in Fig.2.Because theocean isessentially a large energy container holding the climatic signal,anomalous signalsmay be clearly seen under the ocean’s subsurface.Vertical profi lesof the relationshipsbetweenw inter AAO index and the differencesof the zonal-mean subsurface ocean temperature over 30°–45°S and 50°–65°S in w inter,the following spring and summer are provided in Fig.3b.Significant positivevaluesexistabove thedepthof35.76m below theseasurface level during w inter,w ith amaximum correlation coefficientvalue of 0.76 at the depth of 5.01m.In comparison, significant correlations are located above the depth of 57.98 m in spring,w ith amaximum correlation coefficientvalueof 0.71 at35.76m.Forsummer,significantvalues reach asdeep as96.92m below the sea surface level,w ith amaximum correlation coefficientvalue of 0.34 at70.02m.The significant (ormaximum)correlation coefficients become deeper w ith time from w inter to summer.This indicates that the anomalous signals caused by thew inter AAO pattern are stored in theocean from w interand continue to remain in the follow ing seasons.

Fig.2.Correlations between the w inter AAO index and SST anomalies over the Southern Ocean in(a)w inter and the(b) follow ing spring and(c)summer.Areascircled by thick dashed curves are significant values exceeding the 95%confidence level.

Fig.3.(a)Lead–lag correlations of the seasonal AAO index w ith a 3-monthmoving mean ZSSTI.A minus sign after the season abbreviation,e.g.,MAM(?),represents the preceding season,whilea zero,e.g.,DJF(0),represents the follow ing season.Lightand dark shading indicatessignificantvaluesexceeding the 95%and 99%confidence level,respectively.The contour interval is 0.1.Positive,negative and zero contours are drawn w ith solid,dashed and thick lines,respectively.(b)Vertical profi les of the relationships between winter AAO index and differences of the zonalmean subsurface ocean temperature over 30°–45°S and 50°–65°S in w inter(DJF;black solid linew ith circles)and the follow ing spring(MAM;gray dashed line w ith squares)and summer(JJA;black dashed line w ith crosses).The x-axis is the depth below the sea surface level and the y-axis is the correlation coefficient.The dot-dashed line is the 95%confidence level.
The above analyses endorse the hypothesis that SST anomalies at southern high and m iddle latitudes are connected to the AAO events of the preceding w inter.How closely the SMJIvariability is related to SST anomaliesover the southern ocean is also investigated.The ZSSTIis a bettermeasure for presenting the dipole pattern.The simultaneous correlation coefficients between the SMJIand ZSSTI in spring and summer are 0.445 and 0.25,respectively;both exceed the 95%confidence level,even w ith ENSO-related signals removed(the values in brackets shown in Table 1). This indicates that the strengthened SMJ is associated w ith thewarmerSST in thesouthernm idlatitudeocean and cooler SST in the southern high-latitude ocean,and vice versa.It is important to note that these features are sim ilar to those demonstrated by the AAO–ZSSTIrelationship in Figs.2 and 3.In summary,when theborealw interAAO isin strong positivephase,adipole-likeSSTanomaly patternw illoccur,w ith a positiveanomaly over the southernm idlatitude ocean and a negative anomaly over the southern high-latitude ocean.The pattern persists from borealw inter to the follow ing summer and impacts upon the SMJ intensity in spring and summer. Therefore,the southern high-andm idlatitude SST is associatedw ith the SMJand AAO,which playsan importantbridging role in theSMJ–AAO relationship.In fact,thecorrelation of the AAOw ith the SMJintensity in spring issimilar to that in summer,which may be attributable to the seasonal persistence of the SMJ intensity(the correlation coefficientbetween theSMJIin springand thatin summeris0.6,exceeding the99%confidence level).Because summer SMJvariability hasamore importantimpacton Asian climate,analysisof the summer season only is carried outhereinafter.
4. The roleof theocean in the possible linkage mechanism
4.1. Statisticalanalysisresults
So,what is the potential physicalprocess involved in the SST anomalies over the southern high and middle latitudes being responsible for the SMJ–AAO relationship?To examine this,the SAT,surface heat fluxes and atmospheric circulations are analyzed using composite and correlation analysis.The composite approach is used to analyze the difference between the strong and weak ZSSTIyears.For the period 1951–2012,13 low summer-ZSSTIcasesoccur in 1965, 1966,1969,1977,1980,1981,1982,1983,1991,1992,1993, 1994 and 1996,while13 high summer-ZSSTIcasesoccur in 1951,1955,1957,1959,1962,1972,1974,2004,2007,2008, 2010,2011,and 2012.
As Rodwell and Hoskins(1995)verified using a prim itive equation model,the land–sea thermal contrasts caused by orography play an important role in the variability of the SMJ strength.Composite differences of SAT and(u,v)at 850 hPa between the high and low summer-ZSSTIcases are presented in Fig.4.It can be seen from Fig.4a that there are large-scalenegativevaluescovering thewhole tropical Indian Ocean but positive values over the Asian continentand northern A frica.In climatology,the land iswarmer than the ocean in summer because of the larger heat capacity of the ocean.This indicates thata stronger(weaker)land–sea thermal contrast between the tropical Indian Ocean and Asian continent in summer could enhance(weaken)the SMJintensity and Indian summermonsoon for the high(low)ZSSTI cases.Besides,significant negative anomalies of SAT ap-pear over the Maritime Continent and tropicalwestern Pacific,which strengthen the land–sea thermalcontrastbetween thewestern Pacific and eastern China and resultin a stronger EASMin the high ZSSTI years,and vice versa.A sim ilar feature is verified more clearly by the 850 hPa w inds(Fig. 4b).Intensified CEFs near the Somali coast from the SH to NH areapparentwhen the ZSSTIisstronger(Fig.4b),which is consistentw ith the resultof positive relationshipsbetween theSMJintensity and ZSSTIin section 3.2.In addition,there areanticyclonic anomalies located over thesubtropicalwestern Pacific along w ith anomalous southwesterly flow in East Asia,whichmeans an enhanced western Pacific subtropical high coincidesw ith a stronger EASM.It is interesting that anomalousnortheasterly flow appearsover the north of Australia,indicating the existence of a possible seesaw pattern between the SMJand Australian CEFs,as recently reported by Liand Li(2014).
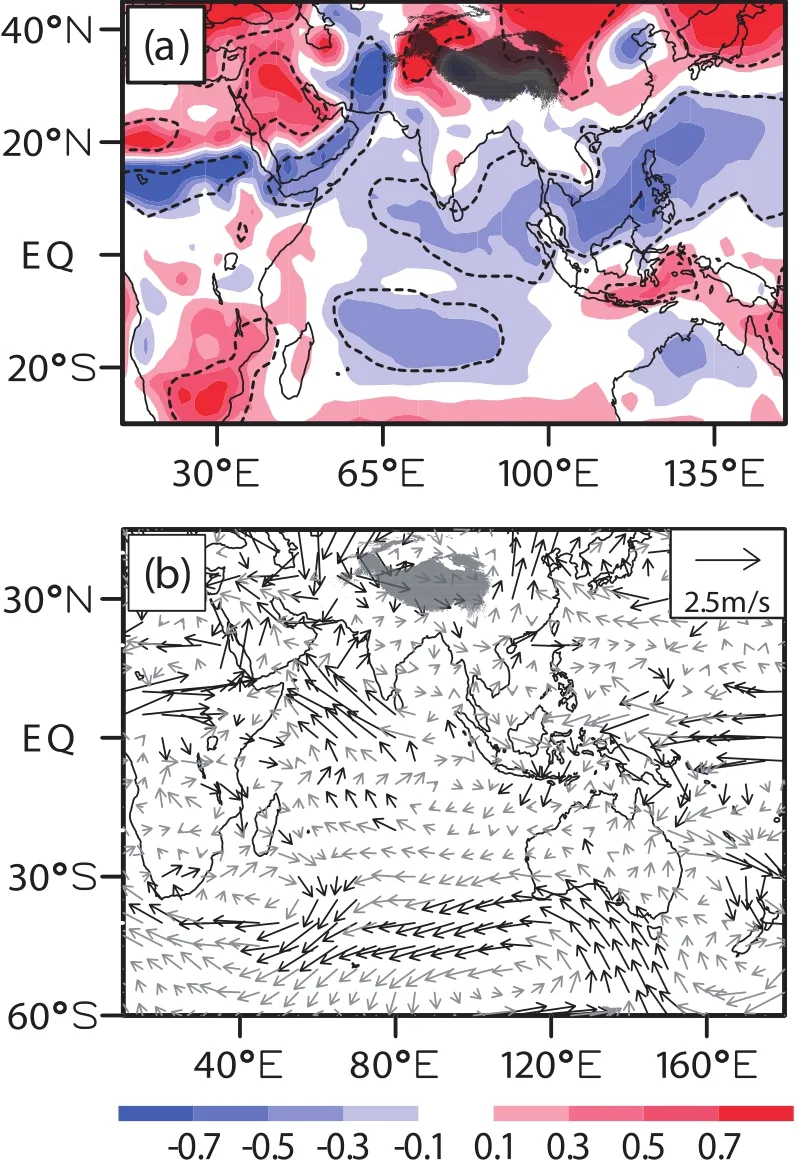
Fig.4.Composite differencesof(a)SAT(units:°C)and(b)(u, v)(units:m s?1)at850 hPa in summer between the high and low summer-ZSSTI years.Areas circled by the thick dashed curves and black bold arrows are significant values exceeding the 95%confidence level.

Fig.5.Composite differencesof the(a)latitude–pressure cross sections of v(units:m s?1)andω(units:hPa s?1)vectors averaged between 30°E and 90°E,(b)low cloud cover(units: %)and(c)OLR(units:W m?2)in summer between the high and low summer-ZSSTIyears.The red(blue)coloring in(a) indicates climatologicalascending(descending)motion.Areas circled by thick dashed curvesand black bold arrowsare significantvaluesexceeding the95%confidence level.
However,it isnotclearhow the dipole-like SST anomaly pattern over the southern high and m iddle latitudes can influence the land–sea thermal contrast over lower latitudes. To answer this question,the composite differences of the latitude–pressure cross sections of the longitude-averaged (v,ω)vector anomaly over the region from 30°E to 90°E is presented in Fig.5a.In climatology,the ascending motion of the southern Ferrel cell is located between 50°S and 70°S,while theHadley cell issymmetric abouttheequator in summerw ith its ascendingmotion located between 5°S and 20°N(shown by theshading in Fig.5a).Asshown in Fig.4b, there isan anomalousanticycloneover thesouthwestof Australia located from 45°S to 60°Swhilean anomalouscyclone situated in southeastern A frica from 25°S to 40°S.It is consistentw ith the feature thatanomalousdownward and upward motionsprevailin themiddle–lower troposphere located near 60°Sand 30°S,respectively.In otherwords,awarmer zonal mean SST over 30°–45°S and colder one over 50°–65°S(or in strong ZSSTIyears)isconducive to aweaker regional Ferrelcell in the SH.Theanomaly of the regionalverticalcirculation in oneplaceshould resultin thatat theothersite.Thus, anomalous downwardmotion near the equator,which corresponds to theanomalousanticycloneover the Arabian Ocean in Fig.4b,along w ith anomalous upwardmotion near 30°S and 30°N(Fig.5a),indicate a reduced regional Hadley cell in both hem ispheres(especially in the NH)for ZSSTIstrongyears,and vice versa.The large-scale anomalous downward (or upward)motion may also be demonstrated by reduced (enhanced)cloud cover.The composite differences of the low cloud coverand OLR are presented in Figs.5b and c,respectively.Negative anomaliesof low cloud cover,butpositive anomalies of OLR,can be seen over the tropical Indian Oceanw ithmagnitudesof?8%and 9Wm?2in theanomaly centers,respectively.This indicates that the low cloud cover and convection over tropical regionsw illbe decreased when the ZSSTI is in strong phase,which is consistentw ith the anomalousdownwardmotion near theequator in Fig.5a.Besides,a positive anomaly in Fig.5b butanegative one in Fig. 5c is apparent over the Asian continent,despite the values notexceeding the95%confidence level.To someextent,this confi rms the anomalous ascendingmotion over the latitudes of20°–30°N in Fig.5a.According to the interaction between cloudsand radiation(Ramanathan etal.,1989,1995;Tao et al.,1996),the cloudsmay absorb and reflect the solar radiation to cool the Earth’s surface,while itmay also absorb and em it longwave radiation to warm the Earth’s surface.Therefore,the characteristicsof thesurfaceheat fluxes in the tropical IndianOcean and Asian/African continentareanalyzed in the nextsection to help explain the physical process responsible for the impactof the dipole-like SST anomaly pattern over the southern high and m iddle latitudes on the land–sea thermalcontrastover lower latitudes.
At thesurface,the totalheating(THSRF)isgiven by

where SWSRF(LWSRF)is the net shortwave(longwave) radiation flux at the surface,SHF is the sensible heat flux, LHF is the latentheat flux(evaporation),DSW(USW)is the downward(upward)shortwave radiation flux at the surface, and DLW(ULW)is thedownward(upward)longwave radiation flux at the surface.

Fig.6.Correlation patternsbetween the summer ZSSTIand(a)THSRFderived from the NCEP–NCAR dataset,and(b)THSRF,(c)SWSRF,(d)LWSRF,(e)SHFand(f)LHFderived from the ERA-40 dataset in summer.Positive,negative and zero contours are drawn w ith solid,dashed and thick lines,respectively.The intervalsare0.2.The lightand dark shaded areasare significantat the95%confidence level for positive and negative values,respectively.
Figure 6 shows the correlation patterns between the ZSSTIand THSRF in summer,aswell as each of its components(including SWSRF,LWSRF,SHF and LHF).Here, positive fluxes indicate the Earth is absorbing heat(energy sources),while negative onesmean the Earth is venting heat (energy sinks).Climatologically,the tropical Indian Ocean releases net heat to the atmosphere and the Asian/Africancontinent absorbs netheat from the atmosphere in summer. As clearly revealed in Figs.6a and b,there are significant large-scale negative correlation coefficients over the tropical Indian Ocean,Maritime Continent and tropicalwestern Pacific,but positive ones over the Asian continent and northern Africa.This indicatesmore netheat is released from the tropical Indian Ocean surface(whichmeanssurface cooling), whilemore netheat is absorbed by the Asian/A frican continentsurface(whichmeans surfacewarming),which is consistentw ith the anomalous distributions of SAT,low cloud cover,and OLR in Figs.4a,5b and 5c.Therefore,the change in THSRF is likely responsible for the land–sea thermal contrastanomaly between the tropical Indian Ocean and Asian continent.
Next we check the anomalies of each component of THSRF to isolate the dom inant contributor to the land–sea thermal contrastanomaly between the tropical Indian Ocean and Asian continent.Among them(Figs.6c–f),LWSRFand LHF seem to be responsible for the land–sea thermal contrast anomalies.Negative correlations over the tropical Indian Ocean and positiveonesover the Asian continent imply thatmore LWSRF and LHF are released in the tropical Indian Ocean and less LWSRF and LHF are em itted from the Asian continent.LWSRF represents amore significant contribution to land–sea thermal contrast anomalies than LHF. Meanwhile,it reflects theDLW change in Fig.7b.No significantvaluesexistin the correlation pattern between ULW and ZSSTI in summer(Fig.7a).Figure 7b suggests that the decreaseof DLW in the tropicalocean cools theocean surface, while the increase of DLW over the Asian continentwarms the land surface during ZSSTIpositive years,in favor of the decrease of SAT over the ocean and increase of SAT over the continent.The correlation pattern of DLW w ith ZSSTIis collocated w ith composite differences of SAT anomalies in Fig.4a and low cloud cover anomalies in Fig.5b for high and low ZSSTIyears.This demonstrates the dom inant contribution of DLW to the change of land–sea thermal contrast between the tropical Indian Ocean and Asian continentand suggests that the anomalies of low cloud cover are themain cause of the longwave radiation flux change.

Fig.7.As in Fig.6 but for the(a)ULW and(b)DLW.
4.2. Simulation experiment
To better understand how the ocean thermal condition over the high andm iddle latitudes of the SH connects to the SMJ–AAO relationship,we also conduct two sensitivity experiments(referred to aspZSSTIand nZSSTI)using CAM5. Each experiment isan ensemble average of five realizations, which differ from one another in their initial conditions.In the control experiment,themonthly varying climatological SST isadopted as the sea surface boundary.The controlexperiment is integrated for 17 years from 1 January 1990 to 31 December 2006.Considering themodel’s stability,the last five years of results from the control experiment(1 January 2001–05)areselected as the five initialconditionsof the pZSSTIand nZSSTIexperiments.In thepZSSTIexperiment, we impose a positive ZSSTIanomaly(1°C SST increase at 35°–40°S,0.5°C SST increase at 30°–35°S and 40°–45°S; 1°C SST decrease at55°–60°S,0.5°C SST decrease at50°–55°S and 60°–65°S)on the lower boundary condition used in the control experiment.The nZSSTIexperiment is sim ilar to the pZSSTIexperiment,exceptwe impose a negative ZSSTIanomaly(1°C SST decrease at35°–40°S,0.5°C SST decrease at 30°–35°S and 40°–45°S;1°C SST increase at 55°–60°S,0.5°C SST increase at 50°–55°S and 60°–65°S). As obtained by the statistical analysis,the SST anomaly in these two experiments is imposed from borealw inter to the follow ing summer.All the simulated analyses are for the summer season.
Asimplemented byWu etal.(2012,2015),thedifference ofair temperatureand(u,v)at850hPabetween thew ith-and w ithout-ZSSTI-anomaly experiments and their differences (pZSSTIm inus nZSSTI)is presented in Fig.8,along w ith the corresponding difference in simulated latitude–pressure crosssectionsof(v,ω)anomaly vectorsaveraged over 30°–90°E.In termsof air temperatureat850 hPa,positive(negative)values are located in the tropical Indian Ocean for the nZSSTI(pZSSTI)experiment(Figs.8a and b).However, positive values cover the east of China for their differences (pZSSTIminus nZSSTI)in Fig.8c.This implies that the land–sea thermal contrast is strengthened in strong ZSSTI years,which is basically consistentw ith the diagnostic result shown in Fig.5a.For atmospheric circulation(Figs. 8d,e and 8g,h)in negative(positive)ZSSTIyears,a larger scale anomalous cyclone(anticyclone)existsover the Southern Ocean near40°–60°Sand a relatively weakeranomalous anticyclone(cyclone)appears on the southeastern coast of Africa near 20°–40°S,corresponding to anomalous upward (downward)motion near 60°S and downward(upward)motions near 30°S(strengthened/weakened southern Ferrel cell for weak/strong ZSSTI cases).Besides,in tropical areas,the CEFs near the Somali coast are weakened(enhanced) dramatically and a cyclone(an anticyclone)anomaly covers the Arabian Sea,which is in agreementw ith the ascending(descending)motion anomaly near theequator(strengthened/weakened Hadley cellin theNH forweak/strong ZSSTI cases).These features are further verified by the differences between the pZSSTI and nZSSTI experiments in Figs.8f and i,which arewell collocated w ith those in Figs.4b and 5a.It is the strong ZSSTI thatactivates the vertical circulation anomaly,which enhances the land–sea thermal contrast between the tropical Indian Ocean and Asian continent and causes the increased SMJintensity for strong AAO and vice versa.To some extent,the potential physical process of the SST anomalies in the southern high andm iddle latitudes responsible for the SMJ–AAO relationship is confi rmed by the Southern Ocean forced experiment in the CAM5 runs.
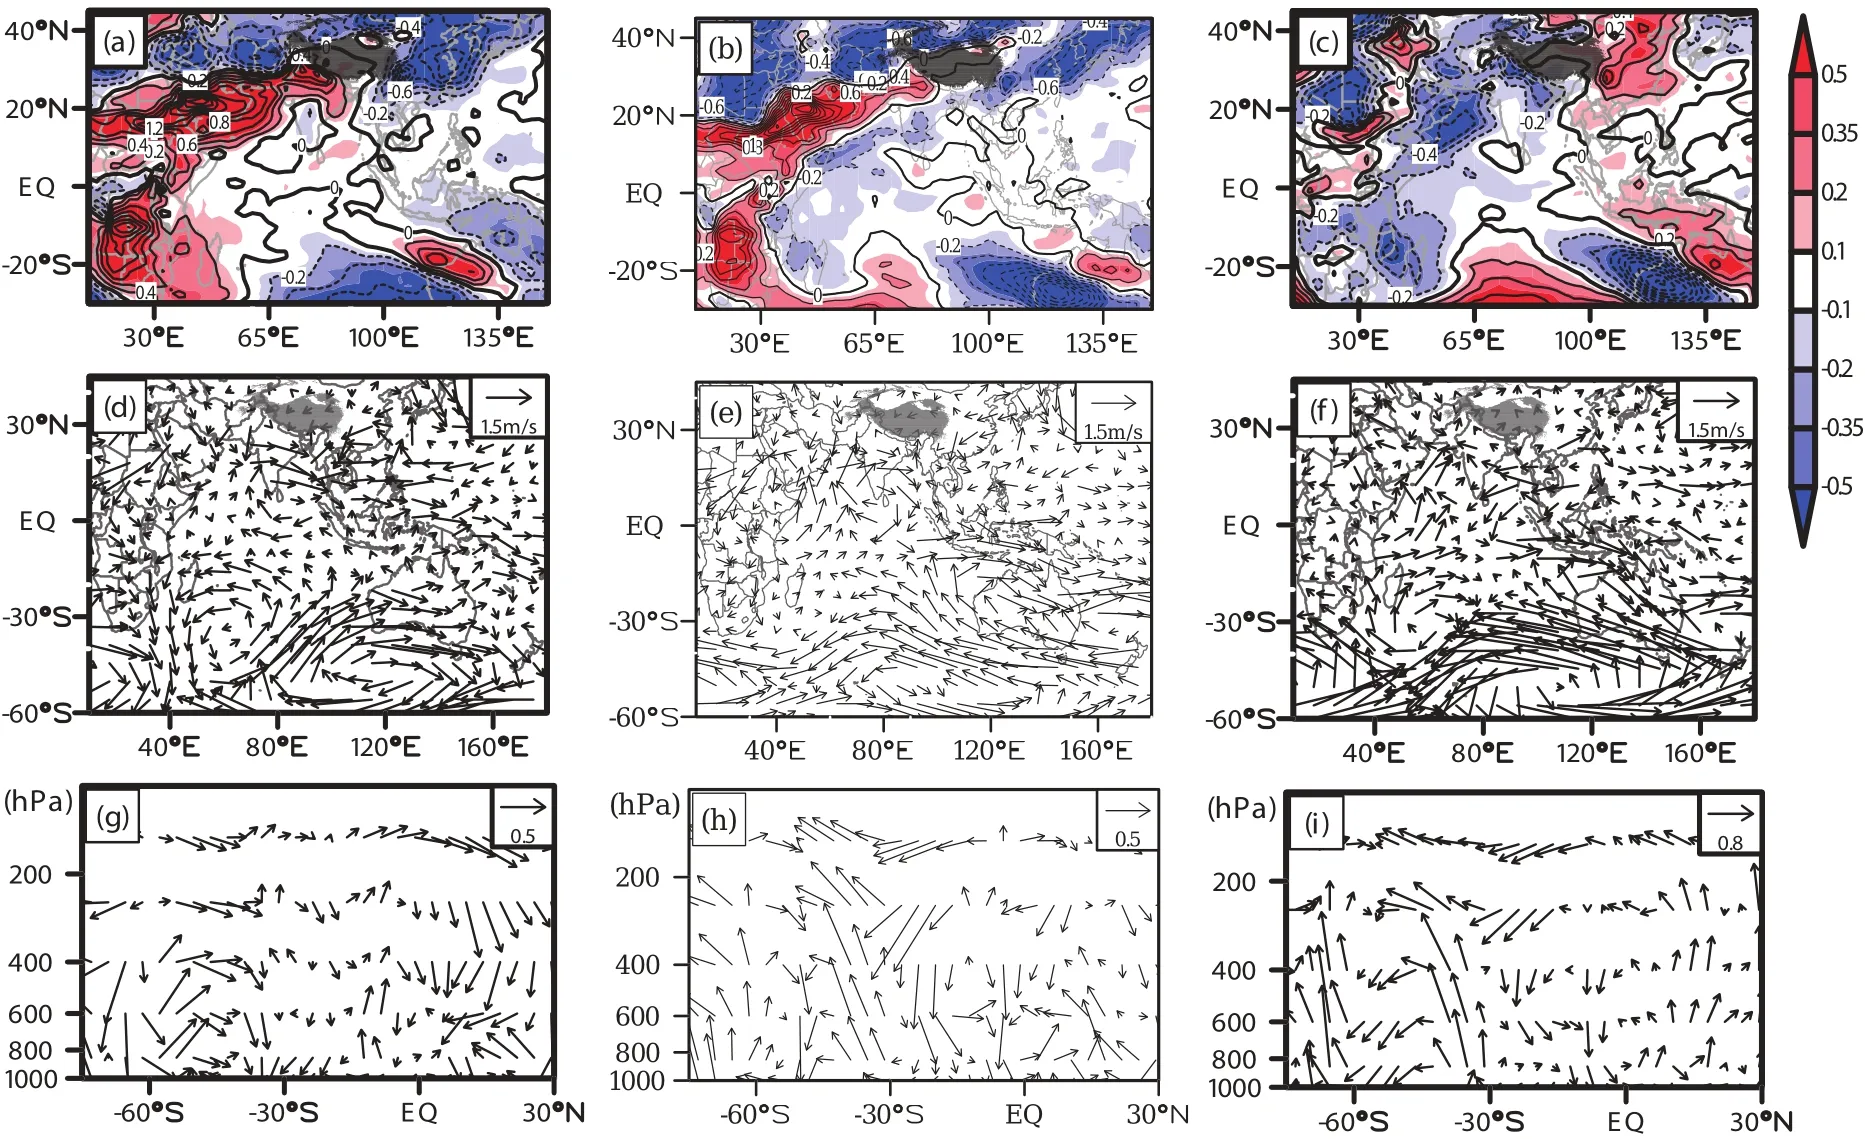
Fig.8.Differences of(a–c)air temperature(units:°C)at850 hPa,(d–f)(u,v)(units:m s?1)at850 hPa,and(g–i)latitude–pressure cross sections of v(units:m s?1)andω(units:hPa s?1)vectors averaged over 30°–90°E between the w ith-and w ithout-ZSSTI-anomaly experiments,aswell as their differences in summer:(a,d,g)the nZSSTIexperiment;(b,e,h)the pZSSTIexperiment;(c,f,i)the differencesbetween the pZSSTIand nZSSTIexperiments.The contour intervalsare 0.2°C.
5. Summary
In this study it is found that the AAO in boreal w inter hasa teleconnected influence on the SMJintensity in the follow ing spring and summer.The teleconnected relationships are independent of ENSO.When the SMJ intensity is in a stronger positive phase,it can be traced backward to an increased SLP anomaly over the southern m idlatitudes but a decreased SLP over the South Pole regions in the preceding w inter,which is characterized by the positive phase of the AAO.Sim ilar to Zheng and Li(2012),it is also found thata strong positivephaseof thewinterAAO isgenerally followed by warmer SST anomaliesover the southernm idlatitudesbut colder SST anomalies over the southern high latitudes,and vice versa.Because the SST anomaliesmay persist into the follow ing summer,the anomalous SST pattern induced by the AAOmay be closely associatedw ith the variability of the SMJintensity.Therefore,the SST variability in the southern high andmiddle latitudesplaysan important role in bridging the AAO and SMJintensity.
A possiblemechanism for the role of the SST variability over the southern high and m iddle latitudes in bridging the AAO and SMJisalso discussed.In w inter,the AAO influences the SST variability in the southern high andmiddle latitudes through the air–sea coupling.When the AAO is in its strong(weak)phase,the Southern Ocean is anomalously warmer(cooler)in themidlatitudes but cooler(warmer)in the high latitudes,accompanied by increased(decreased) SLPover thesouthernm idlatitudesand decreased(increased) SLP over the southern high latitudes.This anomalous SST patternw illpersist from borealw inter to the follow ing spring and summer.As Zheng and Li(2012)pointed out,the possiblemechanism for this anomalous SST pattern associated w ith the AAO in borealw intermay be responsible for the latentheat flux change caused by the variability in sea surface w ind speed.In follow ing strong spring and summer ZSSTI years,the SST anomaly in southern high and m iddle latitudes activates the verticalmeridional circulation anomaly w ith anomalous ascending motion near 30°S and descend-ing motion near 60°S,which means a weakened local Ferrel cell.At the same time,large-scale anomalous downward motion occurs near the equator,implying a reduced regional Hadley cell(especially in the NH).The anomalous downward motion then produces a decrease in low cloud cover and downward surface longwave radiation flux over the tropical Indian Ocean,buta relative increase in low cloud cover and downward surface longwave radiation flux over theAsian continent.Consequently,lesswarming occurs in the tropical ocean,butmorewarming of the Asian continent.Finally,the land–sea thermal contrastbetween the tropical Indian Ocean and the Asia continent is enhanced and the SMJintensity in summer(orspring)isalso strengthened.
Themechanism discussed above isalso confi rmed by numericalsimulation experimentsbased on CAM5.This isone possible way to explain the coupling of the boreal w inter AAO and SMJintensity in the follow ing spring and summer. Other physical processes linking them are still in existence, and so furtherexploration of thissubjectisneeded.Thiswork could result in extending the lead time of seasonal forecasts of themonsoon climate from the previous spring to w inter. Furthermore,in an operationalsetting,itshould also lead to betterunderstanding of short-term climate predictions.
Acknow ledgements.We would like to thank the editor and two anonymous reviewers for improving the originalmanuscript. This work was jointly supported by the National Natural Science Foundation of China(Grant Nos.41175051 and 41490642), the National Basic Research and Development(973)Program of China(Grant No.2012CB957804),and the Postgraduate Science and Technology Innovation Projectof Jiangsu Province(GrantNo. CXZZ13-0517).SHIWenjing also acknow ledges the financialsupportof the China Scholarship Council(CSC)and constructive suggestions from Drs.Jun LIand Yun LIU,whowork at the Cooperative Institute forMeteorological Satellite Studiesand the Center for Climatic Research at the University of Wisconsin–Madison,USA, respectively.
REFERENCES
Carton,J.A.,G.Chepurin,X.H.Cao,and B.Giese,2000a:A simple ocean data assim ilation analysis of the global upper ocean 1950–95.Part I:Methodology.J.Phys.Oceanogr.,30, 294–309.
Carton,J.A.,G.Chepurin,and X.H.Cao,2000b:A simpleocean dataassimilation analysisof theglobalupperocean 1950–95. Part II:Results.J.Phys.Oceanogr.,30,311–326.
Chen,B.,P.W.Guo,and Y.C.Xiang,2005:Relationship between summer cross–equatorial flows and ENSO.Journal ofNanjing Institute ofMeteorology,30,779–785.(in Chinese)
Cong,J.,Z.Y.Guan,and L.J.Wang,2007:Interannual(interdecadal)variabilitiesof two cross–equatorial flows in association w ith the Asia summermonsoon variations.Journal of Nanjing Institute ofMeteorology,30(6),779–785.(in Chinese)
Chakraborty,A.,R.S.Nanjundiah,and J.Srinivasan,2009:Impact of A frican orography and the Indian summermonsoon on the low–level Somali jet.Inter.J.Climatol.,29,983–992.
Dai,W.,and Z.N.Xiao,2014:Multi–time scale variation characteristics of Somali jet and its contactw ith precipitation in China.Journal ofTropicalMeteorology,30(2),368–376.(in Chinese)
Findlater,J.,1969:A major low–level air currentnear the Indian Ocean during the northern summer.Quart.J.Roy.Meteor. Soc.,95,362–380.
Gruber,A.,and A.F.Krueger,1984:The status of the NOAA outgoing longwave radiation dataset.Bull.Amer.Meteor. Soc.,65,958–962,doi:10.1175/1520-0477(1984)065<0958: TSOTNO>2.0CO;2.
Gong,D.Y.,and S.W.Wang,1999:Definition of Antarctic oscillation index.Geophys.Res.Lett.,26,459–462.
Gao,H.,F.Xue,and H.Wang,2003:Influenceof interannualvariability of Antarctic oscillation on meiyu along the Yangtze and HuaiheRivervalley and itsimportance to prediction.Chinese Science Bulletin,48,61–67.(in Chinese)
Gao,H.,Y.Y.Liu,Y.G.Wang,andW.J.Li,2013:Precursory influenceof theAntarcticOscillationon theonsetofAsian summermonsoon.Chinese Science Bulletin,58,678–683,doi: 10.1007/s11434-012–5455–x.(in Chinese)
Halpern,D.,and P.M.Woiceshyn,2001:Somalijetin the Arabian Sea,ElNi?no,and India rainfall.J.Climate,14,434–441.
Hoerling,M.P.,J.W.Hurrell,T.Xu,G.T.Bates,and A. S.Phillips,2004:Twentieth century North Atlantic climate change.Part II:Understanding the effect of Indian Ocean warming.Climate Dyn.,23,391–405,doi:10.1007/s00382-004–0433x.
Ho,C.H.,J.H.Kin,C.H.Sui,and D.Y.Gong,2005:Possible influence of the Antarctic Oscillation on tropical cyclone activity in the western North Pacific.J.Geophys.Res.,110, D19104,doi:10.1029/2005JD005766.
Krishnamurti,T.N.,and H.N.Bhalme,1976:Oscillations of a monsoon system.Part I:Observationalaspects.J.Atmos.Sci., 33(10),1937–1954.
Krishnamurti,T.N.,J.Molinari,and H.L.Pan,1976:Numerical simulation of the Somali jet.J.Atmos.Sci.,33,2350–2362.
Kalnay,E.,and Coauthors,1996:The NCEP/NCAR 40–year reanalysis project.Bull.Amer.Meteor.Soc.,77,437–471,doi: 10.1175/1520-0477(1996)077<0437:TNYRP>2.0.CO;2.
Lei,X.C.,and X.Q.Yang,2008:Interannual variation characteristic of easthemispheric cross–equatorial flow and its contemporaneous relationships w ith temperature and rainfall in China.Journal ofTropicalMeteorology,24(2),127–135.(in Chinese)
Li,C.,and S.L.Li,2014:Interannualseesaw between the Somali and the Australian cross–equatorial flows and its connection to the East Asian Summer Monsoon.J.Climate,27,3966–3981,doi:10.1175/JCLI–D–13-00288.1.
Nan,S.L.,and J.P.Li,2003:The relationship between the summer precipitation in the Yangtze River valley and the boreal spring Southern Hemisphere Annular Mode.Geophys.Res. Lett.,30(24),2266,doi:10.1029/2003GL018381.
Nan,S.L.,J.P.Li,X.J.Yuan,and P.Zhao,2009:Boreal spring Southern Hem isphere Annular Mode,Indian Ocean sea surface temperature,and East Asian summermonsoon.J.Geophys.Res.,114,D02103,doi:10.1029/2008JD010045.
Neale,R.B.,and Coauthors,2010:Description of the NCAR Community AtmosphereModel(CAM5.0),NCARTechnical Note.[Available online athttp://www.cesm.ucar.edu/models/ cesm1.0/cam/docs/description/cam5desc.pdf.]
Ramanathan,V.,R.D.Cess,E.F.Harrison,P.Minnis,B.R.Bark-strom,E.Ahmad,and D.Hartmann,1989:Cloud–radiative forcing and climate:Results from the Earth Radiation Budget Experiment.Science,243(4887),57–63.
Ramanathan,V.,B.Subasilar,G.J.Zhang,W.Conant,R.D.Cess, J.T.Kiehi,H.Grassi,and L.Shi,1995:Warm poolheatbudgetand shortwavecloud forcing:Amissing physics?Science, 267(5197),499–503.
Rodwell,M.J.,and B.J.Hoskins,1995:A model of the Asian summermonsoon.Part II:Cross–equatorial flow and PV behavior.J.Atmos.Sci.,52,1341–1356.
Smith,T.M.,and R.W.Reynolds,2004:Improved extended reconstruction of SST(1854–1997).J.Climate,17,2466–2477.
Shi,W.J.,and Z.N.Xiao,2013:Variation of the cross–equatorial moisture transport in Somali and its impact on china early summer rainfall in nearly 60 years.MeteorologicalMonthly, 39,39–45.(in Chinese)
Shi,W.J.,and Z.N.Xiao,2014:Impact of the preceding borealw inter Southern Annular Mode on the summertime Somali Jet.Atmos.Oceanic Sci.Lett.,7,534–539,doi:10.3878/ AOSL20140045.
Tao,W.K.,S.Lang,J.Simpson,C.H.Sui,B.Ferrier,and M. D.Chou,1996:Mechanisms of cloud–radiation interaction in the tropics andm idlatitudes.J.Atmos.Sci.,53(18),2624–2651.
Thompson,D.W.J.,and J.M.Wallace,2000:Annularmodes in the extratropical circulation.Part I:Month–to–month variability.J.Climate,13,1000–1016.
Uppala,S.M.,and Coauthors,2005:The ERA–40 re–analysis. Quart.J.Roy.Meteor.Soc.,131,2961–3012,doi:10.1256/qj. 04.176.
Ummenhofer,C.C.,A.S.Gupta,M.J.Pook,and M.H.England, 2008:Anomalous rainfall over southwestWestern Australia forced by Indian Ocean sea surface temperatures.J.Climate, 21,5113–5134.
Wang,H.J.,and F.Xue,2003:Interannualvariability of Somalijet and its influenceson the inter–hem isphericwatervapor transportand on the EastAsian summer rainfall.Chinese Journal ofGeophysics,46,18–25.(in Chinese)
Wu,Z.W.,J.P.Li,B.Wang,and X.H.Liu,2009:Can the Southern Hemisphereannularmode affectChinawintermonsoon? J.Geophys.Res.,114,D11107,doi:10.1029/2008JD011501.
Wu,Z.,J.Li,Z.Jiang,and T.Ma,2012:Modulation of the Tibetan Plateau snow cover on the ENSO teleconnections: From the East Asian summermonsoon perspective.J.Climate,25,2481–2489.
Wu,Z.W.,J.Dou,and H.Lin,2015:Potential influence of the November–DecemberSouthern Hem isphereannularmodeon the East Asian w inter precipitation:A new mechanism.Climate Dyn.,44,1215–1226,doi:10.1007/s00382-014-2241-2.
Zheng,F.,and J.P.Li,2012:Impact of preceding boreal w intersouthern hem isphereannularmodeon spring precipitation over south China and related mechanism.Chinese Journal ofGeophysics,55(11),3542–3557,doi:10.6038/j.issn.0001-5733.(in Chinese)
Zhu,Y.L.,2012:Variations of the summer Somaliand Australia cross–equatorial flows and the implications for the Asian summer monsoon.Adv.Atmos.Sci.,29(3),509–518,doi: 10.1007/s00376-011–1120-6.
13 April2015;revised 30May 2015;accepted 16 June 2015)
:Shi,W.J.,Z.N.Xiao,and J.J.Xue,2016:Teleconnected influence of the borealw inter Antarctic Oscillation on the Somali Jet:Bridging role of sea surface temperature in southern high andmiddle latitudes.Adv.Atmos.Sci.,33(1), 47–57,
10.1007/s00376-015-5094-7.
?Corresponding author:Ziniu XIAO
Email:xiaozn@lasg.iap.ac.cn
 Advances in Atmospheric Sciences2016年1期
- Advances in Atmospheric Sciences的其它文章
- Revisiting the Second EOFMode of Interannual Variation in Summer Rainfallover East China
- Evolution of Instability before and during a Torrential Rainstorm in North China
- Radiative Effectson TorrentialRainfallduring the Land fallof Typhoon Fitow(2013)
- Simulation of Quasi-Linear Mesoscale Convective System s in Northern China: Lightning Activitiesand Storm Structure
- Verification and Correction of Cloud Base and Top Height Retrievals from Ka–band Cloud Radar in Boseong,Korea
- Effectsof Surface Flux Parameterization on the Numerically Simulated Intensity and Structureof Typhoon Morakot(2009)