
Quantitative Analysis Using Fourier Transform Ion Cyclotron Resonance Mass Spectrometry and Correlation between Mass Spectrometry Data and Sulfur Content of Crude Oils
2015-06-22 14:19:10WangWeiLiuYingrongLiuZelongTianSongbai
中國煉油與石油化工 2015年4期
Wang Wei; Liu Yingrong; Liu Zelong; Tian Songbai
(SINOPEC Research Institute of Petroleum Processing, Beijing 100083)
Quantitative Analysis Using Fourier Transform Ion Cyclotron Resonance Mass Spectrometry and Correlation between Mass Spectrometry Data and Sulfur Content of Crude Oils
Wang Wei; Liu Yingrong; Liu Zelong; Tian Songbai
(SINOPEC Research Institute of Petroleum Processing, Beijing 100083)
Fourier transform ion cyclotron resonance mass spectrometry (FT-ICR MS) has become a powerful tool for analyzing the detailed composition of petroleum samples. However, the correlation between the numerous peaks obtained by FT-ICR MS and bulk properties of petroleum samples is still a challenge. In this study, the internal standard method was applied for the quantitative analysis of four straight-run vacuum gas oils (VGO) by atmospheric pressure photoionization (APPI) FT-ICR MS. The heteroatom class distribution of these VGO samples turned to be different when the concentration changed. Linear relationship between the normalized abundance and the concentration of VGO samples was identified for the total aromatic compounds, aromatic hydrocarbons, S1and N1species. The differences of the response factors were also discussed. The sulfur contents of a series of crude oils were proved to be linear with the FT-ICR MS data calibrated by the response factor of S1species. This study demonstrated the feasibility of the internal standard method in quantitative analysis with APPI FT-ICR MS, and the bulk properties of petroleum samples could be correlated directly with the FT-ICR MS data.
FT-ICR MS; APPI; internal standard method; response factor; petroleomics
1 Introduction
Fourier transform ion cyclotron resonance mass spectrometry (FT-ICR MS) has been a powerful tool for the analysis of petroleum samples since it was invented by Comisarow and Marshall[1]. Thanks to its ultra-high mass power resolution and mass accuracy, FT-ICR MS is able to provide detailed chemical composition of petroleum, which is one of the most complex natural organic mixtures[2-5]. A new term known as petroleomics[6-7]was also introduced with the development of FT-ICR MS, by which the properties and reactivity of the petroleum samples could be correlated with their chemical composition. Many types of petroleum samples, such as crude oils[8-10], vacuum gas oils[11-14], vacuum residues[15-16], resins[17], and asphaltenes[18-20]were characterized by FT-ICR MS coupled with different kinds of ion sources. The degradation of petroleum molecules in the environment was also investigated by FT-ICR MS[21-23]. However, the combination of the properties with the tremendous data obtained by FTICR MS is still a great challenge. The chemical compositions obtained by FT-ICR MS were combined with the properties of crude oils by Hur, et al.[24-25]using statistical methods. The correlation of the abundance of nonaromatic oxygen species and total acid number was also studied by Cho, et al.[26]using laser desorption ionization (LDI) FT-ICR MS. Although the correlation of the FTICR MS data with properties of petroleum samples was interpreted, a clear quantitative relationship had not been published to our knowledge.
Atmospheric pressure photoionization (APPI) coupled with FT-ICR MS has been widely used to characterize the nonpolar species in petroleum samples[12-13,15,27-28]. In this study, a quantitative analytical method for APPI FT-ICR MS was developed by using the internal standard compound. The linear relationship between the FT-ICR MS data and the concentration of vacuum gas oils was established. The differences of the response factors were also discussed. The internal standard method was then applied to combine the FT-ICR MS data with the sulfur contents of ten crude oils. An improved linear relationship between the FT-ICR MS data and the sulfur contents of crude oils was obtained after calibration.
2 Experimental
2.1 Sample preparation
As shown in Table 1, four straight-run vacuum gas oils (VGO) named VGO A, VGO B, VGO C, and VGO D with different sulfur contents were chosen for this study. N,N’-diphenyl-N,N’- di(3-methylphenyl)-1,1’-biphenyl-4,4’-diamine (TPD) was selected as the internal standard for quantitative analysis. TPD was purchased from the Sigma-Aldrich Corp. and was further purified by vacuum sublimation. The VGO samples and TPD were dissolved in the HPLC-grade toluene (Dikma Corp.). Before the measurements, the VGO samples were diluted to 0.05, 0.1, 0.2, 0.5, 1.0, and 2.0 mg/mL with toluene, respectively, and the concentration of TDP in these solutions was 0.2 ppm. The properties of 10 crude oils are listed in Table 2. The crude oils were diluted to a concentration of 0.5 mg/mL in toluene with 0.2 ppm of TPD.

Table 1 Bulk properties of 4 VGO samples w, %
2.2 Mass spectrometric analysis
The prepared samples flowed through a fused-silica capillary at a rate of 360 μL/h by a syringe pump (Hamilton Corp.). Analyses were conducted on a 9.4 T Bruker Apex FT-ICR MS. The positive mode atmospheric pressure photoionization (APPI) was used as the ionization source. Nitrogen served as the drying gas and nebulizing gas. The drying gas flow rate was 6.0 L/min at a temperature of 200 ℃. The nebulizing gas flow rate was 2.0 L/min and the APPI temperature was 400 ℃. The skimmer voltage was set at 30.0 V. The ion accumulation time was 0.5 s for all the samples. The m/z ranged from 150 to 800 for VGO samples and from 150 to 1000 for crude oil samples. 256 scans were accumulated for each spectrum. Each sample was measured 3 times to inspect the data repeatability.
2.3 Mass calibration and data analysis
The spectra obtained by APPI FT-ICR MS were internally calibrated by Tuning Mix (Agilent Corp.) as an external calibration. The peaks with a relative abundance greater than six standard deviations of baseline rms noise (6σ) were exported for the data analysis. Chemical formulas (CcHhNnOoSs) were calculated according to the m/z values and the error was less than 1×10⁻⁶.
3 Results and Discussion
3.1 Heteroatom class distribution at different concentration
The heteroatom class distribution of four VGO samples at different concentrations in the solution is shown in Figure 1. The most abundant species in four VGO samples were aromatic hydrocarbons (HC), compounds containing a single sulfur atom (S1) and compounds containing a single nitrogen atom (N1). It is noted that the relative abundance of these species for each VGO sample was not a constant and changed a lot when the concentration increased from 0.05 mg/mL to 2.0 mg/mL. The relative abundance of aromatic hydrocarbons decreased sharply, while the relative abundance of S1and N1species increased with their increasing concentration in the four VGO samples. Typically, the relative abundance of the species was used to compare the composition of petroleum samples at the same concentration level, such as 0.2 mg/mL or 0.5 mg/mL. However, the SARA fractions of petroleum samples were quite different and the effective fractions which were ionized in APPI source might be not at the same level in fact. As a result, this phenomenon was worthy to be studied.
The variation of the relative abundance at different concentrations could be explained by two possible reasons: (1) More S1/N1species and/or fewer HC species were detected at higher concentration; and (2) The response behavior of the species was different when the concentration changed.
For the first reason, the number of the peaks for all the species in four VGO samples was compared at different concentrations, with the results shown in Figure 2. It is found that the number of the peaks at a concentration of 0.05 mg/mL was significantly less than those of other concentrations, indicating that the species in the sam-ples were not fully detected at such low concentration. However, the number of the peaks at other concentrations showed almost the same tendency for HC, S1and N1species. When the concentration increased to 2.0 mg/mL, the number of peaks of S1species even reduced for VGO B, VGO C, and VGO D, while that of HC species remained almost unchanged. As a result, the detected number of peaks for the species at different concentrations was not the main reason leading to the variation of the relative abundance.
In this work, we focused more on the second reason and the response factor of different species was studied. In order to describe the response factor, a clear relationship between the FT-ICR MS intensity and concentration was necessary. As the absolute intensity was not stable in FTICR MS, an internal standard was introduced to obtain the normalized intensity of different species.
3.2 Selection of the internal standard compound
A proper internal standard compound is vital for ensuring satisfactory quantitative analysis results. Stearic acid was chosen for the quantitative analysis of petroleum acids by electrospray ionization mass spectrometry (ESI MS) and ESI FT-ICR MS[29-30]. 9-Docosyl carbazole was synthesized and used as the internal standard to combine APPI FT-ICR MS data obtained from SARA fractions into one to represent the unseparated crude oil sample.[31]However, some compounds existing in petroleum samples showed the same mass peaks with these internal standards and affected the abundance of the internal standards.
In this work, N,N′-diphenyl-N,N′-di(3-methylphenyl)-1,1’-biphenyl-4,4’-diamine (TPD)[32]was selected as the internal standard compound. The expanding mass spectrum around the peak of TPD and the spectra of four VGO samples without TPD in the same range are illustrated in Figure 3. There are several advantages for this internal standard: (1) The molecular weight of TPD is in the range of VGO and crude oils. (2) The structure of TPD shown in Figure 3 consists of 6 aromatic rings, which can be easily detected by APPI FT-ICR MS even at low concentration. (3) The exact m/z of TPD is 516.2560 Da which is different from the peaks in the VGO samples as shownin Figure 3. One of the reasons is that most compounds in VGO samples contained less than 6 aromatic rings[11-14,33]. As a result, TPD was considered to be a suitable internal standard for the quantitative analysis of VGO samples by APPI FT-ICR MS.

Figure 1 Relative abundance of heteroatom class distribution at different concentrations in the four VGO samplesVGO concentration: ■—0.05 mg/mL;■—0.10 mg/mL;■—0.20 mg/mL;■—0.50 mg/mL; ■—1.00 mg/mL; ■—2.00 mg/mL

Figure 2 Number of the peaks for the species at different concentrations in the four VGO samplesVGO concentration: ■—0.05 mg/mL;■—0.10 mg/mL;■—0.20 mg/mL;■—0.50 mg/mL; ■—1.00 mg/mL; ■—2.00 mg/mL

Figure 3 Expanded mass spectra in the m/z range of 516.20 to 516.60(a) with internal standard; (b—c) without internal standard. The concentration for VGO A—D was 0.5 mg/mL. The peak marked with star was a contaminant peak which was not identified
3.3 Quantitative analysis using internal standard method
With the application of internal standard in the APPI FTICR MS measurements, the normalized abundance of each spectrum was obtained according to Equation (1):

where ITis the abundance of the total compounds obtained by FT-ICR MS except for that of the internal standard, and IISis the abundance of the internal standard.
As the number of peaks of S1species reduced at the concentration of 2.0 mg/mL, the ICR cell might reach the limitation in trapping ions[34]at such high concentration. The relationship between the normalized abundance and concentration was limited in the range of 0.05—1.0 mg/mL. As the value of ITwas much larger than that of IIS, the normalized abundance was very sensitive to the experiment condition. As a result, the relative error (RE) of three measurements enlarged with an increasing concentration, as shown in Figure 4. However, a satisfactory linear rela-tionship was still observed.
The normalized abundance of HC species, S1species, and N1species also revealed a linear relationship with the concentration, as shown in Figure 5. Then, the variation of the heteroatom class distribution at different concentrations could be calculated by these linear equations of different species. Figure 6 illustrates the calculated relative abundance (line) and measured relative abundance (dot) for HC and S1species at different concentrations. The calculated results were consistent with the measured het-eroatom class distribution. As a result, it was concluded that the variation of the relative abundance at different concentrations in Figure 1 was mainly due to the different response behavior of the species.

Figure 4 Linear relationship between the normalized abundance of the total compounds versus the concentration in the range of 0.05—1.0 mg/mLThe error bar indicates the relative error (RE) of 3 measurements

Figure 5 The linear relationship between the normalized abundance versus the concentration in the range of 0.05—1.0 mg/mL■—VGO A;●—VGO B;▲—VGO C;▼—VGO D.The error bar indicates the RE of 3 measurements
The response ability of S1species and N1species can be described by the slope of the fitted straight line and the sulfur/nitrogen content as shown by the following equations:
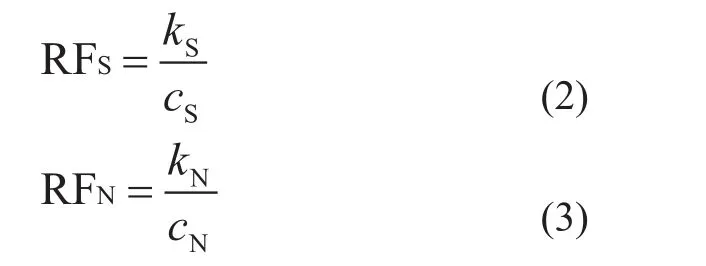
where RFS/RFNis the response factor of S1/N1species, kS/kTis the slope of the fitted line of S1/N1species, and cS/cNis the content of sulfur/nitrogen.

Figure 6 The measured relative abundance (dot) and calculated relative abundance (line) of aromatic hydrocarbons (HC) and S1species in four VGO samples

Figure 7 Response factor of (a) S1species (RFS) and (b) N1species (RFN) for VGO A, VGO samples
RFSand RFNreflected the correlation between the FT-ICR MS response and the content of sulfur and nitrogen. For example, if RFSwas identical for different VGO samples, the FT-ICR MS response of S1species would be only related to the value of sulfur content at the same concentration. The comparison between RFSand RFNof four VGO samples is illustrated in Figure 7. The RFSdecreased withan increasing sulfur content, indicating that the FT-ICR MS response of S1species was not only determined by the sulfur content. Meanwhile, the RFNin VGO B, VGO C, and VGO D was also quite different, although the nitrogen content of these oils was very close. The reason might be that the N1species in VGO samples consisted of basic nitrogen species and neutral nitrogen species, which were considered to have different response ability for APPI source[16,35-36].
Although TPD was a nitrogen-containing compound, the linear relationship for HC, S1, and N1species had proved that it was a suitable internal standard for the complex petroleum samples. The optimization of the internal standard, such as choosing a sulfur-containing aromatic compound for S1species, was hopeful of improving the linear correlation coefficient and dynamic range. However, the differences in RFSof different oils would still exist, because it reflected the inherent properties of S1species.
3.4 Application of the internal standard method in the sulfur content of crude oils
A series of crude oils listed in Table 2 were measured to investigate the correlation between the sulfur content and FT-ICR MS data. Typically, the relative abundance of S1species was used for correlation between the properties of crude oils and FT-ICR MS data. However, in some cases, higher sulfur content resulted in even lower relative abundance of S1species, as shown in Figure 8a. The reason might be that the relative abundance was affected by a series of factors and the relationship was far away from a linear one. As a comparison, the normalized abundance of S1species was only affected by the response of S1species and the internal standard. Then, the relationship between the sulfur content and the normalized abundance of S1species was described as an improved linear relationship in Figure 8b.
As described before, the response factor of S1species (RFS) decreased with an increasing sulfur content in VGO samples, indicating that the normalized abundance of S1species was underestimated for high-sulfur oils. It was assumed that the relationship also existed in crude oils and was extrapolated according to an empirical formula as shown in Figure 9a. The RFSfor these crude oils was obtained by the empirical formula. The normalized abundance of the S1species of the crude oils was then calibrated by respective RFS, as shown in Figure 9b. A better linear relationship between the calibrated abundance and sulfur content was observed. It is noted that RFSwas also a function of sulfur content, denoting that the sulfur content of crude oils could be predicted just by measuring the normalized abundance of S1species in crude oils.

Table 2 Bulk properties of 10 crude oils

Figure 8 The relationship between the relative abundance (a) and normalized abundance (b) of S1species and sulfur content of 10 crude oils

Figure 9 The empirical formula of the RFs at different sulfur contents (a) and the relationship between the calibrated abundance of S1species and sulfur content of 10 crude oils (b)
4 Conclusions
This study applied the internal standard method in the quantitative analysis using APPI FT-ICR MS. The heteroatom class distribution of VGO samples at different concentrations varied mainly due to the different response behavior of the species. By addition of the internal standard compounds, the normalized abundance of the total compounds, aromatic hydrocarbons (HC species), S1species and N1species showed a linear relationship with the concentration. The response factors of S1species and N1species were not a constant in different VGO samples, indicating that the FT-ICR MS response of S1species and N1species was not exclusively determined by the sulfur and nitrogen content. The method was also applied in studying the sulfur content of crude oils. A satisfactory linear relationship was found between the calibrated abundance of S1species and the sulfur content of the crude oils. These results have provided a practical means for predicting the bulk properties of crude oils by the FTICR MS data.
Acknowledgements:This work was supported by the Major State Basic Research Development Program of China (973 Program, No. 2012CB224801).
[1] Comisarow M B, Marshall A G. Frequency-sweep Fourier transform ion cyclotron resonance spectroscopy[J]. Chem Phys Lett, 1974, 26(4): 489-490
[2] Qian K, Rodgers R P, Hendrickson C L, et al. Reading chemical fine print: Resolution and identification of 3000 nitrogen-containing aromatic compounds from a single electrospray ionization Fourier transform ion cyclotron resonance mass spectrum of heavy petroleum crude oil[J]. Energy Fuels, 2001, 15(2): 492-498
[3] Qian K, Robbins W K, Hughey C A, et al. Resolution and identification of elemental compositions for more than 3000 crude acids in heavy petroleum by negative-ion microelectrospray high-field Fourier transform ion cyclotron resonance mass spectrometry[J]. Energy Fuels, 2001, 15(6): 1505-1511
[4] Schaub T M, Rodgers R P, Marshall A G. Speciation of aromatic compounds in petroleum refinery streams by continuous flow field desorption ionization FT-ICR mass spectrometry[J]. Energy Fuels, 2005, 19(4): 1566-1573
[5] Panda S K, Schrader W, al-Hajjj A, et al. Distribution of polycyclic aromatic sulfur heterocycles in three Saudi Arabian crude oils as determined by Fourier transform ion cyclotron resonance mass spectrometry[J]. Energy Fuels, 2007, 21(2): 1071-1077
[6] Marshall A G, Rodgers R P. Petroleomics: The next grandchallenge for chemical analysis[J]. Acc Chem Res, 2004, 37(1): 53-59
[7] Rodgers R P, Schaub T M, Marshall A G. Petroleomics: MS returns to its roots[J]. Anal Chem 2005, 77(1): 20A-27A
[8] Shi Q, Hou D, Chung K H, et al. Characterization of heteroatom compounds in a crude oil and its saturates, aromatics, resins, and asphaltenes (SARA) and non-basic nitrogen fractions analyzed by negative-ion electrospray ionization Fourier transform ion cyclotron resonance mass spectrometry[J]. Energy Fuels, 2010, 24(4): 2545-2553
[9] Mapolelo M M, Rodgers R P, Blakney G T, et al. Characterization of naphthenic acids in crude oils and naphthenates by electrospray ionization FT-ICR mass spectrometry[J]. Int J Mass Spectrom, 2011, 300(2/3): 149-157
[10] Cho Y, Kim Y H, Kim S. Planar limit-assisted structural interpretation of saturates/aromatics/resins/asphaltenes fractionated crude oil compounds observed by Fourier transform ion cyclotron resonance mass spectrometry[J]. Anal Chem, 2011, 83(15): 6068-6073
[11] Stanford L A, Kim S, Rodgers R P, et al. Characterization of compositional changes in vacuum gas oil distillation cuts by electrospray ionization Fourier transform-ion cyclotron resonance (FT-ICR) mass spectrometry[J]. Energy Fuels, 2006, 20(4): 1664-1673
[12] McKenna A M, Purcell J M, Rodgers R P, et al. Heavy petroleum composition. 1. Exhaustive compositional analysis of Athabasca bitumen HVGO distillates by Fourier transform ion cyclotron resonance mass spectrometry: A definitive test of the Boduszynski model[J]. Energy Fuels, 2010, 24(5): 2929-2938
[13] McKenna A M, Blakney G T, Xian F, et al. Heavy petroleum composition. 1. Progression of the Boduszynski model to the limit of distillation by ultrahigh-resolution FT-ICR mass spectrometry[J]. Energy Fuels, 2010, 24(5): 2939-2946
[14] Avila B M F, Vaz B G, Pereira R, et al. Comprehensive chemical composition of gas oil cuts using two-dimensional gas chromatography with time-of-flight mass spectrometry and electrospray ionization coupled to Fourier transform ion cyclotron resonance mass spectrometry[J]. Energy Fuels, 2012, 26(8): 5069-5079
[15] Purcell J M, Juyal P, Kim D, et al. Sulfur speciation in petroleum: Atmospheric pressure photoionization or chemical derivatization and electrospray ionization Fourier transform ion cyclotron resonance mass spectrometry[J]. Energy Fuels, 2007, 21(5): 2869-2874
[16] Zhang L, Xu Z, Shi Q, et al. Molecular characterization of polar heteroatom species in Venezuela Orinoco petroleum vacuum residue and its supercritical fluid extraction subfractions[J]. Energy Fuels, 2012, 26(9): 5795-5803
[17] Dutriez T, Courtiade M, Ponthus J, et al. Complementarity of Fourier transform ion cyclotron resonance mass spectrometry and high temperature comprehensive twodimensional gas chromatography for the characterization of resin fractions from vacuum gas oils[J]. Fuel, 2012, 96: 108-119
[18] Juyal P, Yen A T, Rodgers R P, et al. Compositional variations between precipitated and organic solid deposition control (OSDC) asphaltenes and effect of inhibitors on deposition by electrospray ionization Fourier transform ion cyclotron resonance (FT-ICR) mass spectrometry[J]. Energy Fuels, 2010, 24(4): 2320-2326
[19] Klein G C, Kim S, Rodgers R P, et al. Mass spectral analysis of asphaltenes. I. Compositional differences between pressure-drop and solvent-drop asphaltenes determined by electrospray ionization Fourier transform ion cyclotron resonance mass spectrometry[J]. Energy Fuels, 2006, 20(5): 1965-1972
[20] Klein G C, Kim S, Rodgers R P, et al. Mass spectral analysis of asphaltenes. II. Detailed compositional comparison of asphaltenes deposit to its crude oil counterpart for two geographically different crude oils by ESI FT-ICR MS[J]. Energy Fuels, 2006, 20(5): 1973-1979
[21] Pan Y, Liao Y, Shi Q, et al. Acidic and neutral polar NSO compounds in heavily biodegraded oils characterized by negative-ion ESI FT-ICR MS[J]. Energy Fuels, 2013, 27 (6): 2960-2973
[22] Corilo Y E, Podgorski D C, McKenna A M, et al. Oil spill source identification by principal component analysis of electrospray ionization Fourier transform ion cyclotron resonance mass spectra[J]. Energy Fuels, 2013, 27 (19): 9064-9069
[23] Ruddy B M, Huettel M, Kostka J E, et al. Targeted petroleomics: Analytical investigation of Macondo well oil oxidation products from Pensacola beach[J]. Energy Fuels, 2014, 28(6): 4043-4050
[24] Hur M, Yeo I, Park E, et al. Combination of statistical methods and Fourier transform ion cyclotron resonancemass spectrometry for more comprehensive, molecularlevel interpretations of petroleum samples[J]. Anal Chem, 2010, 82(1): 211-218
[25] Hur M, Yeo I, Kim E, et al. Correlation of FT-ICR mass spectra with the chemical and physical properties of associated crude oils[J]. Energy Fuels, 2010, 24(10): 5524-5532
[26] Cho Y, Witt M, Kim Y H, et al. Characterization of crude oils at the molecular level by use of laser desorption ionization Fourier transform ion cyclotron resonance mass spectrometry[J]. Anal Chem, 2012, 84(20): 8587-8594
[27] Panda S K, Andersson J T, Schrader W. Characterization of supercomplex crude oil mixtures: What is really in there?[J] Angew Chem Int Ed, 2009, 48(10): 1788-1791
[28] Gaspar A, Zellermann E, Lababidi S, et al. Impact of different ionization methods on the molecular assignments of asphaltenes by FT-ICR mass spectrometry[J]. Anal Chem, 2012, 84(12): 5257-5267
[29] Qian K, Edwards K E, Dechert G J, et al. Measurement of total acid number (TAN) and TAN boiling point distribution in petroleum products by electrospray ionization mass spectrometry[J]. Anal Chem, 2008, 80(3): 849-855
[30] Vaz B G, Abdelnur P V, Rocha W F C, et al. Predictive petroleomics: Measurement of the total acid number by electrospray Fourier transform mass spectrometry and chemometric analysis[J]. Energy Fuels, 2013, 27(4): 1873-1880
[31] Cho Y, Na J G, Nho N S, et al. Application of saturates, aromatics, resins, and asphaltenes crude oil fractionation for detailed chemical characterization of heavy crude oils by Fourier transform ion cyclotron resonance mass spectrometry equipped with atmospheric pressure photoionization[J]. Energy Fuels, 2012, 26(5): 2558-2565
[32] Stolka M, Yanus J F, Pai D M. Hole transport in solid solutions of a diamine in polycarbonate[J]. J Phys Chem, 1984, 88(20): 4707-4714
[33] Fu J, Kim S, Rodgers R P, et al. Nonpolar compositional analysis of vacuum gas oil distillation fractions by electron ionization Fourier transform ion cyclotron resonance mass spectrometry[J]. Energy Fuels, 2006, 20(2): 661-667
[34] Marshall A G, Hendrickson C L, Jackson G S. Fourier transform ion cyclotron resonance mass spectrometry: A primer[J]. Mass Spectrom Rev, 1998, 17(1): 1-35
[35] Purcell J M, Rodgers R P, Hendrickson C L, et al. Speciation of nitrogen containing aromatics by atmospheric pressure photoionization or electrospray ionization Fourier transform ion cyclotron resonance mass spectrometry[J]. J Am Soc Mass Spectrom, 2007, 18 (7): 1265-1273
[36] Purcell J M, Hendrickson C L, Rodgers R P, et al. Atmospheric pressure photoionization proton transfer for complex organic mixtures investigated by Fourier transform ion cyclotron resonance mass spectrometry[J]. J Am Soc Mass Spectrom, 2007, 18 (9): 1682-1689
New Method for Synthesis of Formamide from CO2
The research team headed by Ding Kuiling working in the State Key Laboratory of Metallorganic Chemistry at the CAS Shanghai Institute of Organic Chemistry by using the princer type ruthenium complex catalyst has successfully developed a new method for effectively synthesizing formamide compounds from CO2, H2and primary or secondary amines serving as the feedstocks.
This method features mild reaction conditions (including a reaction temperature of 80—120 ℃ and a total CO2+H2pressure of less than 7 MPa), high catalytic efficiency, good selectivity and broad adaptability of bottoms. Especially during synthesis of DMF this catalyst can be easily recycled with its catalytic activity being basically retained after 12 recycles.
Furthermore, this research team by adopting the one pot method coupled with the stepwise reaction strategy has realized the conversion of CO2to methanol through formamide derivative functioning as the intermediate, which has mapped out a new method and idea for reclamation and reutilization of carbon dioxide. This research achievement represents a major progress in chemical utilization of CO2following the team’s success in synthesizing methanol and 1,2-ethylene glycol via catalytic hydrogenation of ethylene carbonate over the ruthenium catalyst under mild reaction conditions in 2012.
date: 2015-08-31; Accepted date: 2015-10-12.
Dr. Wang Wei, Telephone: +86-10-82368443; E-mail: wangwei3.ripp@sinopec.com.
- 中國煉油與石油化工的其它文章
- Numerical Simulation of Enhanced Oil-Water Separation in a Three-Stage Double-Stirring Extraction Tank
- Design and Control of Self-Heat Recuperative Distillation Process for Separation of Close-Boiling Mixtures: n-Butanol and iso-Butanol
- Computational Fluid Dynamics Simulation of Liquid-Phase FCC Diesel Hydrotreating in Tubular Reactor
- Promotional Effect of CoO(OH) on Selective Hydrogenation of Maleic Anhydride to γ-Butyrolactone over Supported Ruthenium Catalyst
- Microbial Characterization of Denitrifying Sulfide Removal Sludge Using High-Throughput Amplicon Sequencing Method
- Hydrothermal Liquefaction of Wheat Straw in Sub-critical Water/Ethanol with Ionic Liquid for Bio-oil Production