
Novel method for identifying the stages of discharge underwater based on impedance change characteristic
2024-04-24 06:17:16ChongGAO高崇ZhongjianKANG康忠健DajianGONG龔大建YangZHANG張揚(yáng)YufangWANG王玉芳andYimingSUN孫一鳴
Plasma Science and Technology 2024年4期
關(guān)鍵詞:張揚(yáng)
Chong GAO (高崇),Zhongjian KANG (康忠健),*,Dajian GONG (龔大建),Yang ZHANG (張揚(yáng)),Yufang WANG (王玉芳) and Yiming SUN (孫一鳴)
1 Department of New Energy,China University of Petroleum,Qingdao 266580,People’s Republic of China
2 Shanghai Ruida Fengzhi Science and Technology Corporation,Shanghai 201703,People’s Republic of China
3 China National Petroleum Group General Research Institute of Engineering and Technology Corporation,Beijing 100029,People’s Republic of China
4 Oil and Gas Resource Survey Center,China Geological Survey,Beijing 100083,People’s Republic of China
Abstract It is difficult to determine the discharge stages in a fixed time of repetitive discharge underwater due to the arc formation process being susceptible to external environmental influences.This paper proposes a novel underwater discharge stage identification method based on the Strong Tracking Filter (STF) and impedance change characteristics.The time-varying equivalent circuit model of the discharge underwater is established based on the plasma theory analysis of the impedance change characteristics and mechanism of the discharge process.The STF is used to reduce the randomness of the impedance of repeated discharges underwater,and then the universal identification resistance data is obtained.Based on the resistance variation characteristics of the discriminating resistance of the pre-breakdown,main,and oscillatory discharge stages,the threshold values for determining the discharge stage are obtained.These include the threshold values for the resistance variation rate (K) and the moment (t).Experimental and error analysis results demonstrate the efficacy of this innovative method in discharge stage determination,with a maximum mean square deviation of Scr less than 1.761.
Keywords: discharge underwater,discharge stage identification,impedance characteristics,strong tracking filter
1.Introduction
The industrial,medical,and national defense fields widely use pulse discharge in water technology,such as nanomaterial preparation,water quality treatment,and shale gas plugging removal [1–3].The mechanism of this is the liquid electric effect accompanied by physical effects such as light,heat,and force [4,5].Meanwhile,this is also known as the electric water hammer effect because of the accompanying shock waves [6,7].Meanwhile,this is also known as the electric water hammer effect because of the accompanying shock waves.The liquid electric effect is widely used in oil extraction technology by utilizing the characteristic that it is more convenient to generate pulse shock waves than drug explosion [8].
It is necessary to deepen the research on the energy conversion of each stage of underwater pulse discharge.The results can help to enhance the shock wave amplitude pressure and the energy consumption ratio of pulse discharge equipment.Existing research shows that pulse discharge in water is mainly divided into three stages: pre-breakdown discharge stage,violent discharge stage,and oscillatory discharge stage [9].Among them,the size of the shock wave amplitude and the total amount of mechanical energy are mainly determined by the arc resistance deposition energyPWin the main discharge stage [10,11].
Where,bothθandεare fitting coefficients.It is essential to clarify the starting momentt1and ending momentt2of the main discharge stage.The reason is that the corresponding discharge parameter of these moments is critical in engineering applying complex frequency underwater discharge to generate pulsed shock waves [12].The intuitive difference between the various discharge stages is reflected in the changing of voltage and current.The implicit characteristic is impedance change.However,the fundamental reason is that plasma density changes in the original arc channel [13].The transformation mechanism for the pre-breakdown discharge stage to the main discharge stage is that the plasma density of the initial arc channel reaches a critical value.The dense arc forms after the avalanche of ionization occurs.This change causes a sudden drop in the impedance of the channel at this stage.Subsequently,the plasma channel of the main discharge stage begins to expand,decreasing the channel plasma density and increasing impedance [14,15].When it is difficult to self-sustaining,the discharge transitions into the oscillatory discharge stage.Therefore,these impedances’ change characteristics effectively delineate the various discharge stages.
The current research results show that the arc channel path is susceptible to external environmental parameters of the discharge process under the above conditions [16,17].It results in discharge voltage and current values having a specific offset in the same external conditions.Meanwhile,the voltage and current waveforms measured by the digital equipment occasionally show spike jamming because the measurement equipment is affected by interference from the induced electric field generated on the discharge process.There is an urgent need for a method that can automatically identify the pulse discharge stage in water to solve this problem,meanwhile having a specific noise reduction function for estimating the total energy of the operation process.
By comprehensively considering the electrical and physical characteristics,this paper proposes to use the nonlinear filter for noise reduction and continuity of the native data,which can eliminate error and obtain the universal impedance characteristic variation law [18].There are more types of nonlinear filters,more representative of the Kalman Filter,Trackless Kalman Filter,and Strong Tracking Filter(STF),among others.Among them,the STF algorithm has wide application and high maturity in parameter identification.Ma S Ket alemployed a strong tracking filter to innovate an online stator resistance identification algorithm,and the experiment results validated the feasibility of the parameter identification method [19].Zhang Bet aldesigned and analyzed the observer of independent control electric vehicles by the modified STF and achieved the goal of accurately identifying the vehicle motion states fluctuated by driving torque mutation [20].Sun G Qet alproposed an unscented transformation strong tracking filter based on STF to eliminate errors and noise in measured data.The simulation results show that this method is superior to the Kalman Filter in estimation accuracy and tracking speed [21].Xiao X Get alpresented a new joint denoising algorithm for quality disturbance based on the Strong Tracking Kalman filter,which effectively suppresses the noise of various disturbance signals,and the effect is better than the wavelet threshold denoising algorithm [22].Therefore,it is feasible and meaningful to introduce the strong tracking filter into the identification study for parameters and the discharge stage of pulse discharge in water.
In this paper,section 1 introduces the experimental platform for measuring the discharge voltage and current data of the high-voltage pulse discharge in water.The core content of sections 2 and 3 is the basic architecture of the identification method.Section 2 analyzes and establishes the equivalent circuit model of pulse discharge in water in a phased manner.Subsequently,section 3 describes the noise reduction and parameter identification method proposed based on STF.Section 4 presents the validation experiments to analyze the identification data’s reliability and the method's feasibility.The study shows that using the discrimination data obtained by the STF effectively determines the pulse discharge stage in water.It provides a theoretical basis for analyzing the energy deposition and shock wave amplitude characteristics.
2.Underwater pulse discharge experiment
2.1. Experiment platform
Underwater high-voltage pulse discharge experimental platform was built to collect the voltage and current data,which is used to study the impedance particular change characteristics of the pulse discharge underwater,as shown in figure 1.This platform consists of three main parts: power control,pulse discharge,and data measurement.The data measurement component includes both the discharge data measurement module and the image acquisition module.
(1) Power control part.The power control unit outputs controlled alternating current in the voltage range of 0–500 V and frequency range of 0.5–2.5 kHz to achieve the effect of continuously charging the energy storage unit (the equivalent value of energy storage capacitor is 8μF).The energy storage unit employs a quadruple voltage rectifier circuit to convert low-voltage AC power into high-voltage DC power.The device can carry out regulation work in the range of discharge frequency from 0 to 50 Hz.The maximum operating voltage of the device is 30 kV.
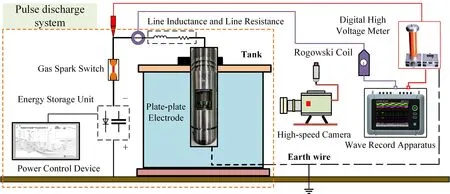
Figure 1.Structure diagram of pulse discharge experimental platform in water.
(2) Pulse discharge part.The discharge electrode is in the shape of plate-plate,and the cathode electrode plate connects to the gas spark switch (discharge at atmospheric pressure)with a switching voltage of 16 kV.The cathode and anode are cylindrical copper columns with 50 mm and 10 mm diameters,respectively.The anode connects to the device housing (negative polarity discharge),and the housing is grounded.The electrodes are immersed in a rectangular transparent explosion-proof glass cylinder of 0.38 m,0.28 m,and 0.32 m,respectively.The liquid in the container is a deionized water solvent with sodium chloride as the solute.
(3) Data measurement part.The data measurement module consists of the Rogowski coil with 30 MHz bandwidth (PEM CWT Mini/Mini HF),digital high voltage meter with 10 MHz bandwidth (SGB-50C),and a continuous recorder (YOKOGAWA DL350).The image acquisition module comprises a high-speed camera (Phantom V2512)with a Nikon lens (AF-S 50 mmf/1.4 D).The high-speed camera works at a frame rate of 2μs/frame and uses posttrigger mode to facilitate the capture of multiple discharge process information.
The Rogowski coil measurement point is set in the middle of the wire that connects the gas spark switch and the discharge electrode.It can measure the current values of the discharge electrode accurately.The high-voltage probe clamps on the electrode terminal,and the other end connects to a digital high-voltage meter.The continuous recorder(YOKOGAWA DL350) records its measured voltage data.The high-speed camera captures the arc form data and the lens axis of the high-speed camera at the same level as the midpoint of the electrode gap.
2.2. Experimental data
The data of pulse discharge underwater is acquired by the continuous recorder with a sampling rate of 1 MHz.The conductivity of the water is 1734μS/cm.The discharge voltage is -16 kV.The distance of the electrode gapDegis 0.6 mm,1.0 mm,and 1.4 mm,respectively.Typical experimental data and their trends are shown in figure 2.
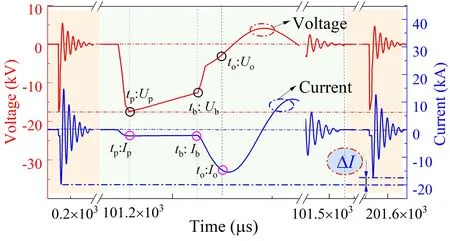
Figure 2.Waveform of pulse discharge voltage and current in water.
The curves of figure 2 represent discharge voltage and current data of complete three consecutive discharge cycles.The part of zero-value data during the discharge interval is hidden to highlight the trend character of the experiment data.Meanwhile,the second cycle data is stretched laterally to elucidate the beginning moment of each discharge stage.Among them is the rapidly changing character of voltage,shown as the voltage changes to -16 kV rapidly at thetpmoment in the figure 2.Subsequently,the voltage drops to-13 kV slowly until attb,while the current rises slowly.The time of (tp,tb) is the pre-breakdown discharge stage,in which the flow column is formatted and developed.Meanwhile,the voltage drops sharply in the following moments,and the current increases rapidly until momentto.The time of range(tb,to) is the main discharge stage,in which the arc is formatted and expanded [23].Finally,the arc disappears after momentto,and the voltage and current oscillate reciprocally until the value is zero because the plasma channel is still present [24].
It is not ignored that the horizontal dashed line in the figure does not connect the peak points of each discharge,i.e.,there is a difference between the peak voltage or peak current during the continuous discharge process,as the ΔIin figure 2.The main approach is to analyze the spatial position and morphology of the initial arc during the continuous discharge as acquired by a high-speed camera.Next,the distribution of ablation points on the electrode surface is compared after discharge.Underwater repeated discharge images and electrode surface ablation are shown in figure 3.
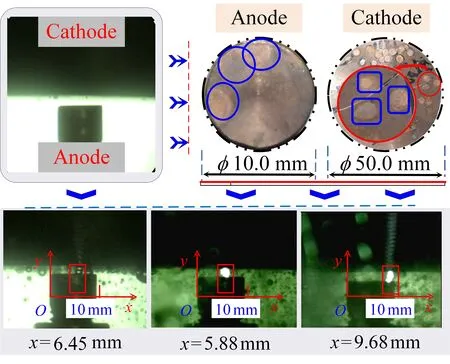
Figure 3.Randomness of arc position between electrodes.
The main discharge stage of the underwater pulsed discharge process generates a gas bubble.It pulsates until it transforms into microbubbles after the arc extinguishing and dispersing in the water for a short time.Owing to the significant contrast in dielectric constants between gas and water,when the spark switch is activated during the subsequent discharge cycle,the electrode plate in the water,influenced by microbubbles,transforms into an irregular electric field.This phenomenon becomes more perceptible in the highfrequency repetitive discharge processes.The aqueous solution as an inhomogeneous electric field affects the formation and development of the initial arc channel.The overall manifestation of this phenomenon is stochastic under constant preset conditions,which leads to differences in the relevant discharge parameters [25].Influenced by this character,it is difficult to distinguish the discharge stages in the repeated discharge processes with fixed time domains or critical parameters.
3.Model construction and analysis
3.1. Stage impedance characteristics and model
3.1.1. Pre-breakdown discharge stageExisting studies show that the initial arc channel (plasma channel) formation and development occur in the pre-breakdown discharge stage.The formation process is as follows.Firstly,the local electric field is formed in the extremely inhomogeneous fluid between the electrode plates when a high voltage is applied to the electrodes.Next,the precursor formed after the free electrons accumulated near the electrode surface.The electrons move by the force of the electric field.Finally,the initial plasma channel is formed after the precursor moves to the other cathode surface,and the time of this process is about 10–25 ns [26].Therefore,it is only to consider the aqueous medium’s leakage current between electrodes at this stage because there is no main form of the current channel between electrodes.Meanwhile,its resistance is determined by the conductivity of the liquid.
The plasma inside the channel displays conductive under the action of the external electric field after forming the initial arc channel.However,it cannot generate a dense arc to dissipate energy.The primary effect factor is that the initial channel diameter in the micrometer range (μm) is too small;meanwhile,the electron density of the internal arc is too low [27].Therefore,the radiation continuously heated the aqueous medium around the outer wall surface of the initial arc channel.This energy comes from the internal energy of the electron in the arc channel.The boundary medium reaches the “boundary boiling temperature” based on this heating process,which lowers the dielectric constant of the boundary medium and thus eventually promotes channel redevelopment [28].Electrode resistance of the channel is time-varying with the continuous development of the arc channel.However,the inhomogeneous electric field causes this resistance to change nonlinearly.The equivalent resistance at this stage is 10–103times higher than that at the main discharge stage,which is determined by the electron density in the channel and the channel volume.Since no arcing is generated in this stage,the arcing inductance does not exist either.Thus,this stage can be regarded as a timevarying resistive equivalent circuit,as shown in figure 4.
The following are content is the meaning and value of the symbols in figure 4.Ucis the high voltage direct current output by the voltage-doubling rectifier.U(t) is the measured voltage.L0is the line inductance that is equal to 1.32×10⁻⁵H.R0represents line resistance,measured as 0.03 Ω using the digital bridge.K is the gas spark switch.i(t) is the line current.R(t) is the time-varying equivalent resistance of the electrode gap.
The equivalent circuit equation for this stage is shown as:
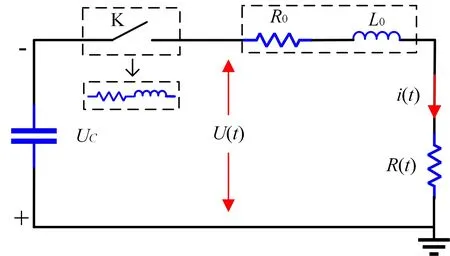
Figure 4.Equivalent circuit of pre-breakdown discharge stage.
3.1.2. Pre-breakdown discharge stageThe density of water vapor and ions in the initial plasma channel reaches a critical value along with the avalanche ionization.Subsequently,the physical process enters the main discharge stage when a dense arc is formed in the arc channel [29].As a result,the resistance between the electrodes decreases sharply under the action of a dense arc.Meanwhile,the rapid deposition of electrical energy in the arc channel increases the arc radius rapidly.Existing studies show that arc inductance and arc radius are closely related.Hence,taking the time-varying characteristics of the arc inductanceL(t) into the circuit model of the main discharge stage is necessary.The equivalent circuit diagram of this stage is shown in figure 5.
The equivalent circuit equation for the main discharge stage is established aimed to obtain the time-varying electrical parameters,shown as follows:
Then,equation (4) is established by deriving parametric equation (3) to acquire the inductance and resistance parameters at each discharge time.Subsequently,taking the measured experimental voltage and current data to equation(4) can solve these parameters.
3.1.3. Oscillatory discharge stageAs the arc discharge progresses,the arc dissipates when the external voltage cannot maintain a balanced discharge for plasma.However,the plasma generated by ionization in the previous two stages remains in-side the bubble,and the density increases compared to before.The conductivity between the electrodes increases,which reduces the resistance at this stage.Meanwhile,the polarity of water molecules also affects the resistance value in the circuit.Under the influence of an electric field,water molecules undergo directional motion,generating an electric dipole moment and thus reducing the resistance between the electrodes.
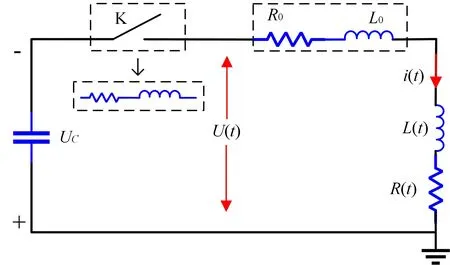
Figure 5.Equivalent circuit diagram of main discharge stage.
The high-voltage capacitanceCesuof energy storage unit,equivalent capacitance of plasmaCeleand inductance continuously absorb and release electrical energy,resulting in an oscillatory process that causes periodic changes in voltage during the discharge process.This oscillation can be described using an RLC circuit model consisting of elements such as resistors,inductor,and capacitor.The equivalent circuit for this stage is shown in figure 6.Compared toCesu,theCelevalue is significantly smaller and has no substantial impact on the overall changes in the equivalent circuit oscillation.Therefore,it is not included in the calculation process in the actual research,caused by the small value ofCele.Similarly,due toCelebeing so small that its contribution to the current value is much smaller than that of other branches,the shunt effect is also not included in the scope of consideration.
The charges in the plasma will gradually be neutralized and re-adsorbed into water molecules when the discharge ends,and the resistance will increase.The energy of the oscillation will be completely dissipated.The equivalent circuit equation of the oscillating discharge stage and angular frequency can be represented by equation (5).
3.2. Impedance variation characterization
This section clarifies the characteristics of the impedance change during the complex frequency discharge underwater.The corresponding data was acquired by solving the resistance values of the experimental data in section 1.Meanwhile,the basis of calculation is the equivalent circuit model established in section 2.1.The measured resistance data ofDegequal to 0.6 mm were set as an example,and the results are shown in figure 7.There are 82 sets of data in the figure.
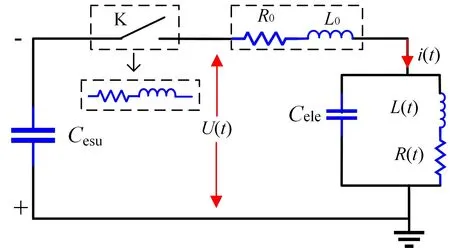
Figure 6.Equivalent circuit diagram of oscillatory discharge.
The changing characteristics of the resistance during the discharge process are obtained by analyzing the resistance data presented in figure 7(a) and the evolving trends of the embedded graph data.Firstly,the resistance value increases after the gas spark switch is connected.It increases to the maximum when the voltage is pulse peak,and the discharge process enters the pre-breakdown stage now.It is marked by a black arrow in figure 7(a).Next,the resistance shows a linear decreasing trend until discharge enters the main discharge stage,as a red arrow marks the position.Subsequently,the resistance shows a linear decreasing trend until the discharge process enters the main discharge stage.The resistance value sharply decreases when entering the main discharge stage,shown as the position marked by a green arrow.At the critical point of the pre-breakdown and main discharge stages,some resistance values show a highly discrete distribution and have a certain longitudinal bandwidth,as shown in figure 7(a) for the data points near 15μs.Among them,the reference standard for dividing the starting moment of the main discharge stage is the standard discharge voltage variation characteristic,i.e.,the moment of sudden voltage change [24].Finally,the resistance changing trend is level off and linear when the discharge process enters the oscillatory discharge stage.Therefore,the resistance characteristics of this section are consistent with the theoretical analysis in section 2.1.
This section highlights the impedance variation characteristics in the repetitive discharge operation by using the partial resistance data in each discharge cycle as samples.The data are the measured values at the steady state of each discharge stage.Among them,the 5μs and the 12μs belong to the pre-breakdown discharge stage of each discharge process,whose resistance measurement data are shown in figures 7(b) and (c);the 16μs belong to the main discharge stage,whose data are shown in figure 7(d);the 19μs and 23μs belong to oscillatory discharge stage,whose relevant parameter values are shown in figures 7(e) and (f).There are differences in the resistance values at the one moment for each discharge process from the comparison of the data in figures 7(b)–(f).Therefore,the distribution of resistance data in the figure exhibits some dispersion.On the other hand,the distribution of these data is approximately around a specific value.This phenomenon is inferred from the density plot of the scatter distribution.Among them,the density chromaticity distributions in figures 7(b) and (d) are more extensive than those in figures 7(c) and (e),which indicates that the arc channel morphology just after the change of the discharge stage has a much random nature. Meanwhile,this phenomenon also exists in figure 7(e),caused by the inconsistent rate of plasma neutralization after arc extinction,so the oscillatory discharge stage also has a strong randomness.
The characteristics of resistance distribution and variation are consistent with the results of existing studies (i.e.,the formation of plasma channels in subsonic flow columns for discharge underwater is highly random).At the same time,this feature also exists in figure 2.In summary,the characteristics of resistance variation indicate that the resistance exists difference in each discharge period of the complex frequency discharge process.Therefore,it cannot quantify the resistance value for any moment directly,so using a constant resistance value or time as the basis for determining the discharge stage is also not rigorous.
4.Independence identified based on the STF
4.1. Identification model
The result is that the changing trend of the discharge process resistance is nonlinear,which is concluded by the analysis of the underwater discharge mechanism and the characteristics of the equivalent circuit model in section 2.Based on relevant research results,the state equation and measurement equation of the nonlinear system are set as follows [30–32]:
where,Rest(k)∈Rlis the state vector,which denotes the predicted resistance obtained afterkiterations of the algorithm for momentt.u(k)∈Rlis the control vector.Rmea(k) is the observation vector,which denotes the measured resistance of groupkat momentt(which can be calculated from equation (3)).In the nonlinear function expression,f(k,u(k),Rest(k)) ∈Rl×landh(k+1,Rest(k+1)) ∈Rp×ldenote the state transfer matrix and observation matrix atkiterations,respectively.Γ(k) is the input matrix function of process noise.ω(k) andv(k+1) are system noise and measurement noise respectively.Meanwhile,these all obey the zero-mean Gaussian distribution,and the variance isQandRGaussian white noise.
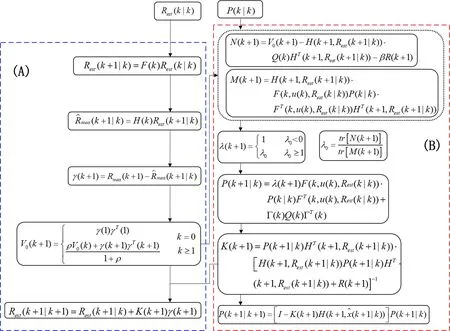
Figure 8.Flow chart of parameter identification based on the STF.
The STF recursive method based on the above system state estimation and the resistance identification flow is shown in figure 8.Here,the (A) shows the time update steps.The predicted resistance equation was obtained by Taylor expansion of the nonlinear system,neglecting the expanded equations' higher order terms.Meanwhile,the (B) shows the measurement update steps.Based on the section (A),the measurement matrix error analysis is conducted to solve the prediction error variance array and correct the asymptotic elimination factorλto improve the tracking effect.
The STF innovatively introduces the fading factorλ(k)compared to the conventional Kalman filter.The fading factorλ(k) strengthens the weight of current observation data and weakens the influence of old data on the current filtering value.Where,λ(k+1) is the suboptimal fading factor,which can be deduced from the following equation:
Here,βis the weakening factor,which makes the state estimate smoother.It is always greater than 1 in the actual calculation process.The covariance error matrix of the residualV0(k) is shown in equation (12):
ρis forgetting factor,which is generally selected as 0.95[33].The measured and estimated parameters are introduced into the equation as state quantities,and the STF can identify the parameters in real time.
4.2. Parameter identification method
The underwater repeated discharge experiments to collect voltage and current samples were carried out under the experimental settings in section 2.The conductivity of the water is set at 1734μS/cm.The distance of electrode gapDegis set as 0.6 mm,1.0 mm,and 1.4 mm,respectively.Next,the identification resistance during the repeated discharge underwater was calculated by the discharge resistance identification model based on STF.Here,the corresponding parameters are obtained from the solution of the equivalent circuit model and will be input to the resistance identification model as measured values.Finally,the identification resistance data is used as an example when theDegis 0.6 mm.Here,it is illustrated by listing some data because there are too many data points at the oscillation discharge stage to be fully displayed,and the results are shown in table 1.
First,the resistance reaches a maximum value of 15.31 Ω at 4μs and decreases nearly linearly after.Next,the resis-tance drops to 12.16 Ω at 14μs,and this drops to 0.19 Ω at 22μs abruptly.Lastly,the resistance values change to oscillating after 23μs until the end of the discharge,and all values during this period are mainly in the interval [0.58 Ω,0.70 Ω].The results show that the trend of the identified resistance is consistent with the experimentally measured resistance.There also exists a transparent longitudinal gradient in the resistance values.For example,15.31 Ω at 4μs is significantly greater than 12.16 Ω at 14μs and 0.32 Ω at 23μs.
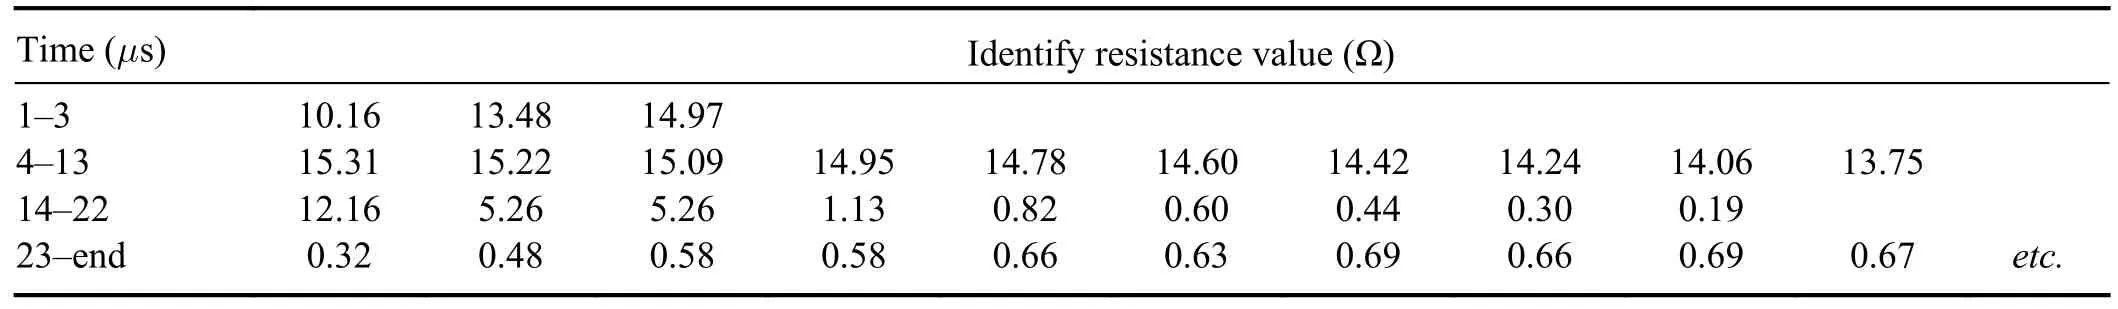
Table 1.Identified resistance data for Deg=0.6 mm.
As can be inferred from the characteristics of the change in resistance above,the difference in resistance values at different stages varies multiplicatively.By comparing the time of resistance changes with the moment of the sudden change in voltage and current (as shown in figure 7(a)),the results show that the moment of the sudden change in the data for these three parameters is the same,i.e.,the moment of the sudden change in resistance is the moment of change in the discharge stage.Therefore,this identification model has a fundamental role in supporting the identification study of the later discharge stage.
4.3. Discharge stage determination method
The study results of sections 2 and 3.2 show that theRestslope can be a critical parameter for determining the discharge stage.Firstly,the “Ordinary Differential Equation”is employed to derive the identification resistance slope coefficientSrc,expressed as follows:
where,Rest(t+1) is the identification resistance at the momentt+1.Rest(t) is the identification resistance at momentt. Δtis the time difference for resistance identification.
Next,it can be known thatSrcchanges with discharge time based on theRestchange characteristics.Therefore,the discharge stage division is conducted based on the interval distribution characteristics of theSrc.The relationship between the values range ofSrcand parametertis shown as follows:
where,α,β,andδindicate the slope change coefficient thresholds between the pulse rise stage,the pre-breakdown discharge stage,the main discharge stage,and the oscillatory discharge stage,respectively.The discharge process is in the rising pulse stage when the value ofSrcis less thanα.Otherwise,it enters the pre-breakdown stage.As time progresses,the pre-breakdown discharge stage ends and enters the main discharge stage when theSrcis less thanβ.Finally,the main discharge stage ends and enters the oscillation discharge stage when the value ofSrcis less thanδ.Based on this method,the experimental discharge data is solved and analyzed.The specific discharge stage is further determined by theSrcof measured resistance,as shown in figure 9.
The influence of the complex discharge environment and electromagnetic interference causes measurement errors and spikes in the measured data.This phenomenon is also visualized in the distribution of resistance data in figure 7(a),e.g.,the measured resistances in groups 78 and 80 at 14μs moment deviate more than the rest of the measured resistances.When spike disturbance presents in the identified discharge process,the value of this data point shows a step change.At the same time,the following data still conforms to the current discharge stage determination characteristics.Therefore,this data is considered noisy,and the corresponding moment belongs to the discharge stage within the current cycle.It is initially considered the subsequent discharge stage when there is a step change in the characteristics of a data point,but when two or more data points exhibit step changes,and the characteristics of the subsequent data point change abruptly again to belong to the characteristics of the previous stage,it can cause the loop not to work effectively.
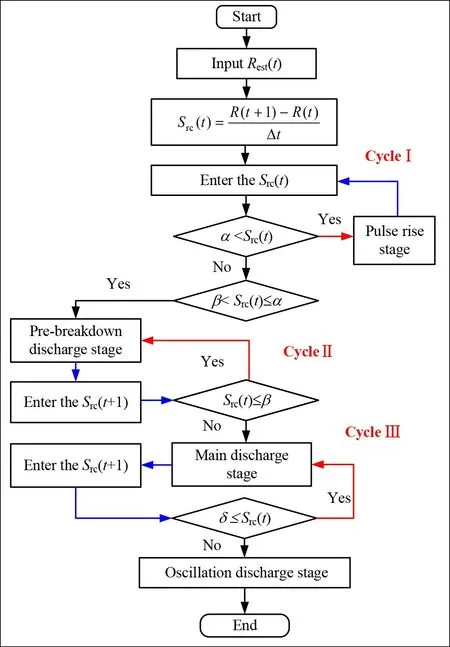
Figure 9.Flow of discharge stage identification method.
This paper innovatively introduces the time domain parametert(i.e.,t1,t2,andt3) into the identification model to solve this problem.Here,t1,t2andt3represent the threshold time of each discharge stage,and these were acquired from solving theSrcthreshold of inter-electrode under the current conditions.In conjunction with the genetic algorithm,these time thresholds are nested in loops I,II,III of the stage identification process (shown in figure 9).When the identification process presents samples with abrupt changes in data characteristics,a further determination is made in conjunction with the time domain threshold parameter,in addition to using the data characteristics of subsequent samples as a reference.When there is a continuous data feature change point,initially consider the moment corresponding to this point as one in the subsequent discharge stage and then judge against thetof this stage.Such as the above data point change type,if the moment of the last abrupt change point is greater thant,the judge is starting to enter the subsequent discharge stage and the judge vice versa for the noise in the current stage.
5.Analysis and discussion
5.1. Identification results
The high-voltage discharge experiments were carried out based on the experimental platform of pulsed discharge in water.The conductivity of the water was 1734μS/cm and the distance of electrode gapsDepwas set as 0.6 mm,1.0 mm,and 1.4 mm.The 70 sets of discharge voltage and current data were measured and recorded at each electrode gap.Subsequently,the measured resistance values were obtained based on the equivalent circuit model described in section 2.After that,these data are input into the STF model for discharge parameter identification,yielding the identification resistance data illustrated in figure 10.The red lines and dots represent the identification resistance data in figure 10.Meanwhile,the blue dots are the measured resistanceRmea.
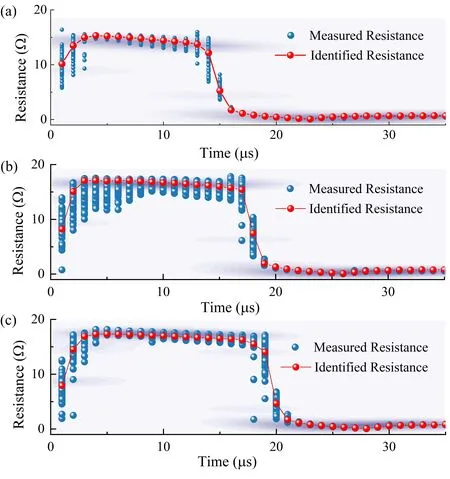
Figure 10.Comparison of identification resistance with the measurement resistance.
The identification results ofRmeaforDepequal to 0.6 mm are shown in figure 10(a).The results show a linearly decreasing trend during the pre-breakdown discharge stage until the moment 14μs,with data in the range [13.75 Ω,15.31 Ω].However,there is an abrupt change in the development trend of theRestafter the moment 14μs.TheRestshowed a significant reduction until 14μs,with a sudden drop ofRestto 1.74 Ω of moment 16μs.Subsequently,theRestdropped to 0.07 Ω at the moment 21μs.Combining the theory of resistance variation characteristics described in section 2 and theRmedata of figure 7,it is clear that the point of abrupt change in the data is the transition moment between the pre-breakdown and the main discharge stage.TheRestdata after moment 22μs falls strictly within the range [0.30 Ω,0.90 Ω],as shown in table 1.The data changes show an oscillating trend with time in a classical linear progression.From the contents of section 2,it can be known that the arc disappears at the end of the main discharge stage.However,the plasma cannot be completely neutralized and is quickly consumed.The subsequent resistances are under-damped oscillations.Therefore,the oscillatory discharge stage is after the moment 22μs.The scatter density plot from theRmeadata demonstrates that all theRmeavalues are also concentrated around theRest,as shown in figure 10(a).
In summary,the period of 4–14μs is the pre-breakdown discharge stage with a time delay of 11μs.The violent discharge stage is between 14μs and 21μs,with a time delay of 7μs.The oscillating discharge stage starts at the 22μs and ends when the discharge circuit is disconnected.
TheRmeavalues ofDep=1.0 mm are shown in figure 10(b).The results show a linearly decreasing trend ofRestduring the time of 4–17μs,with data in the range [15.41 Ω,17.10 Ω].TheRestis reduced signification after 17μs,with a sudden drop to 1.93 Ω at 19μs.Subsequently,theRestdropped to 0.10 Ω at 26μs.TheRestvalue of time after the moment 22μs entirely belongs to the range of [0.35 Ω,0.90 Ω].The changing trend of subsequent resistances is under-damped oscillations. The corresponding scatter density plots also show that theRestremains highly consistent with theRmea.
TheRmeavalues ofDep=1.4 mm are shown in figure 10(c).The data variation characteristics in this graph are consistent with figures 10(a) and (b) based on the analysis of this graphical feature.The linear-like variation stage of theRmeafor this discharge condition is [4μs,19μs],with the data ranging from 15.41 to 17.10 Ω.TheRestdrops abruptly after moment 19μs,to 1.69 Ω at moment 21μs and 0.08 Ω at the moment 28μs.Meanwhile,theRestvalue during the oscillation change stage ranges from 0.36 to 0.92 Ω.
Based on the results,equation (13) is used to solve theScrof theRest,and the results are shown in figure 11.The prebreakdown,main,and oscillation discharge stages can be distinguished by the changing characteristics of theScrcurve and the moment of abrupt change in figure 11.TheScrchanges during the pre-breakdown discharge stage are relatively flat,with the value stable belonging to the range [-0.78,0.04].In the main discharge stage,the resistance slope increases abruptly to -6.90,-8.05,and -9.37 for the three types ofDeg,respectively.Subsequently,theScrrises to a value approximately equal to -0.11.When entering the oscillatory discharge stage,Scrincreases to above 0.24 and then decreases.After that time,it changes more smoothly but still has the characteristic oscillatory change,as shown in the inset diagram in figure 11.
The main reason for this phenomenon during the prebreakdown stage is that the plasma channel develops gently,the physical boundary field is stable,and the resistance value changes steadily,so theScrvalues are small.Similarly,the arc channel conductivity rises steeply during the main discharge stage,and the resistance value drops suddenly,so theScrvalues are large.The ionization reaction ends when the arc disappears,and there is a sudden increase in resistance.As a result,Scrincreases to a positive value.Next,the changing trend ofScroscillates based on the RLC circuit characteristics.
The values of parametersα,β,andδcan be derived based on the curve change characteristics and the time threshold.Firstly,the process enters the pre-breakdown discharge stage whenScris less than 0.04 as the discharge progresses,i.e.,αtakes the value 0.04.Next,βtakes the value of -0.11.IfScris less than this,the process enters the main discharge stage.Finally,the critical valueδfor determining the discharge process as an oscillatory discharge stage is 0.24.
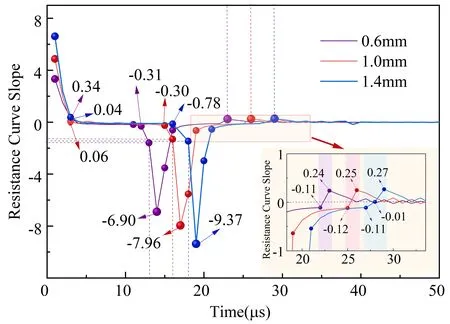
Figure 11.Slope curve of the identified resistance.
5.2. Validity analysis
The validation study for the discharge stage determination was carried out based on theRmeadata and the critical threshold of the relevant parameters.This content is used to verify the reliability and accuracy of the method proposed in this paper.The study includes the dispersion of theRestwith theRmea,the consistency ofScrofRestandRmea,and the reliability of the discharge stage determination.
The discharge stage determination parameters (i.e.,Scr,t1,t2,etc.) for the current experimental conditions were obtained based on section 5.1,and the values are shown in table 2.
The heat map figure 12 was plotted to highlight the trend and correctness ofScrdata.The points in this figure are the difference between theScrofRmeaand the corresponding values of critical threshold of discharge stage division (ie.α1,β1,δ1,α2,β2,etc.) in table 2.Meanwhile,theseScrare obtained by using equation (12) to calculate discharge resistance data (from the experiment ofDegequal to 0.6 mm,1.0 mm,1.4 mm) and based on the parameters in table 2.First,the difference value between the pulse-up and prebreakdown discharge stages is greater than zero and set as the data points for these stages in red.Subsequently,the difference value in the main discharge stage should be less than 0 and set as the data points in blue.Finally,the difference value for the start moment of the oscillatory discharge stage is greater than 0,and the point is set in red;the following points are blue.
The analysis of the macroscopic features in figure 12 shows that the color distribution in figure 12(a) is the most complex.This phenomenon indicates that the discharge stage identification process is relatively disturbed under this condition,but the results are more representative.Therefore,figure 12(a) was set as a typical example of detailed data analysis and the feasibility of discharge identification.Meanwhile,figures 12(b) and (c) were used as supplementary content.It should be noted that the reference line in figure 12 does not precisely represent the moment of the final discharge stage.These are only a reference to the macroscopic characteristic trends.
The macroscopic features of figure 12(a) show that the overall distribution of data points has some regularity.However,there are still anomalous data points and unsmooth boundary lines.A detailed analysis of this phenomenon is carried out.Firstly,the points before 3μs are alternating red and blue,indicating the presence of some value of data during the pulse voltage rising stage is negative.This phenomenon is inconsistent with the content in section 5.1,where theScris greater thanα.Characterization was carried out for the negative value points in the next.The results show that one type of negative data point corresponds to a negative value at the front moment and becomes positive at the next,as shown in box I-1 in figure 12(a).The other type of negative value point has the character of the positive value at both the front and the next.But only here is the negative value point and not against the characteristics ofScr,as shown in box II-1.
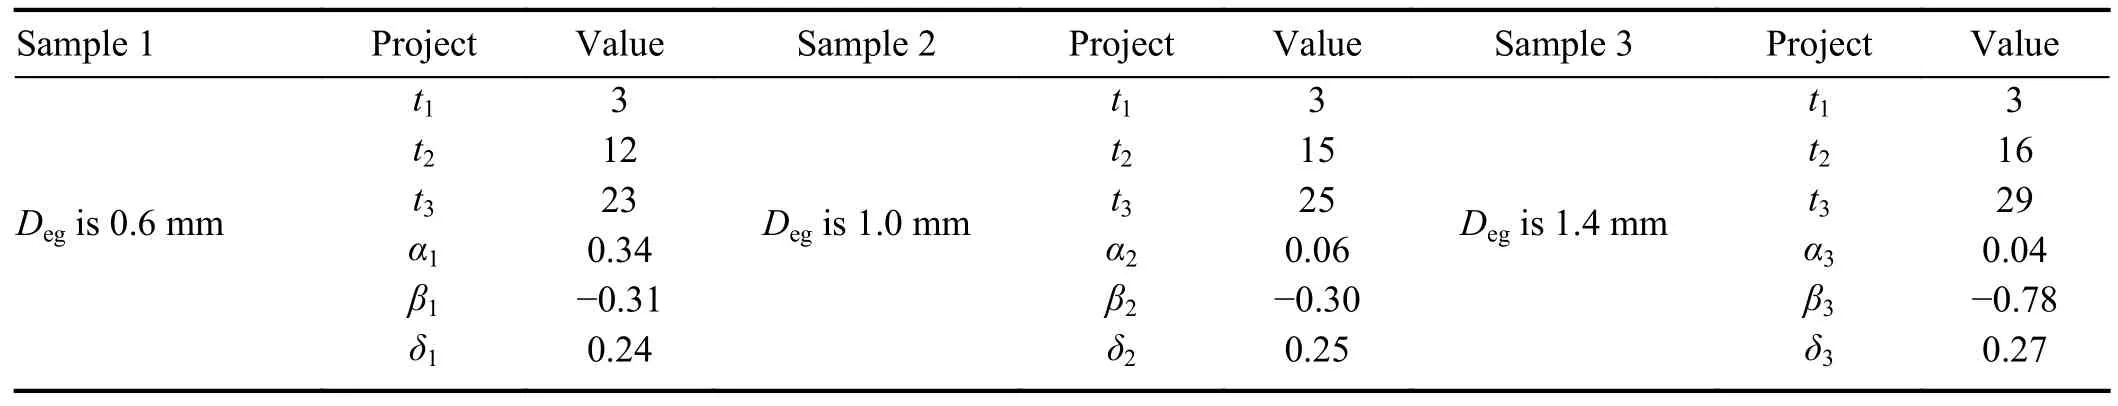
Table 2.Critical parameters for determining the discharge stage.
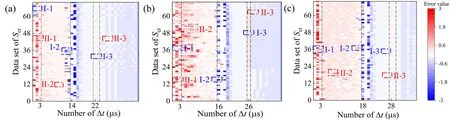
Figure 12.Results of the discharge stage identification method application.(a) Deg is 0.6 mm,(b) Deg is 1.0 mm,(c) Deg is 1.4 mm.
These two cases are further analyzed and discussed in the context of the discharge stage identification model developed in section 4.3.In the first step,the data characteristics of the moments before and after the characteristic step data point are analyzed against each other.In the second step,a time thresholdt1is introduced to determine whether the current moment is still less than the moment of abrupt change in theScr.In the third step,a conclusion is drawn with the basis for determining the phases described in section 4.3.Based on this determination process,an in-depth analysis of the two mutation values described above is carried out.
Secondly,theScrof the pre-breakdown discharge stageRmaafter 3μs should be greater than the threshold value ofRest,and the data values in this stage should be positive and colored red.The results show that the data points in thet1andt2time ranges fit primarily this profile.However,there are a few negative value points,such as boxes I-2 and II-2 in figure 12(a).The I-2 has a positive value at the previous moment and a negative value at the next moment.Those phenomena were analyzed based on the discharge stage identification model described in section 4.3.The results indicate that I-2 corresponds to the moment when the discharge enters the main discharge stage rather than noise interference;box II-2 has the same characteristics as I-2,and the corresponding moment is less than the discharge phase division thresholdt3,which is still in the pre-breakdown discharge stage.
Finally,the oscillatory discharge stage is identified similarly to the above study.The start and end moment of the stage was determined based on the characteristic thatScris greater thanδat the start,i.e.,the data points are colored red.The results show that the values aroundt3(i.e.,at 22μs and 23μs) were primarily positive.The main reason for this phenomenon is the random nature of the discharge,where discharge parameters under the same conditions have similar characteristics.However,the actual discharge environment also generates differences in the time domain.Likewise,the mechanistic analysis of the sudden change data in this time range was carried out in conjunction with the identification method described in section 4.3,and the results of the identification model determined that both I-3 and II-3 were oscillatory discharge stages.
The conclusions of the above-related studies were further analyzed and validated by introducing figures 12(b) and (c).The results show that the data change tendencies and the type of data points with the characteristic mutations are consistent with those in figure 12(a),where the mutation points can still be summarized as types I-and II-.Simultaneously,as the electrode gap increases,the chromaticity distribution of the data becomes more uniform.Even more intuitively,the boundary between each discharge stage is more distinct and smoother.The main reason for this phenomenon is that the ability of discharge decreases with the increase of the distance of electrode gap when the solution conductivity is a constant value,and the randomness of the discharge process decreases at this time,so the data is smoother.Therefore,the results of the above validation experiments show that the discharge stage identification model proposed in this paper is reliable and highly accurate.
After clarifying the method’s reliability,experiments were conducted to verify the effectiveness of the method proposed in this paper.TheDegset is 1.4 mm.The conductivity of the solution was 963.43μS/cm,1734.21μS/cm,4685.13μS/cm,respectively.The discharge voltage was 12 kV.Among them,the number of samples is 10.The measured voltage and current data were processed according to the theories and methods described in sections 2 and 3,and the mean square error ofScrat the onset of pre-breakdown,main,oscillatory discharge were solved and analyzed to highlight the universality and accuracy of the method,with the values of the relevant parameters shown in table 3.
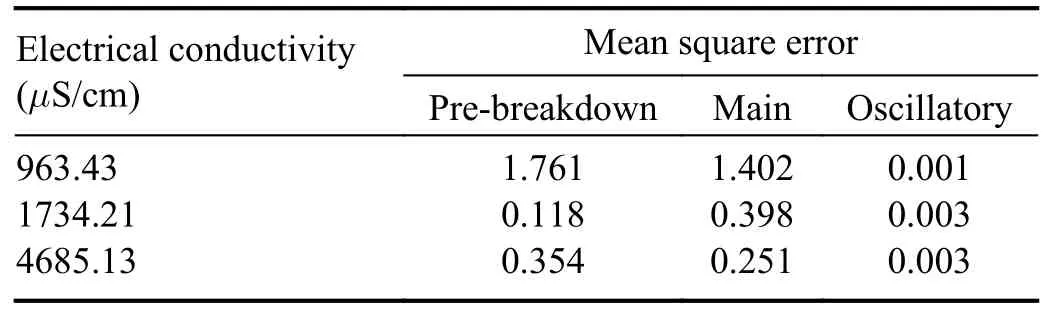
Table 3.Mean square error of Scr.
As seen from the resistance slope variance data in table 3,the minimum value is 0.001,and the maximum is 1.761.The data sets ofScrmentioned above are (-0.453,-0.411) and(8.077,11.195),respectively.The results show that the mean square difference ofScrat the beginning of each discharge stage is slight,so this method was used to determine the discharge stage accurately.
5.3. Results application case
Pulsed power applications based on underwater pulsed discharges to generate shock waves and ultraviolet light have received much attention.Existing research results show that the working process of underwater pulsed discharge is the main discharge stage,and the corresponding mechanism is described in section 2.Therefore,the basis for solving the total energy of main discharge stageEmais the accurate determination of the starting and ending moment of this discharge stage.TheEmais mainly used for the consumption of the equivalent resistance and the dynamic energy storage consumption of the equivalent inductor,and the energy calculation equation is [24,34]:
I(t) is the discharge current.Rme(t) is the measured resistance.L(t) is the identification inductance,which exists in the main discharge stage and the oscillatory discharge stage.The inductance varies with a term similar to resistance,so the inductance should be considered as a time-varying parameterRL(t).The parametric equation for the equivalent resistanceRL(t) is as follows:
Equation (15) can be converted to:
The experimental conditions of the underwater repetitive pulse discharge experiments are that aqueous solution conductivity is 2500μS/cm,electrode gap is 1.0 mm,and breakdown voltage is 16 kV.The one random complete discharge period data was utilized in the model to carry out the discharge stage division and the energy deposition solution.The relevant data and the solution process are depicted in figure 13.
Firstly,figure 13(a) displays the discharge voltage and current data collected by the continuous recorder.Secondly,the determination of discharge stages is performed based on the discharge stage identification model and relevant parameters.The time thresholdt1is 3μs,t2is 13μs,andt3is 23μs,respectively.These thresholds are derived fromScrchange characterization and depicted in figure 13(b).Subsequently,the study of resistance and inductance is conducted in conjunction with the model of section 2 to obtain the values of all parameter variables (i.e.,voltage,current,Rme(t),t2,t3) required for equations (15) and (16).Finally,the energy deposited in each stage is calculated by solving the energy equation (17) based on the above parameters.
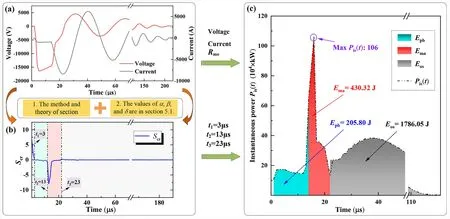
Figure 13.Analysis case of energy deposition based on the method for identifying the stages of underwater discharge.
The calculations show that the energyEmaof the main discharge stage is 430.32 J.The energyEosof oscillation stage energy is 1786.05 J,calculated by the subsequent current and voltage data.The energyEpbof the pre-breakdown discharge stage is 205.80 J.Meanwhile,the maximum instantaneous power of the underwater pulse discharge is 106×104kW and exists in the main discharge stage,as shown in figure 13(c).These findings demonstrate the significance of the proposed underwater impulse discharge stage identification based on resistance characteristics in both research and practical applications.
6.Conclusion
This paper proposes a method for identifying the underwater discharge stages based on impedance change characteristics.The method can be used to solve for the time delay and energy conversion efficiency of each discharge stage and provide theoretical support for improving the shock wave amplitude pressure and the energy consumption ratio of underwater pulse discharge equipment. It specifically includes the following four points:
(1) The stochastic phenomenon of arc formation during repeated discharges in water is explored based on the underwater pulse discharge experimental platform.The results show that the microbubbles generated by the discharge process are distributed between the electrode plates,which improves the inhomogeneity of the electric field between the electrode plates.
(2) The impedance change characteristics and mechanism of the discharge process are analyzed in detail based on the plasma theory.Meanwhile,the time-varying equivalent circuit model of the discharge underwater stripped of the arc inductance is established in stages.The STF algorithm filters and reduces the noise of the measured resistance output from the above model to obtain a universally applicable identification resistance.
(3) The sloping curve of theRestis analyzed using the rate change method,and the critical factorKand its value are proposed for determining theScrat the starting moment of each discharge stage.The validation experiments and error analysis results show that the method effectively determines the starting moment of each discharge stage.Meanwhile,the maximum mean square deviation ofScris 1.761,and the minimum is 0.001.
(4) Considering that the characteristics of gas discharge are more similar to those of underwater discharge and the actual application environment is variable,the universality of the method in different application scenarios should be further investigated and the robustness of the algorithm should be improved.
Acknowledgments
This research support is provided by the shale gas resource evaluation methods and exploration technology research project of the National Science and Technology Major Project of China (No.2016ZX05034),Graduate Innovative Engineering Funding Project of China University of Petroleum (East China) (No.YCX2021109).
猜你喜歡
小讀者(2021年2期)2021-03-29 05:03:48
考試與評(píng)價(jià)·高一版(2020年1期)2020-10-26 02:25:46
車迷(2020年7期)2020-08-10 06:41:00
作文成功之路·小學(xué)版(2020年4期)2020-06-16 03:38:32
小學(xué)生作文(中高年級(jí)適用)(2018年6期)2018-07-09 03:08:46
海外文摘·文學(xué)版(2018年2期)2018-02-21 09:15:01
東方劍(2017年7期)2017-11-14 08:26:03
作文通訊·高中版(2017年12期)2017-02-06 05:56:48
蘇州雜志(2016年6期)2016-02-28 16:32:18
金色年華(2016年8期)2016-02-28 01:40:29
 Plasma Science and Technology2024年4期
- Plasma Science and Technology的其它文章
- Experimental results of a magnetic field modification to the radio frequency driver of a negative ion source
- A fringe jump counting method for the phase measurement in the HCN laser interferometer on EAST and its FPGA-based implementation
- Simulation of liquid cone formation on the tip apex of indium field emission electric propulsion thrusters
- Performance of pulsed plasma thruster at low discharge energy
- Dynamic propagation velocity of a positive streamer in a 3 m air gap under lightning impulse voltage
- On the evolution and formation of discharge morphology in pulsed dielectric barrier discharge