
An extended social force model on unidirectional flow considering psychological and behavioral impacts of hazard source
2024-02-29 09:17:44KaifengDeng鄧凱豐MengLi李夢(mèng)XiangminHu胡祥敏andTaoChen陳濤
Chinese Physics B 2024年2期
Kaifeng Deng(鄧凱豐), Meng Li(李夢(mèng)), Xiangmin Hu(胡祥敏), and Tao Chen(陳濤),2,3,?
1Institute of Public Safety Research,Department of Engineering Physics,Tsinghua University,Beijing 100084,China
2Anhui Province Key Laboratory of Human Safety,Hefei 230601,China
3Beijing Key Laboratory of Comprehensive Emergency Response Science,Beijing 100084,China
Keywords: evacuation,social force model,hazard source,unidirectional pedestrian flow
1.Introduction
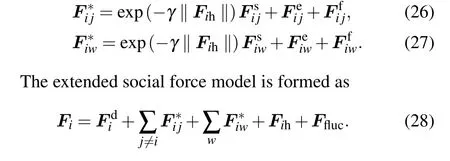
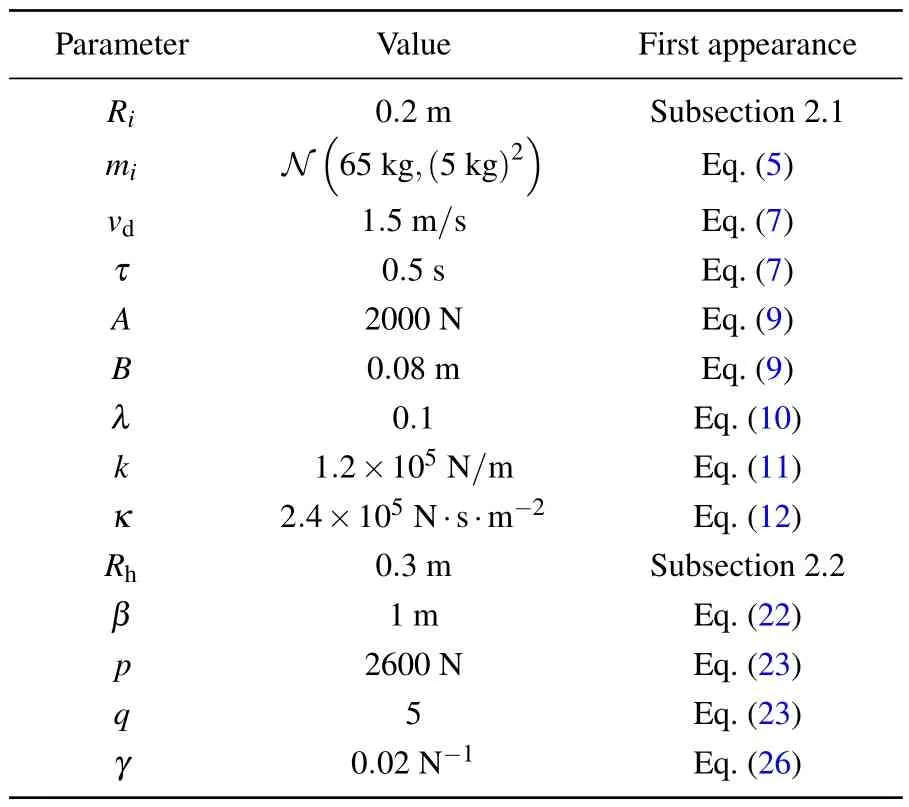
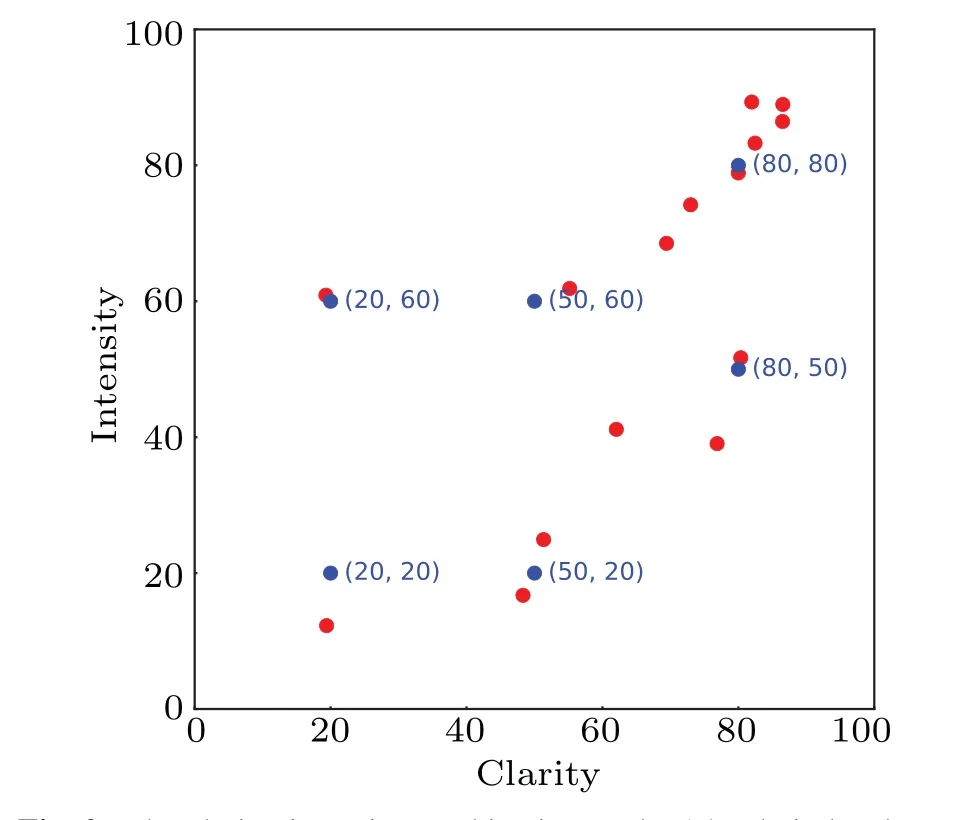
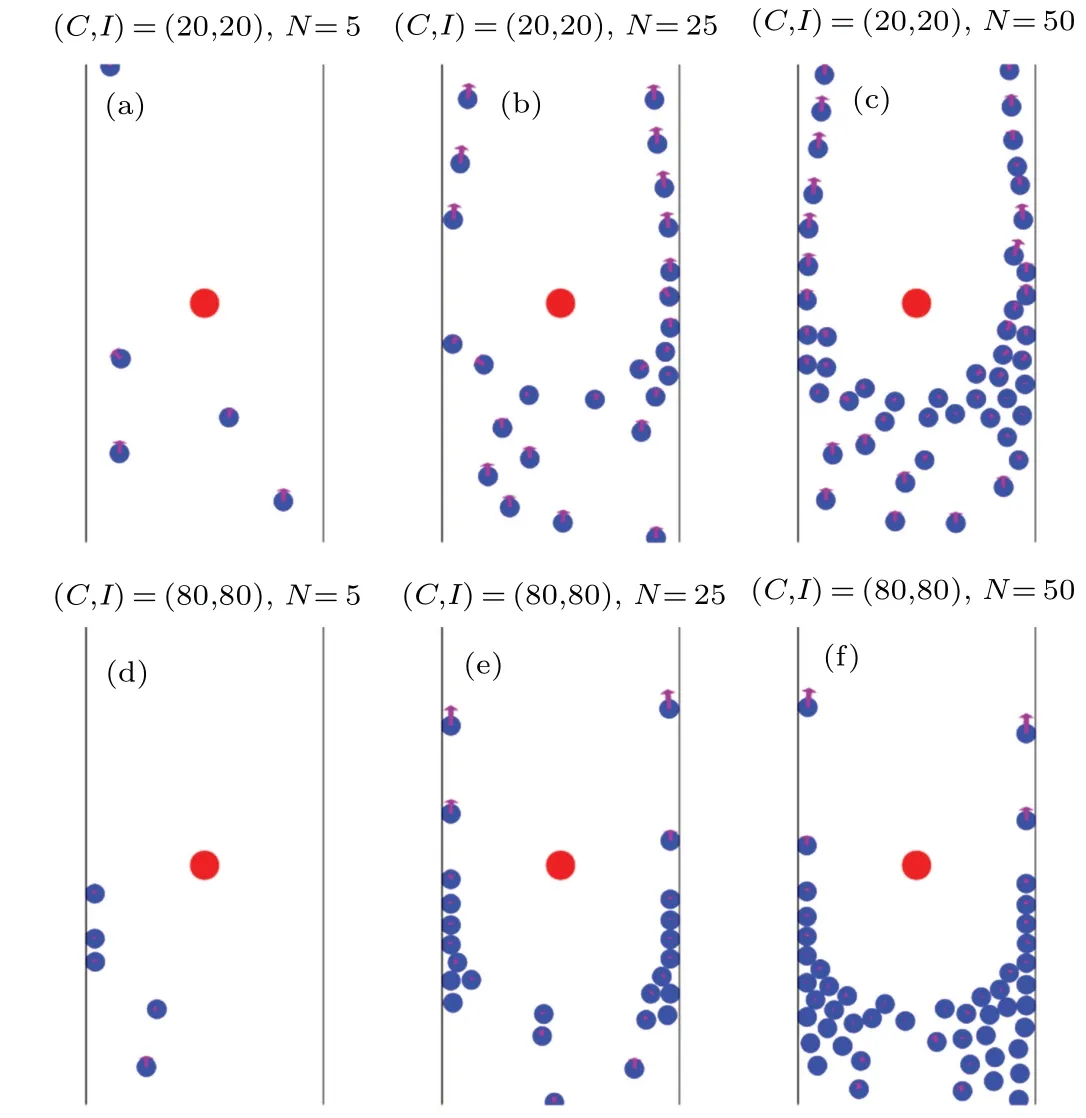
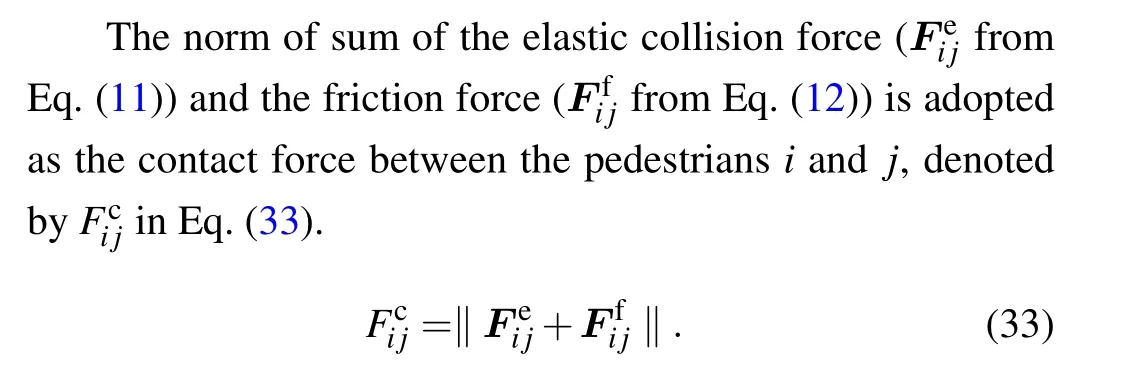
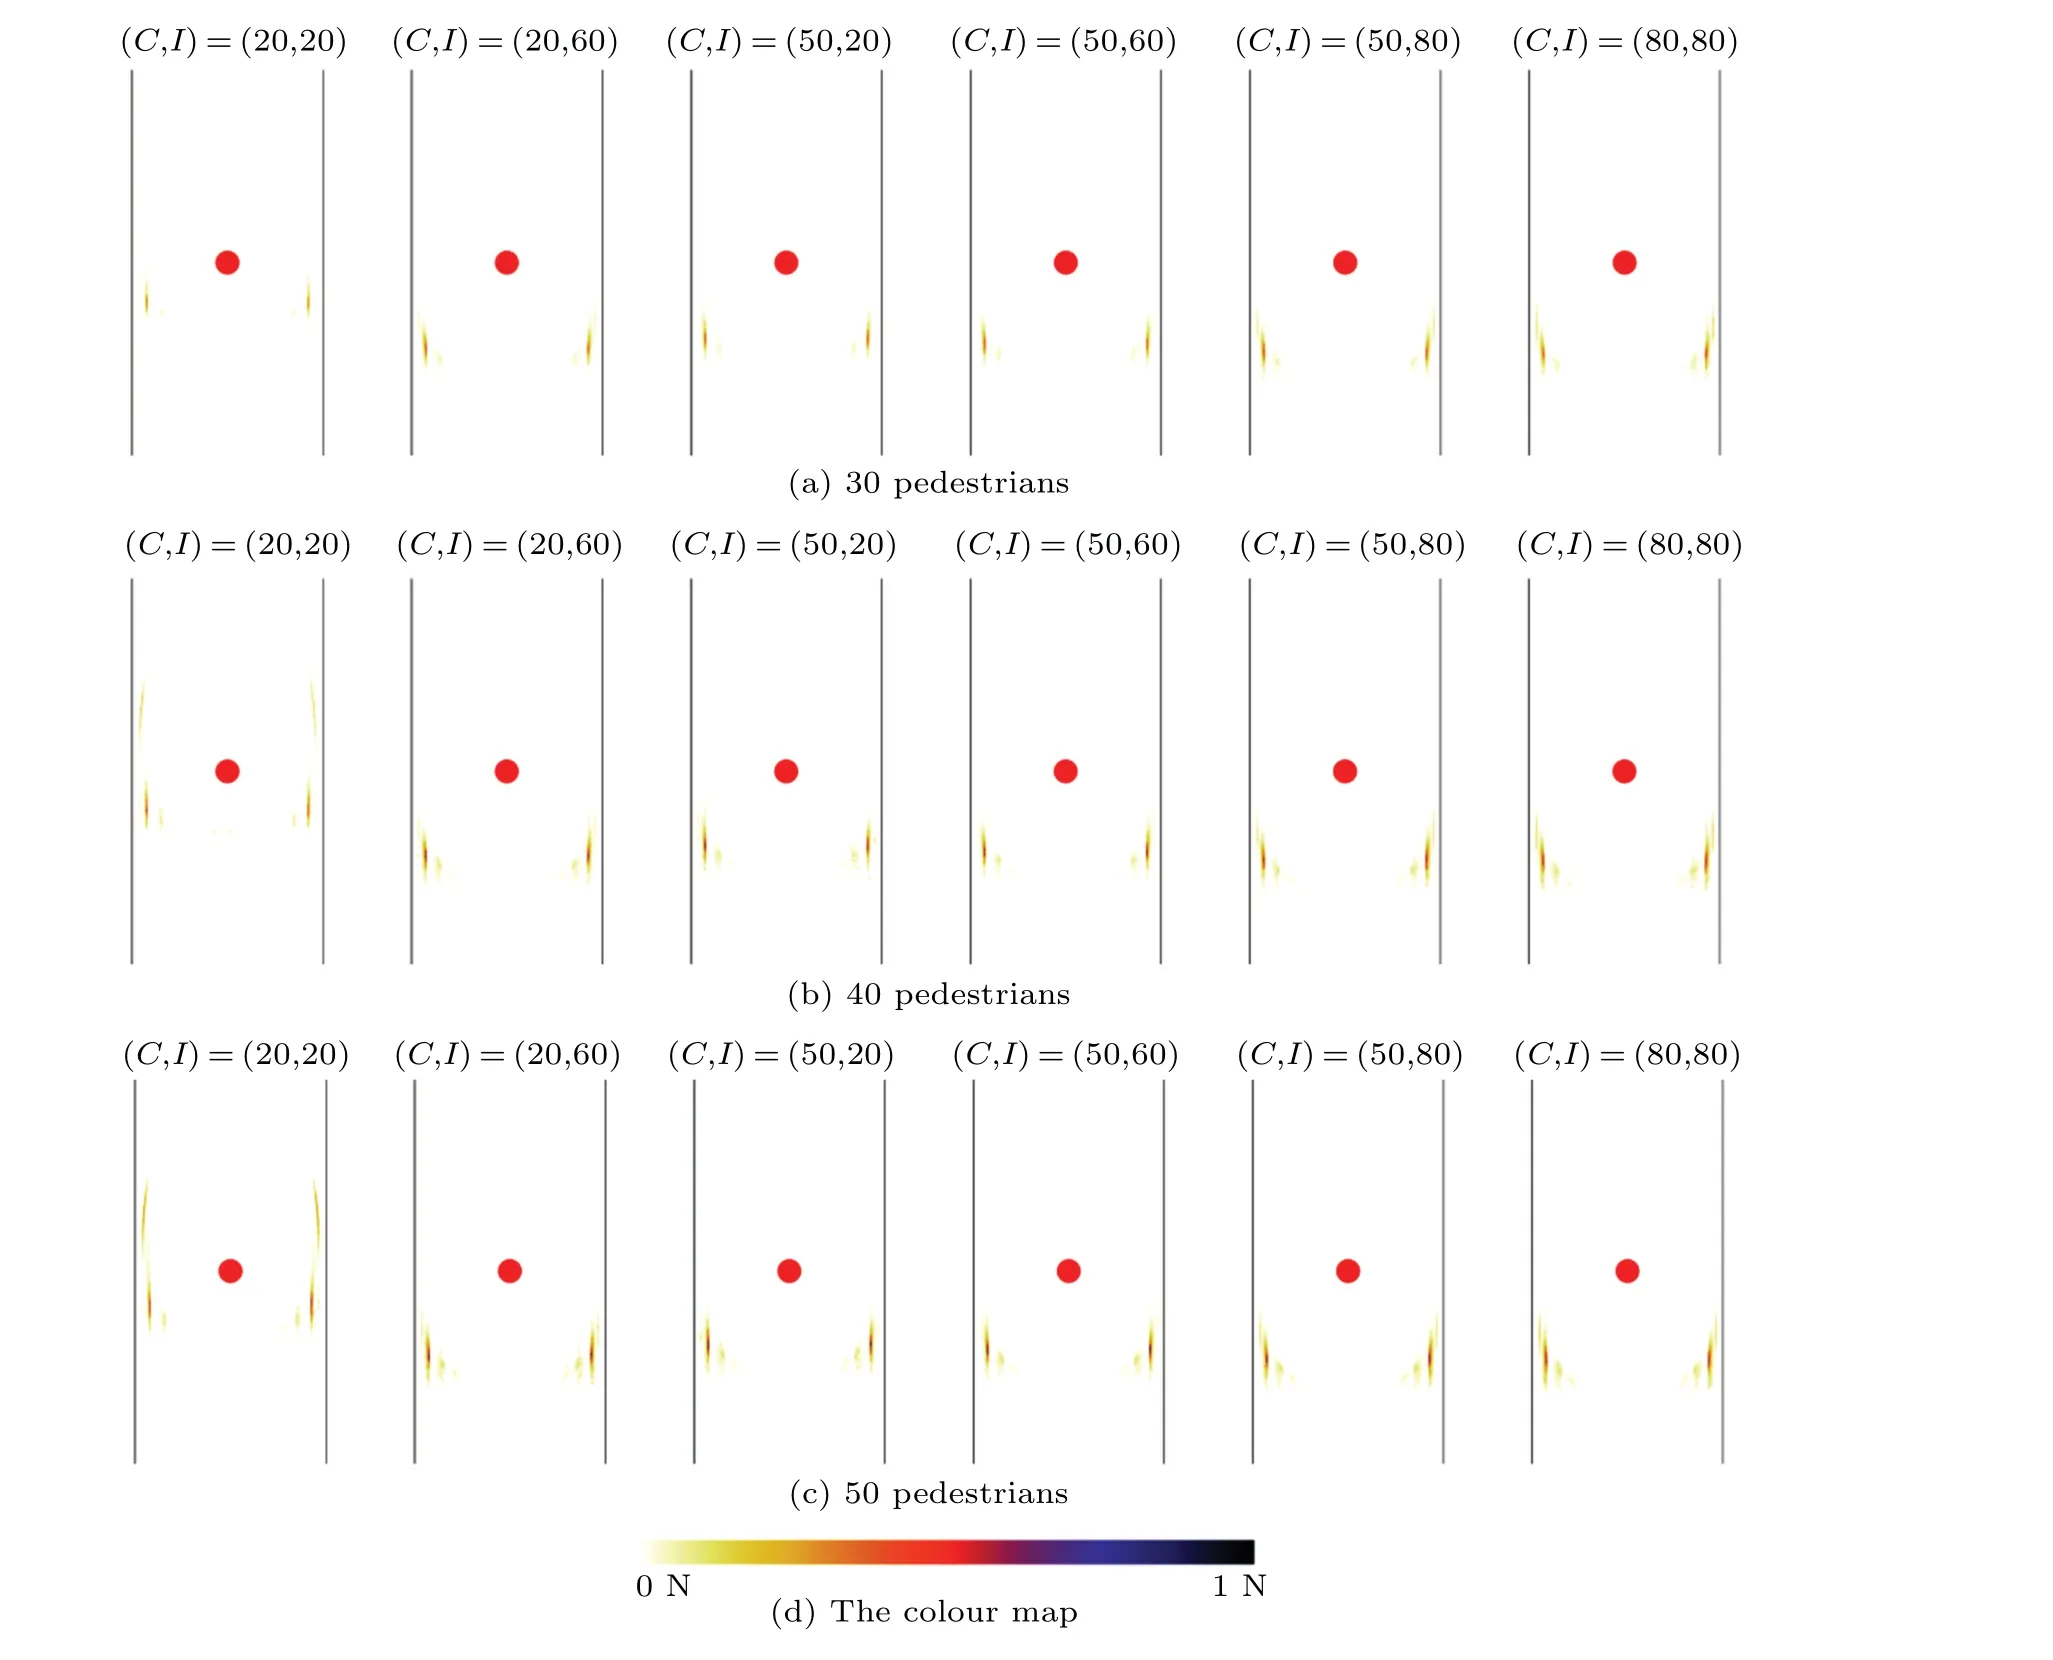
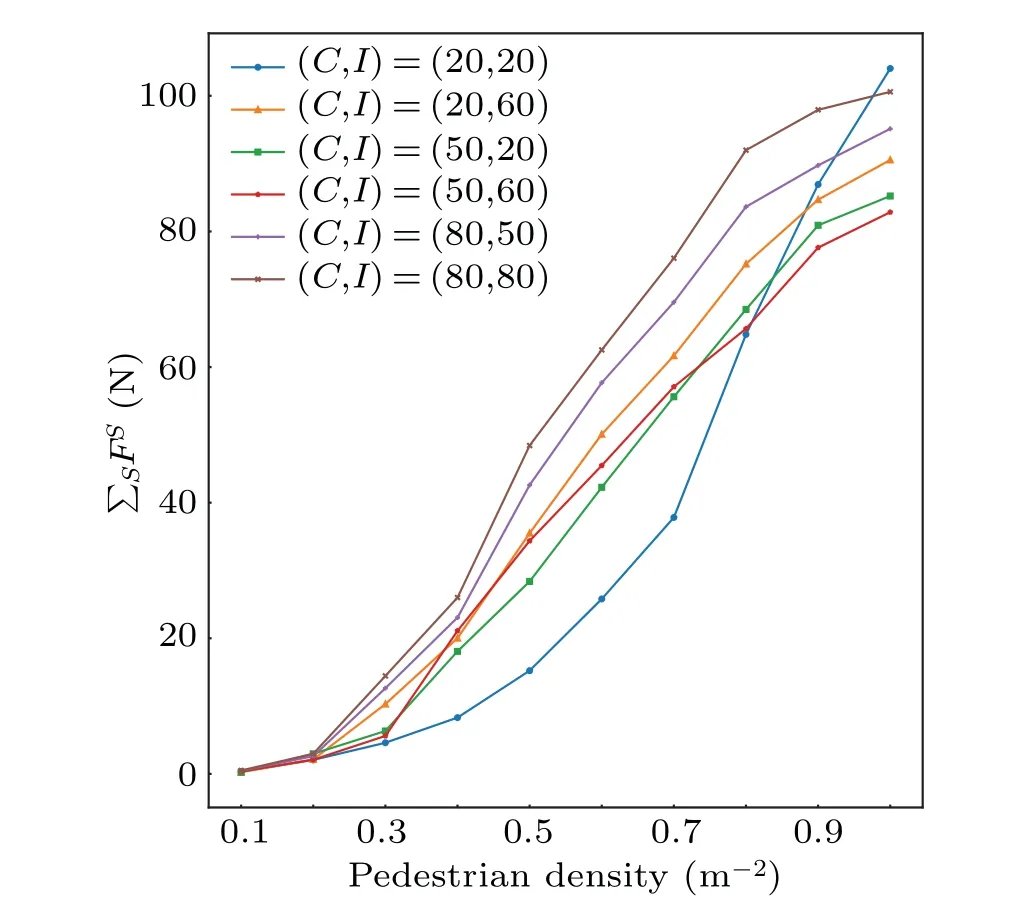
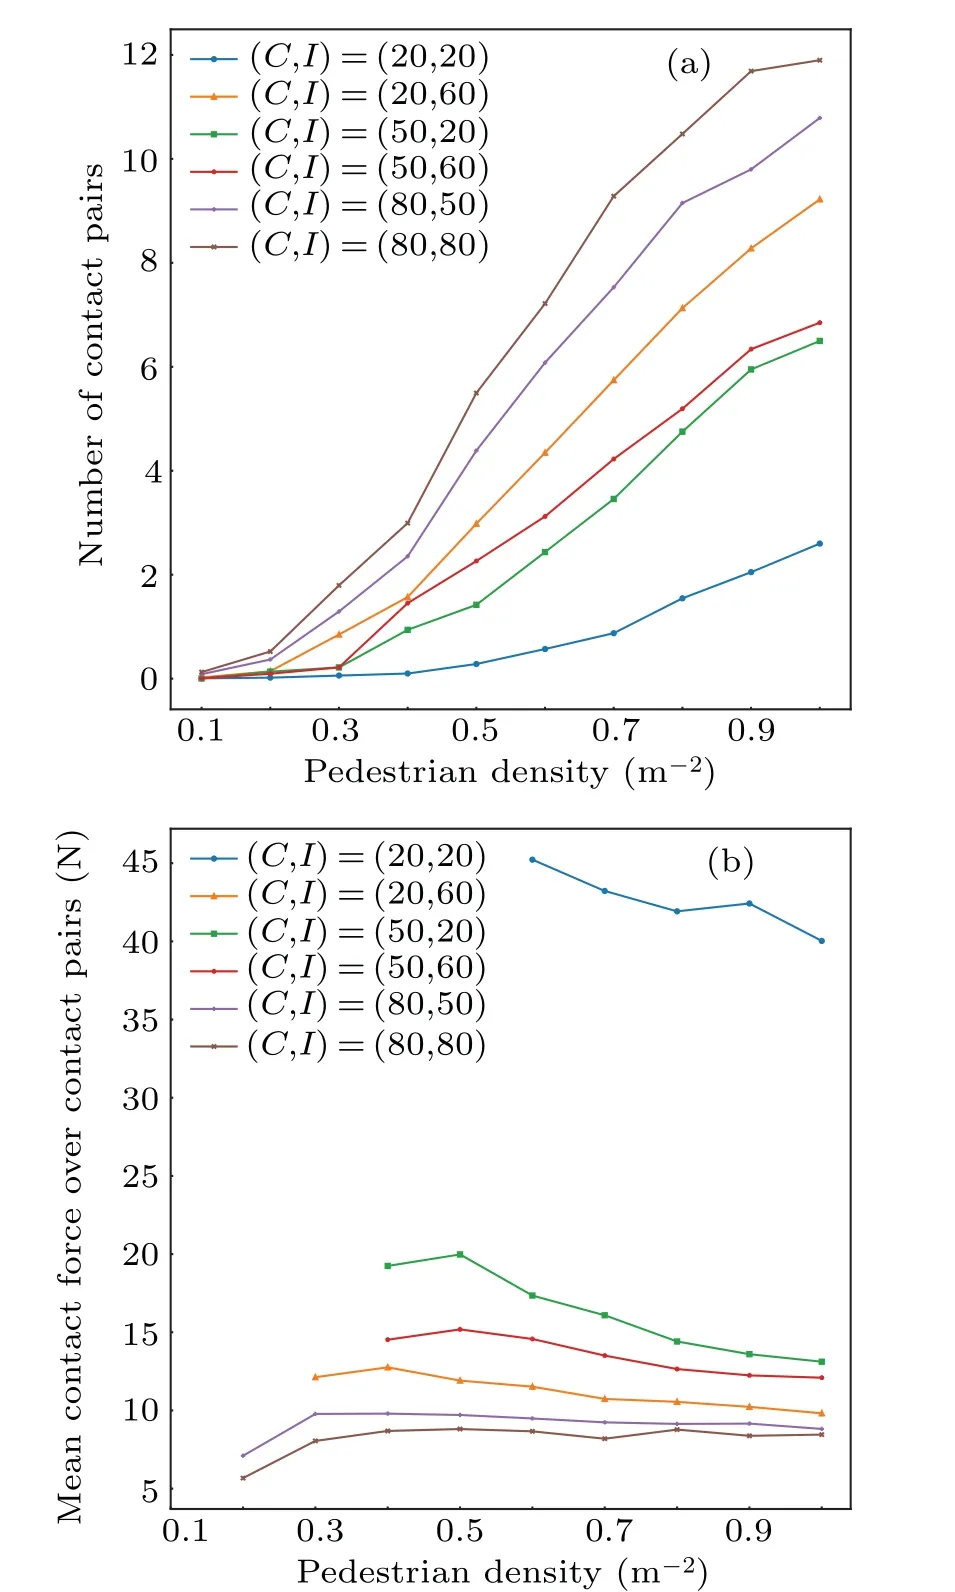
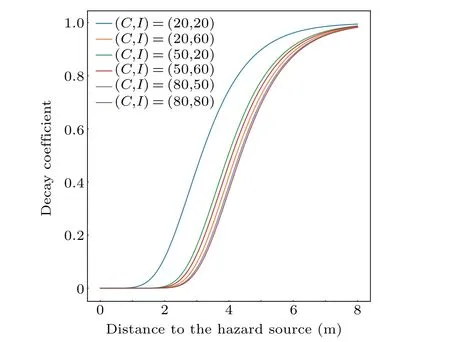
The required safe egress time (RSET) and the available safe egress time(ASET)are a commonly used pair of concepts that describe the conditions for evacuation.[1–3]RSET refers to the time duration from the start of an emergency event to a successful escape from a given space.The components of RSET are described in Eq.(1).ASET,in the meantime,refers to the time duration from the start of an emergency event until the time point when evacuation becomes impossible.An effective evacuation must satisfy the condition RSET wheretrecis the recognition of an emergency,tpreis the preparations for evacuation,tmovethe physical movement until a safe egress. There have been many researches dedicated to the assessment of RSET.The grid-based model[4]and the social force model[5]are the two mostly used models for the simulation of pedestrian dynamics.The grid-based model assumes one or more grid-based fields that determine the movement of agents over the discretised space.One of the most classical models of this type is the cellular automaton model.The social force model, inspired by Newton’s second lawF=ma, is composed of the self-driving force, the social force and the contact force on pedestrians within a continuous space, and solves the movement of pedestrians through differential equations.The classical social force model is explained in detail in Subsection 2.1.Since their introduction, these simulation models have been constantly modified and improved by the research community.These researches include focuses on the bottlenecks,[6]the stairways,[7]the rescuer,[8]the signs,[9]the direction and speed strategies,[10]the surrounding crowd,[11]the socio-cultural backgrounds,[12]etc.Yueet al.[13]used the cellular automaton approach and discovered that the pedestrians keep a certain spatial distance from the boundaries of walkway, that they prefer to choose a wider movement aisle in classroom,and that the evacuation time is dominated by the narrowest one of series-connected bottlenecks.Another simulation study from the same first author modelled a mixed exit selection strategy in a multi-exit scenario,and found that there is a critical density to distinguish whether a pedestrian jam occurs in the evacuation and whether an exit selection strategy is in effect.[14]Wuet al.[15]introduced a heuristic model based on the Voronoi diagram and successfully reproduced some typical phenomena.Jiaet al.[16]used the social force model approach and found that the evading and surpassing behavior increases the evacuation time, but that a circle-shaped obstacle induces a relatively higher bottleneck passing capacity. The unidirectional flow is a common evacuation scenario where pedestrians move in one direction through a given aisle,usually a corridor, a road or an alley.Many researches have been dedicated to the modelling of the unidirectional flow,such as the overtaking behavior,[17,18]the effects of visual hindrance,[19]the presence of trolleys,[20]the presence of disabled individuals,[21]etc.Furthermore, one-way control is commonly applied to extremely dense crowds,especially during special events.These crowds are prone to stampedes once the crowd stability is disrupted,e.g.,Shanghai 2014,[22]Mecca 2015,[23]Seoul 2022.[24]The study of unidirectional pedestrian flows is therefore of great significance. The psychological state of pedestrians is receiving elevated attention in evacuation studies,[25–30]and ultimately affects their behavioral patterns.Apart from the physical effects such as casualties,heat and/or the hindrance on visibility,the hazard source has an impact on the psychological state of the pedestrians.Instinctively, the pedestrians tend to keep a distance from the hazard source.This instinct to keep away from the hazard source closely influences the movement patterns,the speed and the trajectory,which further critically influencetmove.In the case of unidirectional flows, this involves the flow, or the number of pedestrians passing through per unit time.The unidirectional flow is usually linked with narrow spaces, such as corridors and alleys.Combined with the instinct to keep away from the hazard source, the pedestrians can be more aggressive in such scenarios to obtain a prioritised escape from the hazard source,hence the inter-pedestrian competition for space is a contributor to the crowd movement pattern.[31]Many previous studies investigated the behavioral features with the presence of hazards,including both case studies and experiments.For example, one study particularly analyzed the evacuation behaviors during a Shanghai high-rise building fire in 2010;[32]another study modelled the evacuation time through 9/11 investigations;[33]there have also been researchers combing through multiple fire cases to create databases and/or patterns of evacuation behaviors;[34,35]other studies tested the behavioral patterns in particular scenarios through experiments.[36,37] One of our separate articles used the brain activation level as a metric for the psychological dynamics of the pedestrians,and concluded (i) that the prefrontal cortex is more activated with higher clarity within lower ranges of intensity, and the opposite is applied within higher ranges of intensity,while the activation is elevated with higher intensity within all ranges of clarity,and(ii)that the left half is generally not less activated than the right half, and the difference peaks within medium ranges of intensity and a high clarity.[38]The mention of the psychological impacts in the title of this article refers to the nature of the investigated behavioral features that they are reflections of the pedestrians’ psychological dynamics when faced with hazard sources. Among these studies is an experiment[39]that tested the participants’responses in a virtual train station that contained a fire manifested in various sensory forms.Every sensory form was associated with a pair of clarity–intensity scores(ranging from 0 to 100)through a questionnaire,denoting how clearly the situation was presented to the participants,and how intense the hazard stimuli were.The clarity dimension represents the extent to which the pedestrians are able to understand the situation from the environmental cues of the hazard source,and the intensity dimension refers to the physical strength level which the pedestrians perceive.For example, a loud siren without explicit information on the hazard is high on intensity but low on clarity;a piece of plain text stating the explicit hazard situation is high on clarity but low on intensity.Figure 1 illustrates the clarity–intensity scores for every standalone and coupled sensory forms.The experiment recorded the pre-evacuation delay time and the speed elevation, and quadratically regressed them with clarity–intensity scores(denoted byCandI).Equations (2) and (3) are the respective results.Note that ?fdenotes the average stride frequency during the evacuation movement divided by the baseline stride frequency, used as a proxy for the speed elevation.These results were further integrated into the social force model,where a virtual repulsion force was assumed from the hazard source to simulate the pedestrians’ desire to keep away from it.[40]The model was validated with the experiment in single-user scenarios,and later tested in multi-pedestrian room evacuation scenarios, where the trajectory patterns and evacuation times were analysed. Fig.1.The clarity–intensity scores of the 15 stimuli from the previous experiment.[29]The data are plotted in magenta for stand-alone sensory forms,and blue for their pairwise combinations. However,the room evacuation bears differences from the unidirectional flow.For example,the exit of the room usually forms a bottleneck, which does not apply to aisles; the width of the aisle is usually more limited than the size of rooms,leaving less space to dodge the hazard source.This study aims to follow and improve the extended social force model from the previous simulation, and apply it to unidirectional pedestrian flows.The patterns of the flow and the physical contact forces are subsequently analysed,offering insights into the efficiency and the stampede risk, respectively.It should also be noted that previous studies on the hazard source usually focused on its influence on the pedestrians’ physical abilities and/or rational decisions,and often in a spreading form,[41–43]while this study focuses on the behavioral manifestation of their psychological first responses faced with, for simplicity,a non-spreading hazard source.Whereas some of the previous studies paid some attention to the pedestrians’behavioral feature to keep away from the hazard source,[44,45]this study also considers the aggressiveness, namely the concession on the territorial effect as well,which is an important component in spatially limited settings. This paper is a supplementary study to the previous one.[40]The referenced study focused on evacuation with hazard sources in wide spaces and used the room evacuation scenario as a typical setting;this study focuses on narrow spaces and uses the unidirectional flow with limited width as a typical setting.This study further considers the spatial competition with a more stimulated psychological level in narrow spaces.Both types of spaces are common structures in crowded places, and these two studies are supplementary to each other with the purpose of improving the evacuation model to a more accurate level. This model introduces a virtual repulsion force from the hazard source towards the pedestrians which depicts the pedestrians’desire to keep away from the hazard source.This repulsion force is quantitatively controlled by the clarity–intensity properties of the hazard source based on empirical data from a previous experiment, and reflects the risk level perceived by the pedestrians.This model further introduces a decay on the social force terms that represents the pedestrians’spatial aggressiveness with their stimulated psychological status, controlled by the amplitude of the virtual repulsion force from the hazard source(the perceived risk).When no hazard is present,the virtual repulsion force is taken as 0,and the decay coefficient on the social force terms is restored to 1 which means preserving the original values of the social force terms.The model is hence consistent with the classical social force model in this case. The classical social force model,for thei-th pedestrian,is composed of the driving forceFdi, the inter-pedestrian forceFij, the pedestrian-obstacle forceFiwand fluctuationFfluc(Eq.(4).Following Newton’s second lawF=ma, the resultant force on thei-th pedestrian,Fi,forms a differential equation set with his/her motion status, i.e., the position vectorriand the velocity vectorvi(Eqs.(5)and(6)).Riandmirefers to the spatial radius and mass of thei-th pedestrian,respectively. The driving force (Fdi) describes the pedestrian’s desire for a certain velocity.It is determined by a desired speed(vd),a desired directional unit vector(ei)and a characteristic adaptation time(τ)(Eq.(7)). The inter-pedestrian force(Fij)models the force applied to thei-th pedestrian from thej-th pedestrian,wherei ?=j.It consists of a social force term modelling the territorial effect,an elastic collision term in the normal direction and a friction term in the tangential direction(Eq.(8)).The territorial effect describes the pedestrians’intention to avoid physical collision with the crowd.The social force term is formulated as an exponential repulsion force in the normal direction, dependent on the inter-pedestrian distancedij=‖ri-rj‖-Ri-Rj,withAandBcontrolling the amplitude and range(Eq.(9)).Equation(10)is an angular weight function that describes the effect of the field of view.The elastic collision term (Eq.(11)) and the friction term(Eq.(12))are only present with physical contact, i.e.,dij<0.Both terms are proportional to the depth of physical contact.The friction term is additionally proportional to the tangential relative velocity.The unit normal and tangential vectors are denoted bynijandtij,respectively. The pedestrian-obstacle force(Fiw)models the force applied to thei-th pedestrian from an obstaclew,usually a wall.The formation ofFiwis equivalent to replacing thej-th pedestrian inFi jwith a virtual pedestrian with zero velocity and zero radius.This virtual pedestrian is positioned at the nearest point of the obstacle to thei-th pedestrian, denoted asrw.The pedestrian-obstacle distance accordingly changes todiw=‖ri-rw‖-Ri.The unit normal and tangential vectors are denoted byniwandtiw,respectively.Equations(16)–(19)describe the composition ofFiw. A non-spreading hazard source is assumed at a fixed positionrhwith radiusRh.The clarity and intensity properties are denoted byCandI,respectively.Following the notations from the previous studies,[39,40]CandIare dimensionless scalars ranging from 0 to 100. Following the extension to the social force model proposed by the previous simulation,[40]a virtual repulsion force in the normal direction is assumed on thei-th pedestrian from the hazard source.This virtual repulsion force is dependent on the distance between the hazard source and thei-th pedestrian (dih=‖ri-rh‖-Ri-Rh).Equation (22) shows the formation of this repulsion force withαandβcontrolling the amplitude and spatial range of the force,respectively. Based on the model from this previous simulation,[40]an aggressiveness mechanism is further supplemented to it that models the psychological impact of the hazard source on pedestrians towards the surrounding crowd.Another previous study proposed that the perceived environmental risk boosts the aggressiveness of pedestrians, and modelled it as the priority of resolving conflicts in a cellular automaton model.[31]Zhanget al.[46]concluded through an experiment that high stress levels of pedestrians lead to greater competitiveness.S?ahinet al.[47]discovered via an experiment that psychological factors, including stress and panic, contribute to the competitiveness of the pedestrians.Despite the terminological variations, the stimulated psychological state is reflected in this study as the virtual repulsion force from the hazard source,which, according the aforementioned literatures, elevates the competitiveness of the pedestrians.Several other studies used the extent of pedestrian pushes as the behavioral manifestation of competitiveness[48,49]and as such, in the case of the social force model,the competitiveness can be represented as a decay on the social force terms.The repulsion forces in this study,FsijandFsiw,are consistent with the repulsion forces in the classical social force model which represent the territorial effect,i.e.,collision avoidance.In the cases of high competitiveness,the pedestrians physically push one another,causing collisions.The perceived environmental risk is directly linked with the hazard source, for which the aforementioned repulsion force,Fih, is used as a quantitative indicator.An exponential decay, controlled by the value ofFih, is assumed on the social force terms,as listed in Eqs.(26)and(27). The values of some of the parameters are listed in Table 1. Table 1.Some of the simulation parameters. The desired direction for thei-th pedestrian,eiin Eq.(7),points upwards if not blocked by the hazard source; otherwise it points to the closest direction that bypasses the hazard source.The fluctuation term,Fflucin Eqs.(4) and (28),conforms to a uniform distribution on direction, with its amplitude conforming to a zero-centred normal distribution withσ=100 N.Namely, The evacuation scenario is set as a 5-m-wide unidirectional flow moving upwards within a length of 10 m.For every pedestrian leaving the simulation area through the upper boundary, a new pedestrian is generated at the lower boundary, maintaining the number of pedestrians in the simulation area at a fixed value.The hazard source is placed at the centre of the simulation area.60 parameter combinations are tested with,of which the compositions are listed below. (i)Number of pedestrians(10 choices): 5–50 in intervals of 5,or equivalently in terms of pedestrian density,0.1 m-2–1.0 m-2in intervals of 0.1 m-2. (ii) Clarity–intensity combinations (6 sets): see Fig.2,where the combinations (blue, inheriting a previous simulation) roughly cover the data range (red) from a previous experiment.The selection of clarity–intensity combinations is consistent with the previous work.[40] Fig.2.The clarity–intensity combinations.The 15 red circles denote the experiment data, while the 6 blue ones represent the combinations used in the simulations inheriting a previous research. The movement patterns stabilise around 10 s after the simulation starts.To ensure consistent patterns,the movement data is extracted between 20 s–70 s for analysis.The simulation is, for every parameter combination, repeated 50 times with different random seeds in order to alleviate fluctuation,making the total recording time to be 2500 s for every parameter combination.The flow and inter-pedestrian contact forces are subsequently analysed in Section 3. The flow is calculated by averaging the number of pedestrians over time that leave the simulation area through the upper boundary.Assuming that all pedestrians move at the desired speed,equation(32)displays the theoretical flow without the hazard source or any bottlenecks, whereWandρdenote the width and density of the crowd,respectively.The theoretical flow conforms to a linear relation with the crowd density,given fixed width and desired speed. Figure 3 shows the flow–density curves with regard to clarity–intensity combinations.The theoretical free flow from Eq.(32) is taken as the baseline.It is seen that higher clarity and intensity suppress the flow at all values of crowd density.The flow increases within low-to-medium density ranges,and stabilises within medium-to-high density ranges.The flow curve for low clarity and intensity((C,I)=(20,20)),although continuing to grow into high density ranges,goes into a clear flattening trend and would likely enter the stabilization phase with even higher densities. Figure 4 illustrates the snapshots of several cases with 2 sets of clarity–intensity combinations and 3 sets of pedestrian numbers, taken at 20 s of the simulation timeline.The hazard source generates virtual bottlenecks against the walls through the repulsion force defined by Eq.(22).Higher clarity and intensity are associated with stronger repulsion forces,tightening the virtual bottlenecks and further suppressing the flow.The virtual bottlenecks become saturated beyond a critical number of pedestrians,causing the flow to enter the stabilisation phase. Fig.4.Snapshots of the simulation with 2 sets of clarity–intensity combinations and 3 sets of pedestrian numbers.The length and direction of the magenta arrows represent the velocities. It should be noted that the flow-density curves in Fig.3 bear differences from typical fundamental diagrams, where there is a peak flow at a certain density, beyond which the flow enters a dropping phase.This difference could be attributed to the formations of the respective bottlenecks.In a typical fundamental diagram, the bottleneck is framed by hard boundaries which could be blocked by excessive congestion; in this study, however, the virtual repulsion force from the hazard source could in turn, unlike hard boundaries, be counteracted by congestion-caused collisions, which pushes the pedestrians through.This pushing force,however,neither further raises the flow with high densities,indicating a saturation being reached.These collisions, or inter-pedestrian contact forces,are further analysed in Subsection 3.2. The pedestrian-level collisions are categorised into 2 types with the first being collisions at the virtual bottlenecks,and the second being those at the sides of the hazard source.The first type is usually characterised with a cluster of pedestrians packed together with near-zero speed,among whom the social distances are virtually cancelled.The second type is characterised with usually two moving pedestrians passing the hazard source side by side with a lateral collision,but not necessarily with physical contact with the pedestrians in front or behind.An example of the first type can be seen in Fig.4(f),and the second type is observable in Fig.4(c). The temporal average force within an areaSis defined by dividing the accumulative impulse withinSover time.Equation (34) defines this concept asFS, wheret1= 20 s andt2=70 s represent the start and end of the analysed data stream as mentioned in Subsection 2.3.TakingSas 0.01 m×0.01 m grids,examples of the heat maps ofFSare illustrated in Fig.5. It is found from Fig.5 that the contact force is deposited mainly at the virtual bottlenecks,reflected in Fig.4.The contact force is also deposited at the sides of the hazard source in low clarity–intensity scenarios((C,I)=(20,20)).The hazard source,in these scenarios,generates relatively weak repulsion forces, making the pedestrians fail to form strict singlefile flows passing the hazard source.This results in lateral collisions, found in parts of Fig.4(c), to accumulate in this area, forming this specific pattern.It is also discovered that although higher densities generally accumulate larger impulse than lower densities do, the spatial distributions remain similar,given the clarity–intensity combination. Figure 6 shows the spatial sum of the contact force over the simulation area,namely ∑S FS.It is seen that the summed force is elevated with the density,and with the clarity–intensity scores in a general sense.There is, however, an exception with (C,I)=(20,20) where the summed force goes through a drastic lift within high density ranges and exceeds those with higher clarity–intensity scores.This phenomenon could be explained by the aforementioned lateral collisions in low clarity–intensity scenarios, shown in Fig.5.Although there are fewer collisions at the virtual bottlenecks in these scenarios,the lateral collisions at the sides of the hazard source contribute a considerable proportion to the summed force,which are absent with higher clarity–intensity scores.Within closer ranges from the hazard source, the desire to evade the hazard source exceeds the desire to gain positional advantages.With low clarity–intensity combinations, the desire to evade the hazard source does not prevail,hence the lateral collisions.The pedestrians are almost stationary at the virtual bottlenecks where they can be pushed from every direction.They move at stable speeds when passing the hazard source where the push comes from the lateral direction. Fig.5.Examples of the heat maps of the temporal average contact force FS under various parameter combinations,taking S as 0.01 m×0.01 m grids. Fig.6.The spatial sum of the contact force over pedestrian density,with regard to clarity–intensity combinations. Figure 7 illustrates the pedestrian-level collision patterns.The curves in Fig.7(a)describe the average number of pedestrian pairs with physical contact at any time point.This number is escalated with higher densities and clarity–intensity scores, which fits the general instinct.Figure 7(b) depicts the mean contact force over contact pairs, namely, figure 6 divided by Fig.7(a).The data points are excluded for contact pair<0.3, due to large fluctuations caused by near-zero divisors.The stabilisation trends of Fig.7(b) are consistent with those of Fig.3,indicating a connection between the flow and the mean contact force.It is however contrary to the general instinct that low clarity–intensity scores raise the mean contact force.The existence of the hazard source disrupts the pedestrian flow, but low clarity–intensity scores lack the ’deterrence’(namely a strong repulsion force)to force the pedestrians into an orderly and stable manner of movement.The consequent strong collisions may be responsible for the elevated mean contact force.This suggests that the stampede risk should be carefully considered when the hazard source is unclear,and even if it is relatively weak.Another contributor to this phenomenon is that high clarity–intensity scores expand the spatial range where pedestrians collide with each other,which results in an increased number of slight collisions at the outer rings of the virtual bottlenecks.This pattern could lower the average contact force over all contact pairs. Fig.7.The pedestrian level collision patterns.(a)The average number of pedestrian pairs with physical contact.(b) The mean contact force over contact pairs. This study models the psychological impacts of a nonspreading hazard source,with clarity and intensity properties,on the pedestrians within the social force model framework,and reveals the patterns of its influence on the unidirectional pedestrian flow.Inheriting the previous experiment[39]and simulation,[40]this study considers(i)a virtual repulsion force from the hazard source, constructed in an exponential form,that portrays the pedestrians’ desire to distance themselves from the hazard source, and (ii) the aggressiveness towards other pedestrians, modelled as a exponential decay of the social force term,controlled by the virtual repulsion force.Unidirectional pedestrian flows are subsequently simulated over pedestrian densities and the clarity–intensity combinations,and the patterns of the flow and the physical contact forces are analysed. Higher clarity and intensity suppress the flow at all values of crowd density,impeding the traffic efficiency.The flow increases within low-to-medium density ranges,and stabilises within medium-to-high density ranges.The rising phase is extended with low clarity and intensity before the stabilisation phase kicks in.The pedestrians are clogged at the virtual bottlenecks generated by the hazard source, explaining the patterns of the flow.The absence of hard boundaries of the virtual bottlenecks,however,could account for the absence of the dropping phase in flow–density fundamental diagrams,where the repulsion force from the hazard source could be counteracted by inter-pedestrian pushing forces.Although the maximum overall density stops at 1 m-2, the local density at the virtual bottlenecks goes much higher.On the other hand, the incoming pedestrians behind tend not to physically push forward,leaving some extent of social distance(see Fig.4).This implies that even if more pedestrians enter the simulation area,they would most likely wait in the rear area,which exerts very little influence on the traffic conditions at the virtual bottlenecks.Further investigation into the inter-pedestrian contact force reveals that it is indeed deposited mainly at the virtual bottlenecks.In the cases of low clarity–intensity scores, the contact force is also deposited at the sides of the hazard source by lateral collisions.The number of pedestrian pairs with physical contact rises with both density and clarity–intensity scores.The spatial sum of the contact force follows a similar trend except for low clarity and intensity, where the summed contact force goes into a sharp lift within high densities,contributed by the lateral collisions.The mean contact force per contact pair stabilises within the density ranges similar to the flow,indicating a connection between them.The mean contact force,contrary to the general instinct however,rises with low clarity–intensity scores, suggesting a less orderly and stable manner of movement, which thus requires careful considerations on the stampede risk. Fig.8.The decay term over the distance from the hazard source, with regard to clarity–intensity combinations. It is also noted from Fig.4 that the pedestrians are packed together at the virtual bottlenecks with physical collisions among one another with high clarity–intensity combinations,which boosts the local density.The local density is influenced by the social distances among the pedestrians, which is determined by the exponential decay on the social force terms.Figure 8 shows the decay term over the distance from the hazard source.At the half-width of the corridor (2.5 m), the decay term is significantly greater with (C,I) = (20,20) than with medium-to-high clarity–intensity combinations,denoting a larger portion of the social forces preserved.Under this circumstance,the local densities at the virtual bottlenecks and at the sides of the hazard source are lower,and a different collision pattern is displayed. However,some of the assumptions in this study still need to be validated or amended by extensive and meticulously designed experiments in the future, such as the exponential form of the aggressiveness caused by the hazard source.The psychological influences of spreading and/or moving hazard sources on the crowd should be investigated by future researches through extensive and solid experiments.The heterogeneity of the pedestrians is another aspect that needs to be covered with respect to their responses towards designated hazard sources.Placing the hazard source at the centre part of the corridor is an abstraction of scenarios where the hazard occupies a majority width of an evacuation route,blocking the evacuation crowd,which however may not be universal for all narrow-space scenarios, and future studies should investigate various distribution patterns of the hazard source and its impacts on the pedestrians. A non-spreading hazard source with clarity and intensity properties is integrated into the social force model.A virtual repulsion force from the hazard source and an exponential decay of the social force term are considered that are associated with the clarity–intensity scores.A unidirectional pedestrian flow is subsequently simulated over various pedestrian densities and clarity–intensity scores.It is revealed that the hazard source creates virtual bottlenecks that suppress the flow.The inter-pedestrian push, within medium-to-high densities,counteracts the virtual repulsion force from the hazard source,forming a stabilisation phase on the flow-density curve.It is also found that the pedestrians are prone to lateral collisions passing the hazard source in low clarity–intensity scenarios,which significantly lifts the total contact force within high density ranges.The mean contact force over contact pairs, however,rises with low clarity–intensity scores,suggesting a less orderly and stable manner of movement. In a practical sense, this study reveals that it could be helpful to cut off the hazard source from the crowd.This could avoid the virtual repulsion forces along with the virtual bottlenecks, and restore the flow to a more efficient level.While hazard sources with high clarity and intensity get the attention in most cases, those with low clarity–intensity scores should be carefully dealt with as well.Mandatory single-file controls may be helpful in these cases to alleviate the physical contact among the pedestrians,and hence the stampede risk. Acknowledgements Project supported by National Key Research and Development Program of China(Grant Nos.2022YFC3320800 and 2021YFC1523500)and the National Natural Science Foundation of China (Grant Nos.71971126, 71673163, 72304165,72204136,and 72104123).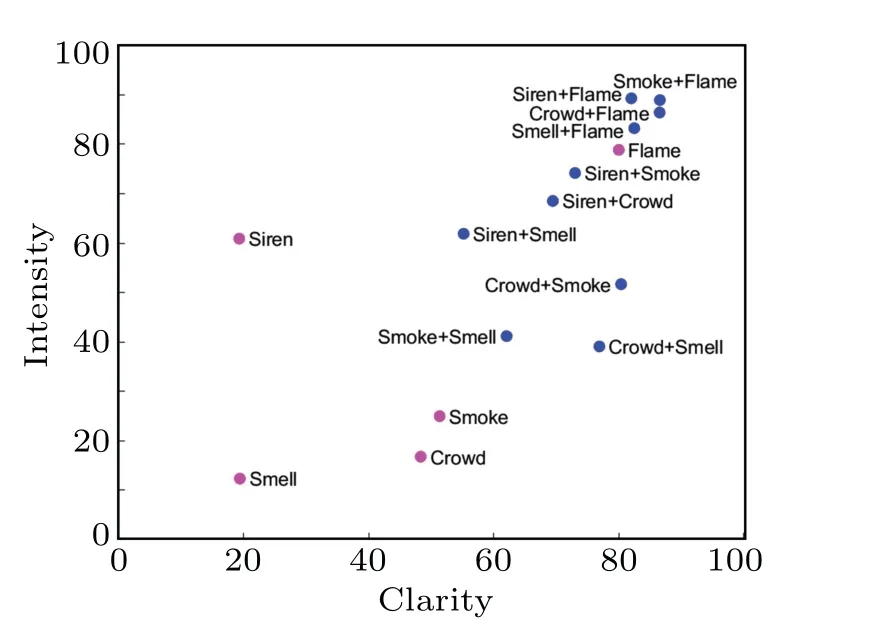
2.Methods
2.1.Classical social force model
2.2.The hazard source
2.3.Simulation settings
3.Results
3.1.Flow
3.2.Inter-pedestrian contact force
4.Discussion
5.Conclusion
猜你喜歡
美與時(shí)代·美術(shù)學(xué)刊(2024年4期)2024-05-25 16:16:36
青年文摘(2023年6期)2023-11-17 19:48:54
大眾文藝(2023年19期)2023-11-08 00:23:06
紅蜻蜓·低年級(jí)(2023年3期)2023-05-30 19:59:23
新體育(2023年3期)2023-05-05 04:34:08
瘋狂英語·新讀寫(2022年12期)2022-03-07 14:32:20
紅蜻蜓·低年級(jí)(2021年6期)2021-08-23 07:54:36
湖北理工學(xué)院學(xué)報(bào)(人文社會(huì)科學(xué)版)(2021年4期)2021-07-14 03:07:46
知音(月末版)(2020年8期)2020-08-25 10:03:17
校園英語·中旬(2020年4期)2020-07-14 08:26:43

- Chinese Physics B的其它文章
- Quantum synchronization with correlated baths
- Preparing highly entangled states of nanodiamond rotation and NV center spin
- Epidemic threshold influenced by non-pharmaceutical interventions in residential university environments
- Dynamical behavior of memristor-coupled heterogeneous discrete neural networks with synaptic crosstalk
- Dynamics and synchronization in a memristor-coupled discrete heterogeneous neuron network considering noise
- Spatial search weighting information contained in cell velocity distribution