
Investigation of phase modulation and propagation-route effect from unmatched large-scale structures for Doppler reflectometry measurement through 2D full-wave modeling
2023-11-19 13:32:28XiFENG馮喜AdiLIU劉阿娣ChuZHOU周楚XiaolanZOU鄒曉嵐GeZHUANG莊革ShouxinWANG王守信MingyuanWANG王明遠HaiqingLIU劉海慶WeixingDING丁衛(wèi)星ShoubiaoZHANG張壽彪MuquanWU吳木泉XiangZHU朱翔BaolongHAO郝保龍JinZHANG張津ZhaoyangLIU劉朝陽JiaxuJI季佳旭XiaomingZHONG仲小明
Plasma Science and Technology 2023年11期
Xi FENG (馮喜) ,Adi LIU (劉阿娣) ,Chu ZHOU (周楚) ,Xiaolan ZOU (鄒曉嵐) ,Ge ZHUANG (莊革) ,Shouxin WANG (王守信) ,Mingyuan WANG(王明遠),Haiqing LIU(劉海慶),Weixing DING(丁衛(wèi)星),Shoubiao ZHANG (張壽彪),Muquan WU (吳木泉),Xiang ZHU (朱翔),Baolong HAO (郝保龍),Jin ZHANG (張津),Zhaoyang LIU (劉朝陽),Jiaxu JI (季佳旭),Xiaoming ZHONG (仲小明),Shen LIU (劉深),Jinlin XIE (謝錦林),Xiaodong LIN (林曉東),Jianjun HUANG (黃建軍),Xiang GAO (高翔) and Yuanxi WAN (萬元熙)
1 College of Physics and Optoelectronic Engineering,Shenzhen University,Shenzhen 518060,People's Republic of China
2 Advanced Energy Research Center,Shenzhen University,Shenzhen 518060,People's Republic of China
3 School of Nuclear Science and Technology,University of Science and Technology of China,Hefei 230026,People's Republic of China
4 Institute for Magnetic Fusion Research,CEA,Saint-Paul-lez-Durance F-13115,France
5 Institute of Plasma Physics,Chinese Academy of Sciences,Hefei 230031,People's Republic of China
6 Hebei Key Laboratory of Compact Fusion,Langfang 065001,People's Republic of China
7 ENN Science and Technology Development Co.Ltd.,Langfang 065001,People's Republic of China
Abstract To interpret the common symmetric peaks caused by the large-scale structure in the complex S(f) spectrum from the heterodyne Doppler reflectometry (DR) measurement in EAST,a 2D circular-shaped O-mode full-wave model based on the finite-difference time-domain method is built.The scattering characteristics and the influences on the DR signal from various scales are investigated.When the structure is located around the cutoff layer,a moving radial or poloidal large-scale structure kθ?kθ,match(kθ,match is the theoretic wavenumber of Bragg scattering)could both generate an oscillation phase term called‘phase modulation’,and symmetrical peaks in the complex S(f)spectrum.It was found that the image-rejection ratio A-1/A+1(A±1 represents the amplitudes of±1 order modulation peaks) could be a feasible indicator for experiment comparison.In the case when the structure is near the cutoff layer with the same arrangement as the experiment for the edge DR channel,the curve of A-1/A+1 versus kθ can be divided into three regions,weak asymmetrical range with kθ/k0?0.15 (k0 is the vacuum wavenumber),harmonics range with 0.15 ?kθ/k0?0.4,and Bragg scattering range of 0.4 ?kθ/k0 ?0.7.In the case when the structure is located away from the cutoff layer,the final complex S(f)spectrum is the simple superimposing of modulation and Bragg scattering,and the modulation peaks have an amplitude response nearly proportional to the local density fluctuation,called the ‘propagationroute effect’.Under the H-mode experiment arrangement for the core DR,a critical fluctuation amplitude Amp (ne,Mod.@route)/A mp (ne,Tur.@MSA~1.3-4.1 (Amp (ne,Mod.@route) refers to the pedestal large-scale structure amplitude and Amp(ne,Tur.@MSA) refers to turbulence amplitude at the main scattering area)is needed for the structure in the pedestal to be observed by the core DR measurement.The simulations are well consistent with the experimental results.These effects need to be carefully considered during the DR signal analyses as the injecting beam passes through the plasma region with large-scale structures.
Keywords: Doppler reflectometry,full-wave simulation,propagation-route effect
1.Introduction
As a widely used microwave diagnostic,the heterodyne Doppler reflectometry(DR)[1-6]has been applied in various magnetic confinement fusion devices to provide the density fluctuationand perpendicular velocity fluctuationaround the cutoff layer with high spatial and wavenumber resolutions.The microwave beam for DR is launched at an oblique angle to the cutoff layer in plasma,and the signal received containing the information on the turbulence at the turning point (slightly ahead of the theoretic cutoff layer) is from the Bragg backscattering.For the Bragg condition,the measured wavenumber of the backscattering signal is k⊥=-2ki,where k⊥is the perpendicular density fluctuation wavenumber and kiis the incidence wavenumber at the scattering location.From the oblique launching of the probing beam to the cutoff layer,a Doppler shift from the poloidal movement of Bragg scattering turbulence is obtained as.Moreover,with the assumption that the u⊥is dominated by theE×Bvelocity,the radial electric field Ercan be figured out as Er=u⊥B.
Besides the Bragg scattering components,the DR could also receive information from unmatched large-scale instabilities through modulating the cutoff layer,which is featured by symmetric doublet on the complex S(f)spectrum and has been referred to as ‘phase modulation’ in previous publications[1,7-9].Since the core W-band DR system[10]was successfully installed for core turbulence measurement in EAST in 2018,some pedestal large-scale fluctuations have frequently been observed by the core measurements,including the inter-ELM high-frequency (~230 kHz) electromagnetic mode[11,12]and the H-mode edge coherent mode(ECM) [13-15].A typical observation of the ECM by the core measurement is shown in figure 1,which features symmetrical peaks (with high-order harmonics) around 0 at the edge ρ=0.98 measurement by the 8-channel X-mode polarization V-band (50-75 GHz) Doppler reflectometry [5],and only a -1 order modulation peak (not Doppler peak) in the core ρ=0.21 by the 5-channel X-mode polarization W-band(75-110 GHz)Doppler reflectometry[10].The ECM is investigated driven at the pedestal region [14,16,17].Based on the Bout++simulation[18],the ECM is not likely to propagate to ρ=0.2.Considering that the microwave scattering occurs at the whole microwave propagation route[19,20],which is always ignored,a reasonable interpretation is that the‘phase modulation’occurs at the whole microwave propagation route,and the ECM measurement in the core DR channel is a result of the ‘phase modulation’ effect from the pedestal region.Previously,da Silva [21],Happel [22],and Wang[23]et al studied the velocity shear layer effect for DR diagnosis,and explained the frequently observed double-peak phenomenon in the complex S(f) spectra with multi-radial scattering layer contributions.The velocity shear layer effect is essentially due to the finite radial scattering volume.Thus,it could be conjectured that scattering components from the beam propagation route away from the main scattering area(MSA)could be also observed under some conditions,which is important for understanding the reflectometry data from the core plasmas.
In this paper,we focus on how the large-scale (nonresonant) fluctuation away from the cutoff layer affects the DR data under different experimental arrangements,which has always been ignored by previous analytical theories [7,24-29].A two-dimensional circular-shaped full-wave model with ordinary mode polarization based on the finite-difference time-domain(FDTD)method[20,30-33]and the heterodyne method has been built,and it should be emphasized that the linear/nonlinear scattering issue is beyond the scope of this paper [28,34-36] because a low-density fluctuation amplitude was used to ensure the linear response of scattering wave power to density fluctuation amplitude in the simulation.Moreover,although some other effects,such as the radial distribution/shape [7] of the perturbation,cutoff layer curvature [27],multiple scattering [35],the launching/receiving antenna arrangement,beam broadening,and so on,could be simulated in our model,as they are recognized as secondary factors on the scattering spectrum and would be addressed elsewhere.
The simulation results clearly show how the scattering from the beam propagation route contributes to the DR signal received and would be helpful for experimental physicists to understand turbulence.The remainder of this paper is organized as follows.The 2D full-wave model including the parameters is presented in detail in section 2.In section 3.1,a comparison between the large-scale ‘phase modulation’ and Bragg scattering is presented,and the first study of the phase modulation image-rejection ratio is carried out in section 3.2.Essentially,the scattering from the propagation route and a modified model with a steep density pedestal similar to the H-mode core turbulence measurement are studied in sections 3.3 and 3.4.Finally,a summary is given in section 4.
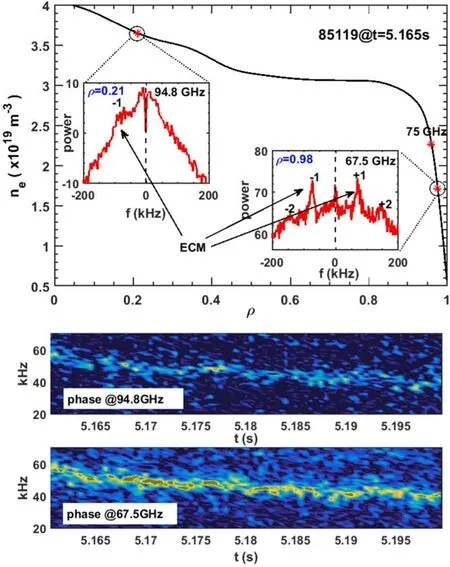
Figure 1. The ECM simultaneously observed in edge and core Doppler reflectometry in EAST.
2.2D full-wave code
To simulate the microwave propagation in tokamak plasma,a rectangular three-dimensional coordinate system with the z direction along the magnetic line,x along the major radius,and y along the direction perpendicular to the magnetic line,is established,and the microwave polarization is simplified as O-mode.Under cold plasma conditions,the Maxwell equations for the O-mode polarization microwave can be simplified as
Combined with the equation for the current density Jz,
in rectangular coordinate (x,y,z).In this work,a fixed turbulence wavenumber amplitude spectrum is applied rather than a random one[36,39]produced by the turbulence code.A typical simulation result is shown in figure 2(b),a maximum Ezamplitude appears at near ρ~0.885,and the position is recognized as the main scattering area of the 50 GHz microwave,which is actually determined by turning points of the 50 GHz Gaussian beam,consistent with Pinzón's report [40].Moreover,the fluctuation is set as radially localized with a width of 0.02 normalized radius (~0.9 cm,more simulations show that only the peak amplitude changes during scanning the radial width) for the following propagation-route effect investigation,which is not too large to mix the scattering signals from different radial locations.Notably,the O-mode DR is limited in the core turbulence measurement due to the flat density profile at the core and strong beam broadening from the density pedestal as simulated later in section 3.4.Considering the purpose of fundamental scattering process investigation,the elementary density fluctuation with kr=kθ=k is applied,and the total density is given as
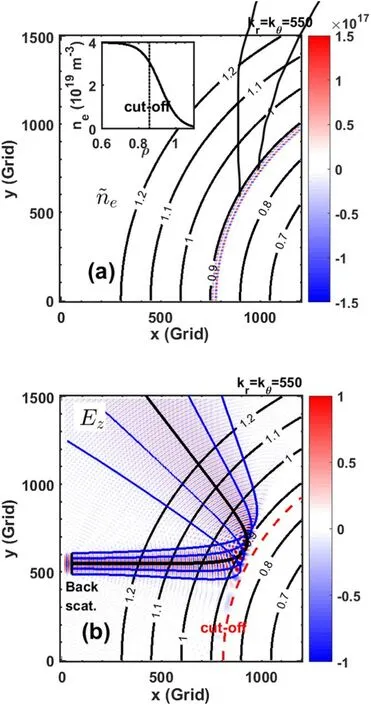
Figure 2. The left panel illustrates the new density fluctuation element combining the kxx+kyy and kxx-kyy components and the default density profile.The right panel illustrates the typical microwave electric field distribution calculated with the 2D fullwave code and the beam trajectories in black and blue lines from the ray-tracing calculation.
in cylindrical coordinate(r,θ,φ),where Lθis the displacement to the midplane y=0 along the poloidal direction for each grid point,ρsis the radial location of the default density fluctuation,k=550 m-1is the Bragg scattering wavenumber calculated from the wavenumber response analyses,Vθ=0.1c (widely used in full-wave simulation [20,21] to reduce computation time,and confirmed to be a secondary factor to the scattering spectrum from 0.01c-0.3c and no influence on the effects reported in this paper) is the poloidal rotation speed for the default density fluctuation,and φnoise(t)is randomly generated phase noise between 0 and 2π.It should be emphasized that the phase noise amplitude has a strong influence on the background level of complex S(f) power spectrum,while it has little influence on the amplitude of Bragg scattering and phase modulation peaks.Thus,to avoid the weak phase modulation concealed from the background noise,the phase noise is removed from the large-scale phase modulation cases(corresponding to the coherent modes)in sections 3.3 and 3.4.As for the fluctuation amplitude A,to be close to the core turbulence measurement,where the turbulence amplitude δn/n <1%-2%in the linear response stage is widely accepted to be weaker than the edge plasma[41],the fluctuation amplitude is usually set to be <0.05 in the linear scattering-power-to--amplitude stage.Finally,a perfectly matched layer (PML)[42]with a width of 12 grid points(equal to 3.6 mm)is applied at the simulated area edge.Notably,the heterodyne method is applied through a mixer calculation
where f0=50 GHz is the launching frequency of the DR,A is the received signal with a carried wave frequency f0,and B=imag(hilbert(A)) is the imaginary part of the Hilbert transform to the received signal A.
To check the validity of the code,a typical microwave electric field Ezresult under kr=kθ=550 m-1,V=0.1c,peak-peak δne/ne=0.044 is shown in figure 2(b),consistent with the ray-tracing calculations in black (center beamline)and blue (margin beamlines).
3.Numerical results
3.1.Phase modulation and Bragg scattering
Firstly,the so-called phase modulation phenomena[1,7,8,12]were investigated in detail.It is widely accepted that besides the backscattering signal mainly from the scattering volume around the cutoff layer,the cutoff layer modulation,such as a large magnetic island from tearing instability,would produce two peaks symmetrical to zero frequency [1,8,12] and sometimes distinct amplitude asymmetry in the complex S(f)spectrum.However,in spite of similar experimental results through DR measurement on different devices being reported,numerical investigation of phase modulation is much less.
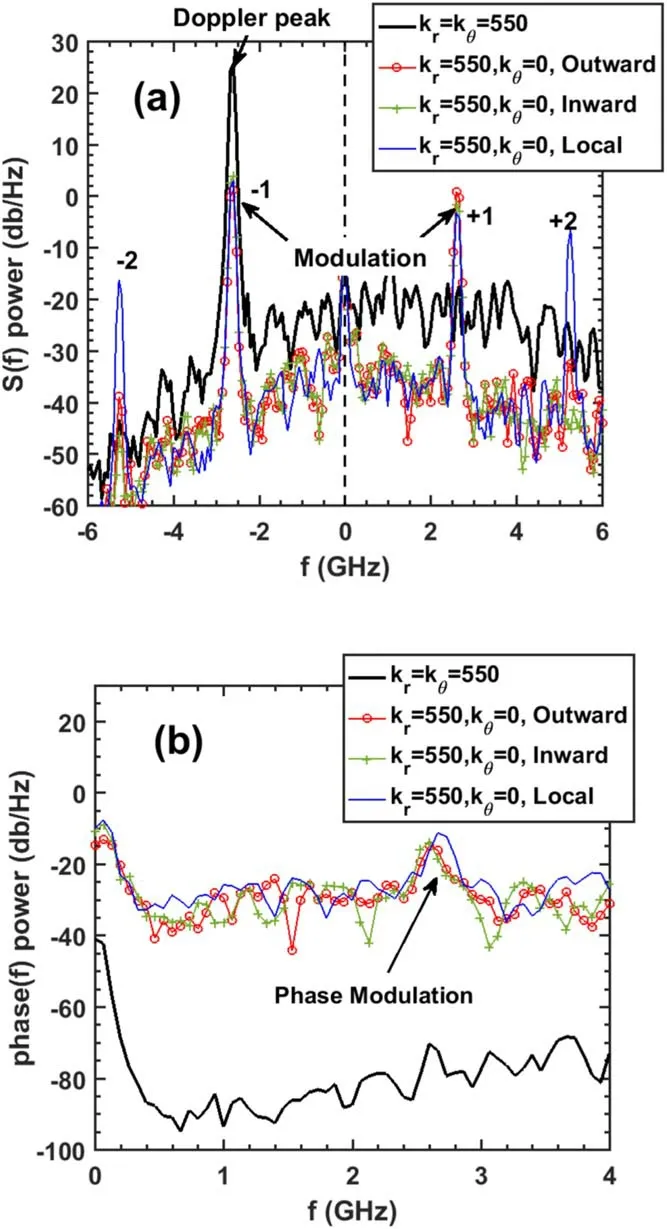
Figure 3.Comparison between the matched Bragg scattering(black)and unmatched poloidal large-scale structure (radial outward modulation (red),radial inward modulation (green),and local sinusoidal oscillation modulation (blue)).(a) denotes the complex S(f) spectra,and (b) denotes the phase(f) spectra.
With the same fluctuation intensity peak-peak δne/ne=0.44% in the linear response stage,the four fluctuation spectra shown in figure 3(a) clearly show that the Bragg scattering in black has only one Doppler peak at -2.63 GHz with an image peak rejection beyond 40 dB.It should be noted that although further decreasing the phase noise amplitude could also manifest the image peak at f=+2.6 GHz,the 40 dB difference is unchanged.While for the other three cases without poloidal rotation,the symmetric peaks are distinct,and the modulation peak amplitude is about 20 dB less than the Bragg scattering.Moreover,the spectra of inward propagation,outward propagation,and local oscillation are nearly the same,with little asymmetry on the peak amplitudes <5 dB,further suggesting that these symmetric peaks are caused by phase modulation.Especially high-order harmonics have also been observed in the local oscillation case under the same density fluctuation intensity.
The high-order harmonics shown in figure 1 and reported in HL-2A[8]can be easily understood through the following mathematical formula:
where Jn(β)is the Bessel function.β could be regarded as the intensity of phase modulation,and Jn(β) obviously determines the intensity of the n-order harmonics in the spectrum.Normally,β is small and only n=±1 could be seen in the real turbulence spectrum.
Experimentally,phase spectrum from the DR is also widely used.The typical case is the geodesic acoustic mode(GAM) measurement through DR [43-45],where the phase oscillation is actually the poloidal velocity oscillation caused by the radial electric field of the GAM.It should be mentioned that the poloidal speed Vθis always constant here,and all peaks that appear in the phase(f)spectrum could be called the ‘phase modulation’.For a coherent mode in the plasmas,it is entirely possible to have both electric field fluctuations and ‘phase modulation’ simultaneously.
The phase(f) spectra are shown in figure 3(b) with a noise amplitude of 0.1.For the Bragg scattering case,no distinct peaks could be found in the phase(f)spectrum(black line),which is completely reasonable because the poloidal rotation velocity Vθis a fixed value (kθVθ/2π=2.63 GHz).For the other three cases without poloidal rotation,the peaks at f=2.63 GHz are all distinct and have similar amplitudes.So,the above simulation suggested that radial mode movement,no matter whether the mode is propagating radially or just oscillating locally,could add a modulation item on the DR phase,then generated the symmetric peaks in the complex S(f) spectrum,which could be categorized into the phase modulation caused by radial mode structure.
In general,the main differences in the complex S(f)spectrum between Bragg scattering and the modulation are the amplitude response of ±1 order peaks,and the appearance of high-order harmonics.Here in figure 3(a),due to the noise setting and the strong image peak rejection beyond 40 dB,the image+1 order peak of Bragg scattering could not be seen here(it would appear if the phase noise level is zero).
To further confirm the magnitude relationship between the Bragg scattering peak and the symmetric modulation peaks,the function between these peak amplitudes and the density fluctuation intensity is plotted in figure 4.For simplicity,only the Bragg scattering case and the outward propagation case are calculated.It can be found that the spectral peaks all have similar linear responses A ∝δn/n (powerto the density fluctuation intensity at the low fluctuation level.Considering that the large-scale coherent/quasi-coherent density fluctuation would be always larger than the small-scale density fluctuation,the actual difference between the modulation peaks and the Bragg scattering peak is smaller than 20 dB.
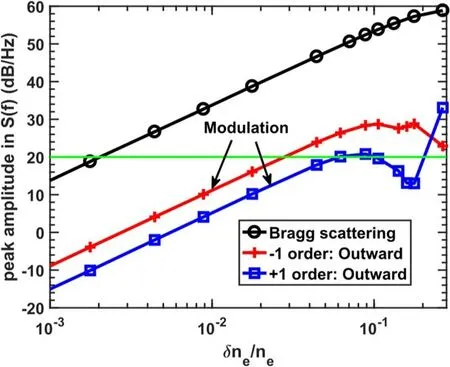
Figure 4. The function of phase modulation and Bragg scattering peak amplitude versus the density fluctuation amplitude δne/ne for both Bragg scattering (black) and radial outward modulation (red and blue) shown in figure 3.
Further,how does it work on large-scale modulation with kθ≠0? Is the phase modulation only produced by the radial structure movement? Of course not.The density fluctuations with different kθfrom 10-800 m-1but a fixed poloidal rotation speed (Vθ=0.1c),radial wavenumber kr=0,and peak-peak δne/ne=0.044 with a radial structureare used for the test.Here the matched poloidal scale is still 550 m-1.It should be mentioned that the diminishing krhas no significant influence on the complex S(f) spectrum,since no radial velocity is applied here yielding no contribution from krVr.The complex S(f) spectra under kθ=30,100,and 250 m-1are shown in figure 5(a).The symmetric harmonics under kθ=30 m-1are similar to that shown in figure 3(a),and the frequency of ±1 order is still determined by,while for the kθ=100 and 250 m-1cases,asymmetry of the harmonics occurs.Moreover,it could be found that when kθ>200 m-1,the +1 order is no longer the strongest peak,as shown in figure 5(b).From the relationship between the peak intensities of+1,-1,-2 order and kθ,three regions with different features separated by kθ~150 m-1and kθ~400-450 m-1could be identified.It could be found that in the first region kθ?150 m-1,the±1 order peaks are almost symmetric and comparable,yielding a low image-rejection ratio A-1/A+1,while in the second region 150 m-1?kθ?400 m-1the -2 order harmonic is larger than the±1 order.The final region is the so-called Bragg scattering,which would generate the highest Doppler peak in the complex S(f) spectrum.Moreover,figure 5(b)shows the peak amplitude at 1 order frequency in phase(f)spectrum,and the peak actually disappears when Bragg scattering dominates,similar to the black solid line in figure 3(b).
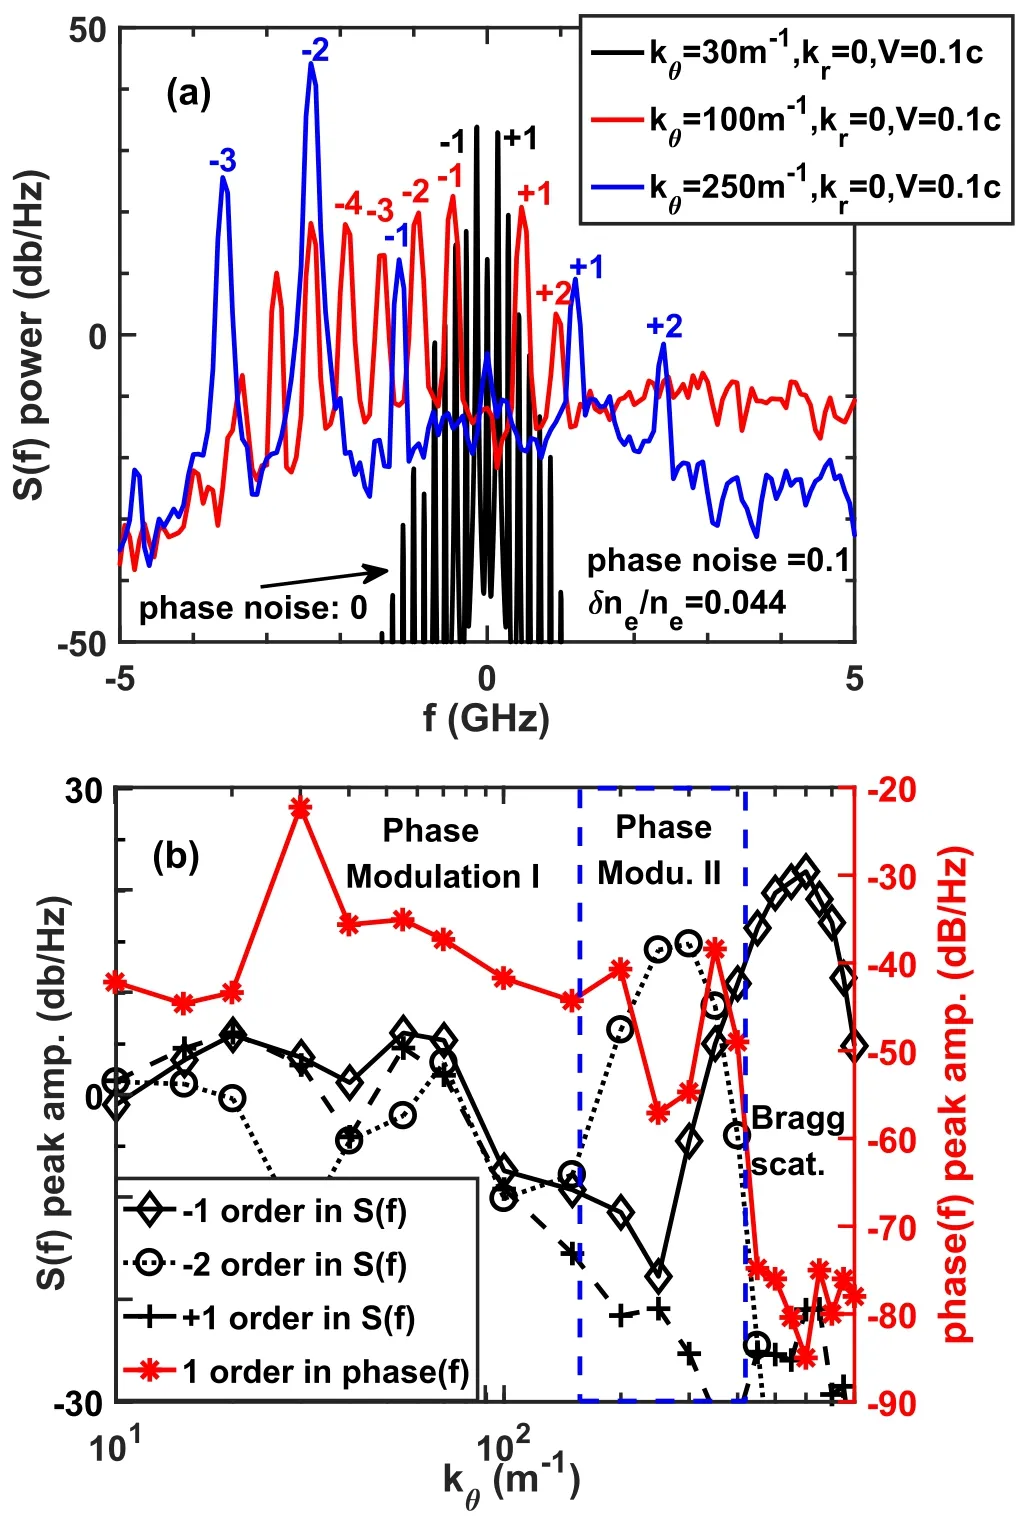
Figure 5.The poloidal wavenumber response analyses.Panel (a)illustrates the complex S(f) spectra for three typical cases,and (b)illustrates the function of the complex S(f) peak amplitude in black and the phase(f) peak amplitude in red versus the poloidal wavenumber kθ.
Also,the phase(f) spectra from kθ=100-600 m-1are plotted in figure 6.The most interesting result is the distinct high-order harmonics when kθis small.These harmonics can be easily understood through a simple calculation,assuming that the complex S(f) spectrum is a combination of two Doppler peaks (n and k order harmonics),a phase modulation with a fundamental frequency(n-k)ωMis produced together with its high-order harmonics,and the strength of phase(f) modulation peaks is reversely proportional to the difference in amplitude between A1and A2.Combined with the -2,-1,and +1 order harmonics,all harmonics in phase(f) spectrum are produced.So,the harmonics of the phase spectrum are essentially due to the asymmetric peaks and harmonics on the complex S(f) spectrum.However,it should be emphasized here that actually phase spectrum in experimental measurement would be greatly affected by the system noise level,and high-order harmonics in the phase spectrum are not as common as the phase modulation phenomena in the complex S(f) spectrum.The above results suggest that poloidal density fluctuation with unmatched scale could also cause phase modulation.
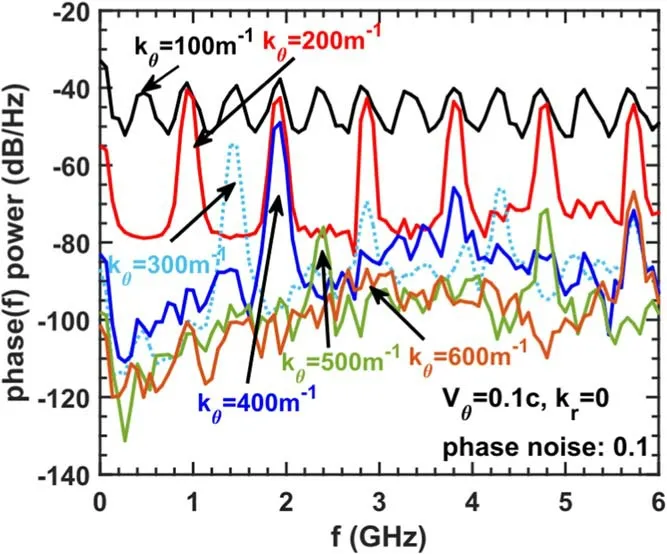
Figure 6.The phase(f)spectra under poloidal wavenumber response analysis.

Figure 7. The image-rejection ratio in the linear δne/ne response stage versus the poloidal wavenumber.
3.2.Image-rejection ratio
Considering that experimentally high-order harmonics on the complex S(f) spectrum are rarely observed,a feasible parameter to compare the experiments and simulations is the image-rejection ratio of the±1 order peak (defined as A-1/A+1here),which remains unchanged in the linear δne/neresponse stage.Figure 7 shows the curve of A-1/A+1versus the poloidal wavenumber,and similar to figure 5,three regions could be distinctly confirmed.In the weak imagerejection range,(kθ/k0?0.15) with A-1/A+1≤10 dB and the image-rejection ratio is roughly proportional to the poloidal wavenumber.It is worth noting that for the kθ≤20 m-1cases,the image-rejection ratio could be negative,suggesting that the peak at the Doppler shift side(A-1) is not always the larger one.Next is the harmonics dominant region,with<kθ<kmatch(0.15 ?kθ/k0?0.4).In this region,the image-rejection ratio increased rapidly with poloidal wavenumber.The last one is the Bragg scattering dominant region.It should be emphasized that the poloidal wavenumber thresholds to separate the three regions varied much with the incident angle(~25°in our simulation).
Based on these results,we could deduce that the ECM observed by the edge reflectometry shown in figure 1 (symmetric peaks of±1 order) should be classified as a weak image-rejection region with kθ?100 m-1,consistent with the experimental values [16] of kθ~40-80 m-1.
In summary,given the phase modulation phenomena caused by large-scale structures around the cutoff layer,the following conclusions could be deduced:
(1) Symmetric peaks in the complex S(f) spectrum mean that the DR phase signal has a modulation/oscillation component.
(2) The modulation/oscillation component could be generated through the moving radial structure and/or from the rotation of poloidal large-scale structure with unmatched poloidal wavenumber kθ.
(3) The image-rejection ratio A-1/A+1is an important indicator,and qualitatively proportional to the poloidal wavenumber.
3.3.Propagation-route effect
Next,we investigate the influence on the DR signal when a large-scale structure such as ECM locates at the incident beam propagation path.To match the experimental situation,density fluctuation with kθ=100 m-1,kr=0,V=0.2c,peakpeak δne/ne=0.05,and a radial covering of 0.02 (0.9 cm)normalized radius is applied.
Firstly,without the structures of other scales,the contributions to the DR signal from only the large-scale structure at different positions(ρM)were calculated.Figure 8 shows the complex S(f) spectra when ρMchanged from ρM=0.835 to 1.055 with the theoretical cutoff layer located at ρcutoff=0.86.In order to show the harmonic characteristics clearly,no phase noise is applied here.It could be seen that when the large-scale structure located at ρM=0.885,the maximum amplitudes and most pronounced asymmetries are reached for the high-order harmonics.Since the high-order harmonics are only significant in the nonlinear response stage (which is not shown here),it could be deduced that the amplitude response for the high-order harmonics is nonlinear here.
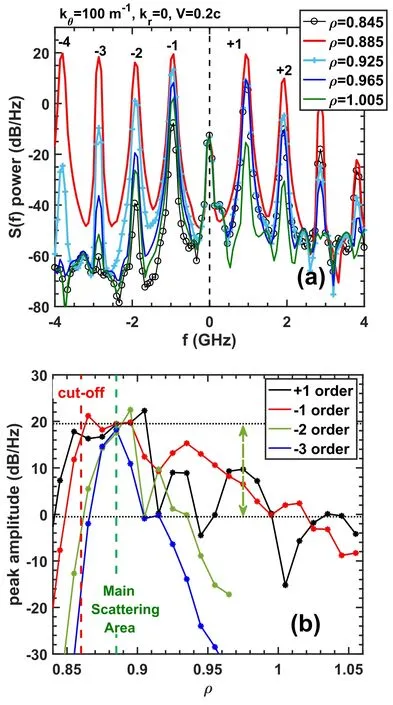
Figure 8. Panel (a) illustrates the complex S(f) spectra for several typical radial locations,and panel (b) the function of various peak intensity versus radial locations.
The tendency of how these harmonic amplitudes changed with ρMis shown in figure 8(b).The position ρM=0.885,where most harmonics reach the maximum,is a little ahead of the theoretical cutoff layer.The position ρ~0.885 featured the strongest Bragg scattering and is called the MSA here and marked as a green vertical dashed line,similar to the results reported in [40].With ρMaway from 0.885,high-order harmonics decrease much faster than the fundamental±1 order peaks.It could be found that the±1 order peaks are only attenuated by about 20 dB at ρM=1.015,which is already 6.5 cm away from the cutoff layer.These results suggest that when a large-scale structure with a moderate amplitude is located at the path of the injecting beam,the received DR signal would contain an additional component dominated by an oscillation phase,much similar to the phase modulation phenomena mentioned formerly.The only difference is that the effect would be attenuated depending on the distance between the cutoff layer and the structure position.
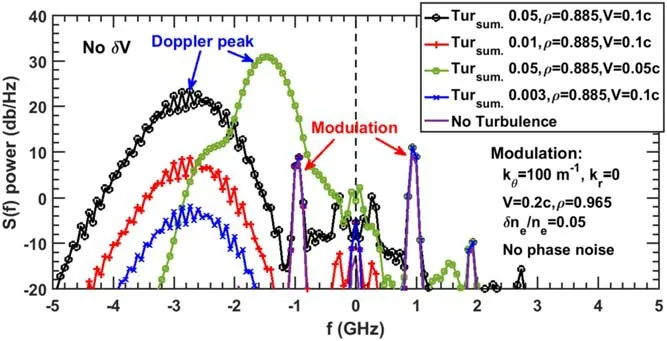
Figure 9.Complex S(f) spectra of combining the large-scale modulation kθ=100 m-1 at ρM=0.965 and background turbulence located at the MSA ρ=0.885.The shoulder peak (~-2.5 GHz) of the pink case is from the second harmonic of the kθ=100 m-1 modulation peak.
Secondly,a combination of turbulence located at the MSA (ρ=0.885) and large-scale structure kθ=100 m-1at ρM=0.965,V=0.2c is applied.The turbulence is set aswith a flat wavenumber spectrum,and with phase noise amplitude 2π,kr=0,and Vtur.=0.05c and/or 0.1c.The complex S(f)spectra are shown in figure 9.It can be seen that the Doppler peak caused by the broadband turbulence becomes dominant as the turbulence amplitude gradually increases,and the total scattering signal is simply the linear superimposing between the large-scale modulation spectrum (blue line in figure 8(a))and the Bragg scattering turbulence spectrum.The final received signal through DR can be written as
Quantitatively,considering a background turbulence wavenumber spectrum with a behavior similar to ALTAIR experimental data where the amplitude of the fluctuation wavenumber is assumed constant up to 500 m-1and then follows apower law [21,46],the RMSsingle-mode/RMSsummed-Tur.(or called Ampsingle-mode/Ampsummed-Tur.) is figured to be~0.084,whereRMS=is the root mean square operation.Thus,we could make a comparison between turbulence amplitude and large-scale (narrow bandwidth) fluctuation amplitude.Combined with a~26 dB(~13 dB or 20 times in amplitude A) power response difference between the large-scale modulation and Bragg scattering(as shown in figure 5(b)) and the~10 dB (3.2 times in amplitude) power attenuation between ρM=0.885 and ρM=0.965 shown in figure 8(b),a maximum critical=0.084×20×3.2=5.4 is acquired,which is the threshold where the modulation peaks could be seen in the complex S(f) spectrum.We call this effect the propagation-route effect,and is essentially the phase response of the interferometer,which should be considered when analyzing the DR signals from the core plasmas.
3.4.Core measurement model
For the fusion device,turbulence and transport research in high confinement mode (H-mode) with a steep density pedestal in the edge regions has drawn more attention because the H-mode is the baseline scenario for ITER operation [47].Is there any difference in the propagation-route effect mentioned above? A modifeid model with density profliene0=[2.64×(tanh(20×(0.85-ρ))/2+0.5)-ρ+1.38]×1019m-3is applied,with the cutoff layer at ρ=0.56,cutoff layer density gradient 1/Lne=0.66 m-1,and pedestal at ρ~0.9.Simultaneously,the antenna is arranged centered at y1=300 (grid)with an incident angle of~11.5°,consistent with the experimental arrangement [10].To better describe the local radial distribution of the density fluctuation,a Gauss-like radial fluctuation distribution is applied as ne1=δne/ne××cos[k(Lθ+Vθt),where W=0.0173 (~0.78 cm) is the e-1half width.
Typical electric field Ezdistribution of the incident beam with kθ=100 m-1,kr=0,V=0.1c,ρM=0.625,and peakpeak δne/ne=0.04 is shown in figure 10,which is significantly different from that in figure 2.Notably,in previous analytical theory such measurement is called the nonlinear multiple scattering effect,while it is called linear here from the linear scattering-power-to--amplitude response simulation results under a low δne/ne.The solid lines are the beam trajectories,while the dotted lines represent beam trajectories without plasmas.It can be seen from the trajectories that the two blue lines above the center line are still in line with the contour map,while the other two blue lines below the center line show no full trajectories as approaching the cutoff layer.Two black X's are marked here because the ray-tracing calculation is unavailable here.Actually,the whole Gaussbeam distribution could be divided into two parts,the oblique incident part undergoing a moderate incident angle,and the near perpendicular incident part.Moreover,the Gauss beam became significantly broadened at the density pedestal ρ~0.9,which makes the incident beam cover a much larger radial range compared with the situation shown in figure 2(b).Such beam distribution has two main effects on the following propagation-route effect research.Firstly,the background noise level increases a lot.Secondly,the coverage of the MSA is also very broadened.Such a beam broadened effect would disappear with the density gradient at the cutoff layer gradually increasing,accompanied by the MSA close to the pedestal case shown in figure 2(b).
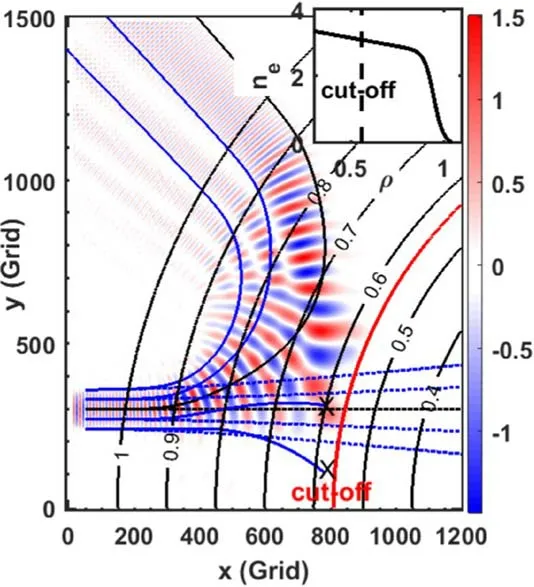
Figure 10.Typical electric field of plasma core measurement case with a steep pedestal at the plasma edge ρ~0.9,and the incident angle to the cutoff layer is nearly 11°.
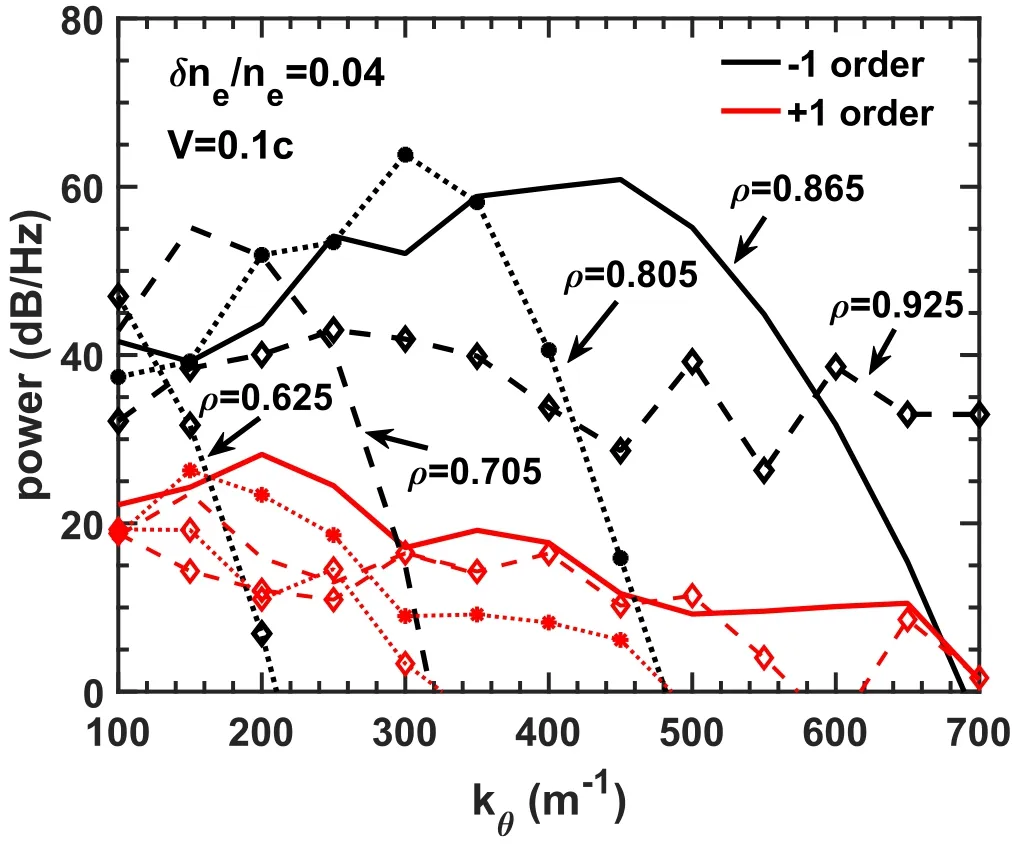
Figure 11.Poloidal wavenumber response at different radial locations for the core measurement case with kr=0 and cutoff layer at ρ=0.56.
The fluctuation wavenumber response analysis for different radial locations ρMis shown in figure 11 under kr=0,V=0.1c,and δne/ne=0.04.In all radial locations,the +1 order peak shows a similar response to the poloidal wavenumber,while the-1 order(Doppler side)peak shows a linear decay to the wavenumber at ρM=0.625 and a typical amplitude response with wavenumber selection from ρM=0.705-0.865.The matching wavenumbers for ρM=0.705,0.805,and 0.865 are 150,300,and 440 m-1,respectively,which increase with ρMmoving outward.These matching wavenumbers would be caused by the oblique incident part of the beam mentioned above and could not be estimated from ray-tracing calculation only on the center line.The ρM=0.925 case is more interesting,the +1 order peak shows a flat response to the wavenumber,suggesting that the phase modulation has much less scale sensitivity at this location.
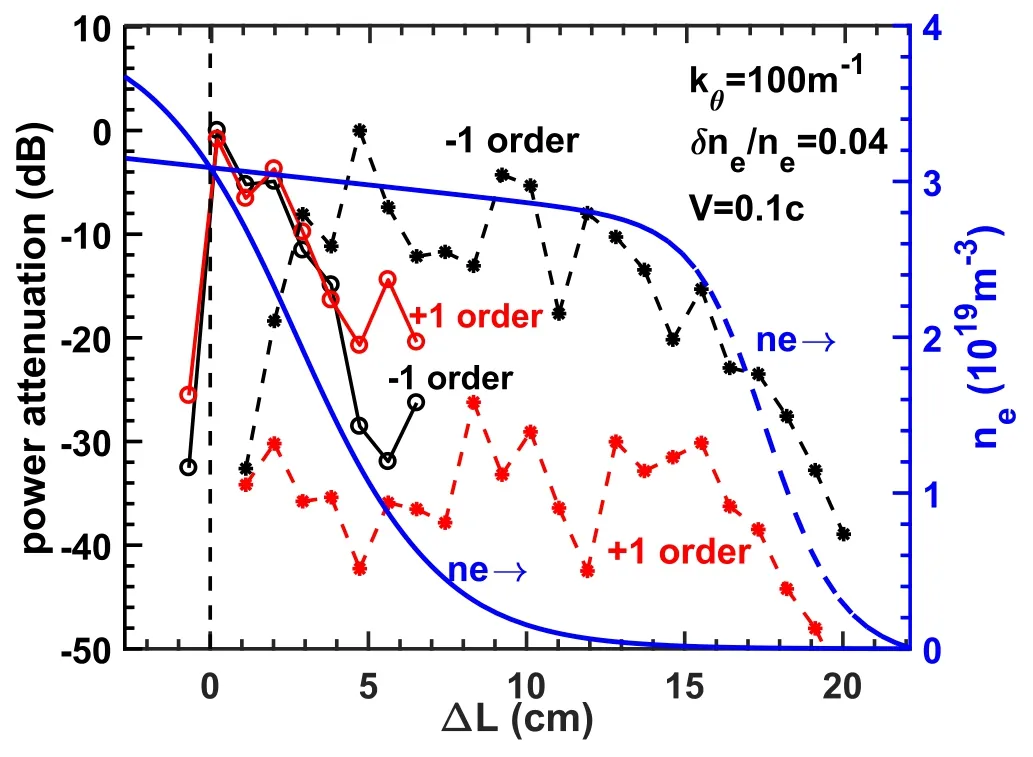
Figure 12.The large-scale kθ=100 m-1 fluctuation amplitude response versus the displacement to the cutoff layer for both pedestal(in solid lines) and core measurement cases (in dashed lines)with kr=0.
How the amplitudes of±1 order modulation peaks caused by kθ=100 m-1structure varies to the radial locations is shown as dashed lines in figure 12,with the other parameters the same as those in figure 10.The result from the case with the cutoff layer located at the plasma edge region is also shown for comparison.The blue line represents the density profile,while the red and black lines represent the amplitude o±1 order peaks,respectively.For the core measurement case,the peak amplitudes have a slowly decreasing response in the region of ΔL ?14 cm,and a quick decay in the pedestal region of ΔL >14 cm,much different from the solid lines(i.e.the situation shown in figure 8).Combined with the pedestal measurement result and the core measurement result,it can be deduced that the large-scale structure amplitude response is roughly proportional to∝(ne,propa.-route)1-1.2under a fixed δne/ne.Then,with the results shown in figure 11,the most immediate consequence is that the±1 order peaks caused by various large-scale structures could be observed by the core DR,especially when Doppler scattering is not very strong and the cutoff layer density gradient is small.Such effects are called the ‘propagation-route effect’ in this paper,which is considered negligible before.
At last,considering that in H-mode plasmas,various coherent modes and instabilities would appear in the pedestal region due to a large pressure gradient,in the following simulation the large-scale structures are fixed at the density pedestal top(ρM=0.925).How the image-rejection ratio A-1/A+1varied with the poloidal wavenumbers is shown in figure 13.As we said previously in figure 11,no wavenumber selection appears,resulting in that no Bragg scatting region is observed in figure 13.Although the image-rejection ratio is still roughly proportional to the wavenumber,the relationship is totally different from the case (structures located around the cutoff layer with a 25°incident angle) shown in figure 7.Generally speakingthe weak image-rejection region became much narrower.Such differences are mainly due to the beam distribution caused by the small incident angle.So,for the ECM located at the H-mode pedestal region with kθ=40-80 m-1,the imagerejection ratio would probably exceed 10 dB,well explaining the different spectra shown in figure 1.Because ECM is located at the pedestal region,the edge Doppler reflectometry would get the spectrum with a small imagerejection ratio,while the core Doppler reflectometry would get the spectrum with a large image-rejection ratio(figure 12 with kθ=100 m-1).
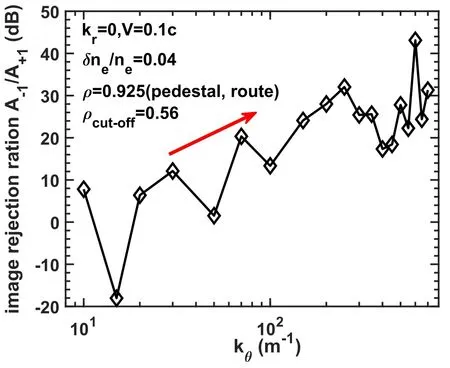
Figure 13.The image-rejection ratio varying to the poloidal wavenumber under core observation case with fluctuation located at pedestal ρM=0.925 (propagation route).
Quantitatively,supposing that the power response difference between the Bragg scattering and large-scale modulation is 20 dB,RMS(ne,Mod.@route)/RMS(ne,Tur.@MSA)~1.3(density of the ECM location is~2/3 of the MSA from the experiment)is the minimum value at which the pedestal ECM could be observed by the core DR channel,considering that the peaks from Doppler shift and phase modulation are overlapping due to the low rotation in the core plasmas.If the difference in the power response increases to 30 dB,the criticalvalue would increase to~4.1.The thresholds are much lower than the value of 5.4 estimated from figure 8,and could be used to estimate the turbulence amplitude if the ECM amplitude could be measured experimentally.
4.Summary
To interpret the symmetric peaks caused by the ECM observed by the edge and core DR channels,a 2D O-mode circular-shaped full-wave model based on the FDTD method is built.The common phase modulation phenomena were systematically investigated,and it is found that symmetric peaks in complex S(f) spectrum mean that the phase has an oscillation term and the oscillation could be caused by the radial or poloidal movement of density structure with unmatched large scales.For the phase modulation caused by structures around the cutoff layer,the function between the image-rejection ratio A-1/A+1and the poloidal wavenumber can be divided into three distinct regions,while the common quasi-symmetric modulation peaks correspond to the first stage,consistent with the edge DR measurement.If the modulation peaks are not strictly symmetrical,harmonics would probably appear in the phase(f) spectrum.
If the structure location is a certain distance from the cutoff layer,DR would respond to all density fluctuation located at the incident path with a scattered signal amplitude nearly proportional to the local density fluctuation.The final DR signals are usually simply superimposed by Doppler backscattering from the turbulence and phase modulation from the large-scale structure for the case that core DR measurement is influenced by edge coherent mode.The ‘propagation-route effect’ could well explain the experimental observations,and a critical value ofRMS(ne,Mod.@route)/RMS(ne,Tur.@MSA)~1.3-4.1 for pedestal modulations visible in the core DR measurement channel is figured out.
Although the different phenomena observed by the edge/core DR channels have been well explained,the features of phase modulation bring new challenges to DR signal analyses for experimental analysis,especially for the core turbulence measurement.Firstly,the large-scale structure causing the modulation peaks is not always located at the cutoff layer,and other diagnoses should be used to identify its position.Secondly,the phase modulation may produce one peak or even harmonic peaks in phase(f) spectrum,and unlike traditional principles for DR,such peaks could not represent turbulent velocity fluctuations or electric field fluctuations.The original IQ signals need to be filtered to separate the contributions from backscattering turbulence and large-scale structure.
Acknowledgments
This work was supported by Shenzhen Clean Energy Research Institute,the National MCF Energy R&D Program of China(Nos.2018YFE0311200 and 2022YFE03070004),National Natural Science Foundation of China (Nos.U1967206 and 12075155),the China Postdoctoral Science Foundation (No.2021M702270),and the Fundamental Research Funds for the Central Universities (No.WK3420000018).
 Plasma Science and Technology2023年11期
- Plasma Science and Technology的其它文章
- High-order field theory and a weak Euler-Lagrange-Barut equation for classical relativistic particle-field systems
- Design of new resonant magnetic perturbation coils on the J-TEXT tokamak
- Non-invasive optical characterization and estimation of Zn porosity in gas tungsten arc welding of Fe-Al joints using CR model and OES measurements
- A study of grid failure mode drivers and methods for accelerated life testing of a 30cm diameter ion thruster
- Research on degradation mechanism of trichlorobenzene and Hg0 by nonthermal plasma catalysis
- Ionization wave propagation and cathode sheath formation due to surface dielectricbarrier discharge sustained in pulsed mode