
Estimation of Lightning-Generated NOx in the Mainland of China Based on Cloud-to-Ground Lightning Location Data
2023-02-08 08:16:40QiLIFengxiaGUOXiaoyuJUZeLIUMingjunGANKunZHANGandBinbinCAI
Advances in Atmospheric Sciences 2023年1期
Qi LI, Fengxia GUO, Xiaoyu JU, Ze LIU, Mingjun GAN, Kun ZHANG, and Binbin CAI
1Key Laboratory of Meteorological Disaster, Ministry of Education (KLME)/ Joint International Research Laboratory of Climate and Environment Change (ILCEC)/Collaborative Innovation Center on Forecast and Evaluation of Meteorological Disasters (CIC-FEMD)/Key Laboratory for Aerosol-Cloud-Precipitation of China Meteorological Administration, Nanjing University of Information Science & Technology, Nanjing 210044, China
2Huangshi Meteorological Bureau, Huangshi 435002, China
3Anhui meteorological disaster prevention center, Hefei 230061, China
ABSTRACT Lightning-generated nitrogen oxides (LNOx) have a major influence on the atmosphere and global climate change.Therefore, it is of great importance to obtain a more accurate estimation of LNOx.The aim of this study is to provide a reference for the accurate estimation of the total LNOx in the mainland of China based on cloud-to-ground lightning (CG)location data from 2014 to 2018.The energy of each CG flash was based on the number of return strokes per CG flash, the peak current of each return stroke, and the assumed CG breakdown voltage.The energy of intracloud lightning (IC) was based on the estimated frequencies of IC and the assumed energy of each IC flash.Combining the energy of lightning and the number of nitric oxide (NO) molecules produced by unit energy (ρno), the total LNOx production in the mainland of China was determined.The LNOx in the mainland of China estimated in this study is in the range (0.157-0.321) × 109 kg per year [Tg(N) yr-1], which is on the high end of other scholars’ works.Negative cloud-to-ground lightning (NCG) flashes produce the most moles of NOx, while positive cloud-to-ground lightning (PCG) flashes produce the least total moles of NOx.The breakdown voltage of PCG is greater than that of IC or NCG, while the latter has a greater output of LNOx.
Key words: cloud-to-ground lightning location, lightning peak current, lightning breakdown voltage, nitrogen oxide (NOx)
1.Introduction
Nitrogen oxides (NOx) are important to tropospheric chemistry due to their role as a precursor of ozone (O3)(Crutzen, 1974).It should be noted that NO2is the chemical expression for nitrogen dioxide.In addition, NOxcan control concentrations of tropospheric hydroxyl radical (OH),thereby partially controlling the level of oxidants.NOxcan arise from both anthropogenic and natural emission sources.The anthropogenic sources of NOxare largely known.However, lightning-generated nitrogen oxides (LNOx) are still the source with the greatest uncertainty.
In the troposphere, lightning is the largest natural source of NOx(Bucsela et al., 2010); however, estimates of LNOxand its efficiency (LNOxper flash) are still quite uncertain (Beirle et al., 2010).Many researchers have conducted studies focused on improving estimates of the total amountof LNOx(mainly LNO).By measuring the NOxgenerated in laboratory long-gap discharge experiments, researchers have been able to estimate LNOxand extrapolate global LNOx(Peyrous and Lapeyre, 1982; Wang et al., 1998;Cooray et al., 2009).There are several problems with this method.First, the peak current and the energy of laboratory discharges are much smaller than those of natural lightning.Second, water vapor, relative humidity, and other environmental parameters also influence lightning development, but in laboratory long-gap discharge experiments, these influences are usually neglected.These factors bring great uncertainty to the estimation of LNOx, and the results obtained by different researchers vary greatly.Most estimates of global LNOxproduction range from 2-8 Tg(N) yr-1(Schumann and Huntrieser, 2007).
At present, there are few studies on LNOxestimation for the mainland of China.Zhou and Qie (2002) extrapolated the total LNOxemissions in the mainland of China to be 0.384 Tg(N) yr-1using the cloud-to-ground lightning (CG)location data from Guangdong, Longdong, Beijing, and northeast China.The energy of a CG flash was assumed to be 6.7 × 10⁹J in the theoretical extrapolation calculation proposed by Price et al.(1997).However, Wang et al.(1998) suggested that this value was the upper limit of the energy generated by a single lightning flash, which might contribute to overestimation of the overall result.Furthermore, the lightning location data did not cover the whole of China, and the lightning data in the four regions may not be sufficiently representative for the whole country.Zhang et al.(2002) and Du et al.(2002) used the CG location data in northeast China, Beijing, and Guangdong to estimate the energy of each lightning flash.Then, using the positive cloud-toground lightning (PCG) and negative cloud-to-ground lightning (NCG) frequencies, they estimated the LNOxproduction in the three areas.Compared with Zhou and Qie (2002),Zhang et al.(2002) and Du et al.(2002) obtained more parameters by observations.However, the CG data only included three local regions of China.In addition, only the amount of CG-generated NOxwas estimated, while the intracloud (IC)-generated NOxwas ignored.
Zhou et al.(2003) analyzed the NOxgenerated by natural lightning, which was observed by a ground-based NOxanalyzer in Datong county of Qinghai province.They estimated the energy of a lightning flash as (12-13) ×106J.In their research, only part of air entering the NOxanalyzer is hot air,that is, a considerable part is ambient air, so the calculation of LNOxhas very high uncertainty.In addition, the height of thunderstorms in the Qinghai-Tibet Plateau is lower and the channel length of a lightning flash is shorter, so the LNOxamount of a lightning flash is smaller than in others areas.
Based on the total lightning data obtained by Optical Transient Detectors (OTD), assuming the energy of a lightning flash to be 4.5 × 10⁷J, Sun et al.(2004) estimated that the total LNOxin China and the adjacent area is only 0.016 Tg(N) yr-1, an order of magnitude less than the estimate of Zhou and Qie (2002).The lightning light energy measured by OTD is the lightning radiation light energy at the top of the cloud, which is absorbed and scattered by the cloud, so the measured value is smaller than the actual value.Since Sun et al.(2004) neglected the reduction of optical energy caused by the optical thickness of clouds and the inversion from the optical energy to the total energy, they may have underestimated the energy of a single lightning flash, thus causing underestimation of the total NOx.
Based on the data obtained by Lightning Imaging Sensor(LIS) and Global Ozone Monitoring Experiment-2 (GOME-2), Ju et al.(2015) analyzed the correlation between lightning and NO2vertical concentration column (NO2VCD) data over the central Tibetan Plateau.They found that the linear fitting correlation coefficient between lightning density and NO2VCD was 0.84.Based on the fitting results, the total amount of LNOxin the mainland of China was estimated to be 0.15 (0.03-0.38) Tg(N) yr-1.Guo et al.(2016), using a similar method, obtained a mean LNOxproduction efficiency of 330 mol flash-1.Guo et al.(2017) analyzed the total lightning data from OTD and LIS and the NO2VCD data from the Royal Meteorological Institute of Holland.They proposed that because human activity is minimal on the Qinghai-Tibetan Plateau, lightning is the main source of NOxand determines the NOxconcentration in this area, and thus established a fitting relationship between the NO2VCD and lightning on the Qinghai-Tibetan Plateau.The amount of NOxproduced by a single lightning flash can be derived from the fitting relationship.The total amount of LNOxin the mainland of China was estimated to be 0.07 (0.02-0.27) Tg(N) yr-1.This method did not completely exclude the NOxgenerated by other sources, such as soil emissions.In addition,because of the characteristic differences of lightning in different areas, using the amount of LNOxin the Qinghai-Tibetan Plateau for extrapolation to the whole mainland of China may cause some error.Moreover, the lightning satellite data used did not distinguish between different types of lightning; the IC to CG ratio in the Qinghai-Tibetan Plateau may be different than in other parts of China, which also adds uncertainty to the results.
In summary, different researchers have adopted various methods and parameters or parameter values in the estimation of LNOxin China, leading to considerable variation in their estimation results.It is therefore necessary to further discuss the methods of estimation.Based on CG location data for the mainland of China, the energy of each CG flash was calculated from the number of return strokes per CG flash, the peak current of each return stroke, and the assumed CG breakdown voltage.The total energy of intracloud lightning (IC)is calculated using the estimated frequency of IC flashes and the assumed energy of a single IC flash.Considering the total energy of lightning and the number of nitric oxide(NO) molecules produced by unit energy (ρno), the total LNOxproduction in the mainland of China was determined.The data provided can be used as a reference for more accurate estimation of the total LNOxin China.
2.Mechanism of LNOx production
When lightning occurs, the air in and around the lightning channel is instantaneously heated as high as 30 000 K or more (Uman et al., 1964), and the pressure can reach several to dozens of atmospheres (Hill, 1971).During this process,O2and N2in the air are completely ionized and a series of chemical reactions continue to take place, resulting in products dominated by NOx.After discharge, the channel cools rapidly.The reactions begin with the thermal decomposition of O2:

followed by the production of NO via the reaction chain:

and

Meanwhile, NO consumption occurs as follows:

and

where NO is converted back to O2and N2.NO itself decomposes as follows:

The NO will also transform into N2O as follows:

The previous seven equations were taken from Borucki and Chameides (1984).In addition, there are quick photochemical/chemical inter-conversions between NO and NO2in the following reactions (Levine et al., 1984; Verma et al.,2021):
Here, M in the equation represents the third body to receive extra energy.NO2can be rapidly photolyzed back to NO during the daytime:

Here, h is planck constant andνis frequency of light waves.It has been suggested that in an electrical discharge, NO is mainly produced by a series of high temperature reactions(Cooray et al., 2009).The experimentally determined NO/NOxratios vary considerably depending on the presence of excess O2, O3and the residence time (Cooray et al., 2009).However, the total number of molecules of NOxis equal to that produced by NO (Cooray et al., 2009).Therefore, we first estimated the LNO production, followed by LNOx.
The time taken for NO to establish thermochemical equilibrium increases as the temperature decreases.It takes only a few microseconds for NO to reach equilibrium at 4000 K,but approximately 1000 years at 1000 K.Thus, as the lightning-heated air cools, the “freeze-out” temperature is reached, below which the reactions that produce and destroy NO become too slow to maintain NO in equilibrium, and the NO density remains at the value characteristic of equilibrium at that temperature.The rate of NO production at that temperature can then be used to estimate the LNO yield.
Each lightning process contributes a different amount of NO.Return strokes generate the most NO during a CG flash because most air molecules are ionized in the return stroke process and NO-dominated chemical substances are produced (Sisterson and Liaw, 1990).The NO produced during corona discharge is several orders of magnitude less than that produced during the return strokes (Sisterson and Liaw, 1990).IC flashes generally begin with streamers that propagate continuously.When the streamer encounters a charge source with opposite polarity, a recoil streamer occurs.A recoil streamer is similar to the return stroke of CG, and the accompanying electric field it causes is known as a K-change.The average current of a K-change is 1-4 kA, and each IC flash has about 6 K-changes (Ogawa and Brook, 1964).During each K-change, the average charge transferred is about 1.4 C (Brook and Ogawa (1977).The average charge of each IC flash during K-changes is about 8.4 C.Most NO is produced during the K-change stage of IC flashes.
3.Data and method
The China automatic CG monitoring system began operation in the 1980s.Initially, it mainly imported foreign CG location equipment (Chen et al., 2008).By 1990, a domestic CG location system had been put into operation (Chen et al.,2008).The domestic CG location system is mainly used for local CG monitoring and has not yet covered the whole country.It is used in the fields of meteorology, electric power,telecommunications, civil aviation, and military.From 2009 to 2017, the number of sensors managed by the China Meteorological Administration (CMA) increased from 265 to 406,with the largest increases occurring in Qinghai, Inner Mongolia, Tibet, and Xinjiang, where 24, 29, 24, and 43 stations were added, respectively (Fig.1) (CMA, 2010, 2018).It should be noted that the Xinjiang stations were installed in 2013, while most of the Qinghai and Inner Mongolia stations were installed in 2016.In addition, as seen in Fig.2 [a redrawn figure from Zhu (2016)], the sensors cover a large portion of China; however, there are more sensors in the east than the west, and more in the south than the north.As soon as a regional lightning network was established, the CMA began to digitize CG lightning strokes on a daily basis (Xia et al., 2015) and provide access to the data.

Fig.1.Number of CG monitoring stations in China in 2009 and 2017.
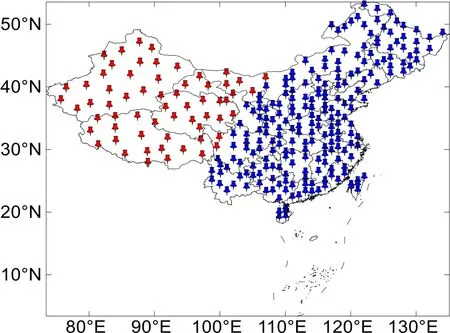
Fig.2.The site locations of CG detection sensors in China [the stations established before 2008 are blue and those after 2009 are red.The original figure, which is from Zhu (2016), has been redrawn in this paper].
The ground-based Advanced Time of Arrival and Direction (ADTD) system, used in the CMA CG monitoring network, was developed by the National Space Science Center,the Chinese Academy of Sciences.This system uses the Time of Arrival (TOA) and the Improved Performance and Combined Technology (IMPACT) methods to locate the CG flashes.The CG flashes are identified by the waveform characteristics.Different lightning types can be identified by distinguishing these characteristic parameters, like the rise time of the wave head, zero crossing time, unipolar,peak, and overshoot ratio.Influenced by the network’s settings and layouts, there is a possibility of misclassified flashes, primarily in terms of cloud flashes being called small positive CG strokes.Studies have shown that most (~90%) positive small flashes (<10 kA) are IC flashes and most (~90%) large positive flashes (>10 kA) are CG flashes.The misclassification rate for negative flashes was very small (Diendorfer, 2007).The detection range of a single station is 300 km, its detection efficiency can reach 80%-90%,and the locating accuracy is 500 m (Wang and Chen, 2015).It should be mentioned that the location accuracy and detection efficiency of this network has not been systematically evaluated due to the lack of adequate ground truth information(Xia et al., 2015).The average operation rate for a single station was approximately 89% in 2009 and over 95% in 2017(CMA, 2010, 2018).Each station provides reports on the time of the original return stroke (RS), locations (longitude and latitude), peak current, polarity, current maximum steepness (current maximum rate of rise), location method and provinces, cities, and counties.
3.1.CG Data and Processing
Due to the strict data management of the CMA, our data access was limited, especially for recent years.Thus,only the CG flashes occurring from 1 January 2014 to 31 December 2018 in the mainland of China were considered.Data before 2014 were not used, not only because of limited access, but also because there were relatively fewer sites before 2014.RS data were grouped using the criterion that a CG flash, which may consist of a series of separate strokes that occur for 1-s time periods within 10 km of the first stroke detected.The time interval of each RS involved in a flash is less than 0.5 s (Cummins et al., 1998; Zheng et al.,2016).The position of a CG flash is the average value of its RSs’ positions.To eliminate any possible IC contamination,positive RSs with currents less than 10 kA have been removed (Zheng et al., 2016).
The grouped CG data were then binned into grids of 0.1° × 0.1° (longitude × latitude), ranging from 73°E to 137°E and 3°N to 54°N, which includes land and coastal sea regions of China and areas of other countries.However,only return strokes located over land were included in the gridded dataset because sensors are located over land and the detection efficiency of flashes, especially those with moderate or smaller peak currents, falls off rapidly with distance.
3.2.Estimation method of LNO
Theoretically, the amount of LNO can be estimated if the number of NO molecules per lightning flash is known.However, the data used in this paper only includes CG flashes, without IC flashes.Therefore, to obtain the total LNO yield, we need the number of NO molecules for each CG flash and average per IC flash, and the assumed IC frequencies.In Fig.3, the flowchart is used to show major steps, substeps, and key assumptions.It should be noted that the amount of LNO was estimated according to the method described in section 3.2.The process to estimate LNOxfrom LNO can be seen in section 4.3.Details are as follows.
The number of NO molecules for each CG flash, or average per IC flash, is determined by ρnoand the energy per lightning flash (EF).For ρno, the theoretical calculation value is(3-16) × 1016J-1, the laboratory measurement is (2-17) ×1016J-1, and the field measurement is (20-30) × 1016J-1(Zhang et al., 2002).In this study, ρnowas taken as the average value of theoretical calculation and laboratory measurement(10 × 1016J-1), which is the same as that used in other studies(Price et al., 1997; Zhang et al., 2002).The EFof a single CG flash can be estimated from the CG location data.In the RS process of a CG flash, the air in the whole channel is punctured and ionized, and the air breakdown potential (V) is taken as approximately the potential of the whole channel.Assuming that the air molecules in the channel are completely ionized, the EFcan be calculated by multiplying the potential V and the deposited charge Q (Zhang et al., 2002).
Researchers have adopted different breakdown potential values determined using different methods.To compare the impact of different breakdown potential values on the estimation results, three groups of breakdown potential values were adopted in this study, hereafter referred to as groups V1, V2, and V3.These three groups were estimated based on the following three groups of breakdown electric fields(E).

Fig.3.A flowchart for calculating the total NOx of total lightning flashes (Ir is the peak current of the RS.QF,QS are the charge amount of a first and subsequent RS, respectively.QSj is the charge amount of the j-th subsequent RS.QIC is the average charge amount per IC flash.NCG, NIC are the number of NCG, IC lightning flashes, respectively.LNOCG, LNOIC are the total amounts of NO for NCG, IC lightning flashes, respectively.LNOx is the total amount of NOx for total lightning flashes).
Griffiths and Phelps (1976a, b) obtained the relationship between the air breakdown electric field threshold and the height by laboratory pulse tests and numerical simulations of lightning initiation in a positive corona streaming process.Stolzenburg et al.(1998a, b, c) then corrected the relationship based on electric field sounding observations.Finally, in this study, the first group of E was calculated by
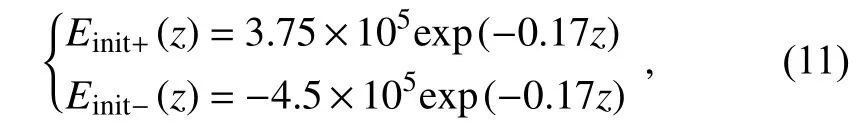
where z is the altitude (km) and Einit+, Einit-are the breakdown thresholds of the positive and negative electric field (V m-1),respectively.
Considering the theory that lightning may be initiated by high-energy electrons (~1 MeV) continuously produced by the thunderstorm electric field, the runaway breakdown electric field threshold can be represented as (Marshall et al.,1995):

where z is altitude (km), ρ is the air density related to height(kg m-3), and Ebeis the runaway breakdown electric field threshold varying with height (kV m-1).Here, we used Eq.(12) to calculate the second group of E.
Winn et al.(1974) used a rocket-borne aerial electric field instrument to conduct electric field penetration sounding of thunderstorm clouds in the active phase, and the average value of electric field in thunderstorms was found to be approximately 5 × 10⁴V m-1.Here, we took this value as the third group of E.It should be noted that thunderstorm clouds are cumulonimbus clouds that produce thunderstorms after reaching a certain intensity.
The height of the negative charge center in a thunderstorm cloud is approximately 5-7 km.So, and 6 km was taken by Price et al.(1997) and also used in this study.The PCG usually originates from the anvil of the thunderstorm cloud, which is approximately 10 km in height (Price et al.,1997); therefore, a value of 10 km was used in this study.Assuming that the CG breakdown voltage is calculated by multiplying the threshold of the breakdown electric field and the initial height of the channel, we obtain three groups of CG breakdown voltage (Table 1).
Because the charge deposited by a RS is difficult to measure, one can calculate the charge transferred to the Earth by integrating over the current pulse:

whereI(t) is the RS current intensity varying with time.RS currents can be estimated by RS current mode.The analytic expression that best matches the observed values of lightning currents is (Price et al., 1997):

whereIris the peak current of the RS, e is the natural constant, the first term is the rising part of the current, the second term is the falling part of the current, and the third term is the current tail (Zhang et al., 2002).For the first RS, A = B =1, C = 0.25,α= 3.3 × 10⁴s-1,β= 4.5 × 10⁵s-1, andγ= 8.8 ×10²s-1.For the subsequent RS, A = B = 1, C = 0.25,α= 2.5 ×10⁴s-1,β= 3.8 × 10⁶s-1, andγ= 8.8 × 10²s-1(Price et al.,1997).The RS current can therefore be represented as follows:
First RS
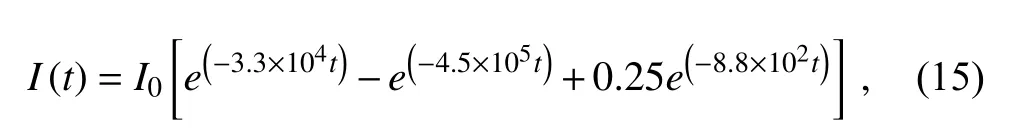
whereI0is the peak current of the first RS.Subsequent RS
whereIiis the peak current of thei-th subsequent RS.Integrating the time of Eqs.(15) and (16), the charge amount of a first and subsequent RS is approximately as follows:

and

For a CG flash with N RSs, its total charge is

To estimate the total LNO, it is necessary to know the parameters of IC.Because the CG location network cannot detect the IC, the IC frequencies were estimated from the CG frequencies and the IC to CG ratio.In this study, the IC/CG ratio was assumed to equal 3, corresponding to Rakov and Uman (2003), Ma et al.(2005), and Boccippio et al.(2001).However, it should be noted that the IC/CG flash rate ratio is influenced by many factors (Soriano and de Pablo, 2007; de Souza et al., 2009; Medici et al., 2017; Bandholnopparat et al., 2020), and it is not constant over a large area.
The channel length of an IC flash is generally 1-6 km(Ogawa and Brook, 1964), and a value of 3.5 km was used in this study.The average electric field inside a thunderstorm used in this study was 5 × 10⁴V m-1, which was obtained by Winn et al.(1974) via an airborne electric field instrument carried by rockets into thunderstorms.Thus, the breakdown voltage of the IC used in this study was 1.75 × 10⁸V (Table 1).The charge of a single IC flash was taken as 8.4 C (Brook and Ogawa, 1977).It is the charge transferred during 6 K-changes, not the whole process.So, the average LNO amount per IC flash was assumed to be 14.7 × 1025molecules flash-1.
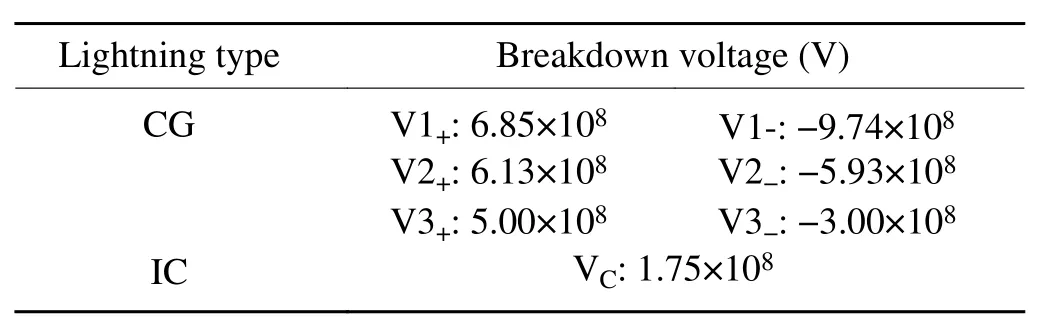
Table 1.Breakdown voltage values of CG and IC.
4.Results and analysis
4.1.Lightning characteristics in the mainland of China
Overall, lightning density and range distribution were both largest in summer (Fig.4).While there were more flashes in spring than in autumn, the former covered a smaller area than the latter.There were few lightning flashes in winter.Lightning in the mainland of China mainly occurred in east, central, and south China, followed by parts of northeast, north, and southwest China.The lowest densities were in parts of northwest and southwest China,which is consistent with satellite-based lightning data (Yuan and Qie, 2004; Ma et al., 2005; Cecil et al., 2014).Lightning density is mainly affected by topography, latitude, and land-sea distance (Yuan and Qie, 2004; Ma et al., 2005).Based on the ADTD system, the average annual flash total is approximately 1.19 × 10⁷flashes in themainland of China.However, based on gridded OTD/LIS data, the average annual flash total is approximately 4.33 × 10⁷flashes in the mainland of China, which is about 3.6 times the ADTD value.The reason is that OTD and LIS obtain CG and IC flashes, while ADTD only obtains CG flashes.
The average peak current of PCG in the mainland of China was 61.6 ± 4.9 kA (Fig.5), and that of NCG was 41.2 ± 4.7 kA (mean of the absolute values) (Fig.6).Combined with Fig.4, the area with the largest PCG and NCG current is not located in the southeastern coastal area with the most frequent CG, but in north, northeast, and southwest China with lower flash rates.
Lightning occurs mainly from May to September,which corresponds to the period of late spring to early autumn (Fig.7) (Ma et al., 2005; Yadava et al., 2020).This is mainly because the summer monsoon begins to affect China in April and May, and reaches its strongest in August; therefore, August is the strongest month for lightning activities in the mainland of China.From September, the winter monsoon begins to affect the mainland of China from the north, leading to a sharp decrease in lightning activity,which reaches the lowest level in November (Ma et al.,2005).In CG flashes, NCG flashes are dominant, whereas PCG flashes are rare.Moreover, the PCG percentages are higher in cold months (Antonescu and Burcea, 2010; Xia et al., 2015), which is contrary to NCG percentages.In some sit-uations, high PCG flash rates tend to originate outside the largest radar reflectivity and in the regions of the downshear anvil of the thunderstorm (Weiss et al., 2012).Some researchers consider that tilted charge structures account for this phenomenon, that is, the positively charged upper region of the thunderstorm is displaced downshear to the anvil from the negatively charged region due to the strong wind shear, so the negative charge region does not shieldthe positive charge region overhead from the ground anymore, and PCG flashes can originate from this displaced positive charge region (Wang et al., 2016).
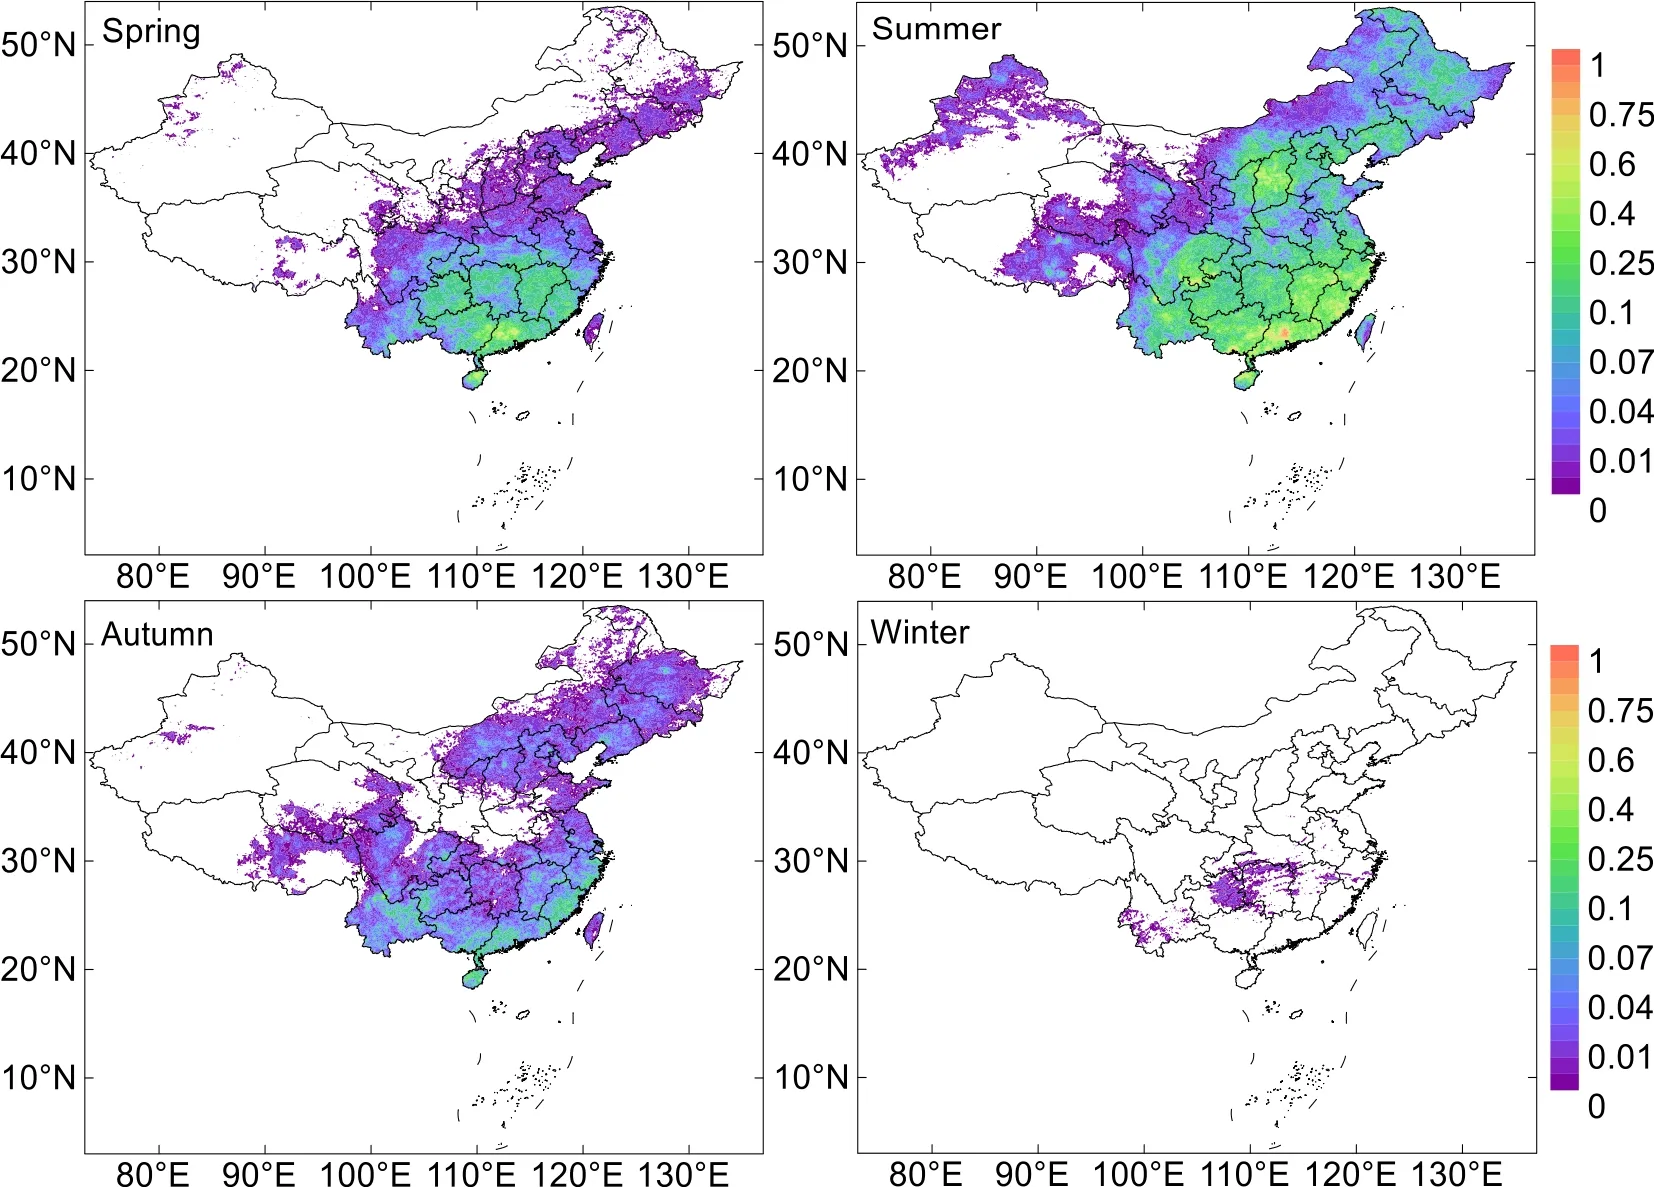
Fig.4.Seasonal spatial distribution of average CG densities (flashes km-2 month-1) in China from 2014 to 2018 (this study considers March to May as spring, June to August as summer, September to November as autumn, and December to February as winter).
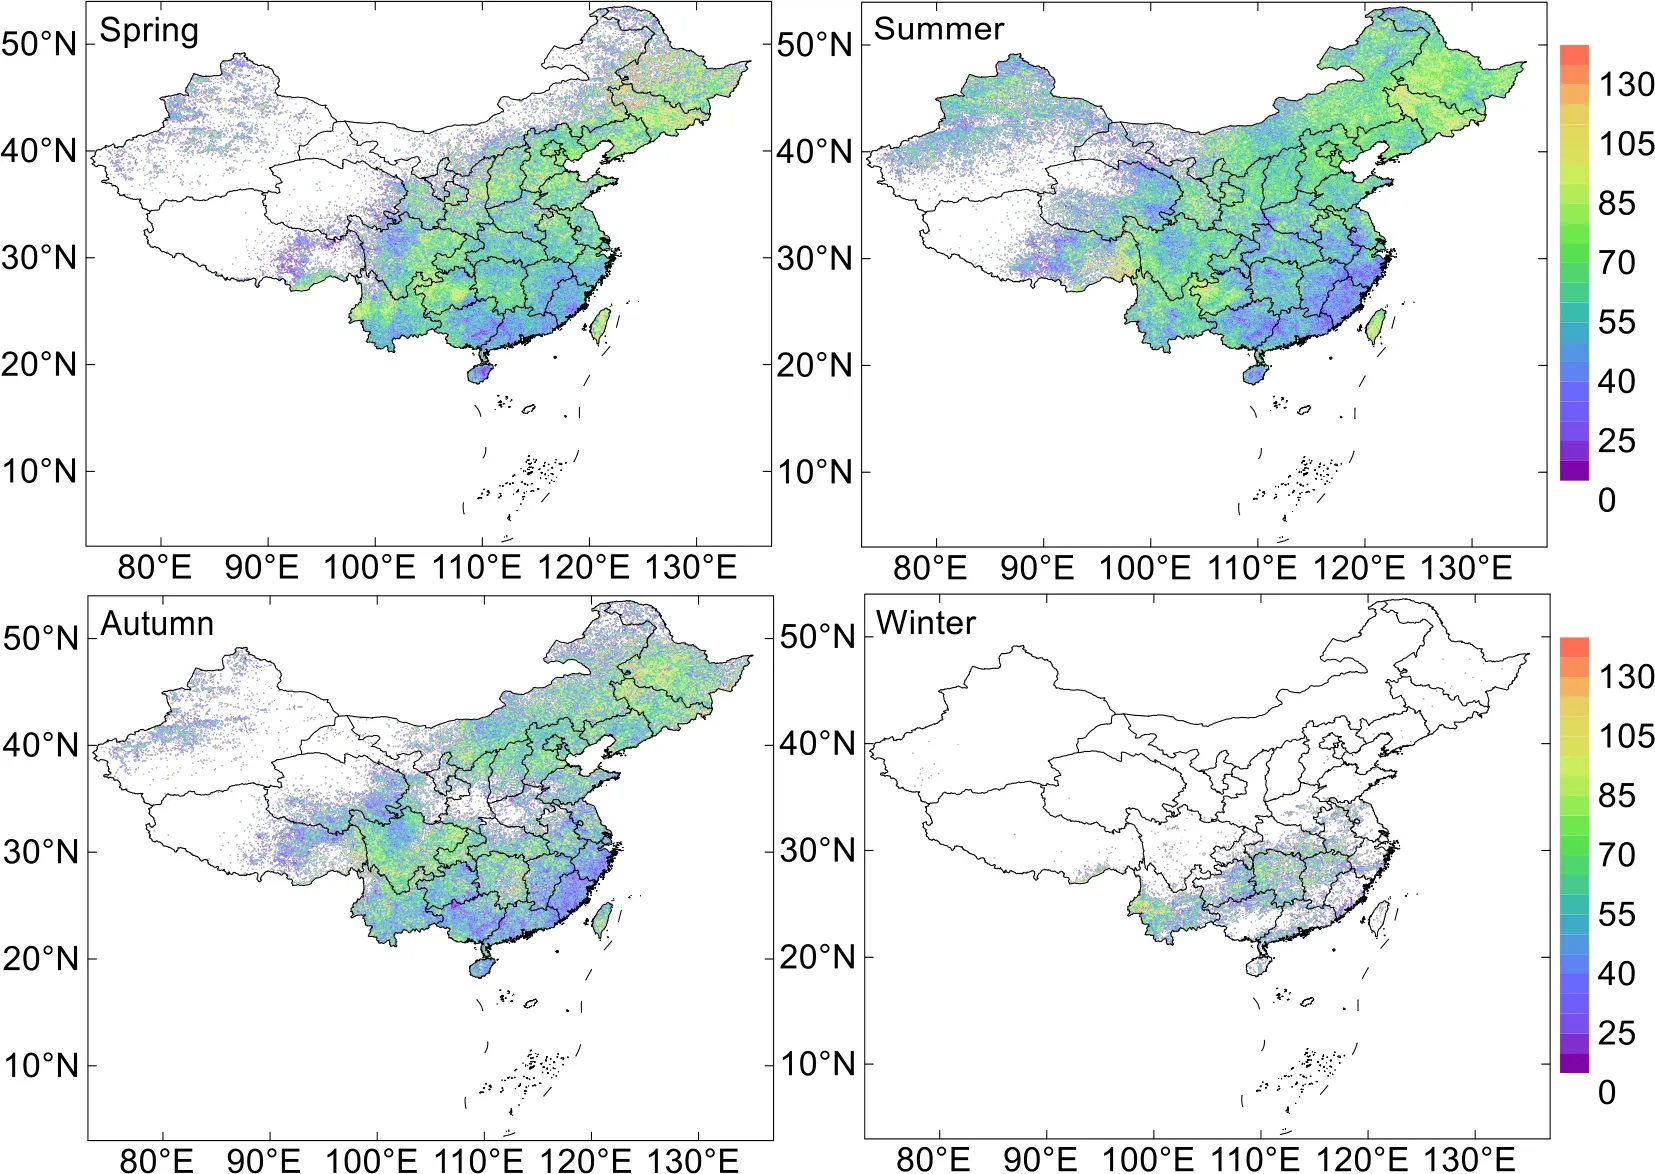
Fig.5.Seasonal spatial distribution of average PCG current (kA) in China from 2014 to 2018.
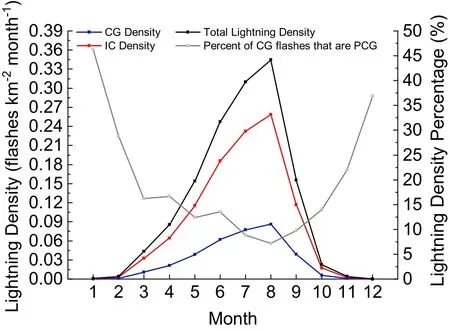
Fig.7.Monthly variation of average lightning densities and average lightning density percentage in China from 2014 to 2018.
The peak current of NCG flashes was smallest in May,and largest in January and December (Fig.8).On the whole,the average peak current of NCG flashes was largest when the frequency was low.The average peak current of PCG flashes was similar to that of NCG flashes except in July,August, and December.The average peak current of PCG flashes was significantly larger than that of NCG flashes,which is consistent with the results presented in Figs.5 and 6.
4.2.Characteristics of LNO
In this study, three groups of different breakdown voltages were used to estimate the output of LNO.Due to the similarity in spatial and temporal characteristics of the three groups, only one group is shown.The group of breakdown voltage V3 (V3+, V3-), the same as in Zhou and Qie (2002),was taken as an example to analyze the spatial and temporal characteristics of the estimated LNO.It is convenient for us to compare our results with Zhou and Qie (2002).
In short, the seasonal spatial distribution of LNO (Fig.9) was basically consistent with that of lightning frequencies(Fig.4); however, CG, which had a lower frequency than IC,produced more NO than IC.
Figure 10 shows that LNO is mainly produced from May to September, which is consistent with the main months of lightning occurrence shown in Fig.7.The NO generated by PCG flashes was only 2.6 × 10¹⁴molecules cm-2month-1, and the NO generated by NCG flashes was 12.2 ×10¹⁴molecules cm-2month-1.Even though the peak current of PCG was obviously higher than that of NCG, the frequencies of PCG flashes were small, and most PCG flashes only had one RS.The CG frequencies were smaller than IC frequencies (Fig.7), whereas the amount of NO produced by CG flashes was larger than that produced by IC flashes(Fig.10).The average NO produced by CG flashes was 2.2 ×10¹⁴molecules cm-2month-1more than IC flashes.This indicates that the energy of a single CG flash is much larger than that of a single IC flash in group V3.In other words,the energy of lightning flashes is more important than lightning frequencies in the estimation of LNOx.If the total amount of LNOxis only the assumed average LNOxof a single lightning flash multiplied by the lightning frequencies, the estimation can cause considerable errors (Beirle et al., 2014; Mecikalski and Carey, 2018).

Fig.8.Monthly variation of CG average peak current in China from 2014 to 2018.
4.3.Estimated LNOx in the mainland of China
The amount of LNO was estimated according to the method described in section 3.2.To estimate LNOx, the proportion of LNO in LNOxmust be obtained.Experiments by Wang et al.(1998) showed that the ratio of NO/NOxproduced by spark discharge exceeds 0.9, and the value of 0.9 is used in this study.
In Fig.11, the maximum breakdown voltages are seen in group V1 and the minimum is seen in group V3, and the NOxproduction of CG and total lightning varies consistently(maximum in group V1 and minimum in group V3).The NOxof group V1 is 104% more than group V3, while NOxof group V2 is just 46% more than group V3.In group V1,NOxproduction of CG (77.5%) was more than three times that of IC (22.5%), while in group V3, NOxproduction of CG was 8.4% more than that of IC.In addition, less NOxcomes from PCG flashes, which contribute no more than 10%in all three groups.
The comparison of LNOxestimations for the mainland of China from this study with those from previous studies is shown in Table 2.It should be noted that in the extrapolation method of Guo et al.(2017), the estimate is influenced by the values of the correction factor CF, the ratio of NO2to NOxin the troposphere fNO2, and the lifetime τ of NO2.CF is used to correct retrieved NO2VCDs, since the visibility of trace gases in the troposphere depends on the vertical profile, surface albedo, and cloud cover.They all have an uncertainty range, so an uncertainty of one order of magnituderemains in the LNOxestimate.The estimate is 0.07 Tg(N) yr-1when CF, fNO2, andτare 1.5, 0.6, and 4 d, respectively.Meanwhile, the minimum estimate is 0.02 Tg(N) yr-1when the three parameters are 1, 0.8, and 6 d, respectively, and the maximum is 0.27 Tg(N) yr-1when they are 2, 0.4, and 2 d, respectively.

Table 2.Comparison of the estimates of this study with other studies for the mainland of China.
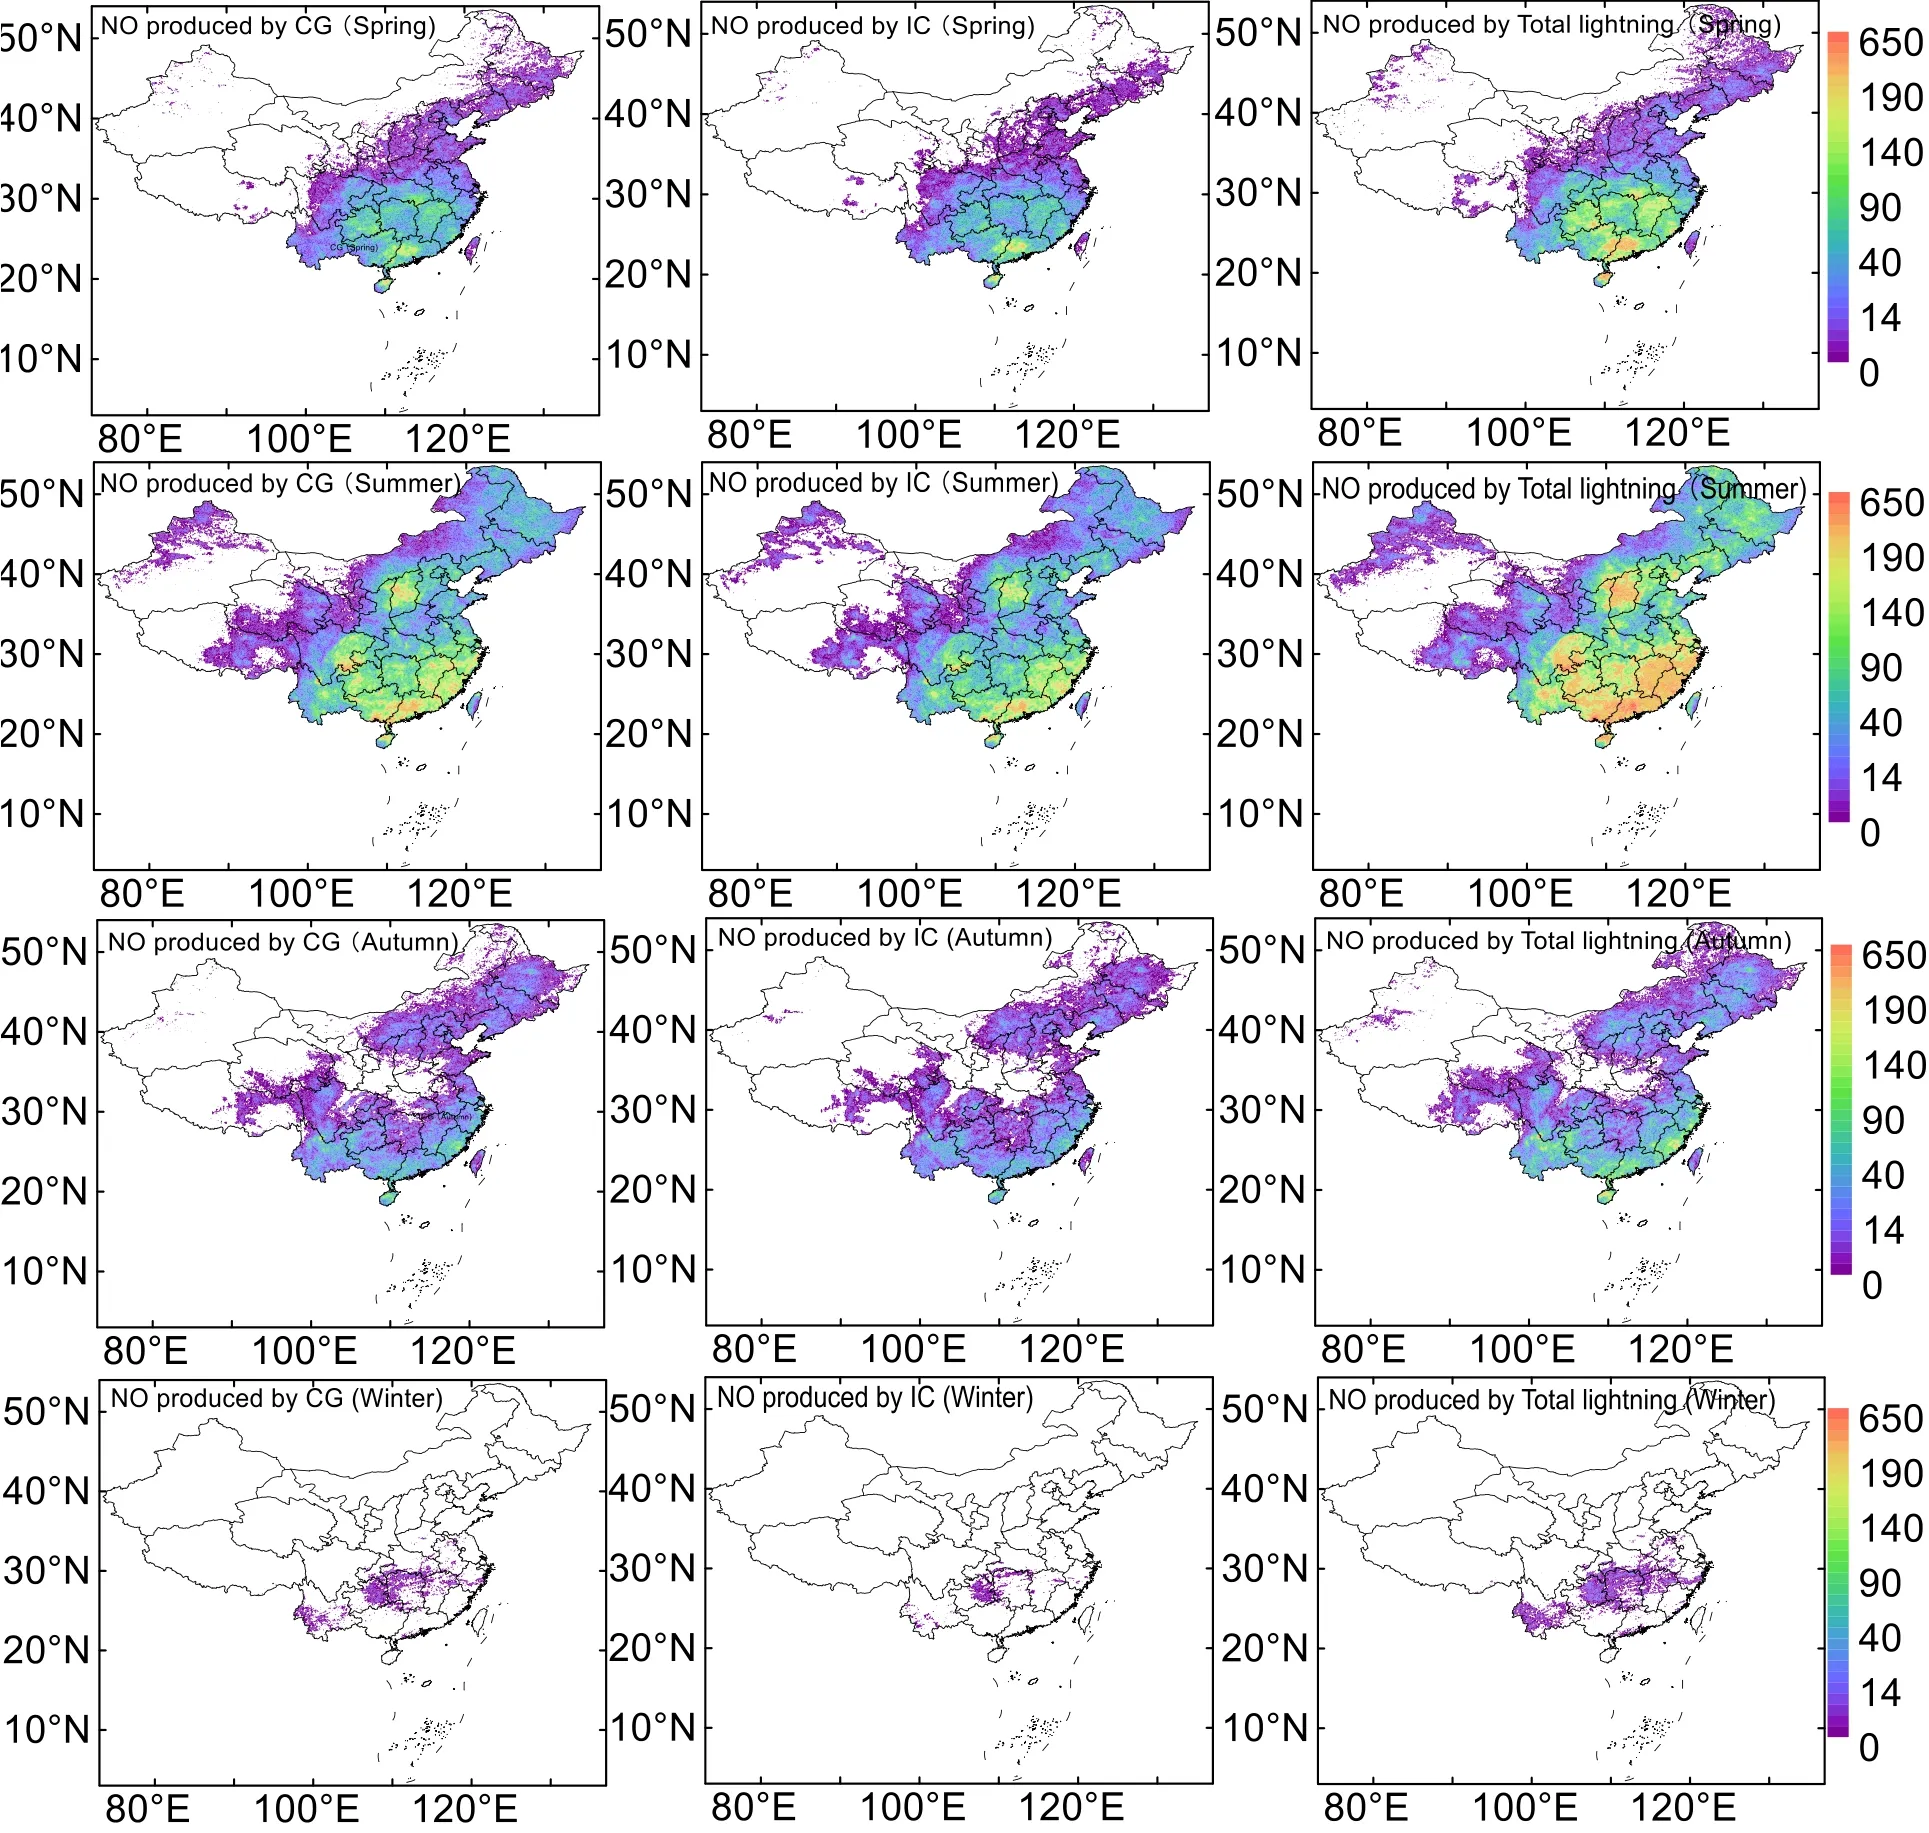
Fig.9.Seasonal spatial distribution of average LNO production (1014 molecules cm-2 month-1) in China from 2014 to 2018.

Fig.10.Monthly variation of LNO, and percentage of LNO produced by PCG, NCG, and IC in China from 2014 to 2018.

Fig.11.The annual output of LNOx under three groups of CG voltage.
Except for Zhou et al.(2003) and Zhang et al.(2014),all the studies estimated the total NOxin China.Estimates of 0.016-0.38 Tg(N) yr-1are shown in Table 2 and are made by considering the average LNOxper lightning flash and the number of the lightning flashes.Compared to previous results, our NOxestimate in China is larger because of our higher NOxestimate of a single lighting flash.
In Sun et al.(2004), the average LNOxper lightning flash was estimated as 0.45 × 1025molecules flash-1based on the average energy per lightning flash being 4.5 ×10⁷J.However, Sun et al.(2004) neglected the reduction effects of the optical thickness on the optical energy and the inversion from the optical energy to the total energy, thus underestimating the energy of a single flash.
The estimations by Ju et al.(2015) and Guo et al.(2017)are done by combining both lightning and NO2data observed by satellites.After establishing a fitting relationship between the NO2VCD and lightning on the Qinghai-Tibetan Plateau, Ju et al.(2015) obtained the single LNOxamount of 16.7×1025molecules flash-1and Guo et al.(2017)obtained the single LNOxamount of 20.87×1025molecules flash-1, which was smaller than the minimum mean single LNOxamount of 23.9 × 1025molecules flash-1used in this study.The height of thunderstorm clouds in the Qinghai-Tibet Plateau is relatively low, and the lightning channel length may be relatively short, which leads to the smaller LNOxamount of a flash (Zhang et al., 2014).So,the LNOxamount per flash on the Qinghai-Tibetan Plateau may be smaller than that for all of China.In addition, Zhou et al.(2003) and Zhang et al.(2014) both determined that the value of LNOxamount per flash based on the Tibetan Plateau is small.This also shows that the energy of lightning on the Qinghai-Tibet Plateau is relatively small.
Compared with the estimation of Zhou and Qie (2002),our estimate under group V3 is smaller.One reason is that their average LNOxper NCG flash is larger than ours, and LNOxgenerated by NCG flashes are dominant in the total LNOxamount.Since the breakdown voltage of NCG flashes(3×10⁸V) and the amount of NO per lightning flash (10 ×1016molecules flash-1) are the same between Zhou and Qie(2002) and this study, it is the amount of charge in Zhou and Qie (2002) which is larger than ours that causes their result to be larger than ours.However, it is not known whether they had more lightning flashes because their lightning flash number data was not published.
In this study, the average single lightning flash energy of PCG flashes, NCG flashes, and IC flashes is 8.53 × 10⁹J,4.78 × 109J, and 1.47 × 10⁹J under the minimum breakdown voltage group V3, respectively.These values are larger than the estimate of Sun et al.(2004) (4.5 ×10⁷J), but on the same order of magnitude as the estimations of Zhou and Qie(2002) (6.7 × 10⁹J and 0.67×10⁹J for CG flashes and IC flashes, respectively).The energy of a single lightning flash estimated in this study is relatively large for NCG flashes and is similar to the upper limits given by Wang et al.(1998)and Maggio et al.(2009), who suggest that the energy upper limit generated by a single lightning flash is 6 × 10⁹J and 7 ×10⁹J, respectively.
The energy of a single lightning flash estimated in this paper is relatively large, but may be acceptable.Accordingto our estimation of LNOxfrom the mainland of China[0.157-0.321 Tg(N) yr-1] and the ratio of land area of China to land area of the globe (6.44%), and assuming the value from the mainland of China is representative of global values, the global LNOxwould be between 2.44-4.98 Tg(N) yr-1,which corresponds relatively well with the range [2-8 Tg(N) yr-1] from Schumann and Huntrieser (2007).
5.Discussions
We added up the NOxgenerated by each lightning flash to obtain the total LNOxoutput in consideration of parameters such as the return peak current, lightning breakdown voltage, and lightning type, which can reduce the estimation error.In addition, the CG data covered the whole mainland of China, which can also help reduce estimation errors.Moreover, we compared the NOxproduction of IC flashes, CG flashes, and total lightning flashes under three groups of CG breakdown voltage values.However, the estimation method presented in this paper still has some limitations.The error sources mainly come from the following five aspects:
Firstly, because of the harsh environment in some areas,such as the Qinghai-Tibetan Plateau, there are few CG detector stations in these areas, which may cause the captured CG frequencies to be lower than the true values.Moreover,due to the lack of an adequate ground truth, the location accuracy and detection efficiency of this detector network in China have not been systematically evaluated, which can also add some uncertainties for estimates.The detection efficiency is lower for CG flashes in coastal sea regions, and the estimation is only made for the mainland of China, not including coastal sea regions.The LNOxin coastal sea regions should be estimated in future studies.Also in the future, the detection efficiency of the ADTD system is expected to be further improved, and its data will be of higher quality.Secondly, because the CG detector can only observe CG flashes, and all parameters of IC flashes were estimated, the amount of IC-generated NOxmay have greater uncertainty.The IC/CG ratio remains unclear to date, and it is assumed a constant value in this study; however, some researchers suggest that it is influenced by many factors and is not the same for different areas.To be more accurate, the IC/CG ratio still needs to be further studied.Thirdly, since the exact breakdown voltage value of lightning was not known, we estimated it by multiplying the air breakdown field strength threshold and the length of the lightning channel.However, the original height and channel length of each lightning flash were assumed in this study, which will also affect the estimation result.
Fourthly, the average LNO amount per CG flash estimated in this paper is relatively large.This is a result of the large average peak currents of CG flashes detected by the ADTD system.
The detection efficiency of the ADTD system is not enough to detect CG flashes with small peak currents, and thus, these CG flashes have not been included in our estimation.In this study, the average peak current of PCG in the mainland of China was between 50 kA and 75 kA (Fig.5),and that of NCG was between 35 kA and 50 kA (absolute value) (Fig.6).Du et al.(2002) analyzed the average CG peak current in northeast China, Beijing, and Guangdong based on the CG location data from the direction finding(DF) system provided by Lightning Location and Protection,Inc.of America.In their research, the average PCG peak current is 6.4-8.5 kA in low latitudes and 8-28.4 kA in higher latitudes; the average peak current of NCG is 3.9-7.8 kA (absolute value) in low latitudes and ~10 kA in higher latitudes.It can be found that the average lightning peak currents from Du et al.(2002) are all smaller than those of this study.Li et al.(2017) used the CG data from both the SAFIR (Surveillance et Alerte Foudre par Interferometrie Radiometrique) system and ADTD system to analyze CG characteristics for Beijing and its adjoining areas.They found that the average PCG peak current (24.4 kA) from the SAFIR system is smaller than the average PCG peak current (60.18 kA) from the ADTD system; also, the average NCG peak current(22.03 kA) (absolute value) from the SAFIR system is smaller than the average NCG peak current (35.13 kA) (absolute value) from the ADTD system.By using the data from the ADTD system from 2009 to 2016, Gao et al.(2019)found that the average PCG peak current is 63.5 kA and the average NCG peak current is 33.9 kA (absolute value) in Beijing, which is close to the values found in this study.For the reasons above, it can be concluded that the ADTD system tends to detect the CG flashes which have larger peak currents.
Based on CG data which have larger peak currents, the average charge per CG flash (~16 C for both PCG and NCG under group V3) has been calculated and is larger in this study than in other studies.This value is larger than that of both Maggio et al.(2009) (-8.7 C) and Baranski et al.(2012)(-9.6 C) because it is only the average of CG flashes whose peak currents are larger and not the average for all CG flashes.If the small-peak-current CG flashes had been added to the estimate, it would have been lower for the average LNO production per CG flash but larger for the total LNOxproduction estimation.In addition, laboratory results are usually collected from only one stroke, but the value presented in this paper is estimated by one or more than one stroke (see section 3.1, paragraph 1).Therefore, the CG data provided by the ADTD system have led to the overestimation of average LNO production per CG flash in this study.
At present, although the distribution of ADTD sensors and their detection efficiency could be improved, it is the only national CG detection network of the China meteorological department that covers the whole mainland of China.Therefore, analysis of the data collected by this system is helpful to further understand the characteristics of CG flashes in the mainland of China.If in the future the detection efficiency of the ADTD system is further improved and a better distribution of stations in northwest China is achieved, it will lead to more accurate estimations of LNOxproductionin the mainland of China.We plan to produce more accurate estimations in future studies.
Lastly, only the return stroke process is considered in this paper.Indeed, recent research indicates that an estimation of the NOxyield per lightning flash should be made by treating the lightning flash as a composite flash consisting of several discharge processes (Carey et al., 2016; Davis et al.,2019).At present, we cannot make such precise estimates because of our data limitations.Based on the data obtained from the CG location network, we were limited to the CG rate, peak current, and CG type (PCG and NCG), and then made an attempt to estimate the total LNOx.This estimation is therefore based on the CG location data.
The estimation method presented in this paper has some limitations and represents an attempt to estimate the amount of LNOxin China.The uncertainty range of LNOxremains large because of the assumptions made for the various estimates.It is necessary to do a quantitative analysis of the impact of the calculated LNOx.Quantitative analyses such as Monte Carlo simulations are a part of our future work plan.To estimate LNOx, the NO per lightning flash still needs to be further studied.
6.Conclusions
The estimated energy of each CG flash was based on the number of return strokes per CG flash, the peak current of each return stroke, and the assumed CG breakdown voltage.The estimated energy of IC was based on the estimated frequencies of IC and the assumed energy of each IC flash.Combining the energy of lightning and the number of NO molecules produced by unit energy, the total LNOxproduction in the mainland of China was determined.Some conclusions are as follows:
(1) The LNOxproduction varied according to the type of lightning; overall, except in the V3 group, the LNOxgenerated by IC is almost the same as that generated by NCG,and NCG produces the most LNOxwhile PCG produces the least amount of LNOx.CG, which had a lower frequency than IC, produced more NOxthan IC.The energy of lightning flashes is more important than lightning frequencies when estimating LNOx.If the total amount of LNOxis only the assumed average LNOxof single lightning flash multiplied by the lightning frequencies, the estimation can cause considerable errors (Beirle et al., 2014; Mecikalski and Carey,2018).
(2) The breakdown voltage of PCG is greater than that of IC or (NCG), while the latter has a greater output of LNOx.
(3) The annual production of LNOxin the mainland of China was estimated at 0.157-0.321 Tg(N) yr-1, corresponding to the high end of the range 0.016-0.38 Tg(N) yr-1from Table 2.The NOxof a single lightning flash estimated in this study is large because the energy of a single lightning flash estimated in this study is relatively large.Considering the estimation from this study [(0.157-0.321 Tg(N) yr-1] of LNOxfor the mainland of China and the ratio of the land area of China to the land area of the globe being 6.44%, and assuming the value for the mainland of China is an appropriate average for global values, the global LNOxis estimated to be in the range 2.44-4.98 Tg(N) yr-1, which correspond relatively well with the range [2-8 Tg(N) yr-1] from Schumann and Huntrieser (2007).
Acknowledgements.This research was supported by the National Natural Science Foundation of China (Grant Nos.91537209 and 91644224).We acknowledge the free use of cloudto-ground locating data from China Meteorological Administration.
 Advances in Atmospheric Sciences2023年1期
- Advances in Atmospheric Sciences的其它文章
- Understanding the Development of the 2018/19 Central Pacific El Ni?o
- Alternation of the Atmospheric Teleconnections Associated with the Northeast China Spring Rainfall during a Recent 60-Year Period
- The Importance of the Shape Parameter in a Bulk Parameterization Scheme to the Evolution of the Cloud Droplet Spectrum during Condensation
- Changes in Water Use Efficiency Caused by Climate Change, CO2 Fertilization, and Land Use Changes on the Tibetan Plateau
- Circulation Patterns Linked to the Positive Sub-Tropical Indian Ocean Dipole
- Multi-scale Incremental Analysis Update Scheme and Its Application to Typhoon Mangkhut (2018) Prediction