
Circulation Patterns Linked to the Positive Sub-Tropical Indian Ocean Dipole
2023-02-08 08:16:38ChibuikeChiedozieIBEBUCHI
Advances in Atmospheric Sciences 2023年1期
Chibuike Chiedozie IBEBUCHI
Institute of Geography and Geology, University of Würzburg, Am Hubland 97074 Würzburg, Germany
ABSTRACT The positive phase of the subtropical Indian Ocean dipole (SIOD) is one of the climatic modes in the subtropical southern Indian Ocean that influences the austral summer inter-annual rainfall variability in parts of southern Africa.This paper examines austral summer rain-bearing circulation types (CTs) in Africa south of the equator that are related to the positive SIOD and the dynamics through which specific rainfall regions in southern Africa can be influenced by this relationship.Four austral summer rain-bearing CTs were obtained.Among the four CTs, the CT that featured (i) enhanced cyclonic activity in the southwest Indian Ocean; (ii) positive widespread rainfall anomaly in the southwest Indian Ocean;and (iii) low-level convergence of moisture fluxes from the tropical South Atlantic Ocean, tropical Indian Ocean, and the southwest Indian Ocean, over the south-central landmass of Africa, was found to be related to the positive SIOD climatic mode.The relationship also implies that positive SIOD can be expected to increase the amplitude and frequency of occurrence of the aforementioned CT.The linkage between the CT related to the positive SIOD and austral summer homogeneous regions of rainfall anomalies in Africa south of the equator showed that it is the principal CT that is related to the inter-annual rainfall variability of the south-central regions of Africa, where the SIOD is already known to significantly influence its rainfall variability.Hence, through the large-scale patterns of atmospheric circulation associated with the CT,the SIOD can influence the spatial distribution and intensity of rainfall over the preferred landmass through enhanced moisture convergence.
Key words: subtropical Indian Ocean dipole, circulation types, rainfall, South Indian Ocean, moisture convergence
1.Introduction
The inter-annual variability of rainfall in southern Africa during austral summer is to a large extent related to sea surface temperature (SST) anomalies in the southwest Indian Ocean (Reason and Mulenga, 1999).According to Rapolaki et al.(2020), from January to April, the tropical northwest Indian Ocean and the northern Agulhas current are the major sources of moisture to southern Africa.Climatic modes in the south Indian Ocean are known to be associated with extreme events in southern Africa such as floods and drought (Reason, 2001; Manatsa et al., 2008), influence the spatial pattern and frequency of tropical cyclones in the south Indian Ocean (Ho et al., 2006; Ibebuchi, 2022a), and even modulate the southern Africa precipitation response to the El Ni?o Southern Oscillation (ENSO) signal (Hoell et al., 2017).The primary inter-annual climatic modes in the Indian Ocean are the tropical Indian Ocean dipole (Saji et al., 1999), and the subtropical Indian Ocean dipole (SIOD)(Behera and Yamagata, 2001), with ENSO having rather a remote influence (Meehl, 1987; Hermes and Reason, 2005;Ibebuchi, 2021c).These climatic modes, through the modulation of regional atmospheric circulation patterns, can influence the intensity and spatial distribution of rainfall in southern Africa (Xue et al., 2003; Reason and Jagadheesha,2005; Manatsa et al., 2008; Lim and Hendon, 2017;Ibebuchi, 2021a, c).The SIOD is phase-locked in the growing season of southern Africa (Behera and Yamagata, 2001) and its positive phase has been linked to above-average austral summer rainfall over parts of southern Africa (Reason,2002), which can impact food security and agricultural activities.This study is dedicated to extending the understanding of the relationship between the positive SIOD climatic mode and the austral summer rain-bearing circulation types(CTs) in Africa south of the equator, and how this relationship might explain the large-scale patterns of atmospheric circulation through which the positive SIOD might influence the intensity and spatial distribution of rainfall at specific regions in Africa south of the equator.
Generally, the hydroclimate of southern Africa can be modulated by climatic modes, which also include the Southern Annular Mode (SAM) (Thompson and Wallace, 2000;Reason and Rouault, 2005; Ibebuchi, 2021a).The dynamics through which most of the climatic modes influence the regional rainfall of southern Africa have been widely discussed (e.g.Reason, 1999; Fauchereau et al., 2003;Ibebuchi, 2021a, c).During El Ni?o years, a possible weakening of moisture advection arising from a weakening of the circulation in the Angola low and the western portion of the Mascarene high is expected to cause a north-eastward shift of the South Indian Ocean Convergence Zone (SICZ), which is the major large-scale system that modulates the austral summer rainfall variability in southern Africa.This might cause anomalous drying of preferred regions in southern Africa(Cook, 2000; Reason and Jagadheesha, 2005; Ibebuchi,2021c).The SICZ is a diagonal region of enhanced precipitation that extends from the equator toward the South Indian Oceans (Cook, 2000).The strength and location of the SICZ are principally governed by low-level moisture convergence resulting from moisture transport from the tropical South Atlantic Ocean through the cyclonic circulation of the Angola low, and moisture transport from the southwest Indian Ocean, through the anticyclonic circulation at the western branch of the South Indian Ocean high-pressure (Cook,2000; Lazenby et al., 2016).Also, moisture advection from the tropical Indian Ocean by the northeast monsoon winds enhances the SICZ.The South Atlantic Ocean's high-pressure drives moisture offshore.Evaporation within the Agulhas region, continental heating, and anomalies in sea surface temperature (SST) at the adjacent oceans, which might be influenced by the semi-permanent high-pressure systems, can also influence the SICZ (Walker, 1990; Vigaud et al.,2009).
The SIOD which is associated with a zonal SST gradient between the south of Madagascar and off the west coast of Australia influences both the availability of moisture in the southwest Indian Ocean and moisture transport to the eastern landmass of southern Africa.During its positive phase,above-average rainfall might be expected in large parts of southern Africa since SST warms in the southwest Indian Ocean (Reason, 2001).The SIOD normally develops between November and December, peaking in January-February, and decaying around March-April (Behera and Yamagata, 2001).Morioka et al.(2010) noted the importance of seasonally varying mixed-layer depth on the development and decay of the SIOD.
The dynamical processes leading to the development of the SIOD are well documented by Behera and Yamagata(2001); Morioka et al.(2010) and Reason (2001).Generally,austral summer atmospheric processes such as the adjustment of the Mascarene high contribute to the foundational dynamics that can trigger the SIOD.The foci of the current study are to (i) apply the concept of obliquely rotated T-mode (i.e.,variable being the time series and observations are grid points) principal component analysis (PCA) circulation typing technique (Richman, 1986; Huth, 1996; Ibebuchi, 2021a,c) in isolating austral summer (JFM) rain-bearing CTs in Africa south of the equator; (ii) investigate the CTs that are related to anomalies of the positive SIOD; (iii) apply the rotated S-mode (i.e., the variable is grid points and observations are time series) PCA regionalization technique in obtaining homogeneous regions of austral summer rainfall anomalies in Africa south of the equator; and (iv) investigate how the selected JFM rain-bearing CT(s) obtained in (ii) influence the intensity and spatial distribution of rainfall at the homogeneous regions of summer rainfall anomalies obtained from(iii).Thus, this study contributes to the improved understanding of the mechanisms through which the positive SIOD influences austral summer rainfall variability at preferred regions in southern Africa, through the modulation of the frequency and amplitude of regional CTs.
2.Data and methodology
2.1.Data
The data sets used in this paper are obtained from the NCEP-NCAR reanalysis data (Kalnay et al., 1996), at the horizontal resolution of 2.5° longitude and latitude for the period of 1979 to 2019.The data are obtained at daily and monthly temporal resolutions.Reanalysis precipitation data is obtained on a Gaussian grid type for the JFM months.Gridded precipitation data obtained from the Climate Prediction Center (CPC) (Xie et al., 2007) for the 1981-2010 period is used to validate the NCEP-NCAR precipitation data.Both data sets are interpolated to a common 0.75° longitude and latitude resolution using first-order conservative remapping(Jones, 1999).SST data sets are obtained from COBE-SST data (Japan Meteorological Agency, 2006) and NOAA extended reconstructed SST, version 5 (Huang et al., 2017)during the analysis period at monthly horizontal resolutions during the JFM months.
2.2.The subtropical Indian Ocean dipole Index
Before the analysis, the COBE-SST data was used in validating the monthly NOAA extended reconstructed SST data during the analysis period.Afterward, the NOAA SST data was used in calculating the subtropical Indian Ocean dipoleindex (SDI) for the 1979-2019 JFM months.Though the dipole SST pattern of the SIOD might move around under different events, Behera and Yamagata (2001) defined the SDI as the SST anomaly difference between the western (55°-65°E, 37°-27°S) and eastern (90°-100°E, 28°-18°S) part of the subtropical southern Indian Ocean since it reproduces the time series of the SST pattern that is close to the SIOD SST mode.Thus, the SDI is calculated similarly in this work.The western and eastern boxes in Fig.A1 show the regions used in calculating the SDI.Strong JFM positive SIOD years within the analysis period are subjectively defined using > 1.0 standardized SDI.For the classified strong positive SIOD years, SST and 10 m wind composite anomalies are calculated with respect to the 1981-2010 JFM climatology.The block permutation test is used to test the statistical significance of the anomalies at each grid box.By applying correlation analysis, the SDI is used in investigating rain-bearing CTs in Africa south of the equator (during JFM) that are statistically related to the SIOD climatic mode.
2.3.Classification of the circulation types
Since the target region of this study are landmasses in Africa south of the equator, the extent for the CT classification is 5.25°-55.25°E and 0°-50.25°S.The adjacent oceans are included since they act as moisture sources for the landmasses.The classification procedure of the CTs in this work is the same as used in previous studies (Ibebuchi, 2021a, c).CTs are continuous and overlap (i.e., they are not confined to occur at a specific time/season) though they can be dominant at specific seasons.Thus, the full seasons in a year are used for the CT classification to accurately obtain the time distribution of the CTs in the PCA process.However, since the SIOD is phase-locked in austral summer, the analysis of the selected dominant austral summer rain-bearing CTs is focused on when they occurred during the JFM months in the analysis period.
For the classification of the CTs in Africa south of the equator, obliquely rotated PCA was applied to the daily zscore standardized T-mode SLP data from NCEP (Richman,1981) for the 1979-2019 period.Kidson (1997) reported that SLP provides a good representation of synoptic-scale systems and explains the relationship between topography and low-level flow.Previous studies compared the CTs from SLP obtained from relatively higher resolution reanalysis products (i.e., ERA5) with NCEP (e.g., Ibebuchi, 2022a).The results showed that both reanalysis products (i.e.,ERA5 and NCEP) give similar results using the CT classification in the study region.The z-score standardization gives equal weight to all days.Daily data are used for the classification since the synoptic patterns influence surface variables such as precipitation, in at least daily time scales.
The correlation matrix is selected to relate the time series, and singular value decomposition is used to obtain the eigenvalues, eigenvectors, and PC scores.The eigenvectors localize in time the patterns captured by the PC scores(Compagnucci and Richman, 2008).The eigenvectors multiplied by the square root of their corresponding eigenvalues changes the magnitude of the vectors, henceforth referred to as PC loadings (Richman and Lamb, 1985).Given that components associated with extremes in rainfall are usually rare,as mostly represented in higher PCs, the decision of the number of components to retain is made following Ibebuchi(2021b); i.e., adding and rotating the components iteratively till the newly added component does not uncover a new pattern but represents an extreme case of already delineated vectors.
The oblique rotation using the Promax routine (Hendrickson and White, 1964) at a power of 4 (Richman, 1986),relaxes the orthogonality constraint on the PC scores; and results in a simple structure (making near-zero loadings to be closer to zero) so that each retained component groups variables that are highly correlated.For a given retained component, the ±0.2 hyperplane threshold (Richman and Gong,1999) is used to separate loadings within the zero-interval(noise) from the signal.Thus each retained component forms two groups (one positive, one negative), above and below the |0.2| threshold and the mean SLP of the days in each class is the CT.A day in the analysis period is assigned to a CT if it can be associated with the signal (i.e.,loading magnitude > ±0.2) under the CT in question.Precipitation composite anomalies of the CTs are calculated with respect to the JFM climatology, i.e., as the difference between the composite map of the days the CTs occurred during JFM and the composite map of the JFM climatology from 1981 to 2010.The non-parametric block permutation test is applied to obtain grid points with statistically significant positive rainfall anomalies in the landmasses under each CT.Since the landmasses in the study region are quite large, with heterogeneous climate types-ranging from the tropical climate in the northern region; the subtropical climate in some southern regions; the desert climate in some southwestern regions; and the Mediterranean type of climate in the southernmost tip (i.e., the Western Cape) -the decision of CTs designated as rain-bearing is subjective with respect to a specific region(s) where the CT influences most.Thus,for a given CT, by the nature of its synoptic features, it can be associated with above-average rainfall mainly at specific domains in the landmasses.To simplify the characterization of rain-bearing CTs, over the landmasses in the study region,the following subjective criteria are considered: (i) the magnitude of precipitation amount spatially averaged over the landmasses under the CT in question; (ii) the magnitude of precipitation amount temporally averaged under the CT in question; and (iii) number of grid points with statistically significant positive rainfall anomalies that can be a function of(i) and (ii).
For further analysis of the selected rain-bearing CTs during JFM when they occurred, composites of SLP; precipitation; vertical velocity, moisture flux convergence, relative vorticity, and moisture flux at 850 hPa are analyzed.The 850 hPa is used since it is the height above the eastern escarpment.
2.4.Correlation analysis between the SDI and the circulation types
As per the design of the PCA classification, a given retained component comprises opposing states of the same atmospheric mode (i.e., the positive and negative phase of the mode).A classified mode, in this work, is defined as the rotated retained PC comprising positive and negative loadings.Ibebuchi (2021a, c) related the same classified modes in this work, as shown in Fig.A2, to the ENSO and the SAM climatic modes.For example, a statistically significant correlation between the positive (negative) phase of the classified mode with the ENSO/SAM positive (negative) phase was interpreted as being anomalies of ENSO/SAM positive(negative) phase related to the positive (negative) phase of the classified mode.It was also interesting that the signature of the phase of the teleconnection pattern can be found in the spatial and temporal pattern of the classified mode that correlates with it.For example, in Ibebuchi (2021a), the mode related to positive (negative) SAM (i.e., mode 3 comprising of CT3+/CT3- from Fig.A2) was found to be associated with enhanced (suppressed) SLP in the mid-latitudes as obtained during positive (negative) SAM events.In Ibebuchi (2021c), the mode/CT related to El Ni?o (i.e.,CT5-) was associated with enhanced cyclonic activity in the tropical Indian Ocean and a weaker state of the Mascarene high pressure, which are the signals of El Ni?o in the Indian Ocean (e,g., Cook, 2000).Similarly, within the regional context of Europe, a physically realistic relationship was established between the North Atlantic Oscillation and the classified modes (Ibebuchi, 2022b).Thus, when a statistically significant correlation exists between the anomalies of a climatic mode such as ENSO and the classified circulation modes,the signature of the climatic mode is physically represented in the classified circulation mode in question.Here, the analysis is extended by relating the JFM SDI (representing the SIOD climatic mode) with the JFM PC loadings of the classified circulation modes in Fig.A2.The non-parametric Kendall’s Tau-b is used for checking the statistical significance of the correlations at a 95% confidence level.
2.5.Regionalization of summer precipitation
Austral summer homogeneous regions of rainfall anomalies are obtained using obliquely rotated PCA applied to the detrended monthly rainfall totals represented in the S-mode structure (Richman and Lamb, 1985).Gong and Richman(1995) noted that the fuzziness of PCA loadings (i.e., a grid point can be grouped under more than one class depending on the choice of hyperplane threshold) can make the rotated S-mode PCA regionalization technique superior to other clustering techniques based on hard classifications since the causal mechanisms of precipitation are continuous/overlaps.The spatial extent for the regionalization is 0°-36°S and 9°-50.25°E; it includes also the adjacent oceans which have the advantage of revealing maritime moisture source regions that might influence rainfall in specific landmasses.The regionalization step is similar to the CT classification.However, the number of components to retain is based on matching the rotated PC loadings to the correlation patterns and only components with congruence match (i.e., congruence coefficient) ≥ 0.9 are kept.Further major differences between the T-mode analysis (for circulation typing) and the S-mode analysis (for regionalization) are (i) in the T-mode analysis the SLP data is pre-processed by standardizing it to give equal weights to all days; but in the S-mode analysis, the precipitation data is detrended to remove the trend component of the time series: thus the analysis seeks to identify homogeneous regions of rainfall anomalies; (ii) the loadings in the T-mode (S-mode) are temporal patterns (spatial patterns) and the scores are spatial patterns (temporal patterns).
Similar to the time series of the T-mode analysis, the scores from the S-mode analysis are characterized by opposing phases of the same precipitation regime-i.e., the dry phase and the wet phase.Here the focus is on the wet phase.The wet (dry) phase is made known by examining the phase that is associated with positive (negative) rainfall anomaly values in the classified region of interest when composite anomalies of rainfall are calculated with respect to the climatology.Similar to the interpretation of the correlations in section 2.4, correlation analysis is done with the classified mode(s)linked to the SDI and the PC scores from the precipitation regions, during the JFM months.The analysis aims to examine if the classified mode (i.e., CTs) related to the SIOD significantly modulates the development of a given precipitation region.Thus, the structure of the analysis can be interpreted as follows: (i) the positive SIOD signal can be downscaled to control regional CT(s) in southern Africa; (ii) and the signal of the regional CT(s) in question can be downscaled further to impact rainfall variability at specific domains through the impact on the time development of associating precipitation region/regime.
Furthermore, for the precipitation region(s) modulated by the CT(s) with the SIOD signal, the mechanism that might be associated with the temporal development of the precipitation regions was analyzed.Since the temporal behavior of the respective precipitation regimes is categorized by the associating PC scores (Compagnucci and Richman, 2008),the scores might be interpreted as the amplitude of the atmospheric signal associated with the region over the analysis period and can reveal when the rainfall anomaly is most obvious (i.e., when the amplitudes are high).A subjective threshold of ±0.5 (the mathematical sign to use depends on which phase is wet) is used to cluster months during the wet phase of the regime.The threshold is used since the composite patterns resemble the patterns from the PC loadings at the threshold value.Composite anomalies of moisture flux at 850 hPa,SLP, moisture convergence, and relative vorticity are used to further analyze the mechanisms associated with the time development of the region.A test for statistical significance for the composite anomalies is made using the block permutation test.
3.Results
3.1.Positive phase of the subtropical Indian Ocean dipole mode
Figure 1 shows the SST composite anomalies during strong positive SIOD events with respect to the 1981-2010 climatology.Based on the > 1.0 standardized SDI threshold,during the analysis period, 1981, 1982, 2006, and 2017,were selected as years with strong positive SIOD signal during JFM.It can be seen that the positive SIOD SST pattern is associated with warm SST anomalies south of Madagascar and cool SST anomalies off the western coast of Australia.Also, Fig.1 indicates anticyclonic circulation anomalies over much of the South Indian Ocean, as also noted by Behera and Yamagata (2001) during strong positive SIOD events.
3.2.JFM climatology of precipitation and atmospheric circulation in Africa south of the equator
Figure 2 shows the JFM precipitation climatology from the CPC and NCEP-NCAR data sets.During austral summer, the western subtropical region in southern Africa is relatively drier due to a combination of its proximity to the cold Benguela current and to the anticyclonic circulation of the South Atlantic Ocean high-pressure, which drives moisture offshore.Also, the Botswana high that exists at mid-levels(e.g., near 500 hPa) over Botswana/Namibia contributes to the strongly stable atmosphere and subsidence in this region(Reason, 2016).However, the eastern region of southern Africa near the Mozambique Channel and the Agulhas current are relatively wet.Based on the spatial correlation coefficient(R=0.8), the NCEP-NCAR reanalysis mirrors the spatial variation of austral summer precipitation in the study region as obtained from the CPC data set.Nonetheless, there are marked differences in the magnitude of precipitation from both data sets, especially in the central equatorial region and the northeastern parts of South Africa where the NCEPNCAR reanalysis overestimates precipitation.Also, this dataset does not adequately resolve the tight rainfall gradients or topographic influences on rainfall.It should be equally noted that according to Thorne et al.(2001), the CPC method incorporates real-time rain gauge data where sufficient rain gauges are available.
According to the JFM SLP climatology, the Mascarene high is located southward of its climatological position during austral winter (Fig.3).Thus, it drives moist southeast trade winds that converge with the moist cross-equatorial northeast trade winds over the tropical South Indian Ocean, enhancing the convergence within the Inter-Tropical Convergence Zone (ITCZ).As a result, from about 50°E eastward, north of Madagascar, the vertical velocity at 850 hPa is negative(representing upward motion) and relative vorticity is negative (implying cyclonic vorticity) so that precipitation is enhanced in this region.Also, the flux of moisture in these regions is altered from easterly to westerly by the cyclonic circulation.To the northwest of Madagascar, the cross-equatorial northeasterly moisture transport penetrates both the southern African mainland and the Mozambique Channel where they become westerly and converge with southeasterly moisture transport.Thus, a region of enhanced cyclonic relative vorticity is evident in the Mozambique Channel, referred to as the Mozambique Channel Trough (MCT).The MCT plays a vital role in the hydroclimate of Madagascar and northern Mozambique.Also, the MCT can influence the inter-annual variability of rainfall in the southern African mainland (Barimalala et al., 2020).The MCT, in addition tothe high topography of Madagascar, prevents direct moisture advection into the southern African mainland from the southwest Indian Ocean.This is because the topography of Madagascar deflects moist easterly winds from the Mascarene high towards the south of Madagascar and then the MCT alters the easterly moisture flux to the northwest (Barimalala et al., 2018).

Fig.1.JFM composite of SST anomaly and surface wind anomaly for years with strong positive SIOD events.Anomalies were calculated as JFM mean for 1981, 1982, 2006, and 2017 minus JFM mean for the 1981-2010 period.Black contour lines and color-filled regions show where the SST anomalies exceed the 90% confidence limit based on the block permutation test.The contour interval is 0.2°C.Thick contours (and red shading) show positive SST anomalies; dashed contours (and blue shading) show negative SST anomalies.Green vectors represent wind anomalies.The wind vector scale is shown above the map.The selected positive SIOD years are those when the JFM standardized SDI exceeded the 1.0 threshold.

Fig.2.JFM precipitation climatology for 1981-2010 from the (a) CPC and (b) NCEP-NCAR data sets.

Fig.3.JFM climatology for the 1981-2010 period for (a) vertical velocity (color), SLP (black contour lines), and moisture flux at 850 hPa (green vectors, vector scale shown at top), (b)divergence (color) and relative vorticity (black contour lines), thick contours indicate positive relative vorticity, dashed contours indicate negative relative vorticity (contour interval of 5 × 10⁻⁶ s-1),and (c) precipitation (mm d-1).
A low-pressure system is equally evident in southern Angola and northern Namibia.Figure 3b shows that the lowpressure system is characterized by enhanced low-level convergence and cyclonic relative vorticity.This is because the cross-equatorial moist northeast wind and moist westerly wind from the tropical southeast Atlantic Ocean feed into this system; hence by the nature of this cyclonic circulation,moisture is transported to the eastern parts of southern Africa (Reason and Smart, 2015).This system is called the Angola low.As the Mascarene high ridges into the northeastern parts of South Africa, southeasterly moisture fluxes also penetrate the southern African region through the warm Agulhas and Mozambique currents, so that low-level fluxes of moisture converge in the eastern regions.Over the southern African area, upward motion is evident, which can be attributed to a combination of continental heating during the austral summer season and low-level moistening of the boundary layer.The maritime regions with enhanced cyclonic relative vorticity and upward motion receive the highest rainfall while regions with anticyclonic relative vorticity and downward motion, such as over the semi-permanent high-pressure system and its ridging northeast of South Africa, receive less rainfall owing to enhanced subsidence.
3.3.Circulation types in Africa south of the equator
Figures A2 and A3 show the classified CTs in the study region, and their dominant periods, respectively.The CTs are patterns of atmospheric circulation in Africa south of the equator, characterized by the different modes of SLP variability.The seasonal distribution of positive and negative phases of CTs is mostly asymmetric because each analyzed PC component can be designated as a mode of variability and the positive and negative phases are opposing states of the same atmospheric mode, i.e., their respective patterns can neither occur at the same time nor dominate in a given period (e.g., month), resulting from the asymmetry.Also, seasonality such as seasonal variations in diabatic heating and migration of the ITCZ contributes to the occurrence of the CTs over time and their mechanism.Thus, though the CTs can occur at any time of the year given the imprecise/fuzzy nature of atmospheric processes, their dominant periods can be documented as in Fig.A3.
CT1+, CT3-, CT4+, CT5+, CT6+, CT7- tend to dominate during the colder months in the southern hemisphere(i.e., May to August).Conversely, their inverse phases (i.e.,CT1-, CT3+, CT4-, CT5-, CT6- and CT7+) tend to dominate during the warmer months in the southern hemisphere(i.e., November to March).During austral winter (JJA and the adjacent months), the ITCZ is positioned more equatorward.This can imply (i) a more northward track of the southern hemisphere mid-latitude cyclone, leading to enhanced westerly winds over large parts of southern Africa; and (ii)dominance of the subtropical high-pressure over the southern African region.Both scenarios lead to rainfall suppression in large parts of southern Africa.Such seasonal patterns are characterized by the SLP modes (i.e., CTs in Fig.A2).CT1+and CT3- characterize the circulation pattern associated with the northward track of the mid-latitude cyclones during the winter season.CT4+, CT5+ and CT6+ and CT7- characterize the circulation pattern associated with enhanced anticyclonic activity over the landmasses.During the inverse phase of the CTs (i.e., in the warmer seasons when SST is also enhanced over the adjacent oceans as can be inferred from the enhanced cyclonic activity in the southwest Indian Ocean under the warm season CTs), diabatic heating is enhanced, the ITCZ and the subtropical highs are located more southward, and so asymmetric patterns (opposing their inverse phases) that enhance rainfall formation become plausible (as can be inferred from Table 1).Generally, as noted by Morioka et al.(2015) the northward (southward)migration of the subtropical high-pressure systems that is evident during the colder season (warmer season) dominant CTs is associated with the suppression (enhancement) of rainfall over southern Africa.

Table 1.Temporal and spatial median anomaly values of precipitation under each of the classified CT.(*) implies CTs with values greater than 2 mm d-1.
Further, some of the other CTs are dominant during the transition seasons, i.e., austral spring and autumn, for example, CT9+/CT9-; while some of the other CTs do not show the tendency of seasonality.Moreover, the imprint of climate drivers can be found in most of the CTs (e.g., Ibebuchi,2021a, b) so that anomalies of climate drivers can equally control the occurrence and amplitude of the CTs over time.
3.4.Selected JFM rain-bearing CTs in Africa south of the equator
For all the classified CTs, Table 1 shows the temporal and spatial anomaly values of precipitation.Subjectively using > 2.0 mm threshold to characterize rain-bearing CTs,CT5-, CT6-, and CT7+ (i.e., from Fig.A2) are further selected.CT9- is also included even though it falls short of the criteria; nonetheless, subsequent analysis indicates it can be associated with significantly above-average rainfall in specific domains.From Fig.A3, overall all the aforementioned selected CTs are dominant during late austral spring to early austral autumn.As already noted, since the landmasses are very large with heterogeneous climate types, the so-called rain-bearing CTs were subjectively selected because their mechanisms (as explained below) can significantly bring about above-average rainfall over considerable parts of the continent.Table 1 (and highlighted further figures) indicated that the selected CTs have more grid points associated with above-average rainfall, when the composite anomalies are computed and tested for statistical significance at each grid box.
Figures 4 and 5 present the composite patterns of the four selected JFM rain-bearing CTs in Africa south of the equator.Figure 6 shows the anomalous rainfall patterns that are associated with them.The general attributes of the CTs are (i) enhanced low-level cyclonic relative vorticity and moisture flux convergence in southern Angola and northern Namibia; and (ii) moisture fluxes into southern Africa mainland from the tropical South Atlantic Ocean, the tropical Indian Ocean, and the southwest Indian Ocean.Variability in the strength and location of the semi-permanent high-pressure systems and the MCT, coupled with the associated implications for the regional patterns of moisture transport, mark the differences in the large-scale atmospheric circulation patterns under each CT.The JFM composite of CT6- features(i) enhanced downward motion within the western branch of the Mascarene high south of Madagascar and (ii)enhanced anticyclonic relative vorticity within the western branch of the Mascarene high, ridging into the northeastern parts of South Africa.This results in enhanced low-level southeasterly moisture fluxes into the southern African mainland.Coupled with moisture fluxes from the tropical South Atlantic Ocean and the tropical Indian Ocean, under this CT6- pattern, enhanced and widespread moistening of the boundary layer can be generally expected in the study region.Indeed, the rainfall composite reveals a positive rainfall anomaly across most of Africa south of the equator,extending diagonally into the South Indian Ocean.However,within the western branch of the Mascarene high and its ridging into parts of eastern regions of southern Africa, rainfall is significantly reduced, possibly due to subsidence.Thus,CT6- can be associated with rainfall in large parts of the region during JFM, except for the eastern regions where the Mascarene high ridges into the northeastern parts of South Africa.
The large-scale features of CT5- and CT7+ are similar in the sense that, unlike in CT6-, the western branch of the Mascarene high is relatively weakened.Thus, southeasterly moisture fluxes into the southern African mainland arise mainly through the activity of the South Atlantic Ocean high-pressure ridging south of South Africa, where enhanced anticyclonic circulation, downward motion, and low-level anticyclonic relative vorticity are evident during these CTs (Figs.4 and 5).Southeasterly moisture fluxes by the Mascarene high, which is located further to the east, are deflected southward under these CTs by the Madagascar topography and are partly adjusted to westerly by the MCT.Given a weaker state of the Mascarene high, both CTs are associated with enhanced cyclonic activity in the southwest Indian Ocean.Under CT7+, a continental tropical low is evident in the western parts of southern Africa, and enhanced upward motion extends from Angola, off the southeast coast of South Africa.As a result, both the eastern part of southern Africa and the southwest Indian Ocean are significantly moist (Fig.6).Under CT5-, enhanced upward motion is evident in the Oceans southeast of Madagascar; thus, this region is significantly moist.Recall CT5- is the same CT related to El Ni?o, as documented in Ibebuchi (2021c).Here,its composite patterns further reveal that in addition to disrupting moisture fluxes advected by the South Atlantic Ocean high pressure ridging south of South Africa, El Ni?o weakens the hydroclimate of southern Africa by enhancing upward vertical motion and wet conditions over the western branch of the Mascarene high (i.e., further weakening of anticyclonic circulation and moist southeast winds).A plausible reason why rainfall is mostly enhanced to the east compared to CT6- may be due to weaker advection resulting from the weaker state of the Mascarene high.Thus, areas close to the southwest Indian Ocean receive rainfall under CT5- and CT7+ and advective flow is through the activity of the South Atlantic Ocean high-pressure, ridging south of South Africa (Fig.6).
Under CT9-, the MCT is relatively more active.This results in the lessening of moisture fluxes from the tropical Indian Ocean in penetrating the Angola low since cross-equatorial northeast winds are adjusted to westerly towards Madagascar by the MCT and southeast trade winds are more westerly.The direct implication is above-average rainfall in Madagascar and northern Mozambique but diminished rainfall in southern Africa (e.g., Barimalala et al., 2020).While CT9-is not explicitly rain-bearing in southern Africa (Table 1), it is associated with above-average rainfall in Madagascar.
The analysis of CT6- and CT9- indicates that due to the high topography of Madagascar and the MCT, the strength of the anticyclonic circulation within the western branch of the Mascarene high controls the extent of moisture advection into southern Africa by southeast winds, and also controls the degree with which cyclonic/convective activity might be widespread over the southwest Indian Ocean.When the western branch of the Mascarene high is weak, e.g., CT7+, enhancement of convective activity, as indicated by significant cyclonic and positive precipitation anomaliesunder CT7+, can be expected to be widespread over the southwest Indian Ocean.
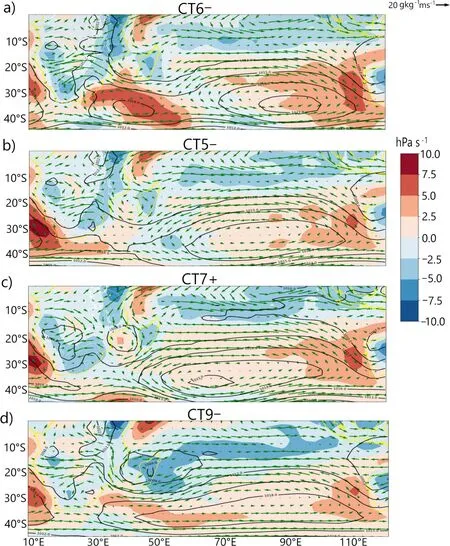
Fig.4.JFM rain-bearing circulation types in the study region.Black contour is SLP at 3 hPa intervals.Color is vertical velocity.Vectors represent moisture flux (scale at top of figure).
3.5.Correlation between the selected classified modes and the subtropical Indian Ocean dipole
Correlation analysis was used to relate the inter-annual variability in the amplitudes of the classified modes and the anomalies of the SDI, during JFM.Table 2 shows the results.It can be seen that within the analysis period, the SDI can be related to mode 4 (i.e., CT4+/CT4-) and mode 7(i.e., CT7+/CT7-).The negative (positive) correlation under mode 4 (mode 7) implies that positive SIOD is related to CT4- (CT7+).Figure A2 shows that both CTs(i.e., CT4- and CT7+) have something in common: the western branch of the Mascarene high is weak, allowing enhanced cyclonic activity in the southwest Indian Ocean.This is more evident under CT7+, which accounts for why it is relatively more rain-bearing (c.f.Table 1).The correlations imply that positive SIOD can increase the amplitude of CTs associated with enhanced cyclonic activity in the southwest Indian Ocean.Since CT7+ is selected to be rain-bearing and the correlation between the SIOD is also stronger with mode 7, further analysis is focused on CT7+.
A statistically significant relationship was found also between the frequency of occurrence of CT7+ and the SDI(R = 0.4), during JFM.On average, years with above-averageSDI are likely to be associated with an above-average frequency of occurrence of CT7+ (Fig.7).Thus, there could be a modulation of the positive SIOD climate signal over the occurrence of CT7+.According to Reason (2001), the major mechanism through which the positive SIOD brings enhanced rainfall to parts of southern Africa is enhanced warming and cyclonic activity in the southwest Indian Ocean; resulting in more moisture available to be advected into large parts of southern Africa by the anomalous southeast winds (c.f.Fig.1).Under CT7+ the southwest Indian Ocean is significantly moister as a result of enhanced cyclonic activity in this region, making the relationship between CT7+and the positive SIOD physically realistic.
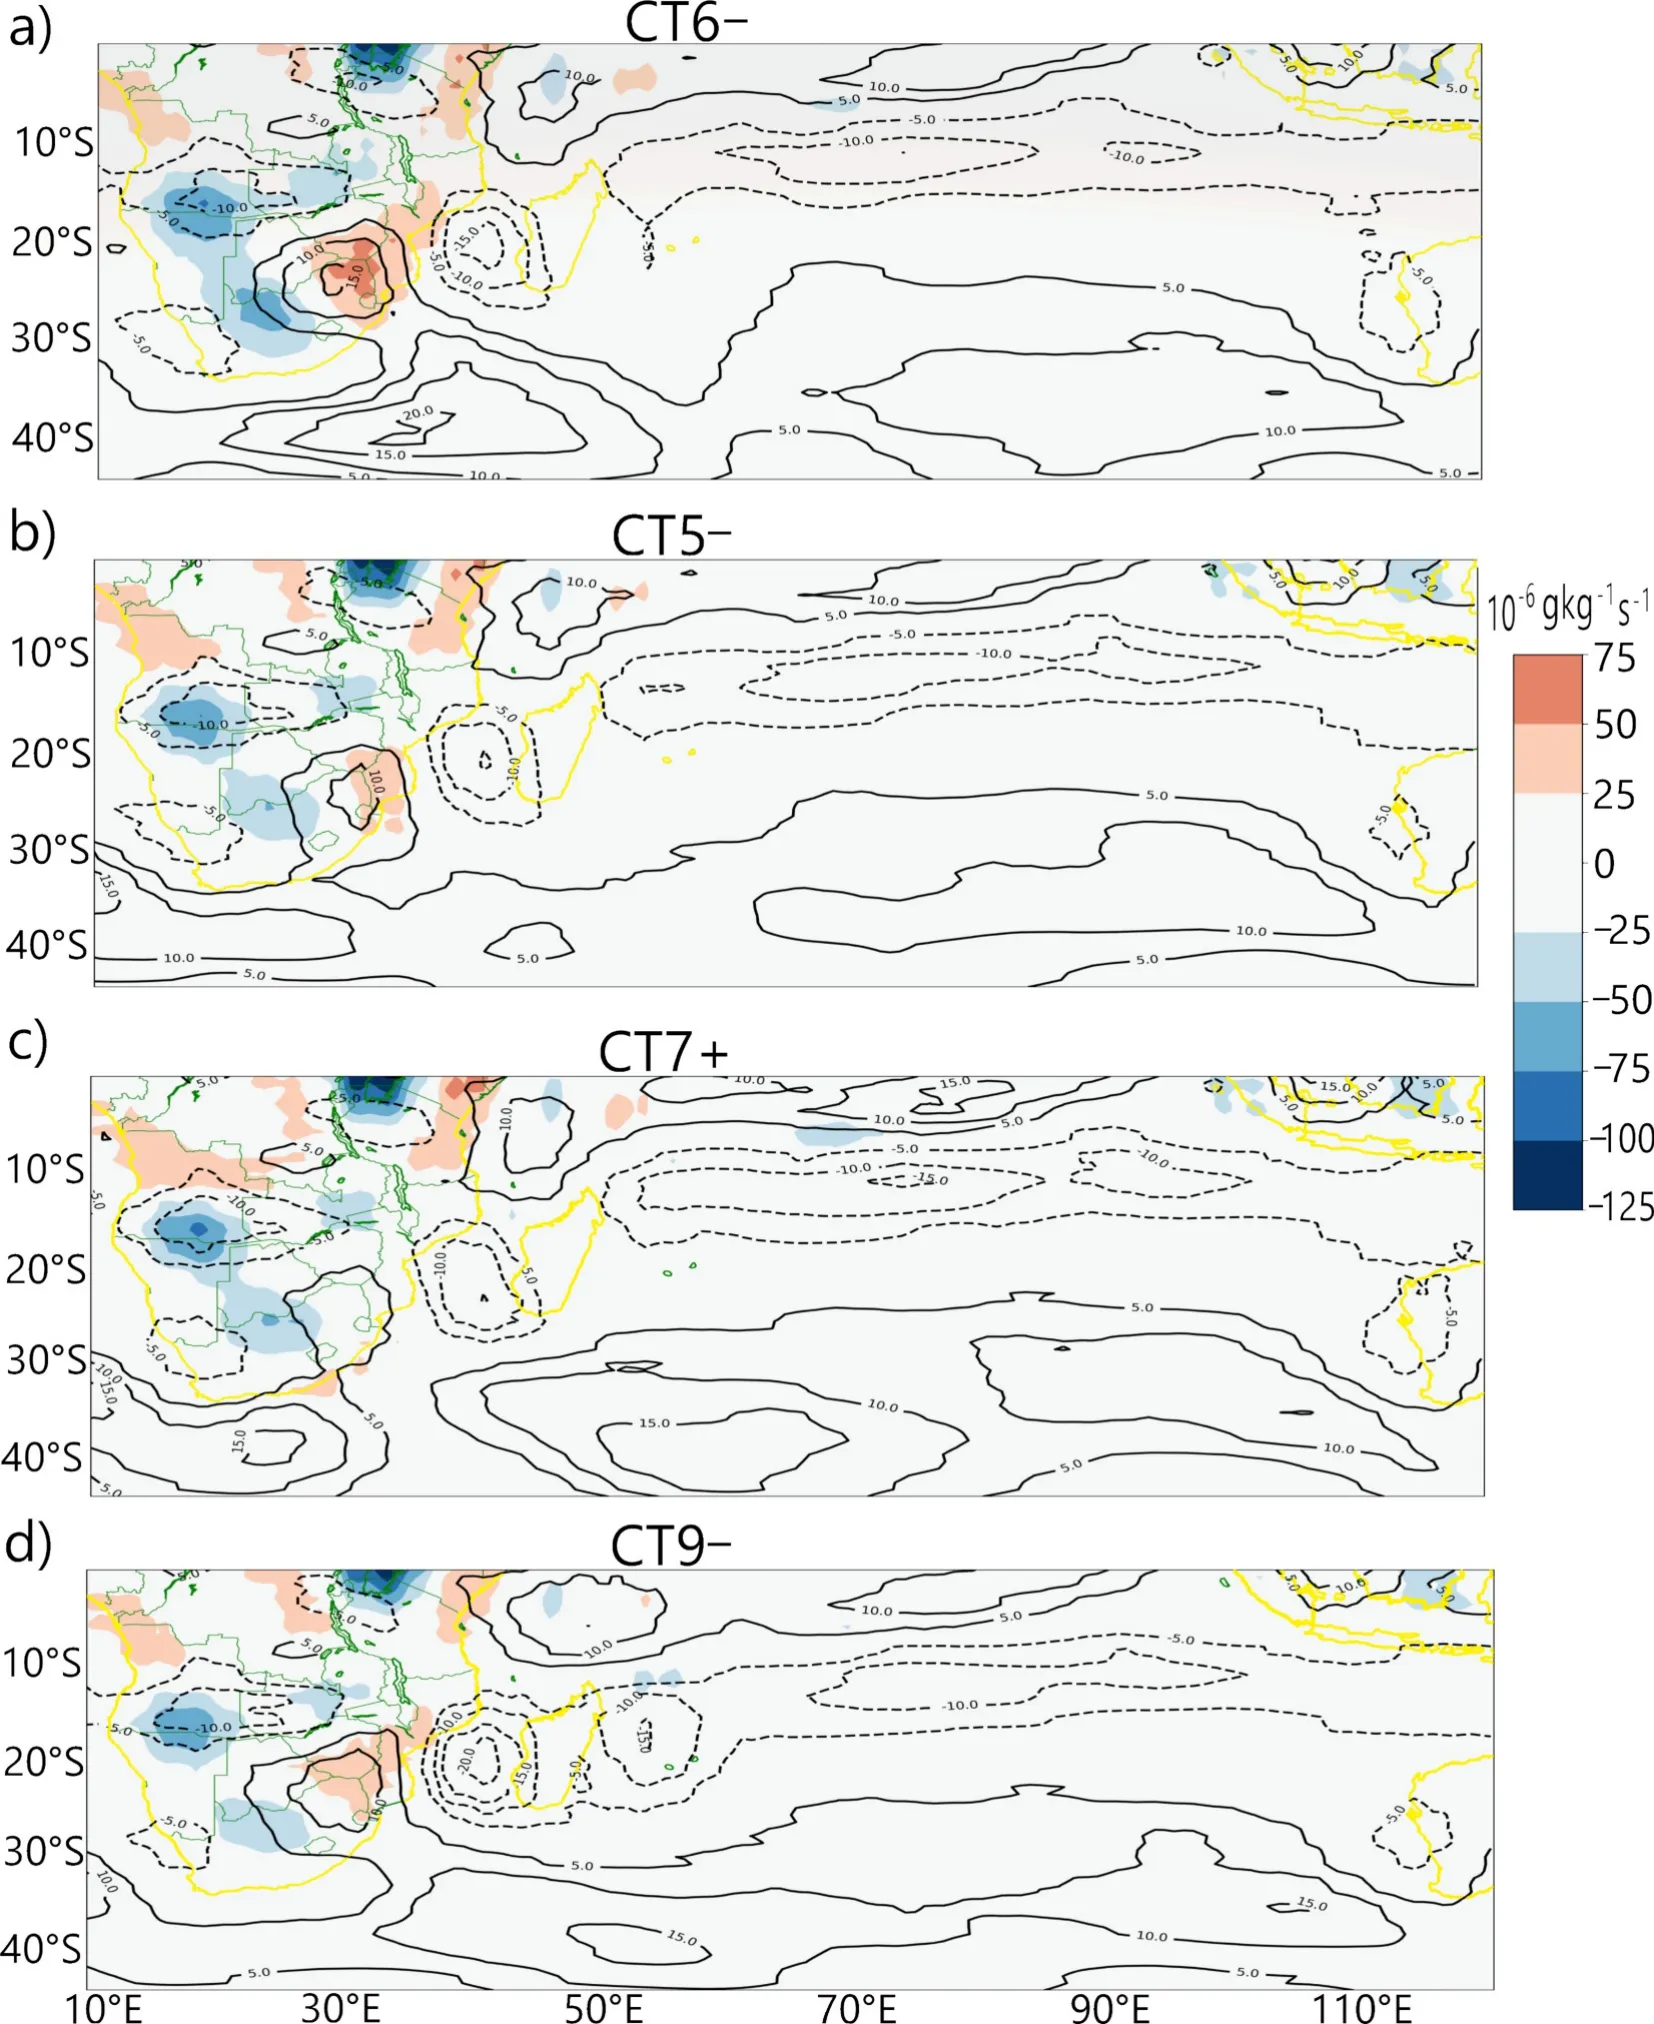
Fig.5.Same as Fig.4 but for moisture flux convergence (color) and relative vorticity (black contours).Thick contours show positive relative vorticity and dashed contours show negative relative vorticity (contour interval is 5 × 10⁻⁶ s-1).
3.6.JFM precipitation regions in Africa, south of the equator
Figure 8 shows the four classified JFM homogeneous regions of rainfall anomalies in Africa south of the equator.In region R1, a positive anomaly dominates over the western subtropical land area of south Africa.Region R2 shows a strong anomaly in the south-central regions of Africa south of the equator and adjacent oceans comprising the ocean waters in parts of the Mozambique Channel and the northernAgulhas current.Region R3 features a negative anomaly dominant in ocean waters south of Madagascar.Region R4 shows a positive anomaly dominant in Madagascar and the adjacent oceans.
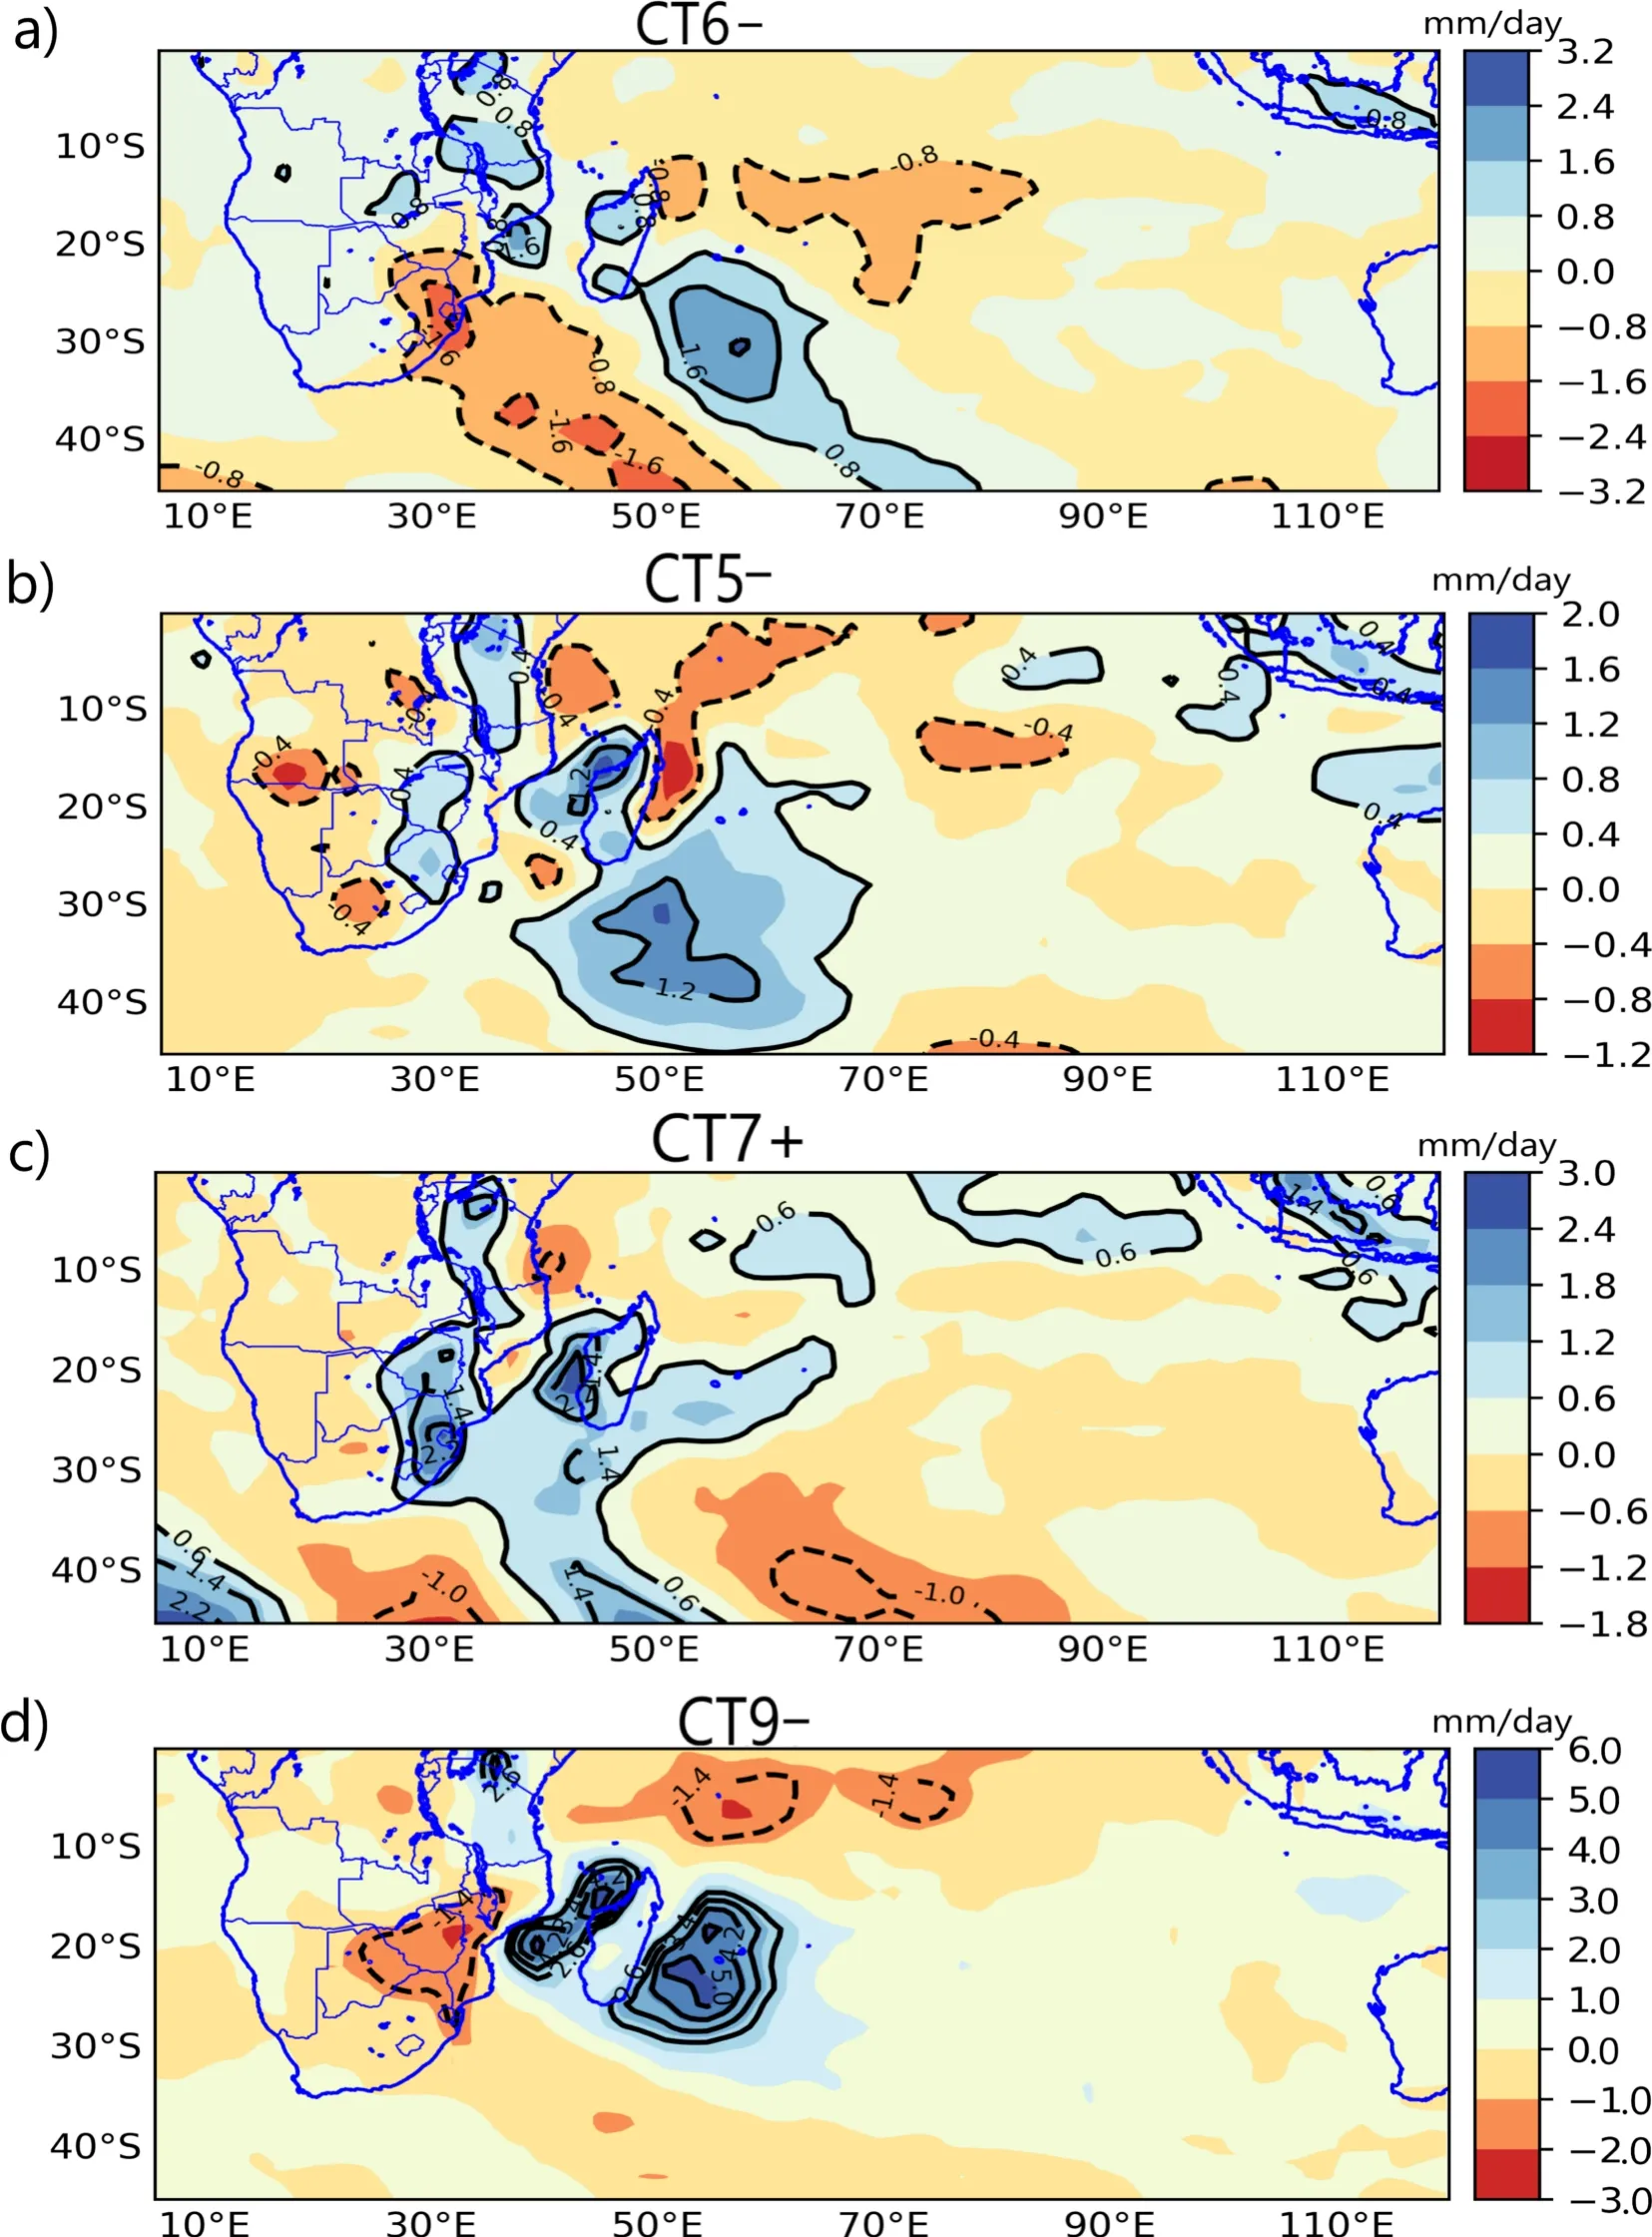
Fig.6.Rainfall composite anomaly for the JFM rain-bearing CTs in Fig.5.Anomaly is calculated as the difference between the mean JFM precipitation of the days when the CT occurred and the JFM climatology of 1981-2010.Contour lines (mm d-1) show regions that exceed the 90% confidence limit.Dashed contours show regions with a negative anomaly and thick contours show regions with a positive anomaly.Contour interval is 0.8 mm d-1.
Table 3 shows the correlations between mode 7 that is related to the SIOD and the rainfall regions.R2 (highlighted by the blue frame in Fig.8) is statistically related to mode 7,i.e., CT7+/CT7-.The statistically significant relationship between R2 and mode 7 makes Region R2 the region of interest in this paper.The correlation revealed that CT7+ (CT7-)that is related to the positive (negative) SIOD is also related to the wet (dry) phase of R2.

Table 2.Correlations between the annual mean SDI and the annual mean PC loadings from the classified modes during JFM in the analysis period.(*) indicates correlations that are statistically significant based on the Kendall Tau at a 95% confidence level (i.e., p < 0.05).

Table 3.Correlation analysis between the precipitation regions and the PC loadings of mode 7 during JFM.(*) indicates correlations that are statistically significant based on the Kendall Tau at a 95% confidence level (i.e., p < 0.05).
Figure 9 shows that the enhancement of relative cyclonic vorticity and low-level moisture flux convergence are associated with the time development of the wet phase of R2.Since R2 is influenced by the maritime regions over the adjacent oceans, Fig.9 indicates that enhanced cyclonic circulation over the adjacent ocean waters from the Mozambique Channel towards northern Agulhas current can influence the time development of the wet phase of R2.Recall that under CT7+ enhancement of cyclonic activity and precipitation is also evident in the southwest Indian Ocean (c.f.Figs.4, 5, and 6): physically, this can be a plausible reason why CT7+ and the wet phase of R2 are statistically related.Thus, during positive SIOD events, the circulation feature of CT7+ implies that the enhancement of convective(cyclonic) activity in the northern Agulhas current and the parts of the Mozambique Channel can induce rainfall in the south-central regions of Africa, south of the equator.
4.Discussion and conclusions
In this study, the relationship between the positive SIOD climatic mode and the JFM rain-bearing CTs in Africa south of the equator was examined.The CTs were classified using the obliquely rotated T-mode PCA (Richman,1981, 1986; Huth, 1996; Compagnucci and Richman, 2008).It is understood that classification schemes all have their advantages and that the superior method might depend upon what the analyst aims to achieve.In this study the rotated T-mode PCA classification has been used because (i) the time decomposition results in CTs that contains all time scales ranging from daily synoptic developments, low-frequency variability and climate fluctuations and change (Compagnucci et al.2001); (ii) the PCA loadings can be used in a fuzzy manner (i.e., more than one CTs assigned to a given day), thus optimizing the classification given the fuzziness and overlapping nature of atmospheric circulation patterns;and (iii) the PCA classification process results in modes that are asymmetric (i.e., having a positive and negative phase)that is typical with atmospheric modes of variability.This makes correlation analysis between the PC loadings (time series) and the indices of known modes of variability, such as the SIOD, physically intuitive.
Further, austral summer homogeneous regions of rainfall anomalies that can be influenced by the relationship between the positive SIOD and the classified CTs were investigated.Hence, the separation of JFM moistening and drying signals in the study region using CTs; analysis of the mechanisms associated with the JFM rain-bearing CTs; and the modulation of the SIOD climatic mode over the amplitude and the frequency of occurrence of the classified modes (CTs)are the unique contributions of this study to the literature.
Four major JFM rain-bearing CTs were obtained.During austral summer, CT6- indicated that a stronger anticyclonic circulation within the western branch of the Mascarene, ledto enhanced low-level moisture transport and convergence in the southern African mainland, and could be associated with above-average rainfall in large parts of the region.The results are in line with the findings of Lazenby et al.(2016)and Cook (2000).Conversely, the weaker western branch of the Mascarene high results in the weakening of southeast winds into the mainland, but enhanced cyclonic and convective activity in the southwest Indian Ocean.CT5- and CT7+indicate that such a scenario favors enhanced rainfall,mostly for land closer to the southwest Indian Ocean.
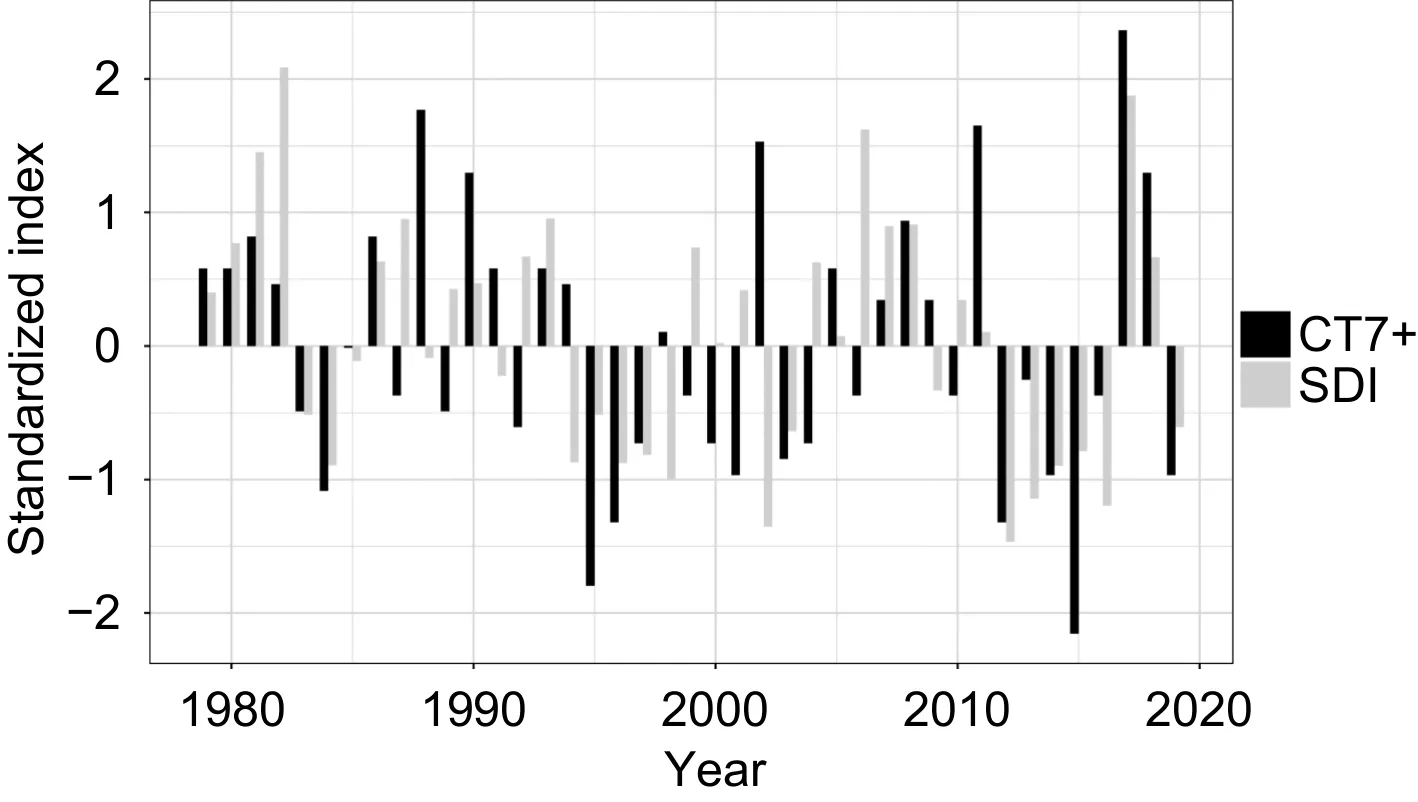
Fig.7.Time series of the standardized SDI and standardized annual frequency of occurrence of CT7+, during JFM, for the 1979-2019 period.
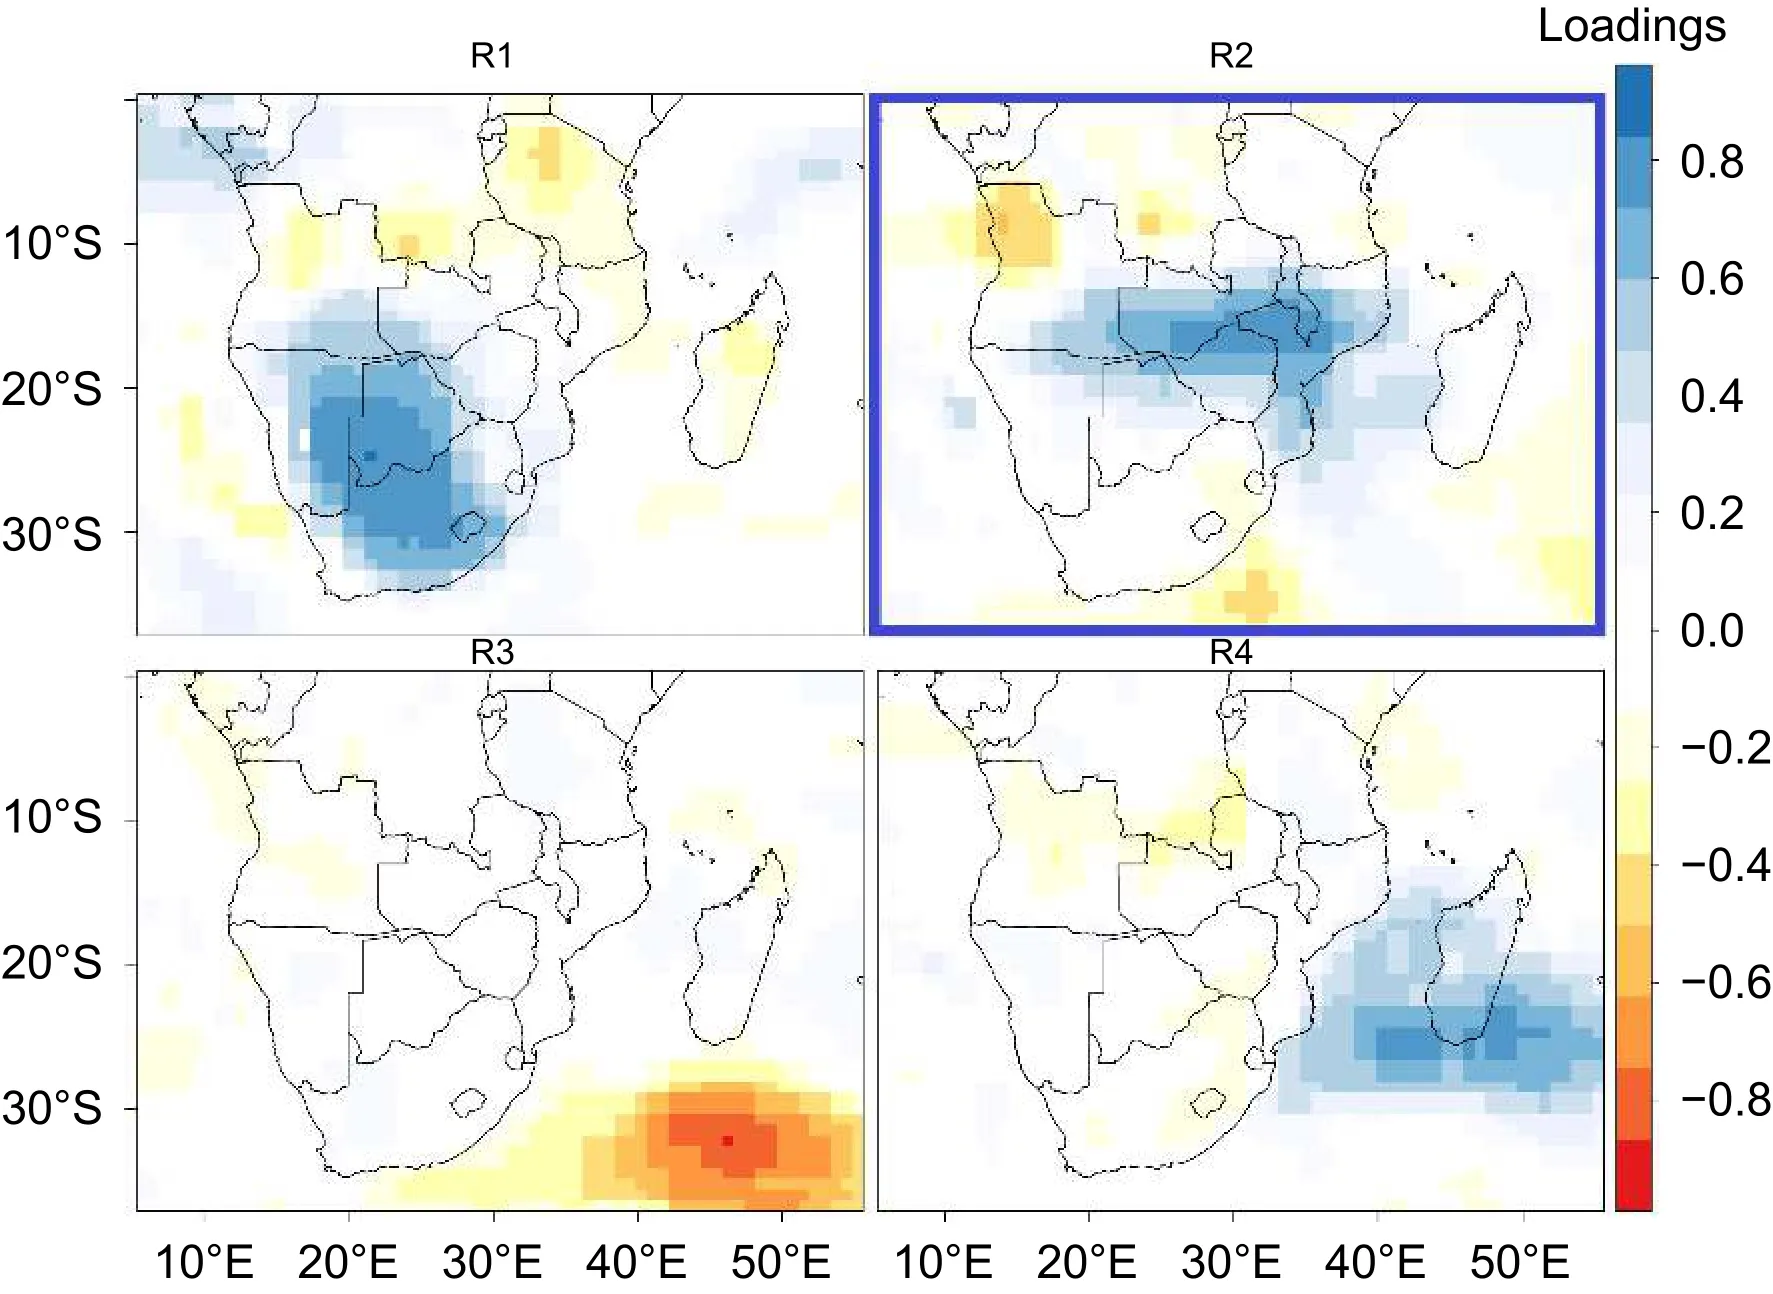
Fig.8.JFM rainfall regions in Africa south of the equator.The region that is related to CT7+ is highlighted by the blue frame.The loadings cluster homogeneous regions of JFM rainfall anomalies.Opposing signs of the loadings under a given rainfall variability pattern indicate regions associated with positive or negative rainfall anomalies during the dominant period of the rainfall variability pattern.
CT7+ was associated with (i) enhancement of cyclonic relative vorticity and cyclonic circulation in the southwest Indian Ocean; (ii) convergence of southeasterly, northeasterly, and northwesterly moisture fluxes over the south-central region of Africa south of the equator; and (iii) significant positive precipitation anomaly over the southwest Indian Ocean and the eastern land regions.These synoptic features have been reported to be active during positive SIOD events(Behera and Yamagata, 2001; Reason, 2001).During the analysis period, CT7+ was related to the positive SIOD climatic mode.The relationship implied that the positive SIOD can be expected to enhance the frequency of occurrence and amplitude of CT7+.Specifically, the 2017 strong positive SIOD event was accompanied by an unusual spike in the frequency of occurrence of CT7+.Since CT7+ reflects the signal of the positive SIOD, predictability of the inter-annual to decadal variations of the positive SIOD might benefit from knowledge of the anomalies in the frequency of occurrence of CT7+, both in the current climate and future climate change scenarios.For example, in Ibebuchi (2021a), future changes in the SAM under higher warming scenarios were established by analyzing the impact of climate change on the future frequency of occurrence of mode 3 (i.e., CT3+/CT3-) that relates to the SAM.The results were promising as they reinforced the projected shift of the SAM towards a more positive phase under higher warming scenarios (e.g.,Ding et al., 2012).Similarly, austral summer seasons with a
persistent signal of the positive SIOD, such as experienced in 2017, can enhance the predictability of the frequency of occurrence and amplitude of CT7+.Thus, the specification of the spatial configuration, mechanism, and temporal evolution of the circulation mode that has the imprint of the SIOD can enhance the predictability of the SIOD under different time scales.
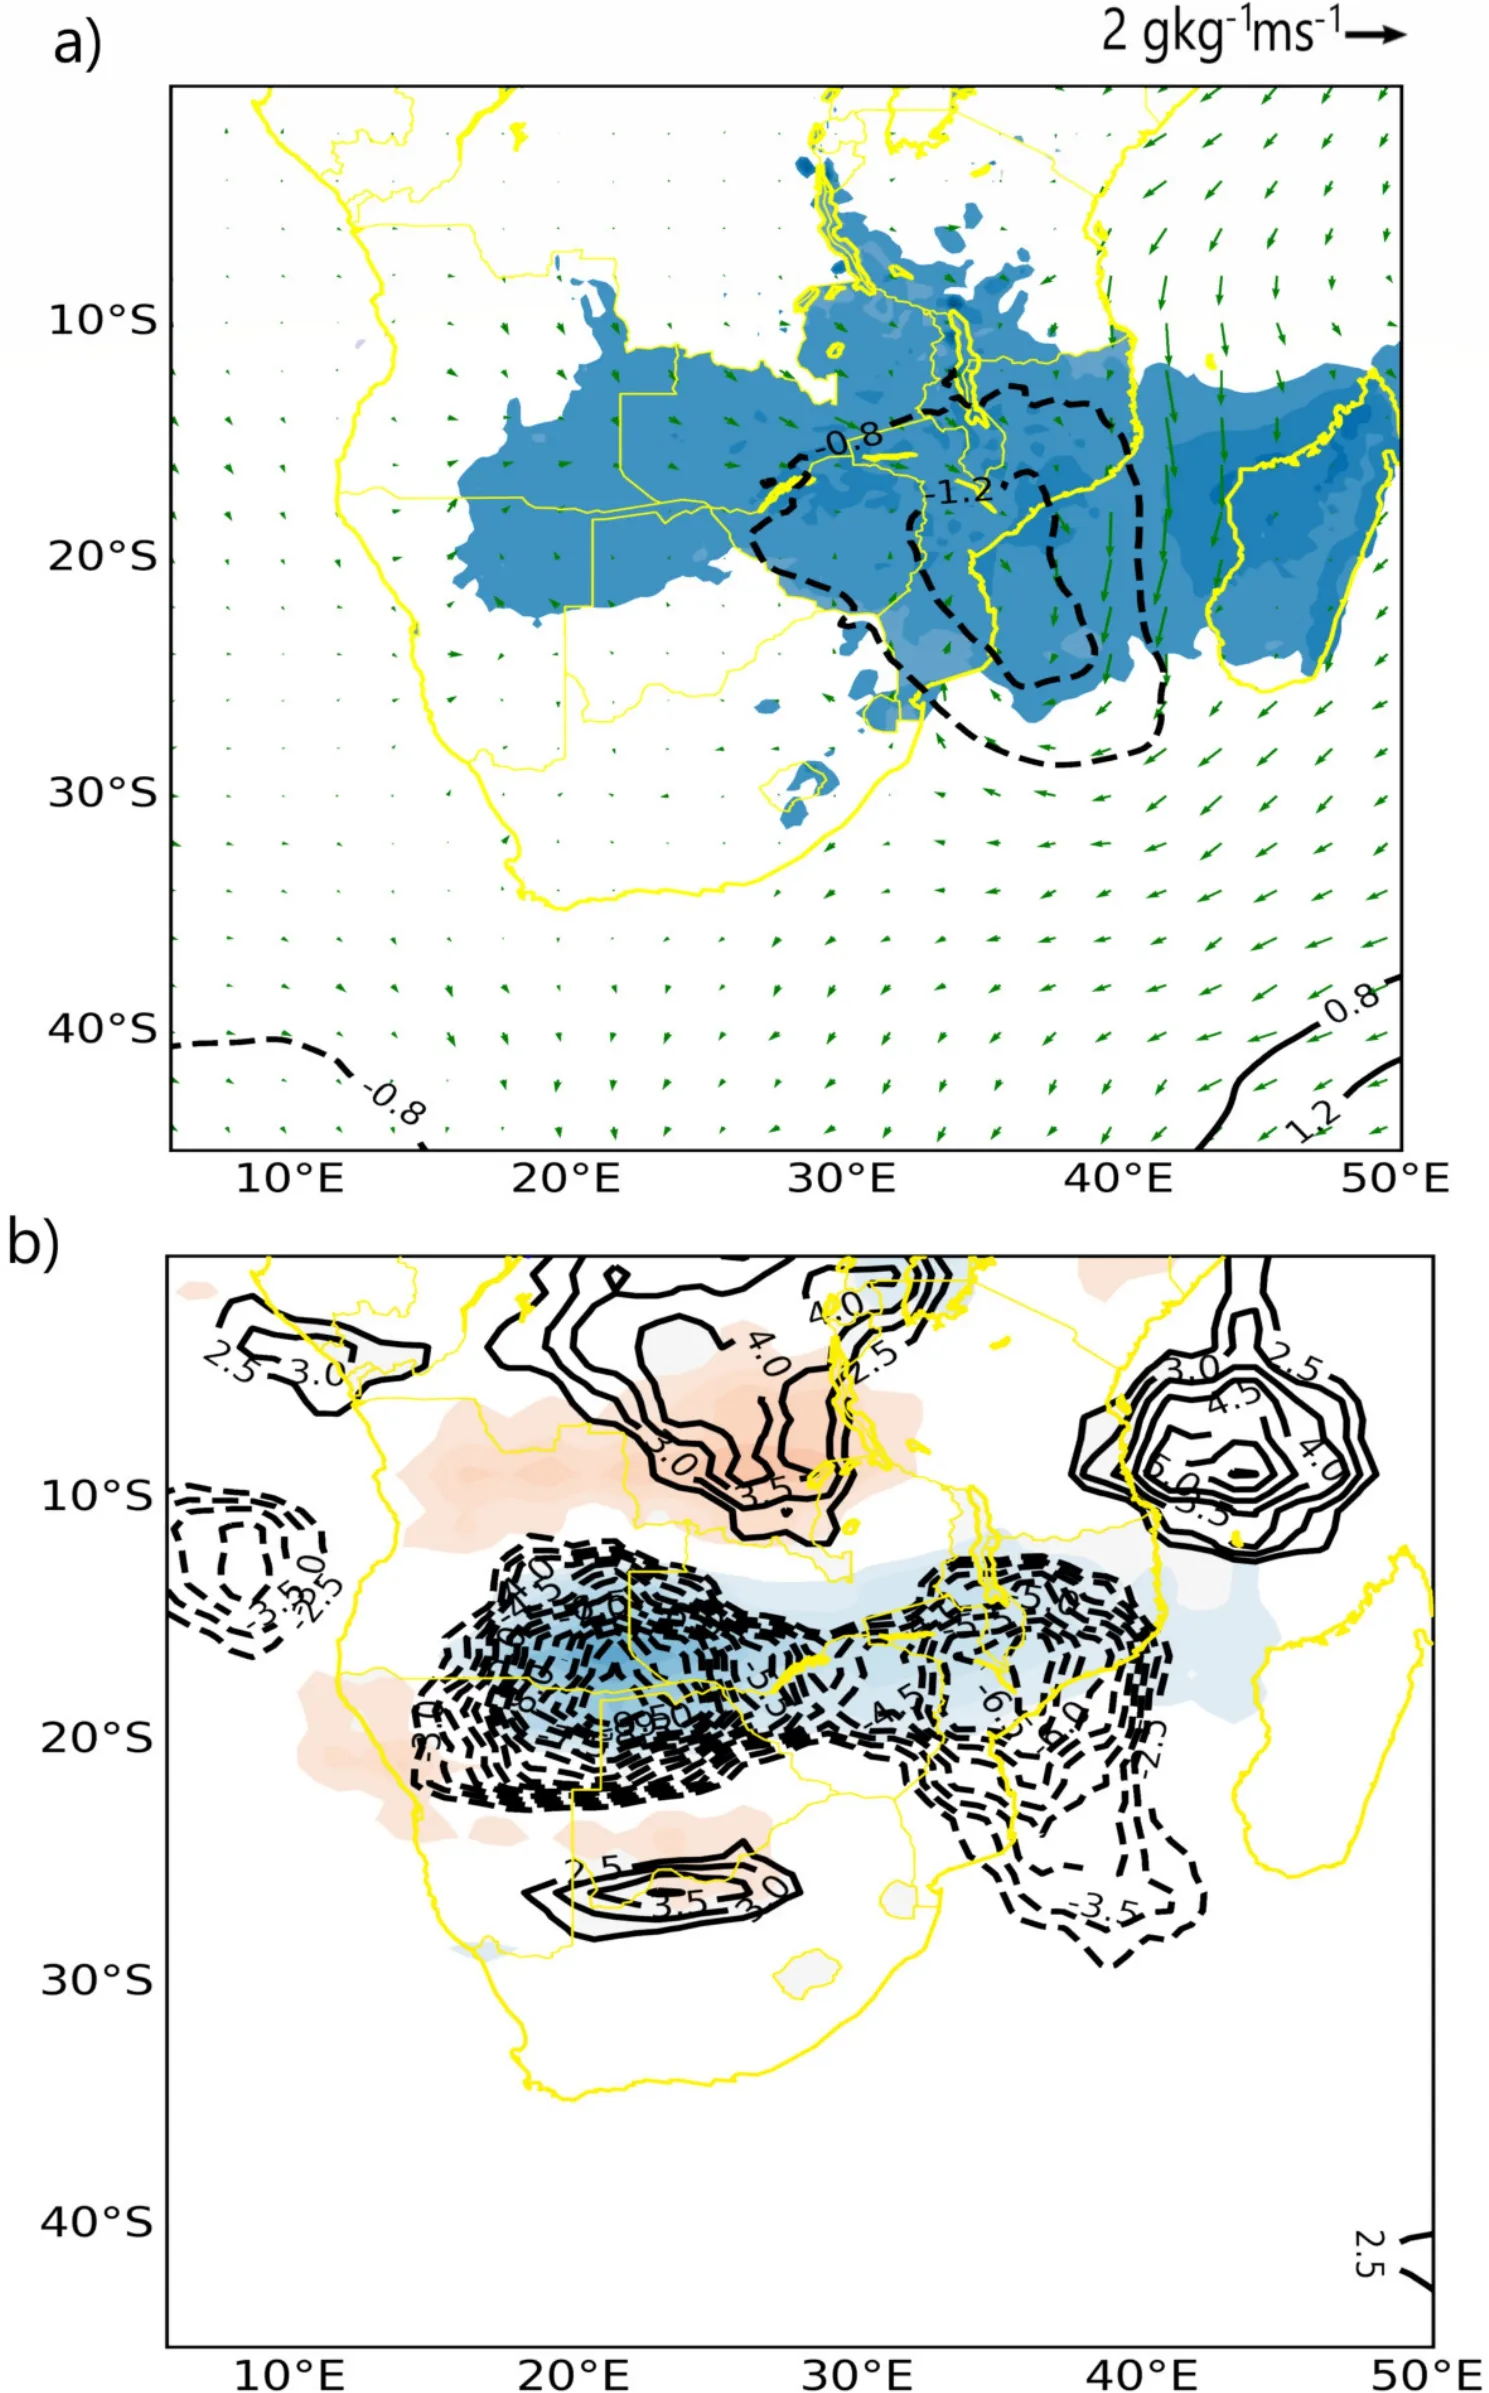
Fig.9.Physical mechanism associated with the time development of features over region R2.(a)Rainfall (shading, for regions with positive rainfall anomaly), SLP (black contour lines), and moisture flux anomaly (green vectors).Anomalies were calculated as the difference between the JFM months when R2 is most pronounced and the JFM climatology of 1981-2010.Only values exceeding the 90% confidence limit are plotted.The contour interval is 0.4 hPa, with thick contours showing positive anomalies and dashed contours showing negative anomalies (see scale at top of map).(b) The same as for (a) but for relative vorticity anomaly (contour lines) and moisture flux convergence anomaly (shading: blue indicates convergence and red indicates divergence).The contour interval for relative vorticity is 0.5 × 10⁻⁶ s-1.
Among the classified austral summer homogeneous regions of rainfall anomalies in Africa south of the equator,R2 shows a strong anomaly in the south-central regions of Africa south of the equator where, according to Behera and Yamagata (2001), the positive SIOD brings a statistically significant above-average rainfall.Region R2 is equally influenced by ocean waters in parts of the Mozambique Channel and the northern Agulhas region.Positive anomalies of precipitation and cyclonic activity in these maritime regions(which are prevalent during positive SIOD events) can induce rainfall in the south-central regions of Africa through enhanced moisture convergence.Further, the correlation between variations in CT7+ over time and the time development of the classified austral summer regional rainfall patterns was statistically significant with R2.Also, some relationship between mode 7 and R1 which comprises the subtropical parts of the study region was found.Yuan et al.(2014a) has previously established that the rainfall pattern of R1 is related to ENSO variations.This confirms the linear relationship between ENSO and the SIOD as reported by Yuan et al.(2014b) since the same regional atmospheric mode that has the fingerprint of the SIOD (i.e., CT7+/CT7-) also influences a regional precipitation pattern modulated by ENSO.Moreover, Ibebuchi (2021c) showed that CT7+ that is related to positive SIOD can also be influenced by El Ni?o.
Finally, this study confirms that enhanced cyclonic activity (i.e., warmer SST and convective activity) in the Mozambique Channel and the northern Agulhas current resulting in more advective moisture fluxes from the aforementioned maritime regions are among the basic mechanisms through which the positive SIOD cause above-average rainfall in the south-central parts of Africa south of the equator.
Acknowledgements.The assistance of NOAA/OAR/ESRL PSL, Boulder, Colorado, USA in accessing the NCEP/NCAR reanalysis data sets and CPC precipitation data sets provided on their website at https://psl.noaa.gov/ is greatly appreciated.
Declarations
Funding:Open access funding enabled and organized by Projekt DEAL.
Conflict of interest:There are no conflicts of interest.
Open AccessThis article is licensed under a Creative Commons Attribution 4.0 International License, which permits use, sharing,adaptation, distribution and reproduction in any medium or format,as long as you give appropriate credit to the original author(s) and the source, provide a link to the Creative Commons licence, and indicate if changes were made.The images or other third party material in this article are included in the article’s Creative Commons licence, unless indicated otherwise in a credit line to the material.If material is not included in the article’s Creative Commons licence and your intended use is not permitted by statutory regulation or exceeds the permitted use, you will need to obtain permission directly from the copyright holder.To view a copy of this licence,visit http://creativecommons.org/licenses/by/4.0/.
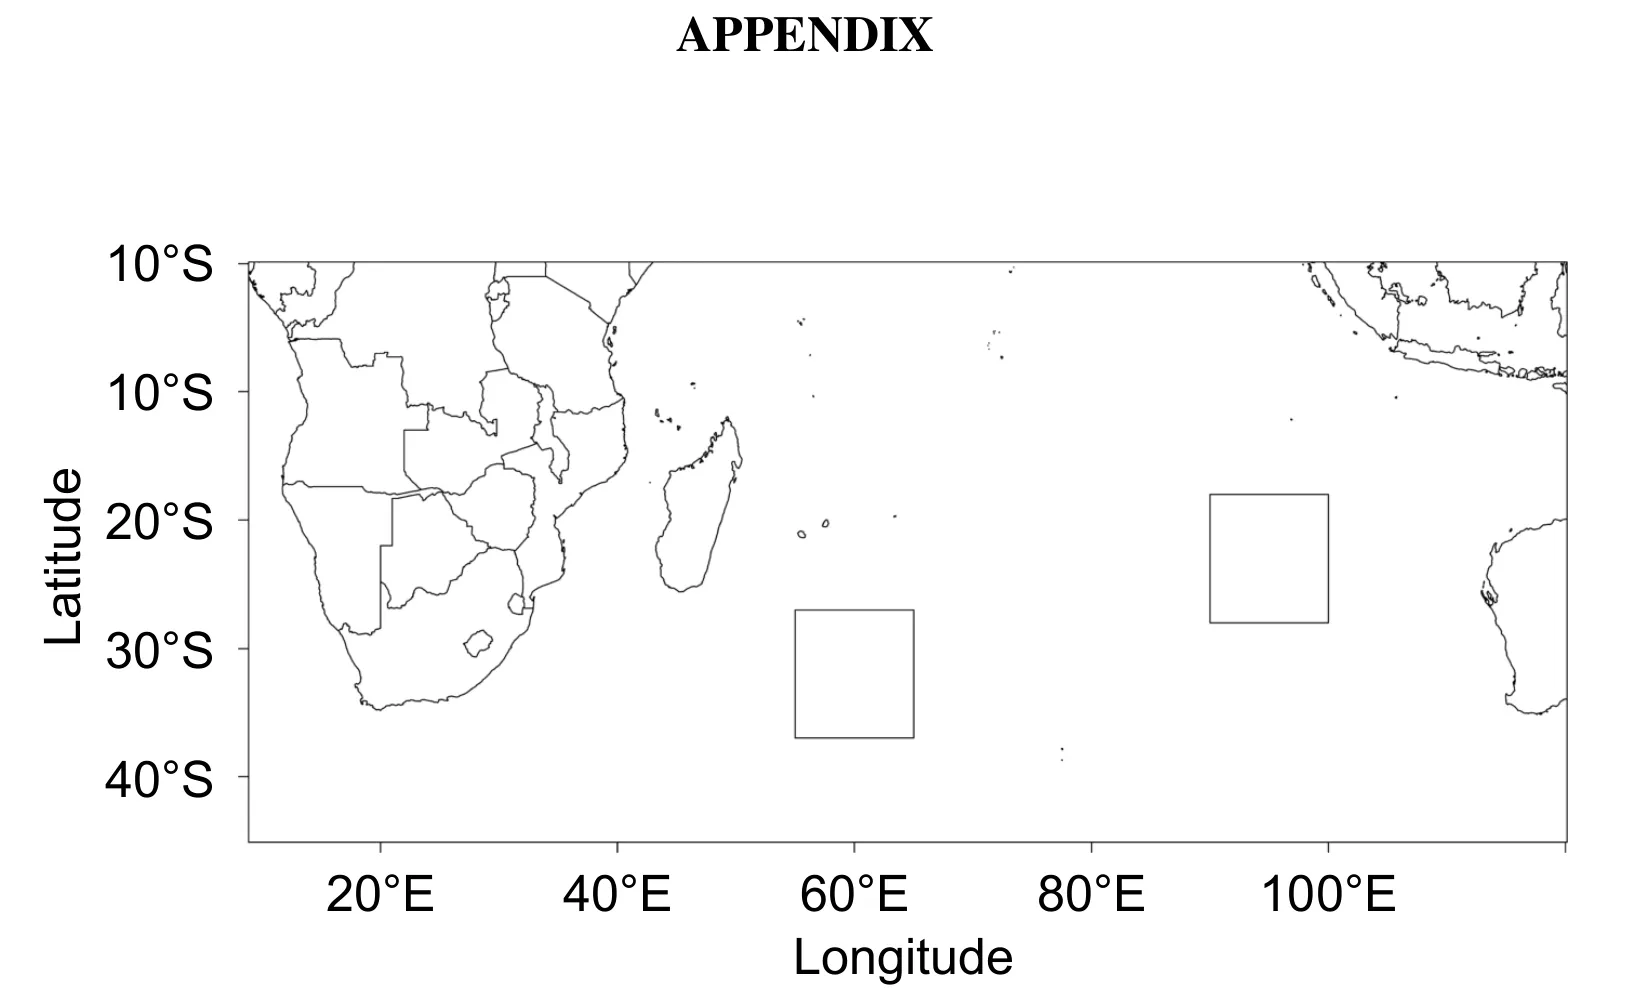
Fig.A1.Map indicating the location of the regions used for calculating the SIOD index.The SIOD index is calculated as the SST anomaly difference between the western box (55°-65°E, 37°-27°S)and eastern box (90°-100°E, 28°-18°S).

Fig.A2.Circulation types in Africa southof the equator.The CTs marked by the blue frames are rain-bearing over large parts of the landmass during JFM.The hydroclimate of specific regions over the landmass that can be impacted most depends on the mechanism of the CTs.The CTs are calculated as the mean SLPof the days when the CTs occurred andcan be associated with the signal (i.e.,for the retained component in question, days with loadingmagnitude outside the±0.2hyperplane thresholdusedtoseparate signal fromnoise).

Fig.A3.Annual cycle of the CTs in Fig.A2.The rain-bearing CTs are marked by the blue frames.
 Advances in Atmospheric Sciences2023年1期
- Advances in Atmospheric Sciences的其它文章
- Understanding the Development of the 2018/19 Central Pacific El Ni?o
- Alternation of the Atmospheric Teleconnections Associated with the Northeast China Spring Rainfall during a Recent 60-Year Period
- The Importance of the Shape Parameter in a Bulk Parameterization Scheme to the Evolution of the Cloud Droplet Spectrum during Condensation
- Changes in Water Use Efficiency Caused by Climate Change, CO2 Fertilization, and Land Use Changes on the Tibetan Plateau
- Estimation of Lightning-Generated NOx in the Mainland of China Based on Cloud-to-Ground Lightning Location Data
- Multi-scale Incremental Analysis Update Scheme and Its Application to Typhoon Mangkhut (2018) Prediction