
Intraspecif ic leaf morphological variation in Quercus dentata Thunb.: a comparison of traditional and geometric morphometric methods, a pilot study
2022-11-04 09:23:56KaiyuYangJianghaoWuXinmanLiXinboPangYangchenYuanGuohuiQiMinshengYang
Journal of Forestry Research 2022年6期
Kaiyu Yang · Jianghao Wu,2 · Xinman Li,2 ·Xinbo Pang · Yangchen Yuan · Guohui Qi,4,5 ·Minsheng Yang,2
Abstract To compare the application of traditional morphometric methods (TMMs) and geometric morphometric methods (GMMs) in the study of intraspecif ic leaf morphological characters of Quercus dentata, f ifteen linear measurement indices and thirteen landmarks of leaves were used to study leaf morphology of three provenances (H1, H2,and H3). In TMMs, principal component analysis (PCA)showed that leaf size-related indices played an important role in population classif ication. Partial least square (PLS)analysis showed that the main morphological characters aff ecting leaf size were the average depth of the lobes and the length-width ratios. However, the important indices to distinguish the provenances were circularity, leaf width, and length-width ratio. The results of discriminant analysis (DA)showed that 74.0% of H1, 68.0% of H2, and 74.0% of H3 were correctly classif ied. Cluster analysis showed that the Mahalanobis distances between H1 and H2, H1 and H3, and H2 and H3 were 4.3761, 11.4629, and 10.2067, respectively.In GMMs, PCA based on symmetrical components showed that the diff erence in leaf morphology was mainly due to the changing trend of the leaf apex and base, petiole length,and degree of leaf cracking. PLS analysis showed that there was a signif icant covariation between the leaf symmetrical components and size: as the leaf enlarged, the widest part gradually moved up, and the shape changed from nearly oval to lanceolate. DA results showed that 86.0% and 78.0% of H1 and H2, 70.0% and 80.0% of H1 and H3, and 82.0% and 76.0% of H2 and H3 were correctly classif ied. Canonical variate analysis results showed that the Mahalanobis distances between H1 and H2, H1 and H3, and H2 and H3 were 1.7238, 1.5380, and 1.6329, respectively. Both GMMs and TMMs showed signif icant diff erences in morphology among the three Q. dentata provenances, but GMMs had higher classif ication accuracy and could provide more information about leaf shape, whereas TMMs could provide more information about leaf size. Based on our results, GMMs are promising in the study of leaf morphological variation within Q. dentata provenances.
Keywords Traditional morphometrics · Geometric morphometrics · Leaf morphology variation · Quercus dentata · Intraspecif ic
Introduction
Leaf morphometrics is an analytical method for describing the morphological changes caused by environmental change,growth, or evolution. Through measurement and coordinate transformation, the morphological diff erences among individuals with similar shapes can be analyzed and described from a mathematical point of view (Shi et al. 2018a, 2020,2021; Wang et al. 2018; Yu et al. 2019; Guo et al. 2020; Shu et al. 2021).
Traditional morphometric methods (TMMs) use linear distance, angle, and quantitative traits to describe the morphological characteristics of leaves through multivariate statistical analysis. For example, petiole length, leaf length and width are measured, and some indirect indices, such as leaf length-width ratio and leaf area, are also calculated(Mitteroecker and Gunz 2009; Liu 2012; Shi et al. 2018b,2019a, 2019b; Yu et al. 2020; Schrader et al. 2021), to obtain information on changes in individual morphology or the morphological diff erences among diff erent individuals(Wei et al. 2015; Stephan et al. 2018). Liu ( 2012) found leaf morphological indices were of considerable signif icance for revealing the phylogenetic relationship between two oak species. Although these traditional morphological measurements provide an important basis for species identif ication to a certain extent, there are still numerous questions need addressing. For instance, linear measurements only cannot easily summarize the complex shape of an organism without agreement on correction methods for diff erent sizes as these measurements are highly correlated with size (Parés-Casanova et al. 2020). Moreover, the quantitative characters of leaf morphology obtained by linear measurement cannot describe morphology intuitively and comprehensively(Richtsmeier et al. 2002). Furthermore, these quantitative characteristics may be easily aff ected by the environment,which may lead to diff erences in morphology of the same species under diff erent site conditions, such as on and below slopes. The species cannot be distinguished correctly, and the accuracy of the classif ication results is reduced (Bai and Yang 2007).
To make up for the def iciency-that is, the quantitative character analysis of leaves is not suffi ciently intuitive and comprehensive-a morphological statistical method based on Cartesian mark coordinates was developed:modern geometric morphometric methods (GMMs) (Mitteroecker and Gunz 2009). Landmark and outline data used in GMMs are adequate for diff erentiating complex taxa because they can divide the total coordinate change into shape and non-shape (translation, rotation, and size)components, take no account of location, orientation, and scale factors (Mitteroecker and Gunz 2009; Asanidze et al.2011). GMMs are used to distinguish symmetrical characteristic (parts in repetition to each other in diff erent positions and directions), bilateral asymmetry, (namely, the diff erences on the left and right sides between corresponding parts), and allometric relationships, which ref lect the covariation of size and shape and are also critical components of morphological studies (Klingenberg et al. 2002,2011; Viscosi et al. 2012). Geometric information on morphological diff erences can be displayed in various images and diagrams by GMMs, e.g., the Elliptical Fourier analysis is an accurate way for describing and characterizing outlines, and eff ectively capturing shape information in a quantif iable way (Kuhl and Giardina 1982; Klingenberg 2011). GMMs eff ectively solve the problem that leaf shape variation analysis depends only on the measurement indices and is not comprehensive enough, so this approach is widely applied in biology to learning shape change (Wang et al. 2020). This has frequently been applied to analyze the morphometric features in humans, animals, and insect species. GMMs have been used for the classif ication and identif ication of botanical specimens (Souza et al. 2012;De Heredia et al. 2018 ; Morello et al. 2018; Miljkovi? et al. 2019; Wang et al. 2020). Examples of GMMs applications include preliminary identification of molecular markers in sympatric oak in China (Liu et al. 2018),the morphological changes of conspecif ic leaves which showed that GMMs can provide a new understanding of intraspecif ic morphological variation (Miljkovi? et al.2019; Li et al. 2021), and that GMMs provide a fast and eff ective tool for interspecif ic leaf morphological analysis ofQuercuscompared with TMMs (Viscosi et al. 2009b).
Quercus dentataThunb. (Fagaceae) is an important component of both deciduous broad-leaved and mixed broadleaved forests (Peng et al. 2007; Lan 2018). It has strong adaption to drought and poor soil conditions and plays an important role in soil and water conservation and ecological shelterbelt construction (Wu and You 2019). This species is widely distributed in diff erent habitats in eastern Asia in the Northern Hemisphere. Its extensive geographical distribution, the comprehensive eff ect of various environmental factors (Viscosi et al. 2009a; Pe?aloza-Ramírez et al. 2010)and a high degree of phenotypic plasticity result in signif icant morphological variations within the species (Manos et al. 1999; Gugerli et al. 2007; Gerber et al. 2014). The conspecif ic variation in leaf shape represents the adaptive response to changing environments, while species and populations with greater adaptive plasticity may be more likely to survive in sub-optimal environmental conditions (Gratani 2014). However, there is no study on intraspecif ic population identif ication ofQ. dentata.
Several methods, such as ecological diff erentiation (Kremer et al. 2002; Borazan and Baba 2003; Stephan et al.2016), molecular identif ication, and morphological measurement (Gailing et al. 2012; Simeone et al. 2013) are used to diff erentiate the taxa. Among them, leaf morphological characteristics is a useful way to resolve systematic problems for diff erentiation (Wetter and Stace 1982; Jury 2008; Costa et al. 2009). Even through molecular identif ication, the target material is f irst put down to pre-identif ied taxa, following morphological key traits. With the improvement of electronic equipment and software, leaves are the easiest parts of trees in the f ield of sampling and measuring. Therefore,leaves have been applied in widespread biometrical studies to discriminateQuercusspecies successfully (Kremer et al.2002; Boratynski et al. 2008). The observed, counted, and transformed characters were analyzed and measured as well as listing the features that contributed most to this change:number of leaf veins, petiole length, leaf length-width ratios, pubescence, lobe depth ratio, shape of base lamina,and the ratio of medium length to maximum width (Stephan et al. 2018).
Previous studies on oak leaves have used leaf size and shape (Viscosi et al. 2009a, 2009b; Song et al. 2015; Liu et al. 2017, 2018; Li 2020). In order to quantify the blade form, several techniques have been carried out but little attempts have been made to compare the results through diff erent technical methods. TMMs and GMMs are completely diff erent methods for studying morphological variation, and whether they can be applied to the intraspecif ic population identif ication ofQ. dentatastill needs to be explored. Therefore, leaves from three provenances ofQ.dentate(H1, H2, and H3) were collected and TMMs and GMMs used to analyze the variability of leaf morphology at the intraspecif ic level. In this study, the purpose was to determine which is more suitable for intraspecif ic population identif ication, GMMs or TMMs. Secondly, these two measurement methods were used to study the intraspecif ic leaf modalism ofQ. dentata.
Materials and methods
One-year-old seedlings were used for testing procured from three provenances: Caijiayu Village, Hebei Province (H1);Sishang Village, Henan Province (H2); and the Yangjiaping management area of Xiaowutai State-Owned Forest Farm Administration bureau in Hebei Province (H3). In the autumn of 2018, seeds ofQ. dentatacollected from the three locations were sown in a non-woven mesh bag f illed with substrate and cultured in the greenhouse of the Administration Bureau of Hongyashan State- Owned Forest Farm in Yixian County. Seedlings from the three provenances were randomly sampled at the end of August 2019 (Table 1). Fifty seedlings with similar growth were selected from each provenance, and three mature, undamaged leaves were collected from three positions from each seedling fora total of 450 leaves, preserved in ice bags, marked, and sent to the laboratory for morphological analysis.
Leaf image acquisition
The protocols were to wipe the dust of 450 leaves with absorbent paper, press them f lat and scan them with blades facing upwards with a CanoScan 5600F scanner (Canon Inc.,Japan). The resolution was set to 300 dpi and the picture saved to a folder in a JPEG format.
Landmark conf iguration
All scanned images were sequentially calibrated with 13 landmarks using ImageJ software (Viscosi 2015). The landmarks consisted of three distributed along the midrib of the leaves (LM 1-LM 3) and nine others symmetrically distributed in other parts of the leaves (LM 4-LM 13) (Fig. 1).After the original data of all the landmarks were obtained,they were converted to a conf iguration of 13 pairs of cartesian coordinates (x, y) for each leaf, and the data stored in txt f ile format. The sorted data were imported into MorphoJ program (Klingenberg 2011; Song et al. 2015) for analysis.
Fourier transformation of the coordinate data by the GPA (Wieringa et al. 2009; Song et al. 2015; Liu et al.2017) was carried out and the leaf morphology of the original coordinates was divided into two variables: shape and size (Sanf ilippo et al. 2009). The original prof ile of each leaf was superimposed to create an average prof ile(Klingenberg et al. 2002). Second, the outliers were tested and excluded according to the size of each leaf deviating from the average prof ile (Klingenberg and Monteiro 2005).Third, the data sets of landmarks for symmetric and asymmetric components were generated by the leaf shape dataafter eliminating outliers. The symmetrical components were the average leaf shape composed of corresponding landmarks and their mirror images, and the asymmetrical components were the average leaf shape composed of the original landmarks (Klingenberg et al. 2002). Subsequent principal component analyses (PCA) and partial least squares (PLS) analyses separated the symmetrical and asymmetric components from leaf size for statistical analysis. Fourth, the leaf shape data were layered, including symmetrical components, asymmetric components,and leaf size, to create a mean leaf conf iguration at the level of the leaf, tree, and provenance. Finally, the matrix of each level was used as a data set for multivariate statistical analysis. The symmetrical and asymmetric components at the leaf level were used for PCA, the symmetrical and asymmetric components at the tree level were used for PLS analysis, and the symmetrical components at the tree level were used for discriminant analysis (DA) and canonical variate analysis (CVA). PCA was used to test the main features of the shape changes in the samples. After the dimensionality reduction of the information of the 13 landmarks, the combined variables that contributed strongly to the variation in leaf morphology were extracted. PLS analysis can map leaf morphological traits to size traits and then analyze the covariant relationship between leaf size and shape. DA distinguishes the population by discriminant function and cross-validation function. CVA separates groups as much as possible by sorting analysis and permutation testing of the Mahalanobis distance(An eff ective method for calculating the similarity of two unknown sample sets) (Viscosi and Cardini 2011). Thinplate spline analysis was used to output the transformation grid and wireframe graph of important values on the coordinate axis, and the overlap of the transformation grid and wireframe graph was used to analyze the changing trend of the leaf shape contraction or expansion.
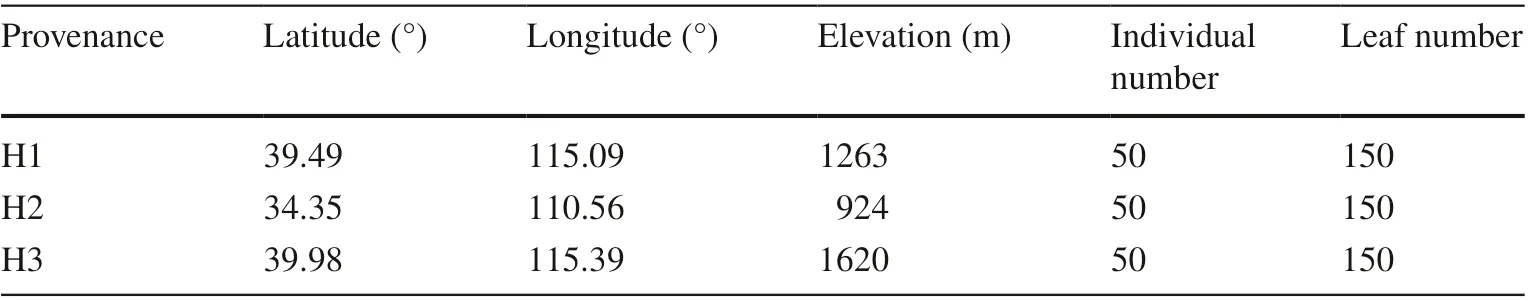
Table 1 Locations and numbers of Q. dentata trees
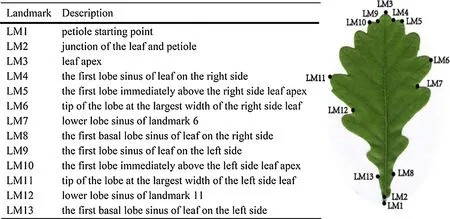
Fig. 1 Description of landmarks on leaves of Q. dentata
Linear measurement and statistical analysis
Linear measurement of leaves was carried out using the Lamina program (Bylesj et al. 2008), and the parameters included: leaf area, leafperimeter, circularity, leaf width,width at 1/4, width at 1/2, width at 3/4, leaf length, length at 1/4, length at 1/2, ength at 3/4, length-width ratio, lobe number, lobe average width, and lobe average depth (Fig. 2).Microsoft Excel 2019 (Microsoft Corporation, WA, USA)was used to calculate the average of each phenotypic trait for each tree and provenance. PCA was carried out with the data of all leaves (Gao and Yue 2020; Jv et al. 2020); PLS and CA with the average data of each provenance (Wang et al. 2017); and DA with the average data of each tree (Jin et al. 2020). PCA, PLS analysis, and DA were carried out using SPSS20.0 statistical software (IBM SPSS Statistics,NY, USA). Data were uploaded to the Lianchuan biological cloud platform to draw a PCA scatter plot (Wang et al.2012 ). CA was performed using Data Processing System 9.01.
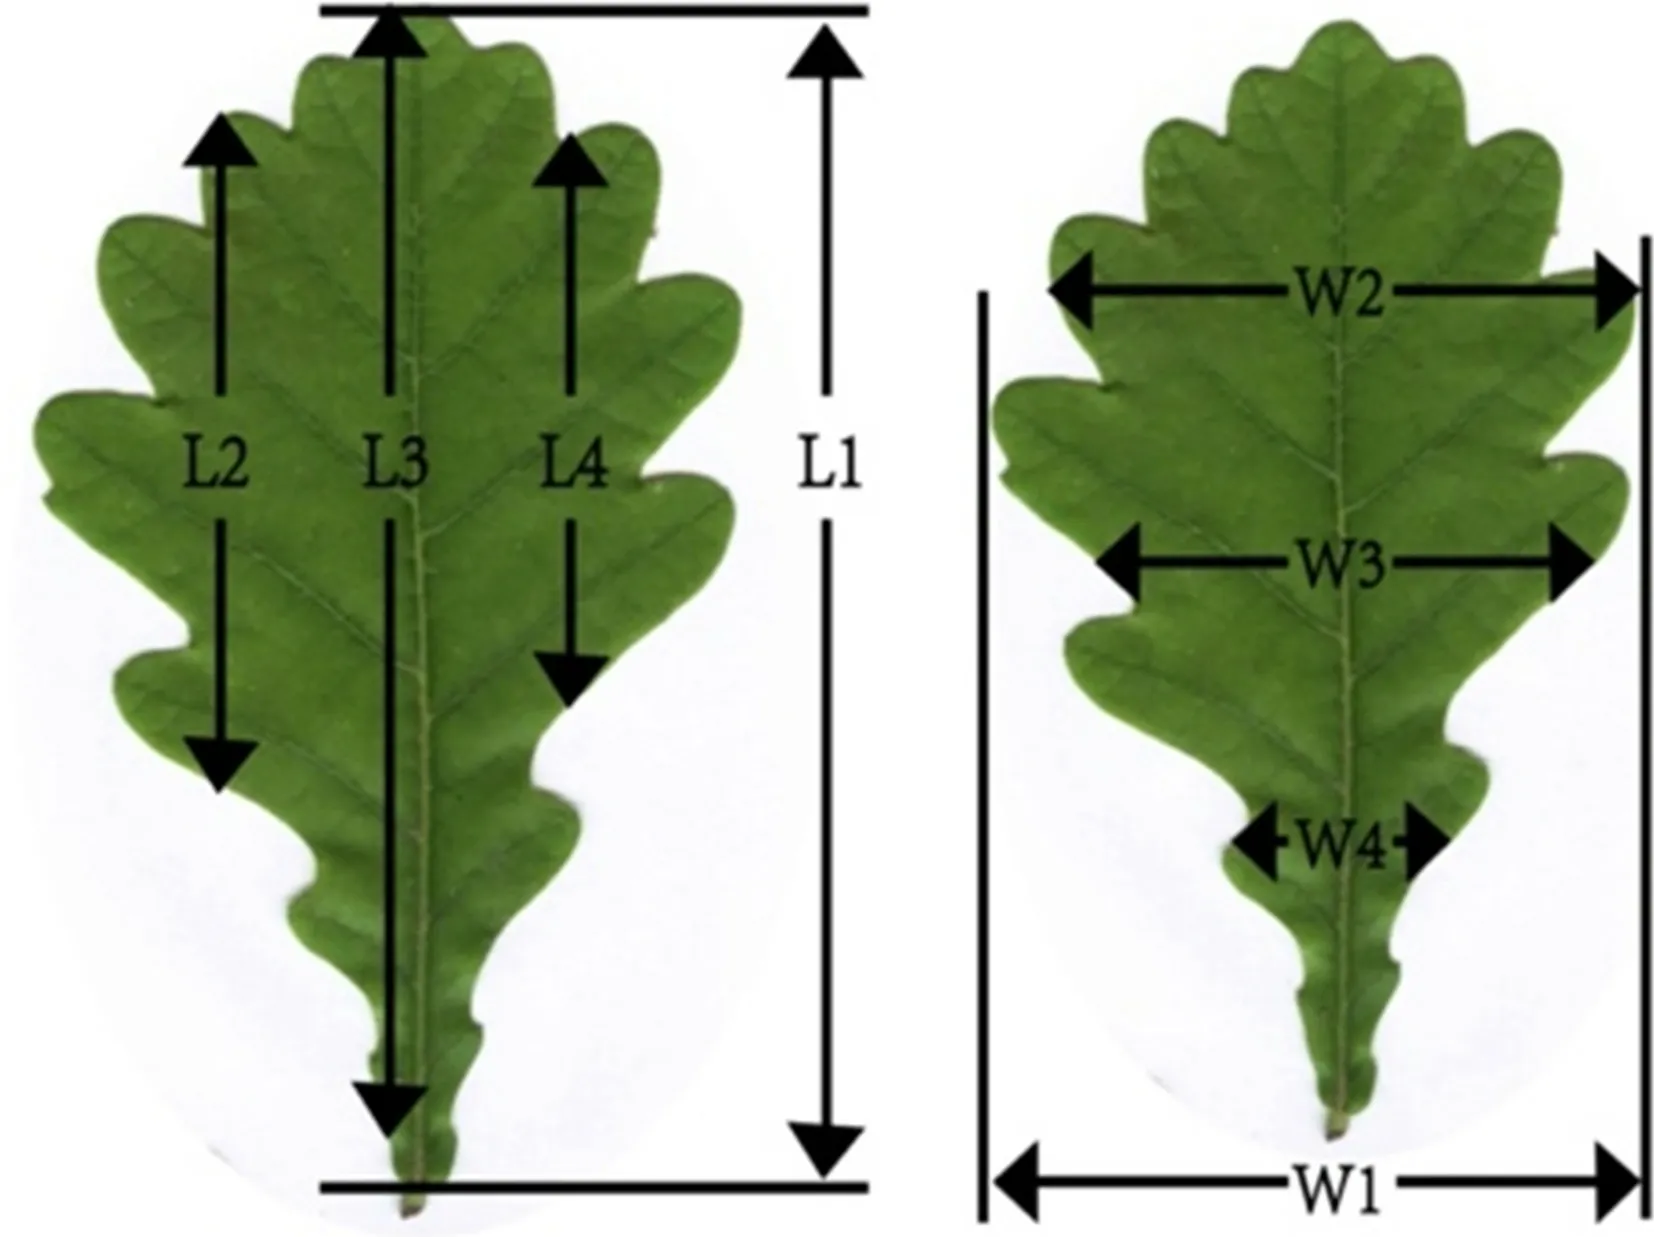
Fig. 2 Schematic diagram of leaf characters. L1: length; L2: length at 1/4; L3: length at 1/2; L4: length at 3/4; W1: width; W2: width at 1/4; W3: width at 1/2; W4: width at 3/4
Results
Intraspecif ic leaf shape variation based on TMMs
PCA results showed three principal components based on 15 characteristic parameters (Table 2); the f irst two PCs accounted for 73.6% of the total leaf shape variables (PC1 for 57.6%, and PC2 for 16.0%). As shown in Fig. 3, the f irst two principal components distinguished the three provenances. Along the PC1 axis, H1 and H3 were obviously separated, whereas H2 was dispersed between H1 and H3.The load coeffi cients of each component in Table 2 showed the main diff erences in leaf morphology among the three provenances. The load coeffi cients of leaf area, perimeter,length, 1/2 leaf width, and width on the f irst principal component were larger than other factors on this component,which the factors related to leaf size; however, the load coeffi cients of the length-width ratio and circularity on the second principal component were larger than other factors on this component, which the factors related to leaf shape.These morphological indices have a high degree of variation and play an important role in population classif ication.
Intraspecif ic leaf shape variation based on GMMs
Excluding the influence of the position and size of the leaves, the scatter plots were centrally distributed around the corresponding 13 leaf landmarks so that all the leaves coincided with each other as much as possible. This showed that GPA (generalized procrustes analysis) could well ruleout the diff erences in leaf position and size. On the GPA scatter plot (Fig. 4), the top is the leaf apex, and the bottom the leaf base. The blue dots are the average outline of the leaf shape constructed according to the leaf landmarks, and the red number is the serial number of the landmarks.
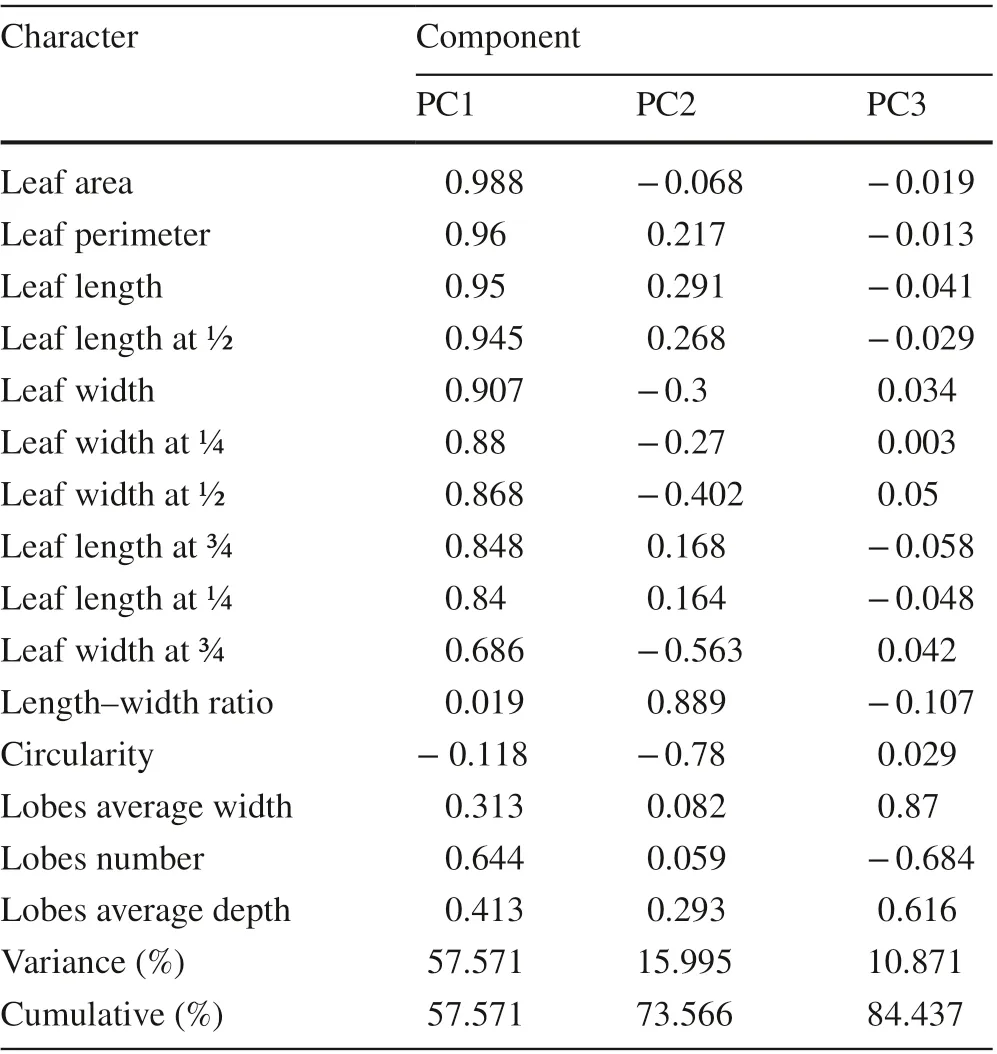
Table 2 Component matrix and contribution rates
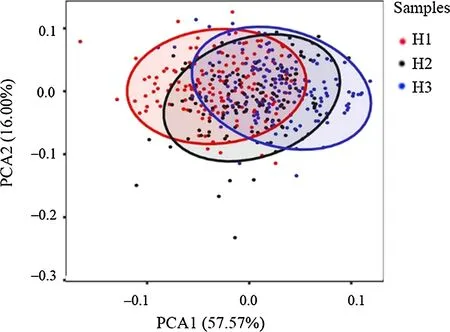
Fig. 3 PCA scatter plot within Quercus dentata provenances based on traditional morphometric methods
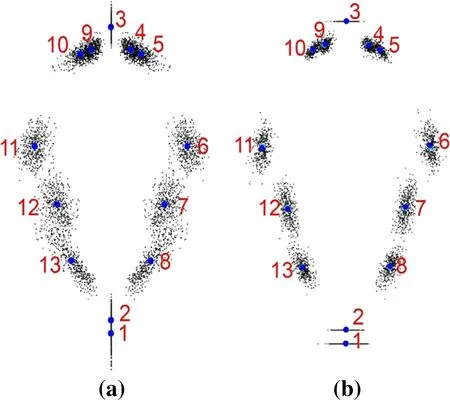
Fig. 4 GPA of the leaf shape: a symmetric components and b asymmetric components
PCA was carried out on the symmetrical and asymmetric components of leaf morphology of the three provenances and revealed 11 principal components based on symmetrical components (Table S1). The f irst two PCs accounted for 74.7% of the total leaf shape variables (PC1 accounted for 43.7%, and PC2 accounted for 31.0%). Eleven principal components were also obtained, based on the asymmetric components (Table S2). The f irst two PCs accounted for 73.3% of the total leaf shape variables (PC1 accounted for 55.2%, and PC2 accounted for 18.1%). In the scatter plot of the PC1 and PC2 scores for the symmetric components generated by PCA (Fig. 5 a), along the PC1 axis, leaves of H1 and H3 formed diff erent groups, whereas leaves of H3 were scattered between the H1 and H2 groups. This result is consistent with that of the TMMs. In the scatter plot of the PC1 and PC2 scores for the asymmetric components generated by PCA, the specimens were more fully and densely overlapped than scattered (Fig. 5 b). The three provenances were also separated on the PC1 axis, but the diff erence was smaller than that of the symmetrical components.
Based on the symmetrical components, the transformation grid of H1, H2, and H3 at the extreme value in the positive and negative direction of the PC1 axis (Fig. 5 c) showed that the leaf morphology of the three provenances had a similar trend. From the negative value to the positive value of the PC1 axis, the leaf shape changed from lanceolate to nearly oval. The upper part of the leaf (LM6 and LM11 at the widest part to LM3 at the top of the leaf) gradually expanded, and the leaf apex changed from acuminate to obtuse. The leaf base (LM8 and LM13 to LM2) changed from narrow to wide, and the degree of lobes (relative position of LM7 and LM12) gradually increased. The distance between the widest part of the leaf (LM6 and LM11) and the f irst basal lobe from the petiole (LM8 and LM13) gradually became shorter, and the petiole (distance between LM1 and LM2) lengthened. H1 was distributed in the range of - 0.2 to 0.13, H2 - 0.15 to 0.18, and H3 - 0.15 to 0.2. The variation span of H3 was the largest. In the transformation grid of the asymmetric components (Fig. 5 d), the shape variation along the PC1 axis was mainly the change in the relative position of the greatest width of the leaf (LM6 and LM11) on the left and right sides of the leaf. The negative value of the PC1 axis showed that the greatest width on the left side of the leaf(LM11) was closer to the apex of the leaf than the greatest width on the right side (LM6). The opposite was observed along the positive PC1 axis. The variation span of H3 was the largest and that of H1 was the smallest.
Allometry
Allometry based on TMMs
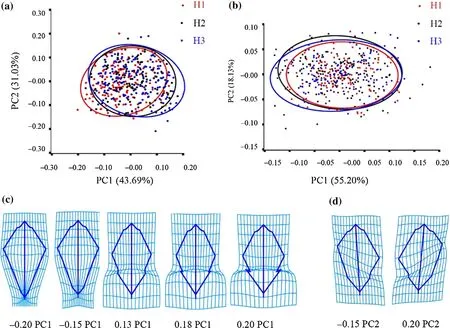
Fig. 5 PCA within Q. dentata provenances based on geometric morphometric analyses; PCA conducted at the leaf level for ( a) symmetric and ( b) asymmetric components; the scatter plots show only the f irst two PCs (PC1 and PC2). Transformation grid of ( c) symmetric and ( d) asymmetric components: the shapes for the PC scores of negative and positive extremes (+ , -)
At the tree level, PLS (partial least square) was used to analyze the allometric relationship between leaf morphological characteristics and leaf size (area). Leaf area (y) was taken as an dependent variable, and leaf perimeter (x1), circularity(x2), width (x3), width at 1/4 (x4), width at 1/2 (x5), width at 3/4 (x6), length (x7), length at 1/4 (x8), length at 1/2 (x9),length at 3/4 (x10), length-width ratio (x11), lobe number(x12), lobe average width (x13), and lobe average depth (x14)were taken as independent variables. PLS regression results of the three provenance-dependent variables with respect to the independent variables were obtained (Table 3) and show the degree of inf luence of each quantitative character index on leaf area. In H1, lobe average depth (x 14 ),length-width ratio (x11), and lobe average width (x13) were the main factors aff ecting leaf area, and the regression coefficients were - 137.979, - 115.769, and 45.092, respectively. In H2, the average depth of lobes (x14), length-width ratio (x11) and average width of lobes (x13) were the main factors aff ecting leaf area, and the regression coeffi cients were - 134.952, - 79.501, and 28.674, respectively. In H3,the average lobe depth (x14), length-width ratio (x11), and circularity (x2) were the main factors aff ecting leaf area,and the regression coeffi cients were - 162.698, 30.8 44,and 19.123, respectively. H3 showed diff erent regression coeffi cients; x 2 is relatively larger than x 3 which is diff erent from two other strains; the coeffi cients of × 6 and × 8 are negative numbers whereas the coeffi cients are positive numbers for two other strains, and the coeffi cient of × 11 is a positive number whereas the coeffi cients are negative numbers for two other strains. This shows that in H3, the eff ect of circularity on leaf area is greater than that of leaf width, and the larger the width, the smaller the leaf area; the larger length-width ratio, the smaller the leaf area. While H1 and H2 are opposite to H3, circularity, leaf width, and length-width ratio are the important indices to distinguish H1, H2 and H3 provenances.
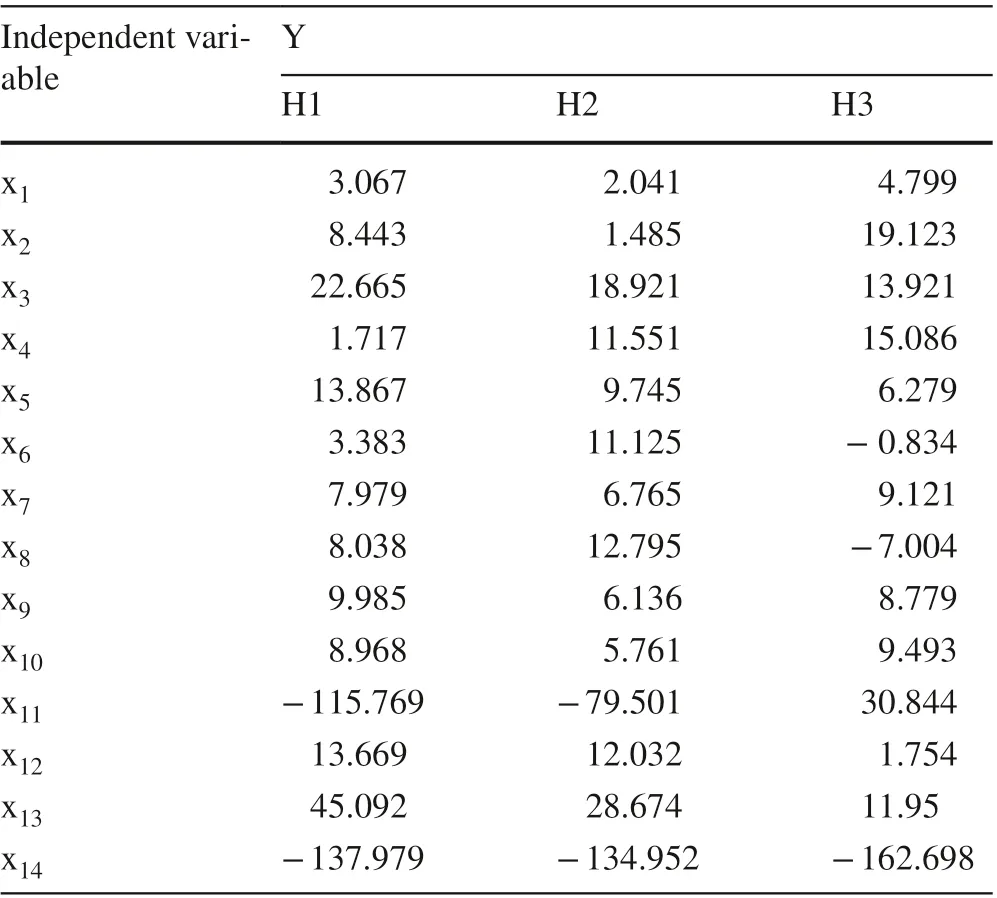
Table 3 Regression coeffi cient results
Allometry based on GMMs
At the tree level, PLS analysis was used to examine the allometric growth of the symmetrical and asymmetric components of the leaves. The results showed that there was a prominent covariant relationship between the leaf symmetrical components and size of the three provenances (RV coeffi cient was 0.1414,P< 0.0001). However, the covariant relationship between the leaf asymmetric components and size was not prominent (RV coeffi cient was 0.0024,P= 0.9474). As can be seen from the transformation grid,along the negative axis to the positive axis of the symmetrical components, with the gradual increase of leaf size, the morphological characteristics (Fig. 6 a: +shape) were as follows: the widest part of the leaf was close to the upper half of the leaf, the upper half shrunk, the apex was acuminate,the base shrank sharply, and the petiole was short. Along the positive axis to the negative axis of the symmetrical components, with a smaller leaf size, morphological characteristics(Fig. 6 a: - shape) were as follows: the widest part of the leaf was close to the middle-upper part, the upper-half part expanded, the apex was obtuse, the base expanded, and the petiole lengthened. Leaf size of H1 was largest, the leaf size of H3 was smallest, and the relationship between the leaf size and morphology of H2 was distributed between the H1 and H3 populations. The analysis of the asymmetric components and size showed that all scattered spots were almost on the same horizontal line (Fig. 6 b), and no allometric patterns were observed among the three provenances.
Discriminant analysis of leaf shape
Discriminant analysis of intraspecif ic morphological variation of three provenances of Q. dentata based on TMMs
A total of 150 samples from three provenances were discriminated by DA (discriminant analysis) at the tree level.This method analyzed 15 characteristic parameters of all samples ofQ. dentataby a discriminant function and crossvalidation function. The results show that the correct rate of the discrimination function was 72.0%: 74.0% of H1, 68.0%of H2, and 74.0% of H3 were correctly classif ied (Table 4).The correct rate of cross-verif ication was 65.3%: 66.0% of H1, 58.0% of H2, and 72.0% of H3 were correctly classif ied.
Discriminant analysis of intraspecif ic morphological variation of three provenances of Q. dentata based on GMMs
Intraspecif ic DA of the three provenances was carried out at the tree level, (three leaves of each tree averaged to reduce error and better represent the individual). Three sets of discriminant analysis graphs were obtained (Fig. 7),which showed that there was more overlap between H2 and H3 and less between H1 and H3. The correct rate of the discrimination function was 78.7%: 86.0% and 78.0% of H1 and H2 (Fig. 7 a), 70.0% and 80.0% of H1 and H3 (Fig. 7 b), and 82.0% and 76.0% of H2 and H3(Fig. 7 c), respectively. The correct rate of cross-validation was 70.3%: 76.0% and 72.0% of H1 and H2, 60.0% and 70.0% of H1 and H3, and 76.0% and 68.0% of H2 and H3,respectively.
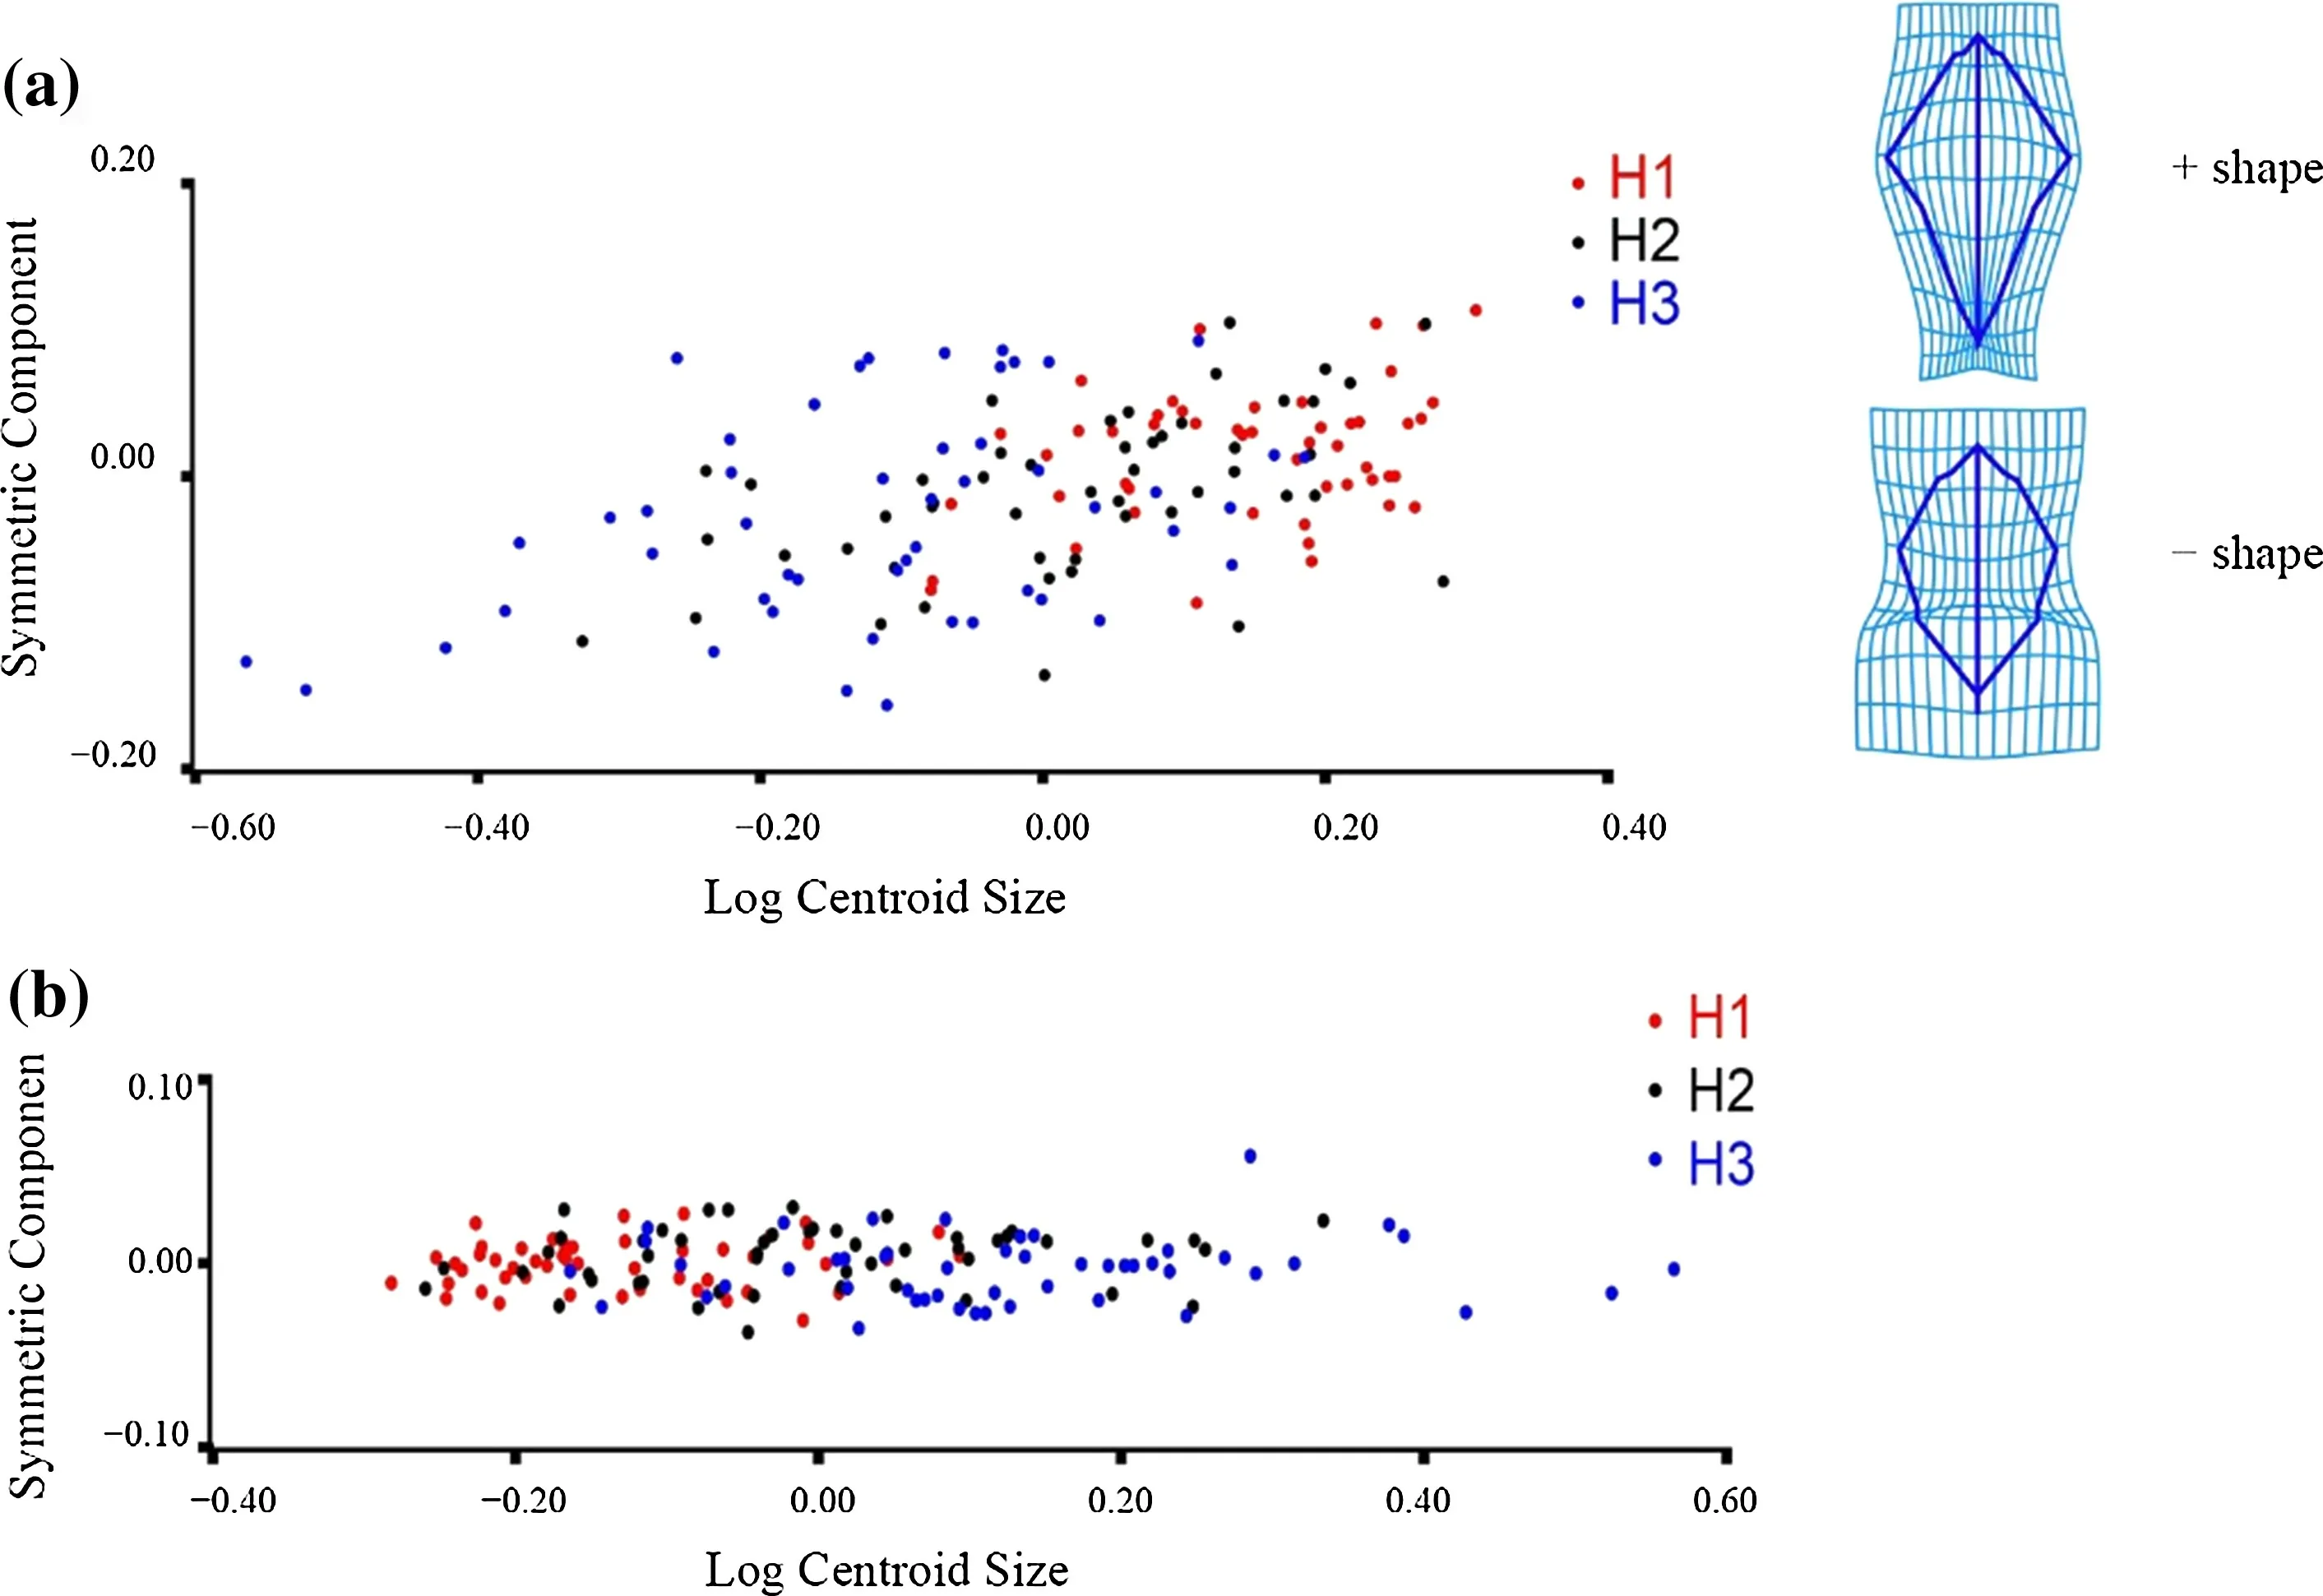
Fig. 6 PLS of three provenances of Q. dentata based on geometric morphometric analyses: a scatter plot obtained by regression of the symmetric component on the size (log centroid size); grids show the leaf shape changes for negative(shape) and positive (+ shape)extremes of the symmetric component regression scores;and b scatter plot obtained by regression of the asymmetric component on the size (log centroid size)
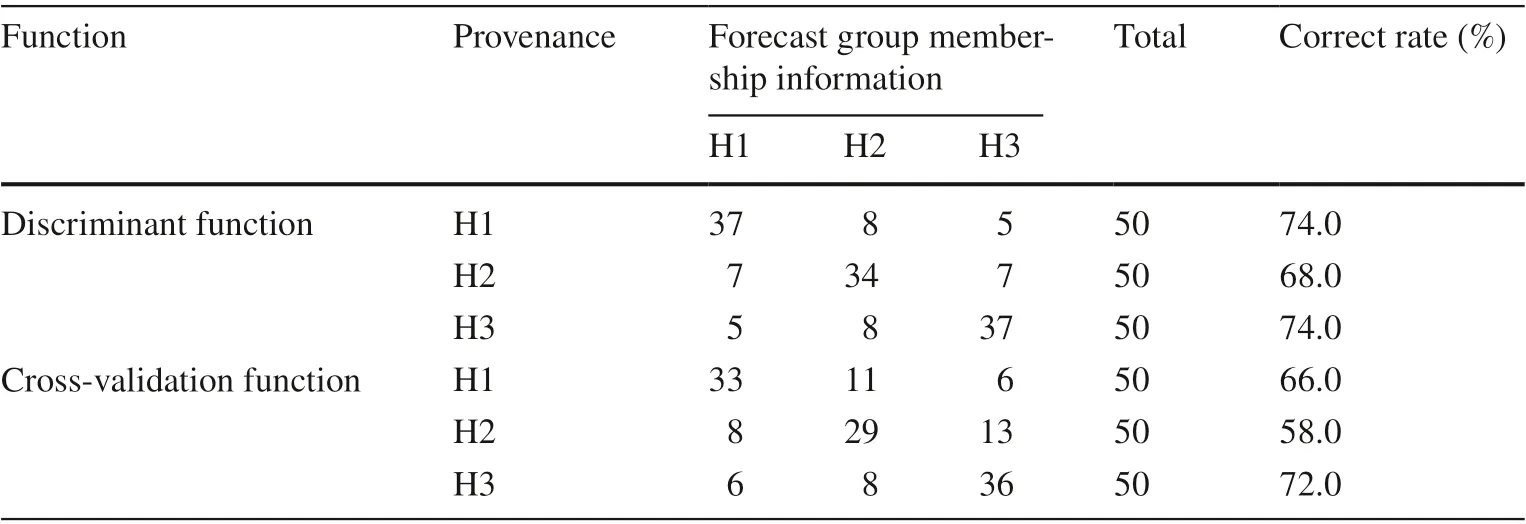
Table 4 Classif ication results within Q. dentata provenances based on traditional morphometric methods
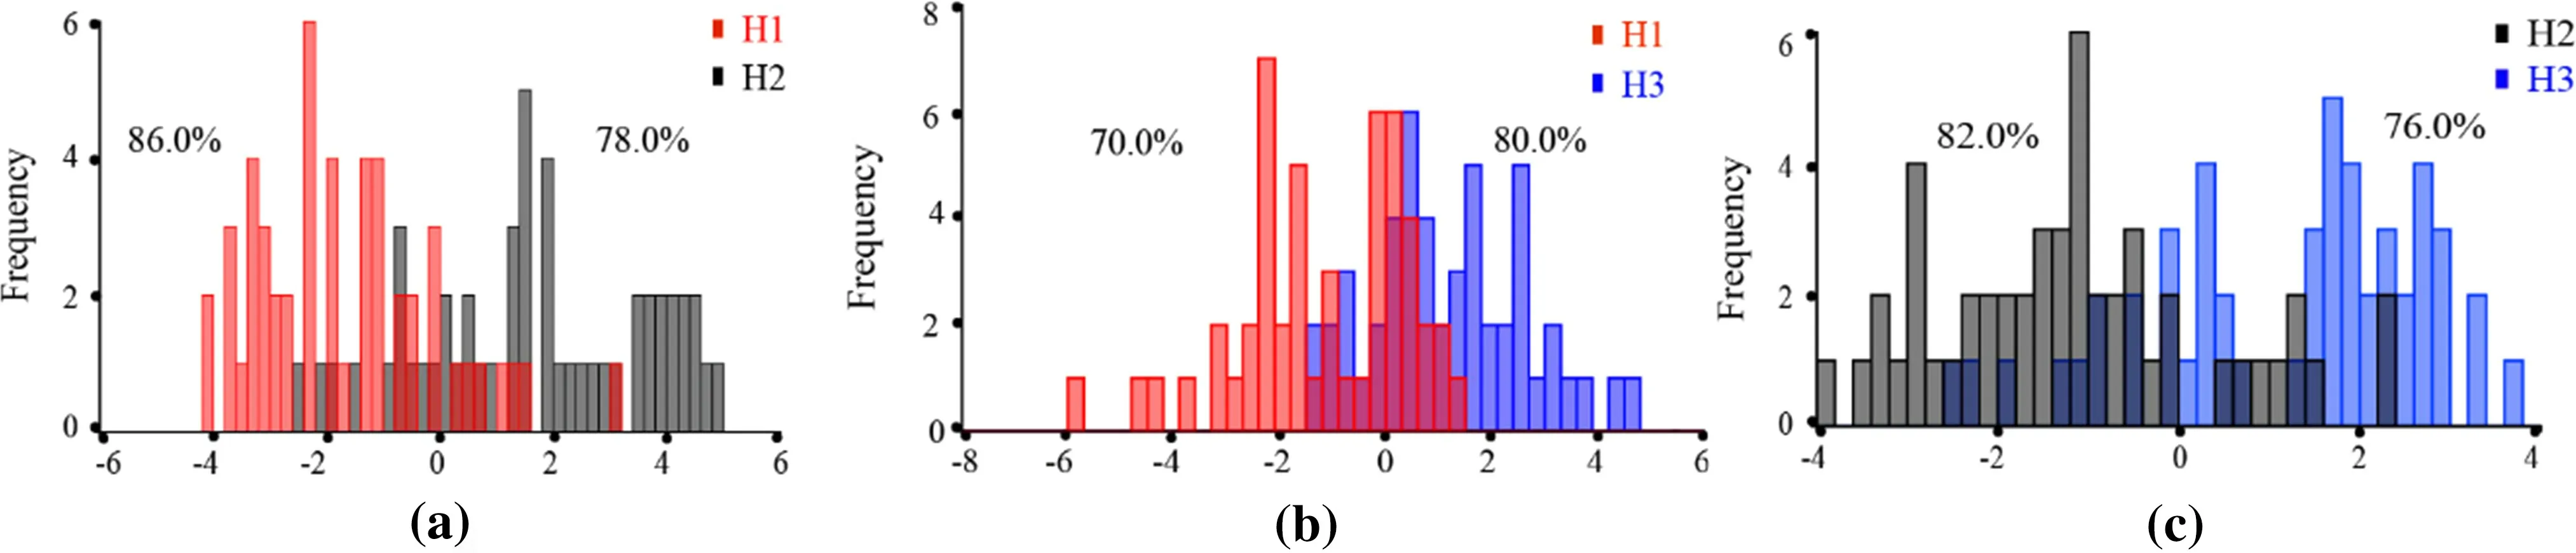
Fig. 7 DA within Q. dentata provenances based on geometric morphometric methods from the discrimination function: a H1 versus H2, b H1 versus H3, and c H2 versus H3
Cluster analysis of leaf shape
Cluster analysis of intraspecif ic morphological variation of three provenances of Q. dentata based on TMMs
A cluster analysis was carried using the Mahalanobis distance (i.e., the shortest distance method). The result is shown in Fig. 8; the Mahalanobis distances of H1 and H2, H2 and H3, and H1 and H3 were 4.3761, 10.2067, and 11.4629,respectively. The Mahalanobis distance between H1 and H2 was the smallest, and the Mahalanobis distance between H1 and H3 the largest.
Cluster analysis of intraspecif ic morphological variation of three provenances of Q. dentata based on GMMs
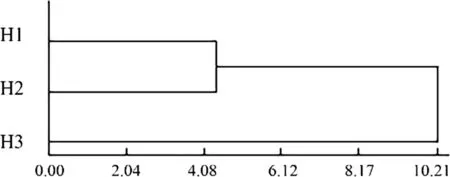
Fig. 8 CA within Q. dentata provenances based on traditional morphometric methods
The threeQ. dentataprovenances were clustered at the tree level. The clustering scatter plot (Fig. 9) shows an obvious separation among the three groups from negative to positive values along the CV1 axis and CV2 axis: H1, H2, and H3 were clustered into three groups (CV1 accounted for 56.6%of the total variation, and CV2 accounted for 43.4% of the total variation). The Mahalanobis distances between H1 and H2, H1 and H3, and H2 and H3 were 1.7238, 1.5380, and 1.6329, respectively. It was largest between H1 and H2 and smallest between H1 and H3. This is contrary to CA results based on TMMs. The transformation grid shows the main diff erences among the three provenances at the tree level.On the CV1 axis, H1 was mainly distributed in the negative direction and the morphology is like that shown in Fig. 9-CV1; H2 was mainly distributed in the positive direction of the CV1 axis, and the morphology is like that in Fig. 9 CV1 + . It can be seen from the transformation grid corresponding to the two extremes values of the CV1 axis that the main diff erence between H1 and H2 was that the apex and base of the H1 leaves were blunt, and the f irst basal lobes (LM8 and LM13) were farther away from the widest part. The apex and base of the H2 leaves were pointed,and the distance between the f irst basal leaf and the widest part of the leaf was shorter. On the CV2 axis, H1 and H2 were mainly distributed in the negative direction, and the morphology is like that in Fig. 9 -CV2. H3 was mainly distributed in the positive direction of the CV2 axis, and the morphology is like that in Fig. 9 CV2 + . It can be seen from the transformation grid corresponding to the two extreme values of the CV2 axis that the main diff erence among the leaves of the three provenances is that the base of the leaves of H1 and H2 was narrower, the petiole shorter, the distance between the f irst basal lobe and the widest part of the leaf longer the base of the H3 leaf was wider, the petiole longer,and the distance between the f irst basal lobe and the widest part of the leaf was shorter.
Discussion
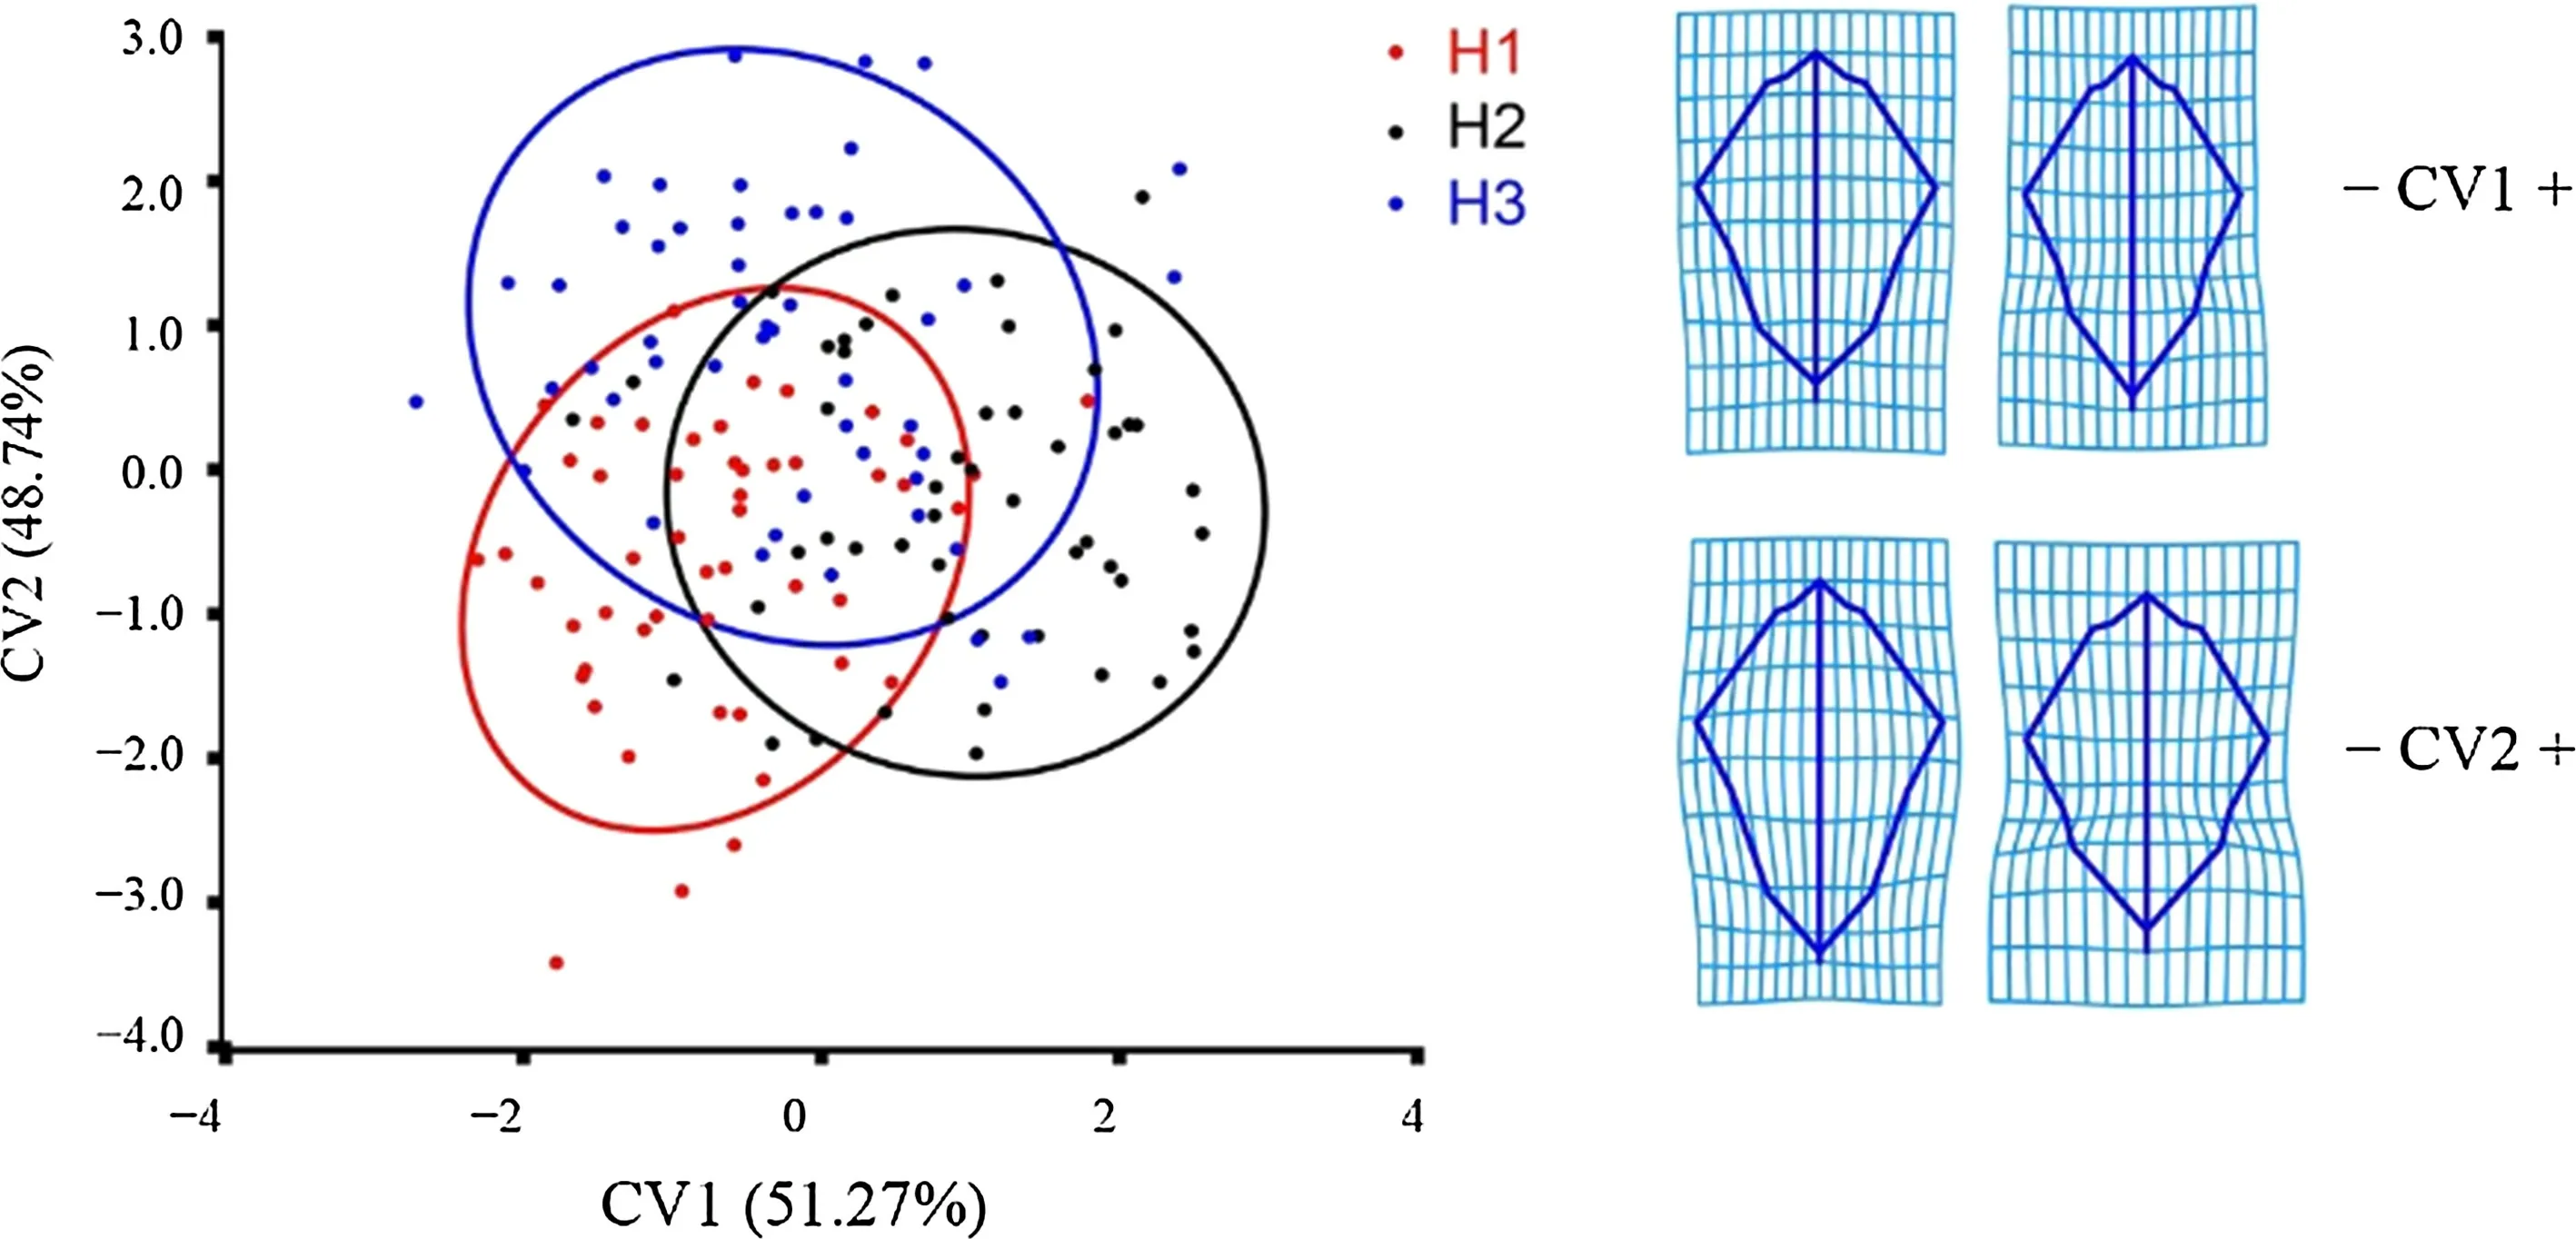
Fig. 9 CVA within Q. dentata provenances based on geometric morphometric methods; transformation grids represent leaf shapes ref lecting the negative(- shape) and positive (+ shape)extremes of the CV1 and CV2 axes
Measurements of TMMs are generally the ratio and product of the linear distance or the linear distance measured on the organism, such as length, width, and area. These measurements are signif icantly related to the size of the measured leaf, and the analysis results are sensitive to the selected specif ic distance or ratio, so it is diffi cult to obtain stable shape variables without size using TMMs (Reyment 1985; Rebeka et al. 2017; Fang et al. 2018; Cramon-Taubadel 2019). However, GMMs separate the leaf shape from the leaf size and carry out the statistical analysis (Savriama and Klingenberg 2011; Tomic et al. 2015). GMMs retain the shape variables,and the shape diff erence not related to size can be obtained by coordinate transformation analysis (Viscosi et al. 2012;Igual et al. 2014). In addition, GMMs use the overlap of the transformation grid and wireframe graphs to simulate the changing trends of leaf morphological characteristics (Klingenberg 2011; Viscosi and Cardini 2011). Thus, the main diff erences in leaf morphology among the three provenances ofQ. dentatacould be seen directly.
TMM uses PCA to extract three principal components,and the cumulative contribution rate of the f irst two reached 73.6%. The PCA scatter plot showed that the f irst two principal components distinguished the three provenances. From negative to positive along the PC1 axis, H1 and H3 were obviously separated, whereas H2 was distributed between H1 and H3. TMMs could not provide the changing trend of leaf morphology of the three provenances, and it was impossible to compare their morphology. The absolute value of the load coeffi cient of each factor ref lects the main determinant of leaf shape variation. The variation degree of leaf size was the highest, followed by leaf shape. This proves that, because the TMMs cannot separate the two factors of leaf size and shape, research results of leaf morphological variation are often aff ected by size. GMMs exclude the inf luence of size on shape variation in PCA and analyze only the inf luence of leaf morphology (symmetrical and asymmetric components) on shape variation. Eleven principal components were obtained based on symmetrical components, and the f irst two PCs accounted for 74.7% of the total shape variables.The PCA scatter plot showed that along the PC1 axis, H1 and H3 formed diff erent groups, whereas H2 was scattered between H1 and H3, which was similar to the results of the TMMs. The transformation grids also showed the changing trend of leaf morphology of the three provenances, and the diff erences were concentrated mainly in the changing trends of the apex, base, petiole length, and leaf splitting degree.However, the asymmetric components of leaves could not provide information about intraspecif ic diff erences, perhaps because they are related to external related variables, such as environmental factors (Klingenberg et al. 2002). In future research, the asymmetric components of leaves can be used to further study the eff ects of ecological factors on species.
PLS analysis based on TMMs ref lected the degree of correlation between leaf size and each morphological character but could not ref lect the changing trends of morphological characteristics with leaf size. The main characters aff ecting leaf size of H1 and H2 were the same-that is, the average depth of the lobes, length-width ratios, and lobe average width. The main morphological characters that inf luenced the leaf size of H3 were the lobe average depth,length-width ratios, and circularity. And the important indices to distinguish H1, H2 and H3 are circularity, leaf width,and length-width ratio. GMMs separated the symmetrical and asymmetric components of leaves for PLS analysis. The distribution of the scatter points between leaf size and leaf morphology of diff erent provenances could be seen in the scatter plots. The changing trend in morphology with the change in leaf size could be seen from the change in shape of the transformation grid. GMMs showed signif icant allometric patterns between symmetrical components and leaf size. With the enlargement of the leaf, the widest part gradually moved upward and shape changed from nearly oval to lanceolate. There was no signif icant allometric patterns of asymmetric variation for leaves of H1, H2, and H3. Several studies have found that the symmetrical components of leaf shape are related to genetic factors, the asymmetric components are generally related to environmental changes, and leaf size is aff ected by both heredity and the environment(Viscosi et al. 2012; Viscosi 2015). TMMs cannot distinguish between symmetry and asymmetry, and it is impossible to determine whether leaf shape changes are caused by phenotypic plasticity or genetic diff erentiation according to PLS analysis. In this study, with the use of GMMs, we found that the allometric patterns of H1, H2, and H3 were aff ected mainly by genetic factors.
The DA based on TMMs can investigate two or more groups, and the correct rate of the discrimination function was 72.0%, whereas the DA based on GMMs mainly focused on two groups, and the correct rate of the discrimination function was 78.7%. Neither of the two methods achieved a rate of 100% but the rate of GMMs was higher than that of TMMs. Li ( 2020) also failed to distinguish all the intraspecif ic diff erent families ofQuercus aquifolioidesRehder.& E.H. Wilson andQuercus spinosaDavid by means of GMMs. Therefore, when leaf shapes of diff erent populations were similar, the number of landmarks could be increased,such as the bifurcation point of the secondary vein or the sample size to improve the accuracy of the discrimination results.
CA based on TMMs showed that the Mahalanobis distances between H1 and H2, H1 and H3, and H2 and H3 were 4.3761, 11.4629, and 10.206, respectively. It was smallest between H1 and H2 and largest between H1 and H3. CA based on GMMs shows that the Mahalanobis distances between H1 and H2, H1 and H3, and H2 and H3 were 1.7238, 1.5380, and 1.6329, respectively. Between H1 and H2, it was the largest, and between H1 and H3, it was the smallest, contrary to the result of cluster analysis based on TMMs. The reason for this may be that the CA of GMMs was based on leaf symmetrical components at the tree level(the average data of f ive leaves per tree), which had a large amount of data, was more accurate, and better reduced the test error. However, the CA of TMMs was carried out at the population level (the average data of all trees per provenance); the sample size was small, and the symmetrical components could not be separated for analysis. In future studies, the sample size will be increased to further verify this result.
An early comparative study ofQuercusshowed that it was diffi cult to identify the population completely using only a linear measurement method (Viscosi et al. 2009b). First,the linear measurement indices cannot provide information about the diff erence in leaf geometry. Second, the traditional linear measurement methods cannot rule out the eff ect of leaf size on shape variations (Huff ord 2003). Leaf size is considered labile with variation mostly inf luenced by environment(phenotypic plasticity) (Sun et al. 2016; Wright et al. 2017),and the diff erence in morphology caused by environmental changes cannot accurately explain the morphological diff erences among diff erent populations (Cardini and Elton 2009).Therefore, the TMMs generally require all the experimental populations to grow in the same environment to reduce the inf luence of environmental conditions so that the morphological diff erences analyzed can more strongly ref lect the genetic diff erences. Compared with the measurement indicators, leaf shape can be more conserved and variation usually genetically structured (Cardini and Elton 2009; Viscosi et al.2012; Chitwood et al. 2014; Maestri et al. 2016). The diff erence in leaf shape can accurately ref lect genetic diff erences among populations. Therefore, for several populations growing in diff erent environments, it is obviously more appropriate to compare their leaf morphological variations by means of geometric morphometry. A comparative study on the leaf morphology of four oak species by means of GMMs showed that the “dimensionless” geometric morphometric method can clearly distinguish the species by analyzing only the leaf shape (Viscosi et al. 2009a). The role of GMMs in the study of interspecif ic leaf shape variation has been well conf irmed(Jensen et al. 2002; Li et al. 2019); in practice, however,there are still some def iciencies in the study of geometric morphology (Ge et al. 2012). First, when the leaf shape of several populations is similar and their leaf size is caused by genetic factors (Viscosi et al. 2012), GMMs are likely to group these populations into one category, thus aff ecting the accuracy of the results of population classif ication.Therefore, TMMs are obviously more suitable for analyzing these kinds of data. Second, the claim that the measurement indices are easily aff ected by changing environmental conditions, which aff ect the morphological diff erences in leaves among populations, while the leaf shape is relatively stable and is not easily aff ected by environmental conditions, still needs to be further verif ied. Third, GMMs are used to study relatively rigid morphological structures. At present, there is no good method to analyze structures such as lines and f ine hairs on the surface of organisms. Fourth,the results revealed by geometrical morphology may only be the phenotypic similarities or diff erences among diff erent study subjects. Whether the phenotypic similarities or diff erences among diff erent study subjects can accurately ref lect the phylogenetic relationship among species needs to be analyzed comprehensively in combination with other data (Su et al. 2021).
Conclusions
Both GMMs and TMMs showed signif icant diff erences in leaf morphology among the threeQ. dentataprovenances,but GMMs had a higher classif ication accuracy and could provide more information about shape, whereas TMMs could provide more information about size. Based on our results, GMMs should be considered more suitable for the study of leaf morphological variations withinQ. dentataspecies than TMMs. This paper provides a new reference for selecting appropriate research methods for studying the morphological diff erences ofQ. dentatain the future.
Acknowledgements We would like to thank the Administration Bureau of Hongyashan State Owned Forest Farm in Yixian County for providing the seedlings ofQ. dentataand to Letpub (https:// www.letpub. com .) for English language editing of this manuscript.
 Journal of Forestry Research2022年6期
- Journal of Forestry Research的其它文章
- Mixing planting proportions in a plantation aff ects functional traits and biomass allocation of Cunninghamia lanceolata and Phoebe bournei seedlings
- Mapping the potential distribution suitability of 16 tree species under climate change in northeastern China using Maxent modelling
- Correction to: Eff ects of active molecules of Korean pine seed on rodent health and implications for forest regeneration
- Seed, germination, and seed-reserve traits diff er along an altitudinal gradient
- Analysis of the chloroplast genomes of four Pinus species in Northeast China: Insights into hybrid speciation and identif ication of DNA molecular markers
- Genetic variation and superior provenances selection for wood properties of Larix olgensis at four trials