
Mask R-CNN and multifeature clustering model for catenary insulator recognition and defect detection
2022-09-26 08:23:52PingTANXufengLIJinDINGZhishengCUIJienMAYuelanSUNBingqiangHUANGYoutongFANG
Ping TAN, Xu-feng LI, Jin DING, Zhi-sheng CUI, Ji-en MA, Yue-lan SUN, Bing-qiang HUANG, You-tong FANG
Research Article
Mask R-CNN and multifeature clustering model for catenary insulator recognition and defect detection
Ping TAN1, Xu-feng LI2, Jin DING, Zhi-sheng CUI1, Ji-en MA, Yue-lan SUN1, Bing-qiang HUANG1, You-tong FANG2
1School of Automation and Electrical Engineering, Zhejiang University of Science and Technology, Hangzhou 310023, China2College of Electrical Engineering, Zhejiang University, Hangzhou 310027, China
Rod insulators are vital parts of the catenary of high speed railways (HSRs). There are many different catenary insulators, and the background of the insulator image is complicated. It is difficult to recognise insulators and detect defects automatically. In this paper, we propose a catenary intelligent defect detection algorithm based on Mask region-convolutional neural network (R-CNN) and an image processing model. Vertical projection technology is used to achieve single shed positioning and precise cutting of the insulator. Gradient, texture, and gray feature fusion (GTGFF) and a K-means clustering analysis model (KCAM) are proposed to detect broken insulators, dirt, foreign bodies, and flashover. Using this model, insulator recognition and defect detection can achieve a high recall rate and accuracy, and generalized defect detection. The algorithm is tested and verified on a dataset of realistic insulator images, and the accuracy and reliability of the algorithm satisfy current requirements for HSR catenary automatic inspection and intelligent maintenance.
High speed railway (HSR) catenary insulator; Mask region-convolutional neural network (R-CNN); Multifeature fusion; K-means clustering analysis model (KCAM); Defect detection
1 Introduction
High speed railways (HSRs) have in recent years developed by leaps and bounds all around the globe, especially in China. Due to their short travel time, HSRs are very convenient for transferring to other means of transportation, and are environmentally friendly with high energy efficiency (Tan et al., 2016, 2020, 2021; Zhu et al., 2018). The HSR catenary is the power source for high speed trains (HSTs), and catenary support devices are its key components. The insulators are the important part of catenary support devices, providing electrical isolation and support. Insulator failure results in insulation deterioration, leading to outages and safety issues. Therefore, insulator defect detection is very important. The structure of an HSR catenary support device and its insulators is shown in Fig. 1.
Two methods are commonly used for monitoring HSR catenaries. One is a manual method. The other involves taking images of the catenary and its components from a moving catenary inspection vehicle, and checking of the images one by one by an examiner. If a new image processing algorithm or method could meet the needs of reliability, high accuracy, and real time performance, automatic catenary defect detection could be realized. A catenary system is composed of many components, and detection of defects in the different components requires different algorithms and technical means. This paper is concerned mainly with the analysis of catenary insulator defect detection.
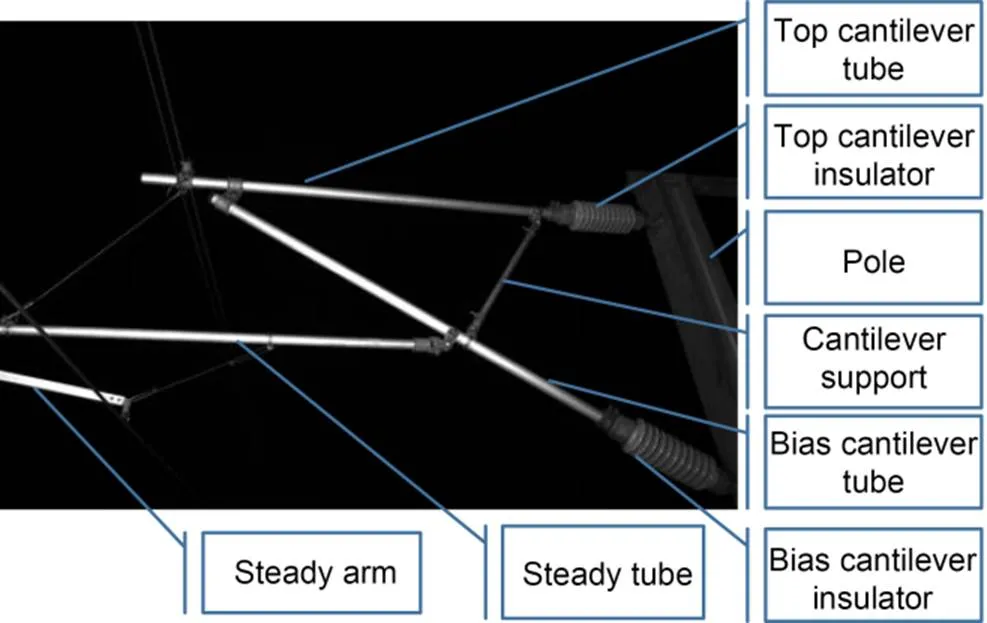
Fig. 1 HSR catenary support device structure
Insulator pictures taken during the inspection of vehicle movement are not taken statically. This results in large differences in the exposure, distance, and angle of the images. So image consistency is poor. Furthermore, there are many kinds of insulator defects and they are not completely predictable. It is difficult to achieve highly accurate defect detection.
There has been considerable research on the automatic recognition and intelligent detection of insulators based on image processing technology. Yao et al. (2018) proposed a method to detect insulator contamination based on a SURF (speed up robust features) characteristic sample library, using machine vision technology. Adou et al. (2019) proposed an object detection algorithm, You Only Look Once (YOLO) V3, to perform insulator localization and bunch-drop detection. Jiang et al. (2019) proposed the use of multi-level perception methods to detect faulty insulators. Zhao et al. (2019) proposed a method based on improved Faster region-convolutional neural network (R-CNN) to detect insulators. Wang et al. (2019) proposed a realistic structural health monitoring system for HSTs. Han et al. (2016) used deformable part models and segmented clustering for rod insulators to locate and detect insulators. Yao et al. (2017) used an HSV (hue, saturation, value) model and clustering analysis to detect the pollution of insulators. Lyu et al. (2020) used a generative confrontation network to realize anomaly detection of catenary support components. Kien and Zhuang (2021) proposed a deep learning method that uses artificial neural networks to find the optimal values of an optimization function. Kang et al. (2019) used a Faster R-CNN to localize the key catenary components, and a deep denoising auto-encoder to detect insulator defects. Although much research has been carried out, the results so far have not met the needs of intelligent inspection and maintenance for HSR catenaries. For example, few types of defects can be detected, and the accuracy is sometimes very low.
Aimed at realistic application, in this paper we propose deep learning (LeCun et al., 2015) and a gradient, texture, and gray features fusion (GTGFF) and K-means clustering analysis model (KCAM) to perform intelligent insulator recognition and defect detection.
2 Overall algorithm model
Insulator recognition is the foundation for defect detection. Bias cantilever insulators and top cantilever insulators together with other support components are shown in Fig. 1. It is necessary to locate the area where the insulator is located before performing defect detection. The pixel-level target region of the insulator must be obtained and the insulator must be intercepted accurately. But it is difficult to meet these requirements using current methods.
Ren et al. (2017) proposed an efficient two-step algorithm, Faster R-CNN. The Faster R-CNN is powerful, widely used, and has outstanding comprehensive capabilities and a very important position in the field of target detection (Liu et al., 2019). Mask R-CNN is derived from Faster R-CNN and has an added mask prediction branch and an improved RoIPool (Region of Interest Pool) (He et al., 2017). The Mask R-CNN deep learning model has not only an objection detection function, but also an instance segmentation function. Figs. 2 and 3 show the instance segmentation mask average precision (AP) of different algorithms on common objects in context (COCO) test-dev. Multi-task network cascades (MNC) (Dai et al., 2016) and fully convolutional instance-aware semantic segmentation (FCIS) (Li et al., 2017) have good performance on Microsoft Common Objects in Context (MS COCO) segmentation. Compared with MNC and FCIS, Mask R-CNN achieves the highest AP. So the overall algorithm model in this study was based on Mask R-CNN.

Fig. 3 Average precision at intersection over union (IOU) of 0.5 (AP50) of segmentation mask on COCO test-dev

Fig. 2 Average precision (AP) of segmentation mask algorithms on COCO test-dev. FCIS: fully convolutional instance-aware semantic segmentation; OHEM: online hard example mining; FPN: feature pyramid networks
To detect HSR catenary insulator defects, we designed two sub-algorithm models, and then combined them into one overall algorithm model (Fig. 4). One part is the insulator recognition and intercept correction model based on deep learning technology. The other is the GTGFF-KCAM, which is designed to detect defects in an insulator.
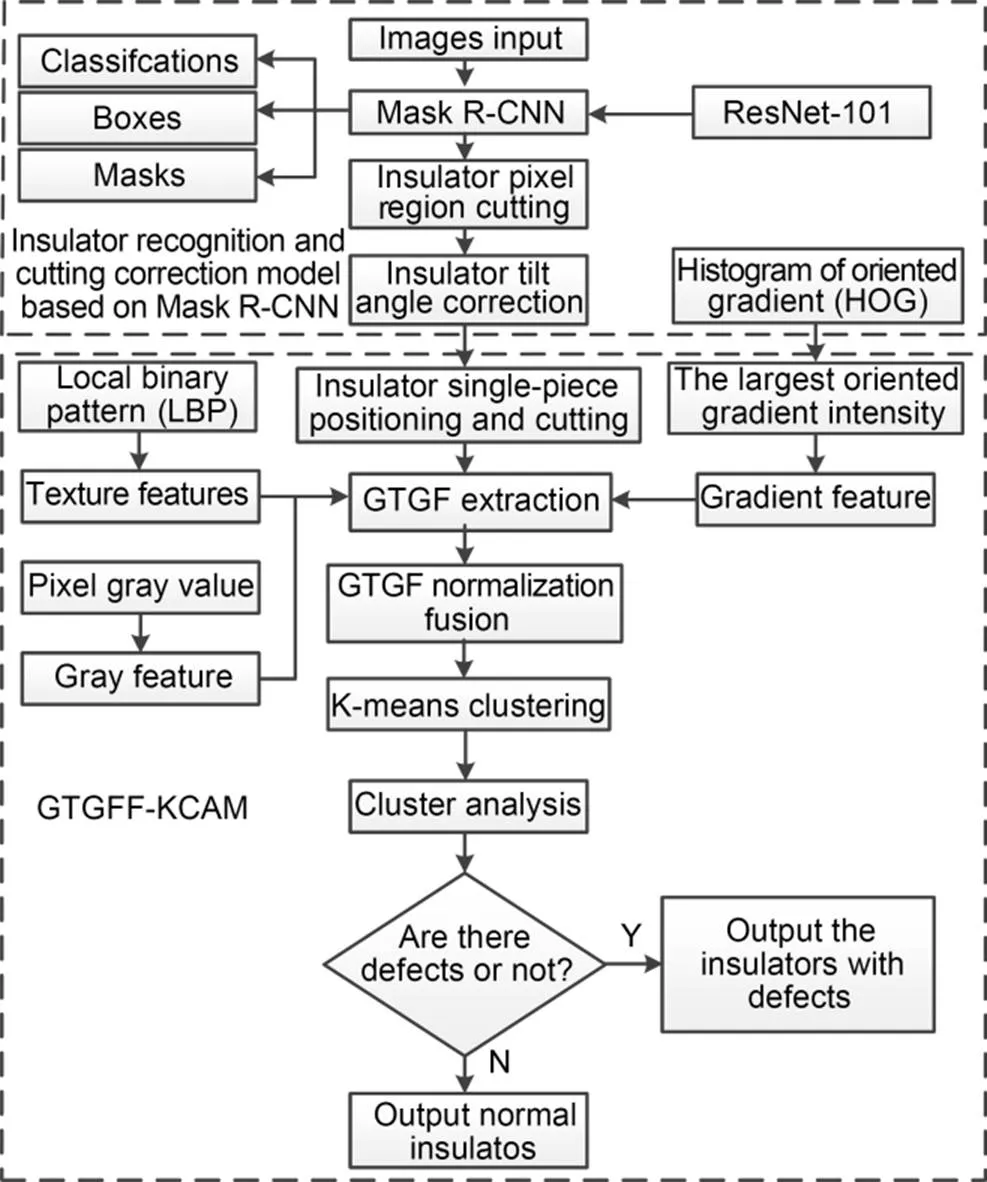
Fig. 4 Overall algorithm model of the insulator detection. GTGF: gradient, texture, and gray features
3 Insulator recognition and region cutting correction based on deep learning
It is necessary to present the recognition of the top and bias cantilever insulators separately and cut out the insulator region accurately. Although the two insulators have different installation angles and positions, their structures and features are similar. Normali zation of the output image size and angle needs to be achieved so that the insulator defect detection model for the top or bias cantilever insulator can adopt a unified model. The insulator recognition and region cutting correction model based on Mask R-CNN is shown in Fig. 5.

Fig. 5 Insulator recognition and region cutting correction model
3.1 Insulator pixel region cutting algorithm
The Mask R-CNN branch has three outputs: classifications, boxes, and mask matrices. The algorithm is proposed to cut the exact pixel insulator region according to the output results of the three Mask R-CNN branches.
The main step is the mask operation, in which only pixels of the insulator region in the mask matrix corresponding to the original image are retained. Non-insulator regions are assigned black pixel values. Because the insulator accounts for only a small part of the original image, the efficiency of directly traversing the entire image is too low, so only the bounding box region of the insulator is taken for the masking operation. Information about the bounding boxes of the insulators is stored in the branch output boxes of Mask R-CNN. Each classification instance corresponds to a box and a mask matrix. Each box stores four parameters, namely the vertex position information about the right bottom corner and the left top corner of the insulator bounding box. Based on the information of the two coordinate points, in combination with the resizing ratio of the image, the insulator bounding box region is intercepted in the original image and the mask matrix, and a mask operation is performed in this region.
3.2 Insulator tilt correction algorithm
As Fig. 5 shows, the mask operation is performed to obtain a precise insulator pixel region. The foreground and background are effectively distinguished, and interference between the background and the insulator in the original image is excluded. However, the images of the insulators intercepted should be processed further. The deviation of the tilt angle and the non-insulator region are too large. If the images are used as input images for defect detection directly, there is a high possibility of misjudging defects, and thus failure to meet the requirements of high-precision insulator defect detection. Therefore, to meet the requirements it is necessary to use an insulator tilt correction algorithm, rotate the insulator to a very positive position, and further process the image.
In the mask matrix of the insulator region, the insulator edge information of the binarization matrix is obtained by traversing. For the convenience of calculation, only the middle edge coordinate point information of the half of the upper edge is saved here.
With the coordinate information of these points, straight line fitting is performed by the least squares method. The slope of the fitted straight line is converted into an angle with the horizontal direction according to a trigonometric function. Then the image rotation operation is performed to correct the tilt angle of the insulator. The formula is expressed as follows:
(1)
whereandare image pixel point coordinates;0and0are rotation center coordinates;is the counterclockwise rotation angle;randrare the coordinates after rotation.
The blank region of the boundary after rotation is filled with black pixels. The excess black region is cut according to the size of the insulator to obtain the result of insulator angle correction (Fig. 5). By physical measurement, the corrected horizontal angle errors obtained are 0.39° and 0.98°. Based on the final result of the insulator correction, the insulator defect detection model is designed.
4 Insulator defect detection algorithm based on GTGFF-KCAM
There are many types of insulator defects, and they are unpredictable. The defects can be divided into four main categories, namely broken, dirt, foreign body, and flashover. At present, most defect detection is focused on the insulator defect feature, which has a high detection accuracy for known defects. However, the probability of detection of unpredictable defects is greatly reduced, and the probability of false detection is very high. Therefore, it is necessary to perform an insulator defect detection algorithm using GTGFF-KCAM with unsupervised learning characteristics. The algorithm can then learn the defect features by itself, compare the learned defect features with normal ones, and improve the generalization ability and robustness of the detection algorithm. To reduce the difficulty of detecting insulator defects because of non-consistency and complex image defects, a final classification is included in the design of the clustering analysis model, and performed by comparing two adjacent sheds on the same insulator. It is necessary to assume that there is no identical defect in the same position on each insulator shed.
4.1 Projection method to locate the single shed of the insulator
Information on each insulator shed position is needed for the final classification. Because the two ends of the insulator do not need to be detected, both ends can be cut. Here, binarization and projection methods are used to determine the position information of each insulator shed.
Then, for the obtained insulator binary image, the upper half of the image is selected for vertical projection, and the length of the white region at each position is recorded from the left end to the right end.
The parabolic-like region (Fig. 6) can be consi dered to be the putative position of each insulator shed, where the horizontal coordinate corresponds to the width of the image and the vertical coordinate corresponds to the height of the pixels in the vertical projection. The data at each peak point are analyzed to obtain the average length and width of the insulator shed and the starting coordinate information of the insulator sheds at both ends. These are further screened and processed to obtain the position information of each insulator shed.

Fig. 6 Insulator vertical projection result
4.2 Gradient, texture, and gray features (GTGF) extraction
Feature extraction is carried out for the insulator after cutting. Traditional feature extraction is based mainly on three characteristics: color, texture, and shape. There are many feature extraction algorithms based on these three features, such as histogram of oriented gradient (HOG), local binary pattern (LBP), and Haar (Ojala et al., 1996; Dalal and Triggs, 2005; Wang and Zhang, 2017; Yue et al., 2018).
Through the analysis of insulator images, the edge gradient, texture, and pixel gray features of the defective portion are quite different from those of normal insulators. Combined with the pixel gray feature, research on the HOG and LBP is carried out for GTGF.
4.2.1HOG and LBP
The HOG (Dalal and Triggs, 2005) divides the entire image into several small spatially interconnected areas called cell units. The specific implementation is to complete the construction of the directional gradient histogram in each cell unit, and then generate the HOG feature vector after normalization processing. The calculation formulas are Eqs. (2) and (3) (Dalal and Triggs, 2005).
(2)
(3)
where(,),(,), and(,) are the pixel value, gradient amplitude, and gradient direction of the image pixel at (,), respectively.
LBP (Ojala et al., 1996) is an effective texture description operator. When the image is rotated, the extracted parameters are the same as the original unrotated parameters. This property is called rotation invariance. When describing the characteristics of the object, the gray value is scaled proportionally. This can enable accurate feature description when the lighting conditions are changed. This light-insensitive characteristic is called gray invariance.
The original LBP operator compares the central pixel with the outer 8 pixels in a 3×3 area, and the gray value of surrounding pixels is greater than 1 and less than 0. After comparison, an 8-bit binary number that reflects the texture information of the area is obtained (Ojala et al., 1996). After the LBP transform, the LBP value of the central pixel of the calculation region is obtained as follows (Ojala et al., 1996; Yue et al., 2018):
(4)
wherecandpare the gray values of the center point and the pixels in the surrounding area, respectively;is a symbolic function;is the difference between the gray value of the surrounding pixels and the central pixel;LBPis the texture feature.
4.2.2GTGF normalization fusion
After HOG and LBP, GTGF normalization fusion is carried out. For the HOG, the calculated feature vector is matched with the original image. Based on the size of the original image, the region is divided into 8×8 pixel points. The gray value of all the pixels in the region is assigned the corresponding feature value. According to the principle of HOG feature extraction, each 8×8 region has a calculation result of a histogram of oriented gradient. The feature value is selected as described below.
Firstly, the nine oriented gradients are simplified and merged into five oriented gradients and one zero gradient intensity background, giving a total of six classifications. Then, the largest oriented gradient intensity is selected and assigned as the corresponding oriented gradient value. If the calculation result of the gradient intensity is 0, the assigned value is 0. The normalization process is performed to obtain the first feature to be fused. Secondly, for the LBP and the pixel gray feature, the normalization process is directly performed to obtain the second and third features to be fused. Finally, the three features are stored together in a 3D depth vector. Thus, the GTGF fusion is completed and prepared for the following KCAM.
4.3 K-means clustering
The K-means clustering algorithm (Hartigan and Wong, 1979) is widely used in pattern recognition, has the advantages of low time and space complexity, and is simple and efficient for large datasets. The principle is as follows: the dataset is divided intoclasses according to a similarity calculation, and the similarity of the class is measured by the distance of the dataset member to the center of the class (Hartigan and Wong, 1979; Zeng et al., 2018). By such a division, the square error is minimized. The formula is expressed as follows:
(5)
whereis the squared error,is the amount of categories,GTGFis the dataset member,Cis the category space, andmis the category center (the category mean), which can be calculated as follows:
(6)
(7)
where GI is the gradient intensity,is the gray value of the pixel, andGI,, andWare the respective weights.
Clustering is performed on the previously obtained 3D features. The value ofis 6, and the result shown in Fig. 7 is obtained. The different colors represent six different categories.
There is a lot of noise in Fig. 7a. To smooth the distribution of categories and facilitate the calculation of feature distribution, noise reduction is performed on the clustering results (Fig. 7b).

Fig. 7 Clustering results: (a) before noise reduction; (b) after noise reduction. References to color refer to the online version of this figure
4.4 Clustering analysis model
The clustering results (Fig. 7) are analyzed, and the image is of a normal insulator. From the perspective of horizontal comparison, the distribution of categories on each shed is similar. If the insulator is defective, the distribution will change. Therefore, the design of the clustering analysis model is based on the comparison of the category distribution on each adjacent shed.
First, when the front vertical projection operation is performed, the position information of each insulator shed is recorded. The distribution of categories within each region is counted. For example, all adjacent same categories in the region are distribution information. The distribution information maintains the starting point and end point coordinates and areas in the vertical direction. All the category distribution information in the region is recorded for subsequent distribution comparisons.
Then, according to the coordinates and areas of the distribution information of each category, the category distribution of the adjacent insulator shed is compared. The principle of specific comparison is as follows: the comparison threshold is set first, then the clustering categories of two adjacent sheds are compared. If one shed lacks some clustering categories that the other shed has, when the area lacking clustering categories is greater than the threshold, it can be determined as a defect. If a clustering category exists on both adjacent insulator sheds of the insulator, the distribution valuecan be calculated as follows:
(8)
where1and2are the distribution information of the clustering categories of the adjacent sheds;pandpare the height and width, respectively, of the insulator region, and are used to represent the uniformity of the distribution value;is the number of pieces of distribution information of a category;is the area difference between the two pieces of distribution information in the same ordinate region, calculated as follows:
(9)
whereris the coordinate region of distribution information;is the coordinate region space; area is the size of the distribution information area.
In this way, on two adjacent insulator sheds, the distribution valueof a clustering category can be obtained. The valueof the adjacent sheds is sequentially calculated from the left to the right end and a judgment greater than the threshold is a defect.
5 Experimental results
The number of images will impact on the accuracy of the algorithm. Only when the deep learning training set is sufficient can the accuracy of algorithm detection be effectively guaranteed (Nikbakht et al., 2021; Su et al., 2021). As shown in Fig. 8, the image used in model training and testing is the image taken by the inspection vehicle. There are top and bias cantilever insulators in the image of the catenary support device. A total of 1500 pictures were prepared for this experiment, and all pictures were randomly allocated to 1000 training sets and 500 test sets. There were 800 normal and 200 defect insulator images in the test set.
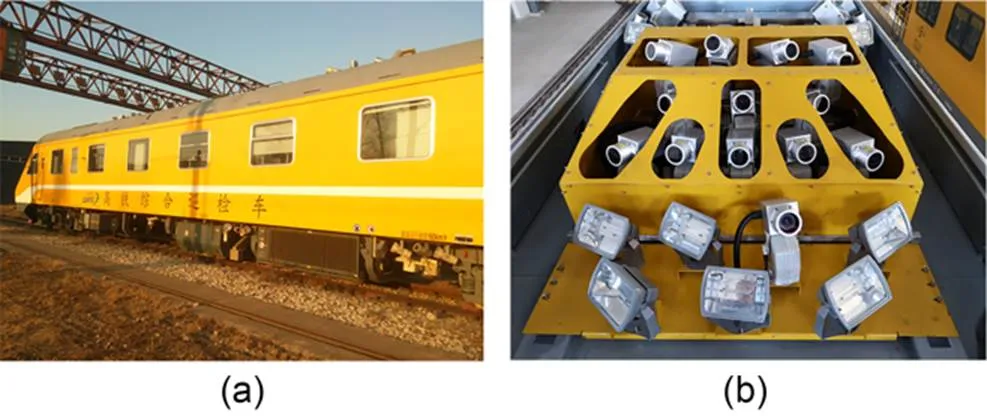
Fig. 8 Test environment: (a) catenary inspection vehicle; (b) vehicle-mounted image acquisition system
All tests in this section were performed on the inspection vehicle (Fig. 8). Fig. 9a shows the server installed in the inspection vehicle. The CPU was an 11th Gen Intel (R) Core (TM) i7-11700 K, and the GPU was an NVDIA GeForce RTX 3060. The proposed algorithm model was run on this server.

Fig. 9 Running server of the proposed algorithm model (a) and Mask R-CNN loss (b)
5.1 Insulator recognition and region cutting correction model based on Mask R-CNN
Fig. 9b shows the training loss of Mask R-CNN, where the horizontal coordinate corresponds to the number of training epochs (1×10³) and the vertical coordinate corresponds to the value of the loss function. As shown in Table 1, the Mask R-CNN can perform insulator recognition accurately. For an insulator with complex background interference, the pixel region can be accurately separated. Good recognition results were achieved on both the test set and the training set, and the recognition accuracy was as high as 100%. The errors of tilt correction were within reason.
The results of this model used on the test set are shown in Table 2.

Table 1 Partial test results of insulator recognition and region cutting correction
References to color refer to the online version of this table

Table 2 Insulator recognition and region cutting correction model based on Mask R-CNN test results
5.2 Comparative analysis of feature clustering
To analyze the influence of the different characteristics on the results of insulator clustering, experiments were performed on a normal insulator and a dirty insulator. The results are shown in Figs. 10 and 11, respectively.
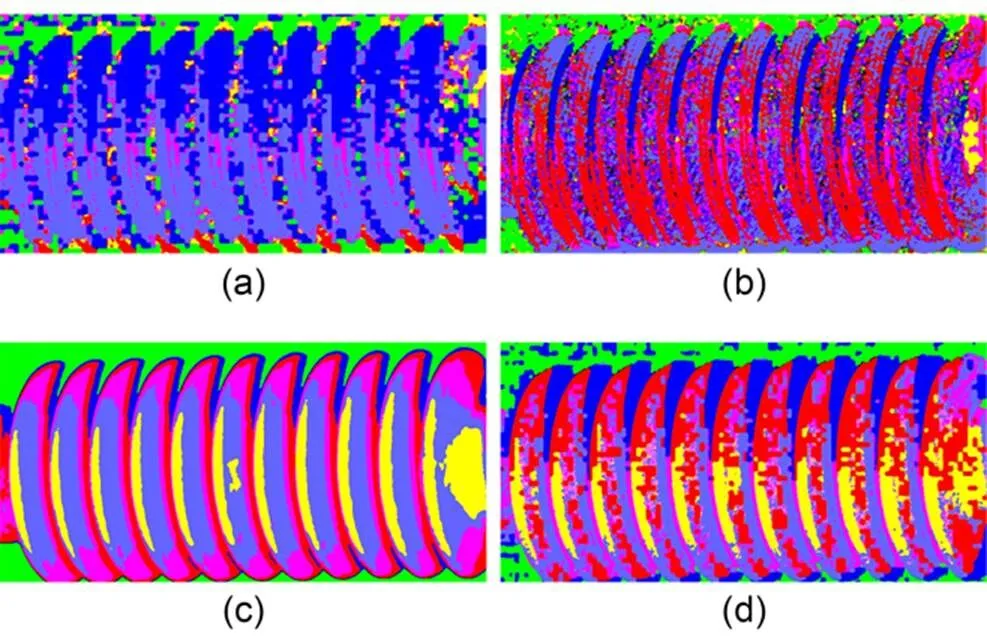
Fig. 10 Feature clustering results of a normal insulator: (a) gradient clustering results; (b) texture clustering results; (c) gray clustering results; (d) GTGFF clustering results
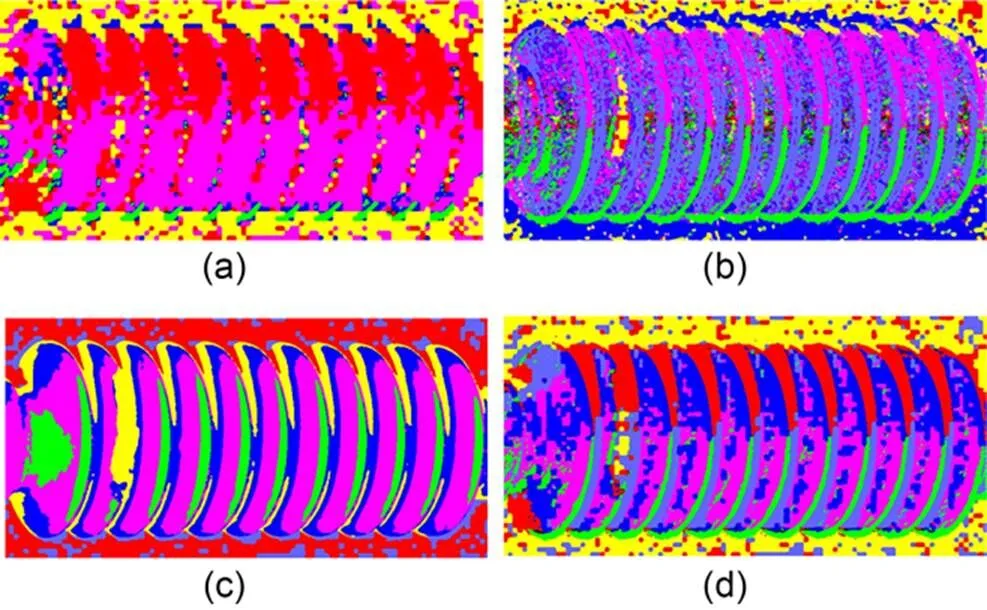
Fig. 11 Feature clustering results of a dirty insulator: (a) gradient clustering results; (b) texture clustering results; (c) gray clustering results; (d) GTGFF clustering results
As shown in Fig. 11a, the dirty shed could not be effectively detected by a single gradient feature clustering. Figs. 10a and 11a show that single gradient feature clustering could not embody the insulator structure clearly. However, the features of the dirty shed are reflected in Figs. 11b and 11c. Analysis of the single textile feature clustering result in Figs. 10b and 11b revealed the scattering category distribution in the images. If further processing was applied to the categories, we could outline the shape of the insulator and detect some defects. In the case of a single gray feature clustering, although it could clearly reflect the characteristics of each insulator shed, it relied mainly on the gray value of pixel points. This can easily lead to false detection when calculating the category distribution (Fig. 10c). Therefore, after comprehensive consideration of the advantages and disadvantages of each feature, we propose the method of multi-feature fusion to effectively detect the insulator defects from multiple perspectives.
5.3 Insulator defect detection based on GTGFF-KCAM
Table 3 shows the partial detection results of the GTGFF-KCAM of insulators. To visualize the clustering results, the results of different clustering categories in a single insulator are represented by different colors. There were a total of six categories. From left to right, adjacent insulator sheds were compared pairwise, and the distribution valuewas calculated. The results are shown in Fig. 12.

Table 3 Partial test results of insulator defect detection
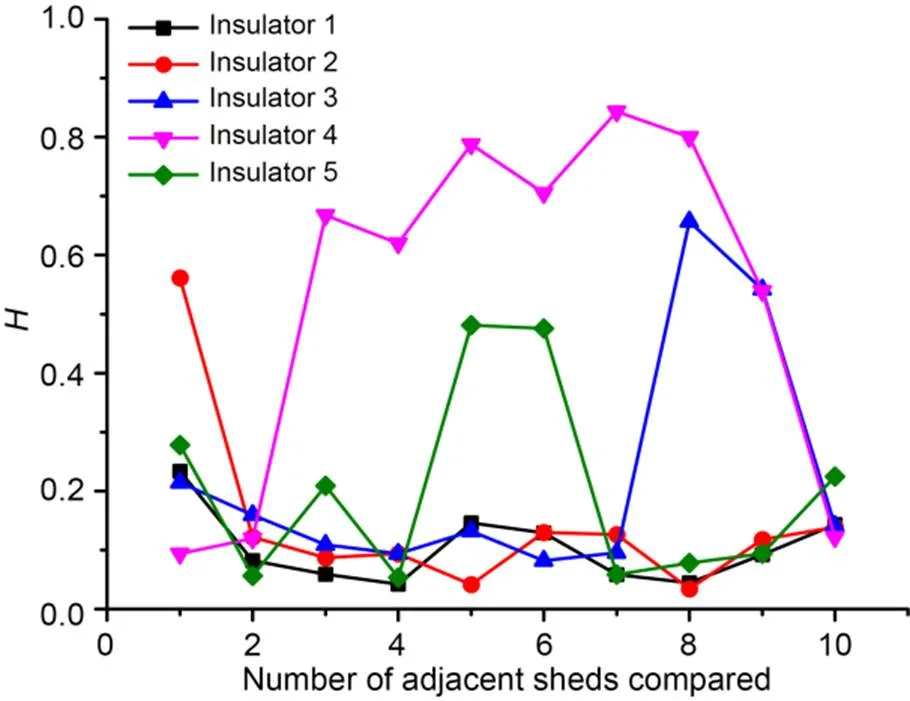
Fig. 12 H value calculation results of adjacent insulator sheds
As Table 3 shows, insulator 1 was a normal insulator. On the visualization image of the clustering results, the distribution of the categories on each shed was similar in the axial direction of the insulator. The curve trend of insulator 1 was smooth and steady, the calculated distribution valuewas similar, and the maximum value of(max) was 0.2337.
Insulator 2 was a defective insulator. The first shed (counting from left to right) of the insulator was dirty. On the visualization image of the clustering results, it can be clearly seen that the distribution of the clustering categories of the first shed was quite different from that of other normal insulator sheds. From analysis of the curve of insulator 2 in Fig. 12, the firstvalue was larger than the others, that is, comparing the results of the distribution of the first shed and the second shed of the insulator from the left side to the right side, except for the first value, thevalues were relatively low, andmax=0.5609.
Insulator 3 was a defective insulator with defects in the ninth shed (counting from left to right). The eighth and ninthvalues were larger than the others, andmax=0.6571. Insulator 4 was also a defective insulator. A black plastic bag could be seen in the middle of the insulator. Thevalues were higher except for the first, second, and tenth values, andmax=0.8431. Insulator 5 was a flashover insulator. The sixth shed flashover was the most obvious. The sixthvaluemax=0.4811.
5.3.1Evaluation index
True positive (TP) is the number of insulators correctly identified as defective, false positive (FP) is the number of normal insulators misjudged as defective, and false negative (FN) is the number of defective insulators misjudged as normal insulators.
Recall is the ratio of defective insulators correctly judged in the test set (TP) to the actual total number of defective insulators (TP plus FN). The formula is Recall=TP/(TP+FN).
Precision is the ratio of TP to the actual total number of defective insulators in the defective insulator recognition. The formula is Precision=TP/(TP+FP).
5.3.2Performance of the defect detection model on the test set
To conduct a more in-depth test of the performance of the defect detection model, the category thresholdwas changed, and a total of 1000 insulators (800 normal and 200 defective) were tested. The results are shown in Fig. 13.

Fig. 13 Precision and recall rates
The larger the area under the curve, the higher the AP. As shown in Fig. 13, the GTGFF clustering performed better than the other three single-feature clusters. At the point where the Recall and Precision were optimal, the threshold valuewas 0.4. Detailed results are shown in Table 4.
We analyzed two defective insulators that had not been correctly identified (Fig. 14). In Fig. 14a, the insulator has obvious flaws on its far right, but there was no obvious difference in the clustering result visualization image, andmax=0.1312. The reason is that the proportional coefficient of the GTGFF needs to be further optimized and adjusted, and there is also some room for optimization of cluster initialization. In Fig. 14b, the far left shed had slight defects. Similarly, there was no obvious difference in the clustering result visualization images, andmax=0.3732.
Moreover, analysis of the normal insulators that were not correctly identified showed that this was due mostly to a huge difference in image quality factors such as the shooting angle or illumination, which affect the accurate positioning of each shed. These issues lead to the occurrence of false identification of a normal insulator as defective.

Fig. 14 Some defective insulators were missed: (a) missed detection of the defect-insulator 1; (b) missed detection of the defect-insulator 2
6 Conclusions
Based on the Mask R-CNN and GTGFF-KCAM, we carried out studies on HSR catenary insulator recog nition and defect detection. Mask R-CNN is an outstanding deep learning model for object recognition and instance segmentation, and achieves high accuracy for insulator recognition. Based on the Mask R-CNN detection results, the cutting and tilt correction of the insulator pixel region are presented. For insulator defect detection, the proposed GTGFF-KCAM was applied and tested on a realistic image dataset and achieved high precision insulator defect detection. Recall was 99.0% and Precision 92.5%, which shows that the algorithm has excellent performance. The overall detection model provides a systematic, comprehensive, and effective solution for defect detection and intelligent identification of insulators. It is a reliable method for HSR catenary intelligent detection and maintenance.

Table 4 Insulator defect detection based on GTGFF-KCAM test results
This work is supported by the National Natural Science Foundation of China (Nos. 51677171, 51637009, 51577166, and 51827810), the National Key R&D Program of China (No. 2018YFB0606000), the China Scholarship Council (No. 201708330502), the Fund of Shuohuang Railway Development Limited Liability Company (No. SHTL-2020-13), and the Fund of State Key Laboratory of Industrial Control Technology (No. ICT2022B29), China.
Ping TAN and Xu-feng LI designed the research. Ping TAN, Xu-feng LI, Jin DING, and Zhi-sheng CUI processed the corresponding data. Ping TAN and Xu-feng LI wrote the first draft of the manuscript. Jin DING, Zhi-sheng CUI, Ji-en MA, Yue-lan SUN, Bing-qiang HUANG, and You-tong FANG helped to organize the manuscript. Ping TAN, Xu-feng LI, and Zhi-sheng CUI revised and edited the final version.
Ping TAN, Xu-feng LI, Jin DING, Zhi-sheng CUI, Ji-en MA, Yue-lan SUN, Bing-qiang HUANG, and You-tong FANG declare that they have no conflict of interest.
Adou MW, Xu HR, Chen GH, 2019. Insulator faults detection based on deep learning. Proceedings of the IEEE 13th International Conference on Anti-counterfeiting, Security, and Identification, p.173-177. https://doi.org/10.1109/ICASID.2019.8925094
Dai JF, He KM, Sun J, 2016. Instance-aware semantic segmentation via multi-task network cascades. Proceedings of the IEEE Conference on Computer Vision and Pattern Recognition, p.3150-3158. https://doi.org/10.1109/CVPR.2016.343
Dalal N, Triggs B, 2005. Histograms of oriented gradients for human detection. Proceedings of the IEEE Computer Society Conference on Computer Vision and Pattern Recognition, p.886-893. https://doi.org/10.1109/CVPR.2005.177
Han Y, Liu ZG, Lee DJ, et al., 2016. High-speed railway rod-insulator detection using segment clustering and deformable part models. Proceedings of the IEEE International Conference on Image Processing, p.3852-3856. https://doi.org/10.1109/ICIP.2016.7533081
Hartigan JA, Wong MA, 1979. Algorithm as 136: a K-means clustering algorithm., 28(1):100-108. https://doi.org/10.2307/2346830
He KM, Gkioxari G, Dollár P, et al., 2017. Mask R-CNN. Proceedings of the IEEE International Conference on Computer Vision, p.2980-2988. https://doi.org/10.1109/ICCV.2017.322
Jiang H, Qiu XJ, Chen J, et al., 2019. Insulator fault detection in aerial images based on ensemble learning with multi-level perception., 7:61797-61810. https://doi.org/10.1109/ACCESS.2019.2915985
Kang GQ, Gao SB, Yu L, et al., 2019. Deep architecture for high-speed railway insulator surface defect detection: denoising autoencoder with multitask learning., 68(8):2679-2690. https://doi.org/10.1109/TIM.2018.2868490
Kien DN, Zhuang XY, 2021. A deep neural network-based algorithm for solving structural optimization., 22(8):609-620. https://doi.org/10.1631/jzus.A2000380
LeCun Y, Bengio Y, Hinton G, 2015. Deep learning., 521(7553):436-444. https://doi.org/10.1038/nature14539
Li Y, Qi HZ, Dai JF, et al., 2017. Fully convolutional instance-aware semantic segmentation. Proceedings of the IEEE Conference on Computer Vision and Pattern Recognition, p.4438-4446. https://doi.org/10.1109/CVPR.2017.472
Liu T, Zhao Y, Wei YC, et al., 2019. Concealed object detection for activate millimeter wave image., 66(12):9909-9917. https://doi.org/10.1109/TIE.2019.2893843
Lyu Y, Han ZW, Zhong JP, et al., 2020. A generic anomaly detection of catenary support components based on generative adversarial networks., 69(5):2439-2448. https://doi.org/10.1109/TIM.2019.2954757
Nikbakht S, Anitescu C, Rabczuk T, 2021. Optimizing the neural network hyperparameters utilizing genetic algorithm., 22(6):407-426. https://doi.org/10.1631/jzus.A2000384
Ojala T, Pietik?inen M, Harwood D, 1996. A comparative study of texture measures with classification based on featured distributions., 29(1):?51-59. https://doi.org/10.1016/0031-3203(95)00067-4
Ren SQ, He KM, Girshick R, et al., 2017. Faster R-CNN: towards real-time object detection with region proposal networks., 39(6):1137-1149. https://doi.org/10.1109/TPAMI.2016.2577031
Su M, Peng H, Li SF, 2021. Application of an interpretable artificial neural network to predict the interface strength of a near-surface mounted fiber-reinforced polymer to concrete joint., 22(6):427-440. https://doi.org/10.1631/jzus.A2000245
Tan P, Ma JE, Zhou J, et al., 2016. Sustainability development strategy of China's high speed rail., 17(12):923-932. https://doi.org/10.1631/jzus.A1600747
Tan P, Li XF, Xu JM, et al., 2020. Catenary insulator defect detection based on contour features and gray similarity matching., 21(1):64-73. https://doi.org/10.1631/jzus.A1900341
Tan P, Li XF, Wu ZG, et al., 2021. Multialgorithm fusion image processing for high speed railway dropper failure-defect detection., 51(7):4466-4478. https://doi.org/10.1109/TSMC.2019.2938684
Wang J, Wang TT, Luo QZ, 2019. A practical structural health monitoring system for high-speed train car-body., 7:168316-168326. https://doi.org/10.1109/ACCESS.2019.2954680
Wang L, Zhang ZJ, 2017. Automatic detection of wind turbine blade surface cracks based on UAV-taken images., 64(9):7293-7303. https://doi.org/10.1109/TIE.2017.2682037
Yao XT, Zhang YP, Gao Y, et al., 2017. Research on technology of contact insulator pollution classification and pollution level division based on machine vision. Proceedings of the IEEE 3rd Information Technology and Mechatronics Engineering Conference, p.1264-1268. https://doi.org/10.1109/ITOEC.2017.8122559
Yao XT, Zhang YP, Gao Y, et al., 2018. Research on vision-based technology of contamination detection in overhead line insulators., 37(1):65-72 (in Chinese). https://doi.org/10.3969/j.issn.1001-4373.2018.01.011
Yue GH, Hou CP, Gu K, et al., 2018. Biologically inspired blind quality assessment of tone-mapped images., 65(3):2525-2536. https://doi.org/10.1109/TIE.2017.2739708
Zeng X, Li ZH, Gao W, et al., 2018. A novel virtual sensing with artificial neural network and K-means clustering for IGBT current measuring., 65(9):7343-7352. https://doi.org/10.1109/TIE.2018.2793196
Zhao ZB, Zhen Z, Zhang L, et al., 2019. Insulator detection method in inspection image based on improved faster R-CNN., 12(7):1204. https://doi.org/10.3390/en12071204
Zhu Q, Li L, Chen CJ, et al., 2018. A low-cost lateral active suspension system of the high-speed train for ride quality based on the resonant control method., 65(5):4187-4196. https://doi.org/10.1109/TIE.2017.2767547
Ji-en MA, majien@zju.edu.cn
Jan. 9, 2022;
Revision accepted May 23, 2022;
Crosschecked Aug. 16, 2022
? Zhejiang University Press 2022
 Journal of Zhejiang University-Science A(Applied Physics & Engineering)2022年9期
- Journal of Zhejiang University-Science A(Applied Physics & Engineering)的其它文章
- Effects of the mixing degree upstream of the diverging area on the pollutant allocation characteristics of a braided river
- Static control method using gradient–genetic algorithm for grillage adaptive beam string structures based on minimal internal force
- Influence of wettability in immiscible displacements with lattice Boltzmann method
- Elastoplastic behavior of frozen sand–concrete interfaces under cyclic shear loading
- Environmental impact assessment of aircraft elevator made with new lightning protection material