
A comparison of power measurement techniques and electrical characterization of an atmospheric pressure plasma jet
2022-09-06 13:04:36OliveraJOVANOVINevenaPUAandNikolaKORO
Plasma Science and Technology 2022年10期
Olivera JOVANOVI?,Nevena PUA?and Nikola ?KORO
Institute of Physics,University of Belgrade,Pregrevica 118,Belgrade 11080,Serbia
Abstract In the last two decades a growing interest has been shown in the investigation of atmospheric pressure plasma jets (APPJs) that operate in contact with liquid samples.In order to form a complete picture about such experimental systems,it is necessary to perform detailed diagnostics of plasma jets,as one step that will enable the adjustment of system properties for applications in different areas.In this work,we conducted a detailed electrical characterisation of a plasma system configuration used for water treatment.A helium plasma jet,with a pin electrode powered by a continuous sine wave at a frequency of 330 kHz,formed a streamer that was in contact with a distilled water sample.An electrical circuit allowed the monitoring of electrical signals supplied to the jet and also to the plasma itself.An electrical characterisation together with power consumption measurements was obtained by using two different methods.The first method was based on the direct measurements of voltage and current signals,while in the second method we used ‘Lissajous figures’.We compared these two methods when used for discharge power estimation and addressed their advantages and limitations.The results showed that both of these methods could be used to successfully determine power consumed by a discharge in contact with water,but only when taking into account power dissipation without plasma.
Keywords: APPJ,electrical characterization,discharge power,Lissajous figure
1.Introduction
Over the past decades,non-equilibrium atmospheric pressure plasmas have been extensively investigated,because they represent a powerful tool in various applications.In the treatment of thermally sensitive and unstable materials,especially in biomedicine,the key asset is plasma operating at room temperature[1-4].Besides biomedical applications,these plasmas are also used in agriculture and water treatment technologies [5-10].Nevertheless,in all cases,the potential of cold plasma has been used to create specific particles and form a chemically active medium without additional chemical reagents.
APPJs are sources of non-equilibrium plasmas that can be made in various geometries and electrode arrangements.They usually consist of a dielectric tube,a powered electrode,that can be additionally isolated,and a grounded electrode.Depending on the geometry of the electrodes,operation frequency,power source and working gas,different types and modes of discharge can be generated.In all configurations,the discharge is created when the gas at atmospheric pressure is exposed to a strong electric field.These plasmas are called non-equilibrium,owing to the different temperatures,i.e.energies,of the particles [11].
In the case of APPJs,the realized discharge can be a classical streamer or a more diffuse discharge.Discharges generated by dielectric barrier discharge (DBD) devices can be spatially homogeneous and diffuse [11,12]while those discharges generated by plasma jets are usually streamers or streamer-like discharges.The streamer discharge occurs after the streamer breakdown.The formed electrical field accelerates the charged particles providing energy to the plasma.The presence of an electric field causes the ionization in the gas gap and the formation of space charges at the head of the ionization wave.The field amplification owing to the space charge in the head leads to self-extending streamer discharge.Thus,after inception,the streamer propagation and properties depend on the system configuration,gaseous surrounding and the target.The energy of the fast-progressing streamer is mostly dissipated into the excitation of the working gas[13,14].In case of APPJs this is demonstrated through the propagation of PAPS (Pulsed Atmospheric pressure Plasma Streamer)or,so called,’plasma bullets’[15-17].Streamers are also present in other types of plasma sources.When the discharge current is not limited they precede other types of discharge,such as sparks and lightning [18].
In several publications it has been investigated how the configuration of a plasma jet system influences the properties of plasma.It has been shown that the efficiency of the power transfer process from the power supply to the plasma system determines the mode of the discharge[14,19,20].For example,a comparison of two discharge regimes produced by different excitation sources (direct current (DC)-pulsed and sine-wave alternating current(AC))in the same single electrode plasma jet was reported.It was found that the excitation source determines discharge current,the length of plasma plume and plasma temperature [21].The grounded electrode,due to its capacitive nature,can additionally lead to the energy loss influencing behavior of the plasma bullet.But at the same time it can increase the local electric field that will result in lower voltages needed to sustain plasma [14].Control of these plasma properties is essential when comes to plasma treatments.
Many studies have shown that an interaction coupling between plasma and the target exists in atmospheric pressure plasma systems.Target properties influence the discharge morphology and affect the creation of turbulence in the gas flow [22,23].In the presence of the liquid target,plasma heating leads to evaporation and changes in the composition of the surrounding atmosphere,modifying the physico-chemical properties of both the gas and liquid phases [24].Studies of the influence of treatment conditions on water properties have shown that small changes in the distance and volume of liquid lead to changes in the concentrations of deposited reactive species [25,26].Therefore,an additional complexity is introduced in the plasma system with a liquid target.Exposure of aqueous samples to non-thermal plasma leads to changes in water properties,creating an acidic environment under certain treatment conditions,changing conductivity and redox potential,and creating reactive oxygen and nitrogen species (RONS) [27,28].Creating plasmaactivated liquid with specific,predetermined properties and a certain content of reactive species provides huge potential for application,but at the same time,is an extremely demanding task.Depending on the plasma jet configuration,the type of discharge and the energy released in the plasma,different reactions will occur in the gas phase (plasma) and the liquid[29].One step towards a better understanding of the entangled relationship between the characteristics of the plasma source,the discharge properties,and treated sample characteristics,is to carry out detailed diagnostics of the plasma jet.An important part of that includes the investigation of the electrical parameters,such as the efficiency of the input power transfer to the source,power dissipation,and impedance of the whole system.
In this study,we assessed in detail the electrical characteristics of the He plasma jet operating against a water target.The jet was supplied by a continuous sine high-voltage signal at the frequency of 330 kHz.The electrical discharge is generated in the gas phase above the liquid by applying the voltage at the pin electrode of the jet with distilled water serving as grounded electrode.The main idea of the research was to perform a proper determination of the dissipated powers and evaluate the typically used methods in plasma systems applied for water treatments.To estimate the powers dissipated in the system,we employed two standard methods.In the first method,the power is calculated directly from the product of the measured time-varying current and voltage signals (V-I).The second method is based on measuring the voltage across a capacitor connected in a series with the grounded sample (Q-V).
These two methods,V-I and Q-V,as we named them here,are some of the most widely used power determination procedures.They have been extensively implemented in numerous plane geometry DBD configurations and several plasma jet systems,including conventional plasma jet configurations supplied with both AC[30]and DC voltages[9,31],driven by either a pulsed high-voltage signal [32]or continuous sinusoidal signal [33].Furthermore,the input power and the discharge power have been estimated for diverse plasma jet arrangements such as hollow electrode APPJ[14,34],kINPen[33],single-electrode jet [35]and DBD jet [36],etc.
In recent years,a number of researchers have investigated cold plasma sources that interact with the targets of certain characteristics for a particular application.Plasma jet treatments are most commonly performed in secondary electrode configurations with a grounded or floating electrode.The two methods investigated in this work were used for power dissipation measurement in various plasma jet configurations for the treatment of biological materials and the inactivation of bacteria [37,38],biomedical applications that include in vitro and in vivo treatments[39]and producing of plasma activated (tap) water [40].
The research to date has tended to compare the differences between several measurement techniques for power determination only in the field of DBD plasma reactors[41-44].However,as the Q-V method is mostly used with different DBD source configurations,there are few comprehensive analyses and comparisons of the two methods for pinto-plate plasma jets[33,35]operating with pulsed excitation.Although previous studies have investigated pin-to-plate configurations of a plasma jet,there has been no study that we are aware of,which has dealt with plasma jets interacting with liquid targets and driven by a continuous sine wave.Therefore,the aim of this work was to assess the power consumption (at the target) of a high-frequency pin type plasma jet by using both V-I and Q-V methods and to compare the obtained results.
2.Experimental setup and methods
2.1.Plasma jet system
Figure 1 presents a schematic diagram of an experimental setup.The plasma source used in this experiment was a plasma jet designed to operate as a pin-electrode configuration at atmospheric pressure.It consisted of a cylindrical metal body(diameter 22 mm)and glass tube,whose inner and outer diameters are 4 mm and 6 mm,respectively.A powered electrode was made of stainless steel wire with a diameter of 1 mm.It was covered with a ceramic insulating tube and placed along the glass tube axis.The sharpened tip of the wire protruded 3 mm from the ceramic insulation into the glass tube (see figure 1(b)).The powered electrode was connected to the high-voltage (HV) signal by a BNC connector positioned at the top of the metallic jet body.The second electrode was the target-a distilled water sample placed in a well of 6-well microtiter plate.The initial conductivity of water was 1.5 μS cm?1(Hanna Instruments,HI76312 electrode,HI5521 controller).The plate was positioned below the tip of the powered electrode (see figure 1(b)).The volume of water sample in the well was 4 ml.The distance between the liquid surface and the wire tip was 10 mm in all measurements.The copper tape was attached at the outer bottom side of the well and grounded.The experimental setup,together with the positioning of the grounding tape,is a typical system which is used for the plasma treatment of liquid samples.The setup on one side allows for the measurement of electrical signals while,on the other side,treated liquid is in contact only with the clean vessel,so the chemical reactions are governed solely by the plasma-liquid interaction.Treatment of a liquid in contact with a copper tape showed that it produced additional chemical reactions and specific species in the liquid after the treatment [25].Comparison between a setup where copper tape is inside the liquid sample or outside has been investigated for a similar system [29]showing rather small differences in the signals recorded in the grounded line.Also,working with the sine wave high voltage signal at high frequencies allows the use of different materials as a vessel for the samples.
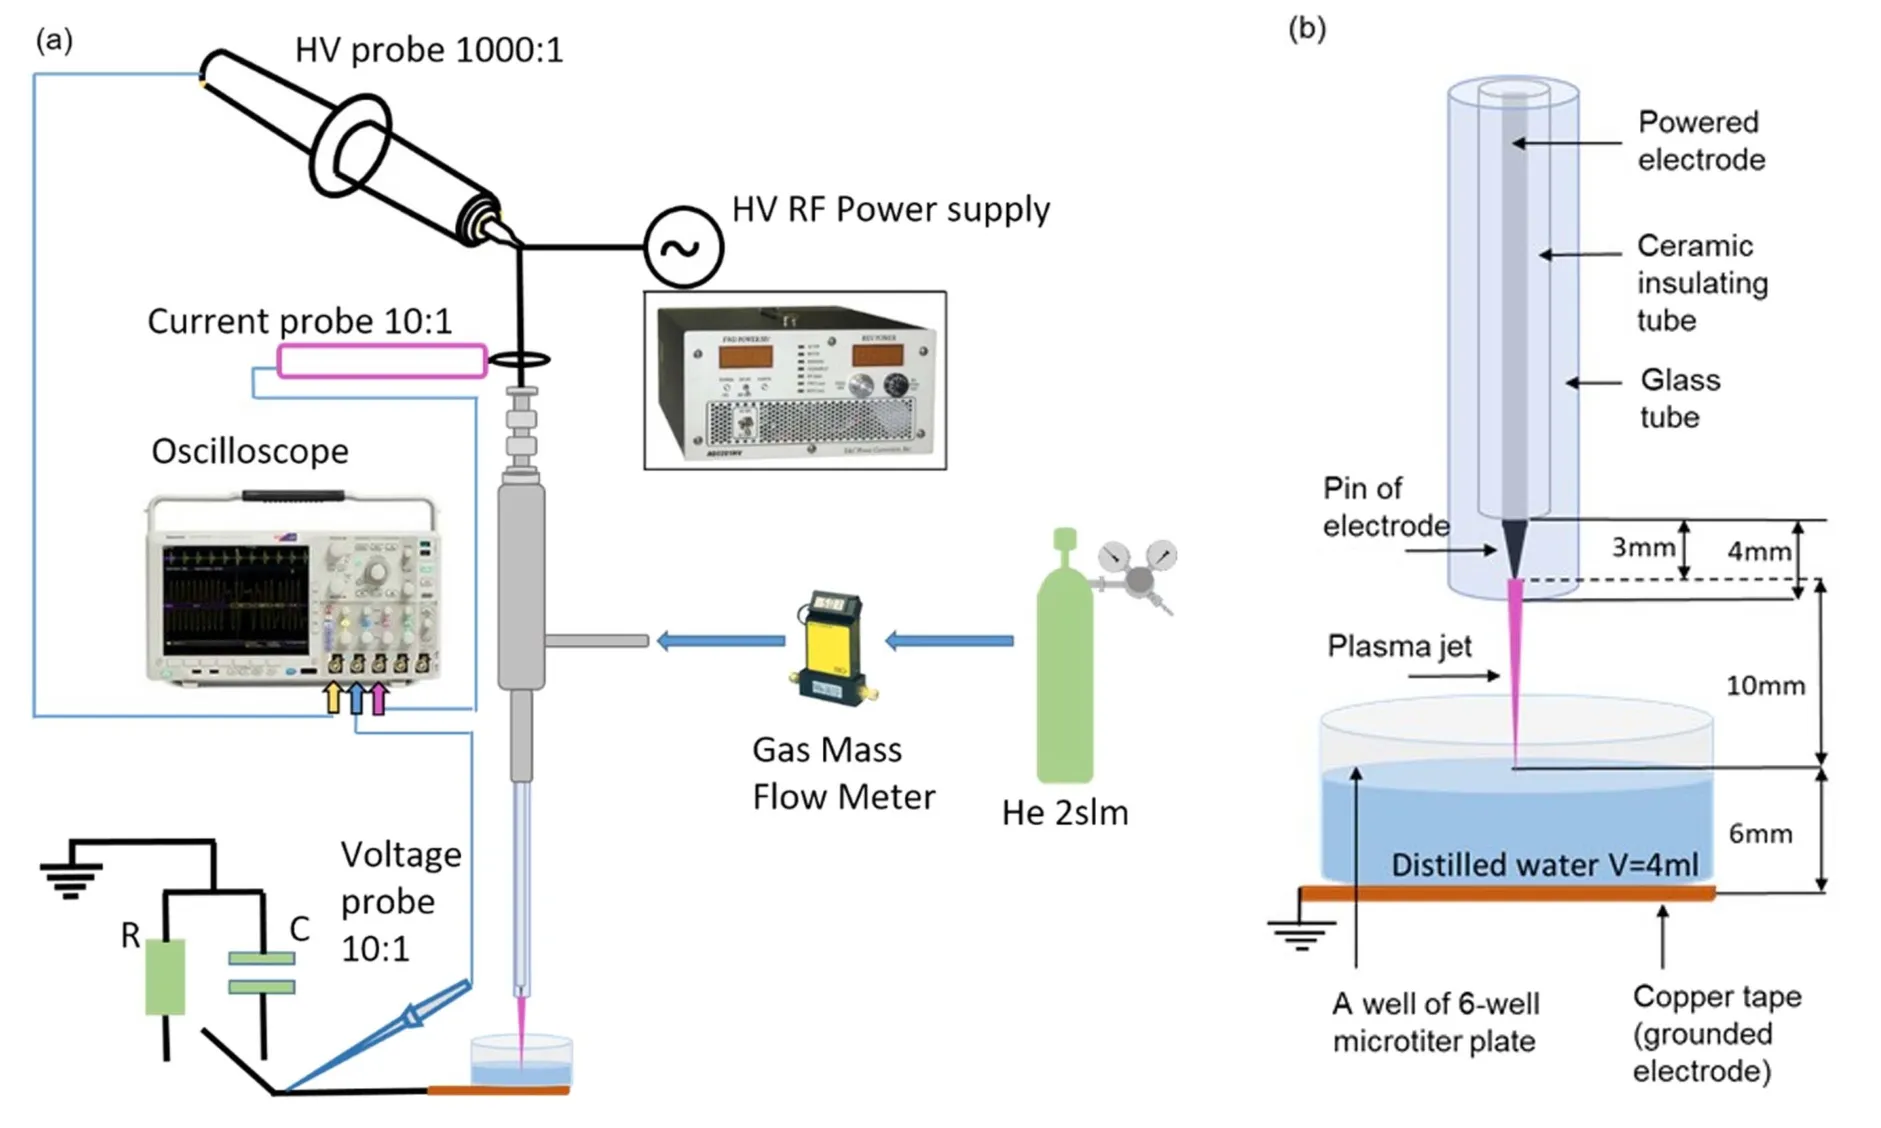
Figure 1.Schematic representation of the experimental setup(a)and enlarged view of the powered electrode and target placed below the tip of the electrode (b).
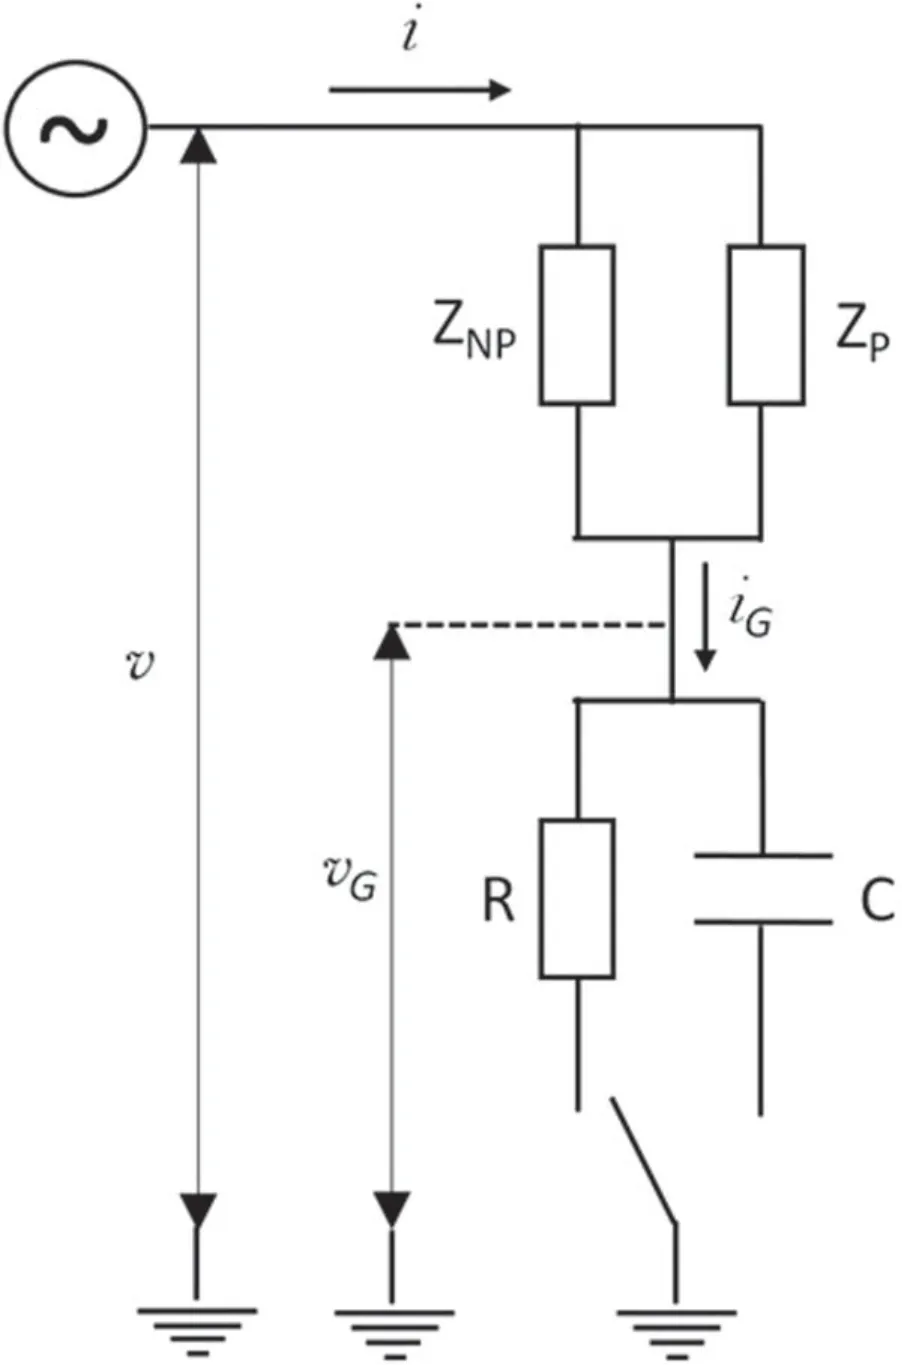
Figure 2.The electrical circuit of the plasma jet system: v-applied alternating voltage at the powered electrode,vG-voltage in the ground line,i-current in the plasma jet main line,iG-current through the grounded line,R = 1 kΩ,C = 0.8 nF and 10.3 nF,ZNP-impedance of the plasma jet system configuration without plasma,ZP-impedance of plasma.
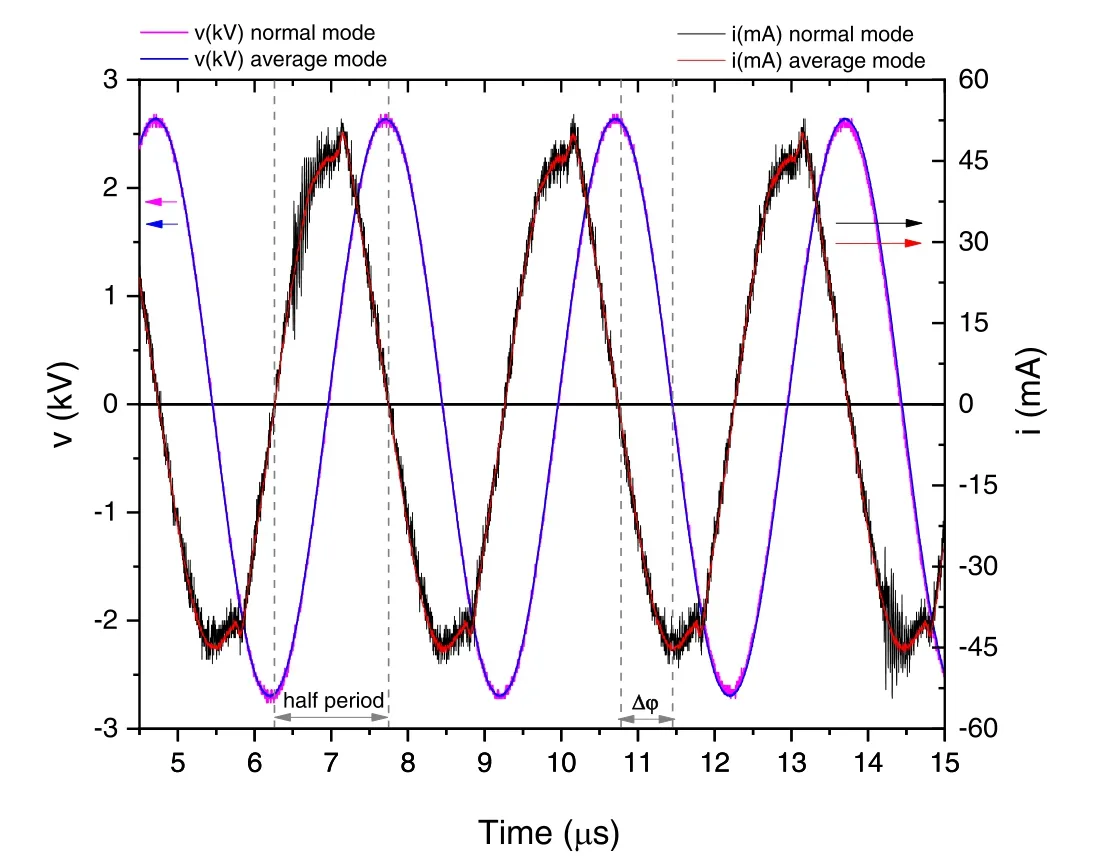
Figure 3.Voltage and current waveforms obtained at the electrode in normal mode and average mode (16 cycles averaged).The waveforms were measured for applied peak-to-peak voltage of 5.5 kV,f = 330 kHz,and He flow of 2 slm.The electrical circuit configuration was with the resistor R = 1 kΩ in the grounded line.The half period of applied voltage(T/2 = π/f)and phase difference(Δφ) are noted in the plot.

Figure 4.Voltage and current waveforms were measured for an applied peak-to-peak voltage of 5.5 kV and frequency of 330 kHz.The dashed lines represent cases when the plasma was OFF,while full lines represent the Plasma ON regime.In plots (a) and (e)Plasma ON and Plasma OFF signals overlap.(a)v-applied voltage at the electrode.(b) and (c) electrical circuit configuration with the resistor R = 1 kΩ,i-current in the plasma jet main line,iG-current through the grounded line.(d) and (e) electrical circuit configurations with capacitors:vG-voltage across the 10.3 nF(blue line)and 0.8 nF (green line) capacitor.
The plasma in the experiments was generated and controlled by using a commercial HV high-frequency power supply (T&C Power Conversion AG 0201HV-OS 140 W-500 kHz with continuous sinusoidal signal with a frequency of 330 kHz.The power supply allows control of an output power(not output voltage or current)and measures the power forwarded from the device to the plasma system as well as the reflected power.The reflected power in all experiments was below 2 W.Due to several elements in the electrical circuit,there is a difference between the power measured at the source and the power delivered to the plasma.Since the power delivered to a discharge is a crucial parameter in the electrical diagnostics of a plasma jet,this indicates a need to measure current and voltage waveforms at the plasma jet itself.To monitor the instantaneously applied voltage waveforms at the power electrode we have used an HV probe(P6015A TEKTRONIX).The current waveforms were measured by using a current probe (Agilent N2783B) connected to the main line of the plasma jet(see figure 1(a)).To avoid an offset in the signal,the current probe was regularly demagnetized.
In the part of the electrical circuit containing the water sample we used two different approaches to measure the voltage and current waveforms.When utilizing the V-I method,the resistor of 1 kΩ resistance was connected in a series to the ground line of the electrical circuit(see schematic in figure 2).For the Q-V method (Lissajous figures) a capacitor was connected in series to the ground line of the electrical circuit (see schematic in figure 2).For these purposes,the capacitors had capacities of 0.8 nF and 10.3 nF.In both cases,the voltage drop across the elements placed in the ground line (υG) was measured by using a voltage probe (Agilent N2863B).The resistivity and capacitance of the voltage probe are appropriate so it minimally perturbs the electrical circuit and influences the measurements.We used the Tektronix MDO3024 oscilloscope to record all waveforms.
In all experiments He was used as a working gas with a fixed flow rate of 2 slm adjusted by a mass flow controller(Omega FMA5400/5500).The open-end geometry of the plasma jet enables the mixing of the He with the surrounding air.When the plasma is ignited,the filamentary type discharge operates in the gas mixture around the tip of the powered electrode.With the increase of the input power,the generated streamer propagates through the gap and,for most operating parameters,it was touching the liquid sample.
2.2.The root mean square (RMS) values and V-I method
The electrical circuit (schematic in figure 2) allows the monitoring of voltage and current instantaneous signals through the plasma jet main line and in the ground line.The waveforms of applied voltage v and current i through the plasma jet main line are plotted in figure 3.
These signals were captured by the oscilloscope in normal acquisition mode and also by averaging 16 acquired waveforms.The signals obtained in average mode closely follow the shape of the signals recorded in normal mode but without the noise which is visible mostly at the current waveform.
The acquired time-dependent values of voltage and current through the plasma jet main line,v(t)and i(t),and voltage drop across a resistor in the ground line vG(t) were used for electrical characterisation and power calculations.The root mean square values of the voltage and current were calculated in the following way:
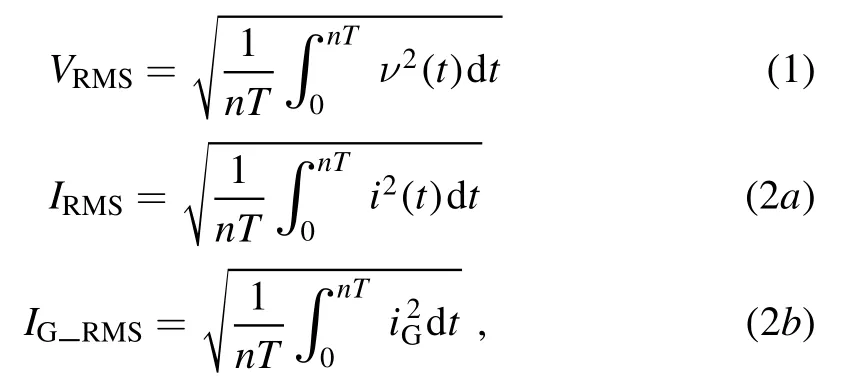
where T is a period of the given signal and n is the number of periods,iG(t) = vG(t)/R and R is the electrical resistance of the resistor in the grounded line.
In the V-I method,first the time-dependent powers delivered to the plasma jet and consumed by plasma were calculated as the product of voltage v(t) multiplied by the appropriate current,i(t)or iG(t).The average powers are then obtained as:
In all calculations,as input data we used the waveform values obtained in averaging mode.Comparison between two sets of data (obtained in normal and averaging mode) showed differences in calculated values of less than 1%,which is below the experimental error.The phase differences (Δφ) (see figure 3)between high voltage and other obtained signals were calculated in the following way: Δφ = (Δt/T) × 360°,where Δt is the time period between points where both signals had zero values.
2.3.Q-V method
Another method commonly used for the electrical characterization and measurement of power consumed by plasma is based on a charge-voltage plot or Lissajous figure.For these measurements,the capacitor was inserted in series with the plasma jet and grounded line,so that the same electrical charges formed in the discharge flow through the grounded target and the capacitor.By measuring the capacitor voltage,knowing the capacitance and assuming purely capacitive properties,the charge flow through the capacitor can be obtained.In the Lissajous figure,the area enclosed by the curve is equal to the energy dissipated per one period of applied voltage:
where C and vG(t)are capacity and voltage across the additional capacitor(figure 2),v(t)is the applied high-voltage signal,f = 1/T is the corresponding frequency,and Pmean_Gis the average power consumed by the plasma [43,45,46].In this work,the closed area of a Lissajous figure was obtained by the Polygon area function in the Origin software (Origin Lab Corporation,Northampton,MA,USA).A different approach to calculate the area inside the Lissajous figure can be found in [47].
To ensure that the influence of the capacitor on the whole system is minimal,the capacitance was chosen to be large compared to the equivalent capacitance oft the plasma jet,gas gap,and target.This difference is at least one order of magnitude.The second important property is the type of capacitor selected.It has been suggested that ceramic capacitors are preferred,owing to their relatively low parasitic losses and accuracy in measurement of charge [48].An additional advantage is that they are not polarized and may be safely connected to an AC source.
3.Results and discussion
3.1.Instantaneous voltage and current
Before the onset of the plasma jet electrical measurements,the power supply has been set to operate at the frequency of 330 kHz with the lowest reflected power.The voltage and current signals were monitored for three different configurations of the ground line.In figure 4 we show the waveforms for particular applied voltages.The measurement was performed without feed gas (Plasma OFF) and with the He flow of 2 slm (Plasma ON).
The waveforms when the plasma was on are plotted by a full line,while the dashed line shows the case without plasma(achieved without He flow).All presented signals were recorded with the applied peak-to-peak voltage of 5.5 kV.The waveforms in figures 4(a)-(c)are acquired in electrical circuit configuration with the resistor and represent the averaged value of 16 acquired waveforms.The signals in figures 4(d)and (e) were obtained in electrical circuit configurations with capacitors by averaging 512 waveforms.Identical waveforms were obtained for the applied voltages v(t) (figure 4(a)) and currents i(t) (figure 4(b)) in configurations when two capacitors were inserted in the grounded branch of the circuit.Therefore,for simplicity,only one set of v(t) and i(t) signals are presented.
The high voltage signal applied to the plasma jet in the configuration with resistance R in the grounded branch of the circuit is shown in figure 4(a).It has a regular sinusoidal shape,regardless of whether the plasma is ignited or not.Figure 4(b) shows the current i(t) obtained by the current probe and flowing through the main line to the plasma jet.When there is no helium flow,the obtained current signal is sinusoidal,since the applied voltage is lower than the breakdown voltage in air.When the plasma is ignited,the current waveform is deformed from the sine wave and it has two peaks,one per each positive and negative half period of the imposed voltage.The appearance of the peak in the current waveform is connected to the streamer type of the discharge.The observed deformation in the current waveform when discharge occurs has been found previously in other atmospheric plasma jet systems[15,49-51].It was the result of discrete propagation of the discharge outside the gas tube in a form of PAPS.In general,changes in the shape of the current signal occur because the current in the plasma jet main line is superimposed on the displacement current.The displacement(capacitive)current can be measured directly when the tube is not filled with feed gas and there is no plasma.
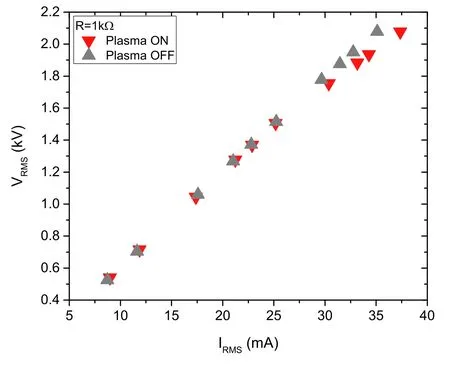
Figure 5.V-A characteristics obtained at the plasma jet in the presence (Plasma ON) and absence (Plasma OFF) of plasma for the configuration with R = 1 kΩ in the grounded line.The V-A characteristics obtained when C = 0.8 nF and C = 10.3 nF were used in the electrical circuit are the same and not presented here to retain the clarity of the figure.

Figure 6.V-A characteristics obtained for the current through the ground line IG_RMS in the presence(Plasma ON)and absence(Plasma OFF)of plasma for the configuration with(a)R = 1 kΩ and(b)C = 10.3 nF in the grounded line.The V-A characteristic obtained when C = 0.8 nF was used in the electrical circuit is identical to the characteristic in (a).For better clarity in the figure it is not presented here.
The waveform of the current through the ground line iG(t) is presented in figure 4(c).This is the discharge current that passes through the liquid target and a resistor connected in series to the ground.The difference between the waveform shape in the absence and presence of the plasma exists,but it is less noticeable than that in the case of current i(t).Related to the phase difference,the plasma off current waveforms i(t)and iG(t) in figures 4(b) and (c) lead to the high voltage waveform by 85° and 88°,respectively.This points to a system that is mainly capacitive (for pure capacitance the phase difference is 90°)with small deviation from 90°due to the inherent resistivity of the components of the electrical circuit and the plasma source.Deflection from a 90° phase difference means that we observe dissipation of the power even when the plasma is not ignited.After the ignition of the plasma these phase differences remain almost the same,indicating that deposited power in plasma is small,in the order of a few watts.Voltages across two different capacitors are presented in figure 4(d)for C = 10.3 nF and in figure 4(e)for C = 0.8 nF.The voltages across the 0.8 nF capacitor are in phase with the applied voltage independently of the plasma being ignited or not,while in the case of 10.3 nF capacitor a small difference in voltage signals is visible.
3.2.Volt-ampere characteristics of the plasma jet
The volt-ampere V-A characteristics of the plasma jet with distilled water as the liquid target are presented in figures 5 and 6.By using the recorded waveforms for each selected operation point,the V-A characteristics were plotted as a function of the RMS current through the plasma jet main line(figure 5)and the RMS current through the target and ground line (figure 6).
Both characteristics were recorded for the applied peakto-peak voltages from 1.5 to 6 kV.The points were obtained by increasing the output power of the power supply.All measurements were performed in triplicate and observed differences in the obtained values were not more than 7%.For all measurements as a target we used distilled water of the same initial conductivity,because it was noticed that the conductivity of the liquid sample affects the power consumption [52,53].
The V-A characteristic obtained at the plasma jet(figure 5) was recorded when the resistor was inserted in ground line of the electrical circuit.The characteristics that were the same within the error margins were obtained in the other two configurations of the electrical circuit (with capacitors C = 0.8 nF and C = 10.3 nF) and are not shown to keep the graph in figure 5 clear.
Increasing the power delivered to the plasma jet without plasma (triangles) results in a linear increase of both voltage RMS(VRMS)and current RMS(IRMS).With the gas flow,the discharge becomes visible at a VRMSof 0.5 kV and it first appears as a small bright point at the tip of the powered electrode.At a VRMSof 1.3 kV,a plasma filament forms and extends 2 mm from the electrode tip.The filament elongates with an increase of the input power.The discharge crosses the entire gap between the powered electrode and target,and streamer touches the water surface at a VRMSof 1.75 kV.As can be seen in figure 5,for currents above 30 mA and voltage above 1.75 kV the V-A characteristic measured with plasma on (inverted triangles) changes slope and it differs from the V-A characteristics obtained without plasma (triangles).A further increase in the output power of the HV source(applied voltage VRMS> 1.75 kV) leads to a more intense light emission from the plasma and to a change of colour.The streamer also begins to move on the liquid surface.For the highest applied voltages,it is observable that several short and thin filaments are adjoined in a streamer.
The V-A characteristics of the discharge plotted against the current in the grounded line IG_RMS,shown in figure 6,were measured in the configurations with the resistor R = 1 kΩ(figure 6(a))and capacitor C = 10.3 nF(figure 6(b)).The pink and blue triangles show the results for measurement when the plasma is ignited,while the grey inverted triangles show results without plasma (without working gas flow).
The V-A characteristics presented in figure 6(a) shows linear dependence and there is no significant difference between the characteristics when plasma is ignited or not.When the capacitor C = 0.8 nF was inserted into the electrical circuit,the obtained V-A characteristic is similar to the characteristics presented in figure 6(a).However,the V-A characteristic obtained with capacitor C = 10.3 nF(figure 6(b)) has a lower slope and departs from linear dependence at higher currents.The impedances of the capacitors used can explain the observed difference.It can be assumed that the capacitor impedance is equal to the capacitive reactance Xc=i.e.that resistance losses are negligible.Thus,the values of 597 Ω and 46 Ω are obtained for C = 0.8 nF and C = 10.3 nF,respectively.Comparing these results with the resistance of 1 kΩ,it is clear that the impedance of the 0.8 nF capacitor is closer to 1 kΩ while the impedance of the 10.3 nF capacitor differs by one and a half orders of magnitude from that value.
3.3.Impedance of the plasma jet
In order to determine the impedance of the system,we have used a linear fitting of the plotted V-A characteristics obtained at the plasma jet.The total impedance of the plasma jet system ?Zwas obtained as the line slope of the calculated linear fit.It was calculated for both regimes,in the absence(Plasma OFF) and presence (Plasma ON) of plasma,and for three different components in the ground line of the electrical circuit.The equivalent circuit presented in figure 2 is a very simple one and serves only for the estimation of the impedance of the used geometry (Plasma OFF) and of the discharge.These rough estimations of the jet system and plasma impedances are important when developing and/or choosing the appropriate power supply system.They present a load that will influence the work of the power supply,its output and optimal operating frequency.The plasma,which is a highly non-linear system,will in most cases reduce the optimal operation frequency(‘frequency pulling’)of the power supply[54].This means that the output voltage can be reduced due to the exiting resonant state with the power supply transformer.
During the Plasma OFF regime,the complex impedancecan be considered as a series connection of the impedanceand the impedance of the measuring element in the grounded line of the circuit,the resistor or capacitor (see figure 2):
where all impedances are in the complex form,|| = R,andassuming that the contribution of the equivalent series resistance of the capacitor can be neglected.represents the equivalent impedance of the plasma jet system configuration without plasma,including the capacitance of the plasma jet configuration,target impedance,stray capacitance and parasitic resistance of the cables and connections.
When the plasma is ignited (Plasma ON regime),the plasma impedance is represented byin parallel with the impedance(figure 2).Plasma impedance is a complex system and it is beyond the scope of this work to estimate each of the components.After the plasma inception,the impedanceis given by:
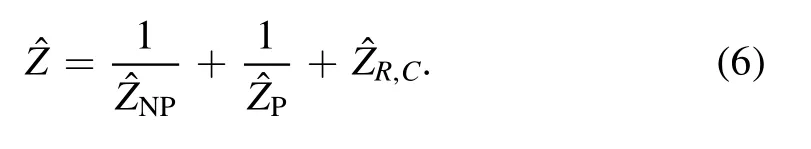
Table 1 shows the total impedances of the plasma jet system||obtained in the presence and absence of plasma.The impedances|| obtained with three different configurations are in agreement with each other,with the difference smaller than 3%.This is expected since the differences in the configurations were in the grounded line part.After the plasma is ignited,the total impedance is reduced by 10%.
Table 1.The total impedance of the plasma jet|| in Plasma ON and Plasma OFF states for three different measuring elements in the ground line.
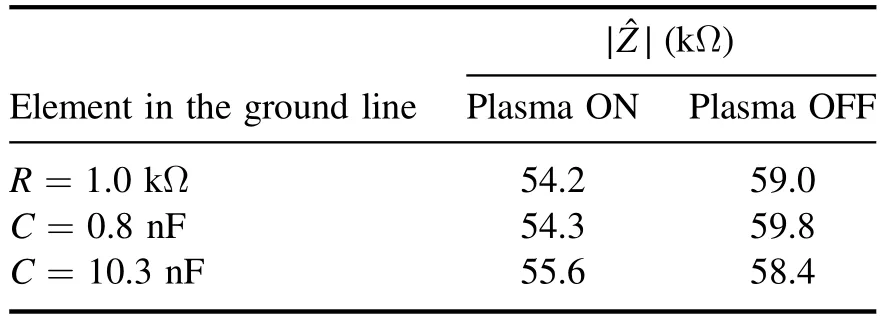
Table 1.The total impedance of the plasma jet|| in Plasma ON and Plasma OFF states for three different measuring elements in the ground line.
|?|Z (kΩ)Element in the ground line Plasma ON Plasma OFF R = 1.0 kΩ 54.2 59.0 C = 0.8 nF 54.3 59.8 C = 10.3 nF 55.6 58.4
3.4.Mean powers dissipated into the system
In this part,we present and discuss two measured powers:the mean power delivered to the plasma jet-Pmeanand the mean power consumed by the plasma Pmean_G,i.e.,the power measured in the grounded line originating from the plasma and through the target.Additionally,a comparison of the results obtained using two standard methods,by integrating the current and voltage product (V-I) and by the Lissajous figure method (Q-V) is presented.
The mean power delivered to the plasma jet Pmeanwas determined in all experiments,regardless of which measurement element was inserted in the grounded line.The powers Pmeanconsumed with ignited plasma(red squares in plots)and without plasma i.e.feed gas (empty squares) were calculated by using equation (3) and is presented in figures 7 and 8.
Determination of the power Pmeanwithout plasma has significance for determining the mean power delivered only to the plasma,since parasitic resistance in the system is included in the power dissipation measured when the plasma is ignited.Therefore,to obtain the values delivered to the plasma itself(Pmean(NET)),the input power measured without He flow(Plasma OFF) was subtracted from the input power when the plasma was on(Plasma ON)for the same applied voltage value:
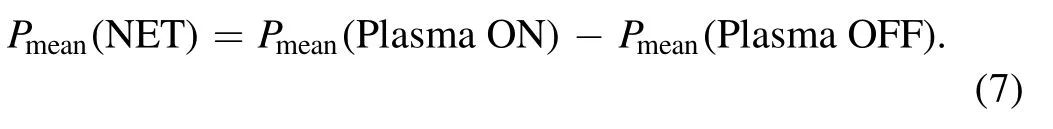
The minimal uncertainty of both methods in our experiments was estimated to be 0.2 W for voltages below 1.5 kV given by power supply.In this range Pmean(NET)is within this margin.It is found that the power Pmean(Plasma OFF) increases nearly linearly with the applied voltage.Fitting a linear function to the obtained data points permits the determination of power losses for any applied voltage or current in the measured range.Comparing the dependences of Pmeanon applied voltage VRMSand on the current through the plasma jet IRMS(see figure 8),it is clear that using either voltage or current as an independent parameter leads to the same power dependence.
The obtained Pmean(NET) as function of VRMSis presented in the plot in figures 7 and 8 (star symbol).Figure 7 shows the power Pmeanobtained in the configuration with capacitor C = 0.8 nF,while figure 8 shows results measured in the arrangement with a resistor R.This power was found to be up to 6 W for the VRMSrange between 0.5 and 2 kV.In both figures 7 and 8,there is a jump in values Pmean(NET)with the applied voltage above 1.5 kV (or IRMSabove 25 mA).This is the situation when the streamer reached and connected to the liquid target surface.By switching to that regime,the power Pmeanjumps to higher values and continues to increase with increasing applied voltage.
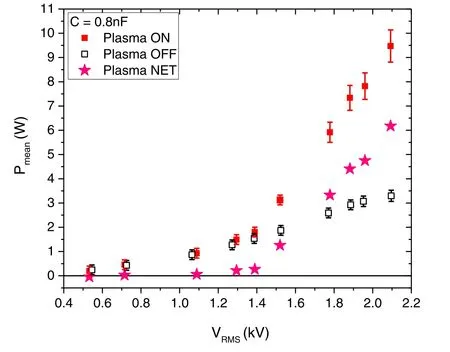
Figure 7.Mean power delivered to plasma jet Pmean in the presence(ON) and absence (OFF) of plasma as a function of applied voltage VRMS for a configuration with C = 0.8 nF in the grounded line.The power delivered only to plasma(Pmean(NET)points)is acquired by subtracting the values.
In the case of the measurement of power consumption by plasma,Pmean_G,we used two different methods (V-I and Q-V).With the serial resistor in the ground line(V-I method),the power Pmean_Gwas calculated by using equations (3) and(7).When a capacitor was connected in series with the grounded target,the Q-V method was employed.Figure 9 shows the dependence of the charge on the measurement capacitor on the applied peak-to-peak voltage for capacitor C = 0.8 nF.Lissajous curves and the calculated deposited powers for three different input voltages of 5 kV,5.5 kV,and 5.9 kV are presented.
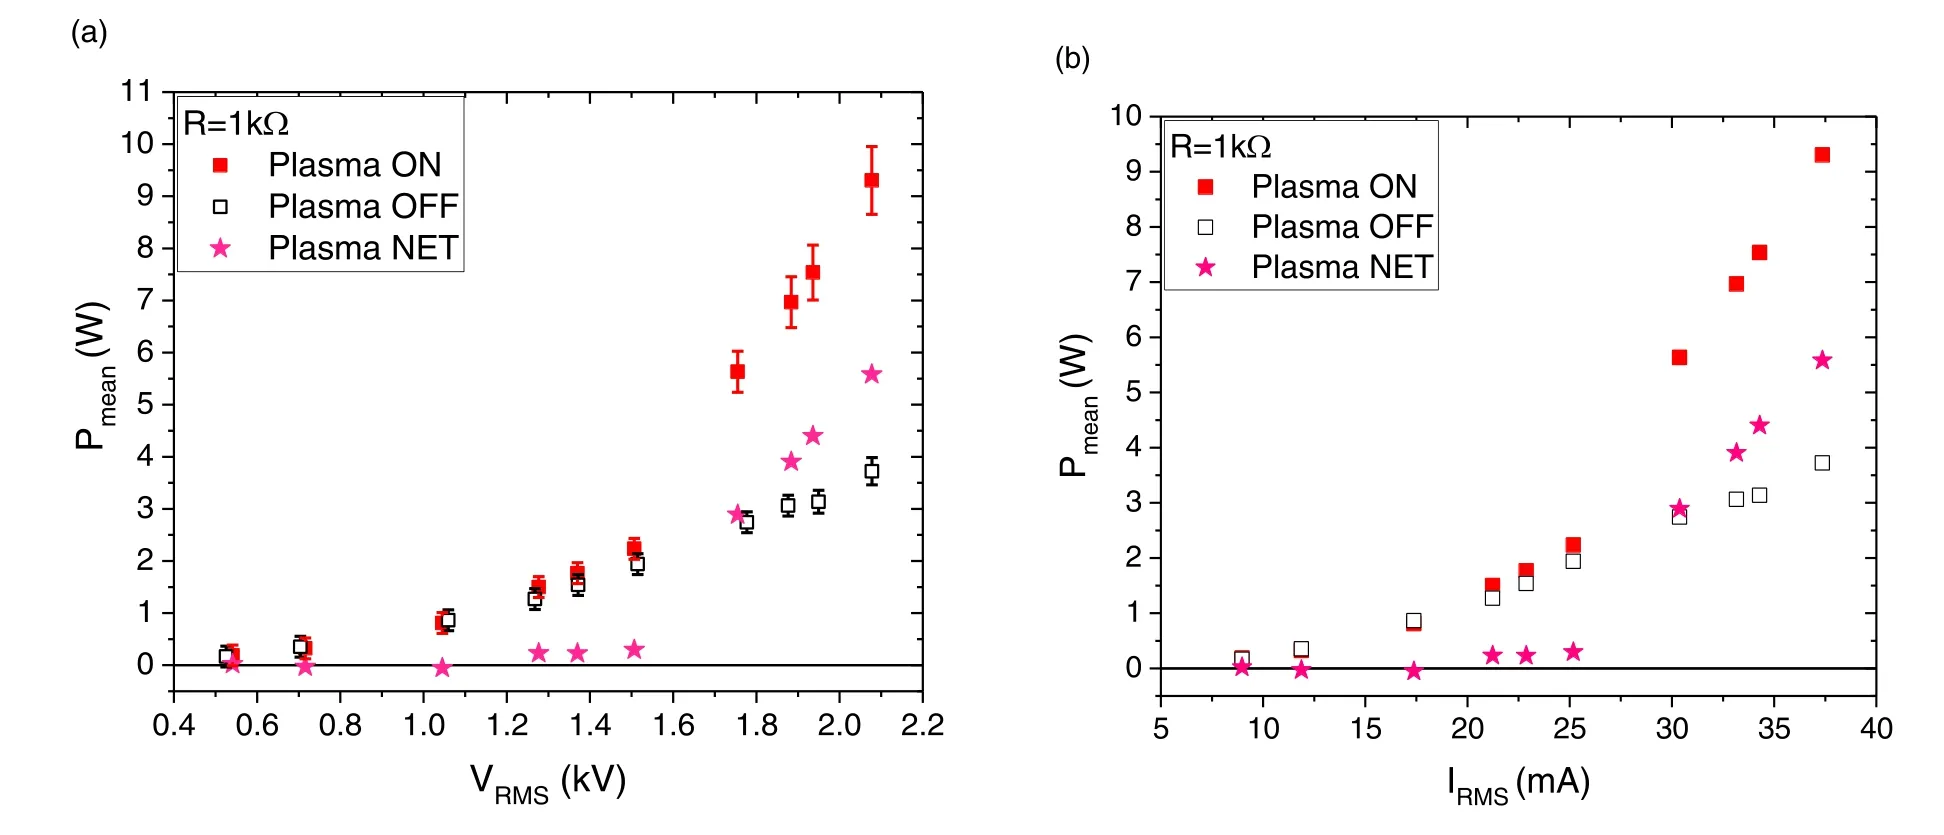
Figure 8.Mean power delivered to plasma jet Pmean in the presence(ON)and absence(OFF)of plasma for a configuration with R = 1 kΩ in the grounded line.Pmean(NET) points are acquired by subtracting the values.(a) Pmean dependence on the applied voltage VRMS,(b) Pmean dependence on the current through plasma jet main line IRMS.
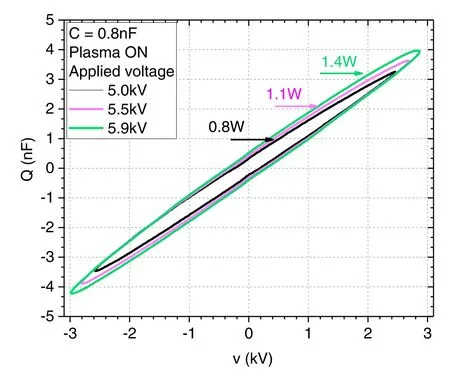
Figure 9.Charge-voltage plot (Lissajous figure) and consumed power Pmean_G in the presence of plasma for three different applied peak-to-peak voltages(5 kV,5.5 kV,5.9 kV)and a signal frequency of 330 kHz.A capacitor of 0.8 nF was used for measurement.
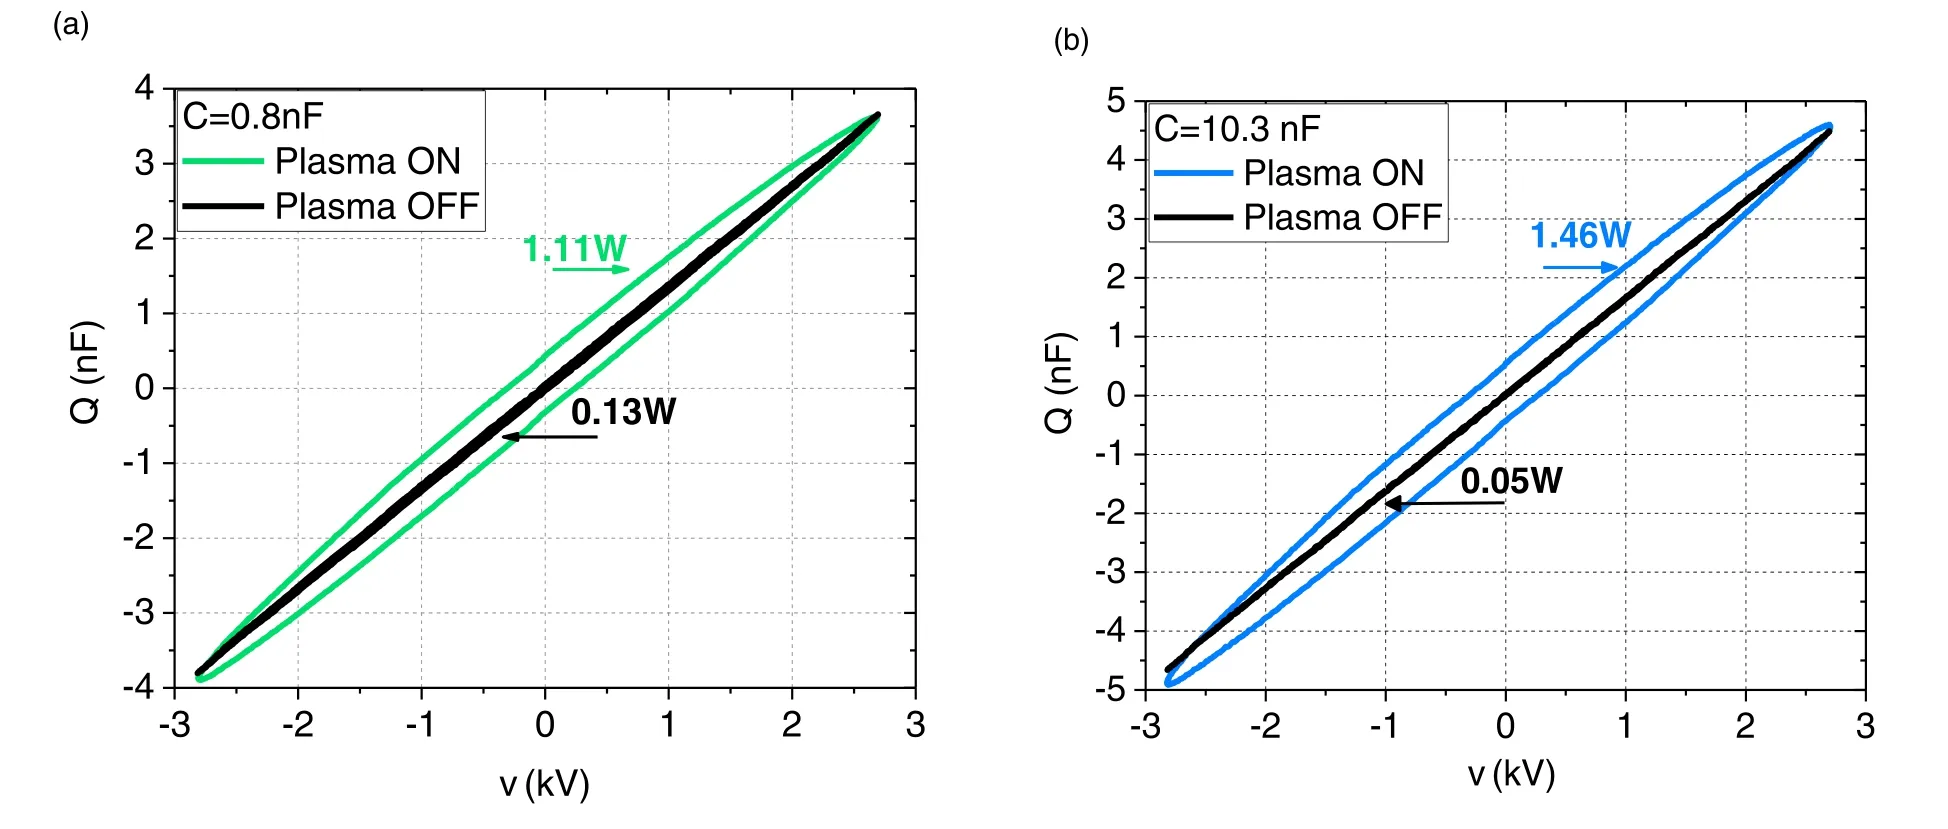
Figure 10.Charge-voltage plot (Lissajous figure)and consumed power Pmean_G for the applied peak-to-peak voltage of 5.5 kV and a signal frequency of 330 kHz.Data in(a)green and(b)blue represent state with plasma and data in black(a)and(b)represent state without plasma(without He flow).Capacitors of (a) 0.8 nF and (b) 10.3 nF were used for measurements.
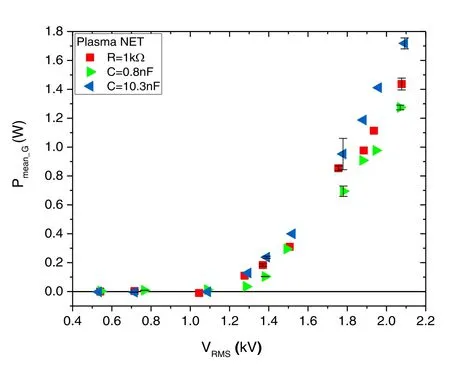
Figure 11.Mean power consumed by plasma Pmean_G (NET) for three different measuring elements in the grounded line.
The powers were calculated by using equation(4).Since both the applied voltage and the charge oscillate with the same frequency,a Q-V plot will form an ellipsoid Lissajous figure.The elliptical shape of the Q-V diagrams is obtained when a continuous plasma current flows during a full period of the high voltage signal [21,48].
From the data in figure 9,it was apparent that the Lissajous loop retained the same shape and changed the slope(the line connecting points of minimum and maximum voltage) as the voltage changed.The centre of the ellipse coincided with the coordinate system point of origin.Comparing the results for two different capacitors,it was found that the power measured using the 10 nF capacitor was slightly higher than the power estimated with 0.8 nF capacitor for the same applied voltage.The difference was around 23%,and it can be due to capacitor properties or plasma adjustment to different circuit elements [33].
Charge-voltage plots for states with and without plasma at the same applied voltage for 0.8 nF and 10.3 nF monitor capacitors are presented in figures 10(a)and(b),respectively.Our measurements show that the obtained Lissajous figure in the absence of plasma had a nonzero area,i.e.it was a very elongated ellipse.Usually,the curves obtained without plasma ignition in the Q-V diagram are considered to be a straight line,as it was assumed in the other studies with different plasma sources employed[42,44].The existence of the elongated ellipse when plasma is not ignited may be the result of technical issues such as defective wire connections or uncompensated probes [48].In our case,these contingencies were checked and excluded.So,this power dissipation in the Plasma OFF regime manifested the resistive losses present in the system,i.e.that a certain power was consumed in this part of the circuit even without plasma.This was observed also with Plasma OFF power values measured at the plasma jet (figures 7 and 8).Comparing the plots in figure 10,it can be seen that the power losses measured with 10.3 nF capacitor are one order of magnitude less than those in the case of 0.8 nF capacitor.In the case of high excitation signal frequency,the parasitic properties of the capacitor can have a significant value,thus influencing the total impedance of the capacitor in the circuit [33,41,55].This,in turn,influences the determination of power,particularly in the Plasma OFF case.
The Q-V plot in the absence of plasma has a shape of an elongated ellipse,with the sharp turning point at maximum input voltage,meaning that the charge and supplied voltage are in phase reaching the peak value at the same time.When the plasma is turned on,a Lissajous curve gains rounded endpoints indicating additional resistive losses in the system.However,the waveforms of voltage across the capacitor vG(t)and high voltage v(t) remain in the phase for Plasma ON.Therefore,it can be assumed that the ignition of plasma does not lead to an increase in the impedance of an element of the plasma jet system,which can change the phase between voltage signals.This analysis suggests that the power obtained with Plasma ON contains the total power consumed in the system.Thus,the determination of the mean power consumed only by plasma,Pmean_G(NET),has to follow a similar procedure used for the V-I method in equation (7): the power calculated from the Plasma OFF Lissajous figure should be subtracted from the power determined from the Plasma ON Lissajous figure for the same applied peak-to-peak voltage.
In order to evaluate the two methods for the determination of the dissipated power,the dependence of the mean power consumed by plasma Pmean_G(NET) on VRMSwas plotted in figure 11 with values obtained with three different electrical elements in the grounded line.
The power Pmean_G(NET) ranges from 0 to 1.7 W for VRMSbetween 0.5 and 2 kV.Compared to the results calculated for the power Pmean,we observed that less than 30% of Pmeanis consumed by the plasma and forwarded through the grounded line.It can be seen in figure 11 that the power dependence on VRMScalculated by the Lissajous figure (triangles)is in excellent agreement with those values obtained by the V-I method (squares).The error bars were estimated as standard errors from three different measurements.In the VRMSrange from 0.5 to 1.1 kV,the calculated difference between powers measured in the presence and absence of plasma is close to zero.However,the plasma could be observed with the naked eye as a small bright region at the tip of the electrode,even in this range of applied voltages.Therefore,these power values were lower than the sensitivity of the methods.
3.5.Difficulties in measurements of power
The most common problems in the power measurement are unwanted losses in the circuit that affect repeatability of the measurements.The losses in the plasma jet system occur due to the connections of the circuit elements,their quality i.e.characteristics,cables and also measuring equipment (especially when approaching the high frequency range).In the ground line of the electrical circuit,we noticed that any change in connections,such as the change of cables,connectors or a grounding technique,will affect the measured values.To minimize the power losses and ensure reproducible results,the cables of appropriate length,connection and quality should be selected before measurement.
Several cautions need to be noted regarding the use of the Q-V method.The most common difficulties to pay attention to are:the selection of the appropriate type of capacitor,the use of proper cables for grounding the capacitor and the appearance of nodes or discontinuities in the curve.
First,the selection of an appropriate capacitor is considered as the most important part of the successful application of this method.It was found that different types of capacitors with the same capacitance yield different results.The use of film capacitors has been found to lead to nonphysical results.When using a 10 nF metalized polyester(PET) capacitor,we measured more dissipated power when the plasma was OFF than when the discharge was ignited.In some cases when a PET capacitor was used,we observed a self-intersecting loop in the part of the figure where the charge and voltage change sign.The appearance of node points in the curve indicates different oscillation frequencies of the two signals-the applied voltage and capacitor voltage.These findings suggest that PET capacitors should not be used in the Q-V technique for power determination,at least not with highfrequency signals.
The capacitor size should be chosen with respect to the plasma jet system capacitance,i.e.a capacitor should be selected that can store all of the charge that has passed through the discharge during one half-cycle of the applied voltage.This can be fulfilled if the capacitor size is at least one order of magnitude higher than the plasma source capacitance.In this work,the capacitance size was selected to be three orders of magnitude greater than the plasma jet system capacitance.
As already mentioned,the connections in the grounded branch of the circuit greatly influence the repeatability of measurements.Small changes in the position of the cable between the grounded electrode and the monitor capacitor could cause changes in the inclination and width of the Q-V elliptic loop.A suitable cable which does not influence the characteristics of the Lissajous curve should be selected for the measurement.
Finally,despite its type and capacitance,every capacitor gives open loops.The Q-V plot is discontinuous because the curve after one period of applied voltage does not return to the starting point.That is,the charge and voltage values are different in points t = 0 and t = T.This feature of the Lissajous figure has already been observed for DBD plasma reactors[41,56].Despite this,the integration of the figure area is still possible,although there is a gap in the curve.This issue can be diminished when using a high-resolution oscilloscope that provides waveforms with a large number of points.
The main challenge with the use of the V-I method is resistor selection.It should be large enough to limit the discharge current.This is especially important in the case of low resistivity targets (conductive targets).An uncontrolled increase in discharge current can lead to a change in the type of discharge and then to heating and evaporation of the liquid target.However,the measurement resistor must be small enough to measure the voltage across the resistor with a voltage probe.Moreover,there are certain problems with using the V-I method when a pulsed power source is used in the experiment.In that case,when calculating the power,it is necessary to perform integration over the entire pulse duration period.Integration over one part of the period of the input signal which is shorter than the pulse duration,gives an inaccurate result for the power deposition,as it could include only the positive or negative part of the waveform oscillation.This would lead to an underestimation or overestimation of the measured power.
4.Conclusion
In this paper,we presented the results of electrical diagnostics of the He plasma jet powered by continuous sine HV signal and operating in contact with a liquid sample.The main goals were to use data from systematically performed measurements of the electrical parameters of such a system for the determination and comparison of the mean power consumed by plasma Pmean_Gobtained by using two different methods-V-I and Q-V.It must be emphasized that the displacement current can be significant,especially in the case of atmospheric pressure plasma sources,and it needs to be taken into account.Since it is mainly a result of the capacitive characteristics of the plasma systems,it does not influence the mean power deposited to (consumed by) the plasma.This is evoked by the fact that the plasma jets in the configuration with the pin electrode are employed in different applications in contact with the liquid target,but without thorough investigation of the power measurement techniques,especially for the case of a continuous wave power supply.
For that purpose,voltage and current waveforms were monitored and V-A characteristics of the plasma jet and the discharge were established.The phase difference between the current and voltage signal showed mainly the capacitive nature of the system,regardless of the plasma presence in the system.As the obtained V-A characteristics were linear,the data were used to determine the impedance of the whole system from the linear fitting of the plot.The impedance was almost the same regardless of the ground circuit configurations.
The mean power delivered to the plasma jet was determined by using the V-I method and found to be up to 6 W for a VRMSrange between 0.5 kV and 2 kV.It was shown that plotting the power values using either voltage or current as an independent parameter results in the same power dependence.
The mean power consumed by the plasma was determined by using two different methods.In both case when the capacitor was inserted in the ground line of the electrical circuit,an elliptical shape of the Lissajous figure was obtained.However,the measured power observed with two different capacitors differs by 23%,suggesting a slightly different adjustment of the plasma operating point due to the system conditions.Also,it shows that the properties of the capacitor should not be neglected when calculating the power delivered to the plasma,as the capacitor should not be considered as an ideal element of the circuit.Nevertheless,this study has found that the discharge power dependence on VRMScalculated by the V-I method is consistent with those observed by the Lissajous figure (Q-V method).
Nevertheless,proper utilization of the power measurement method is necessary if one performs an optimization of the energy efficiency of the plasma system.The mean power delivered to plasma calculated by both methods ranges from 0 to 1.7 W for a VRMSrange between 0.5 kV and 2 kV.Therefore,this means that less than 30% of the power delivered to the plasma jet is consumed by the plasma.
Acknowledgments
This research has been supported by MESTD Republic of Serbia (No.451-03-68/2020-14/200024).
ORCID iDs
 Plasma Science and Technology2022年10期
- Plasma Science and Technology的其它文章
- Study of a 105 GHz short-pulse dummy load for the electron cyclotron resonance heating system with the quasi-optical method
- Cleaning of nitrogen-containing carbon contamination by atmospheric pressure plasma jet
- Impacts of laser pulse width and target thickness on laser micro-propulsion performance
- The effects of dilution gas on nanoparticle growth in atmospheric-pressure acetylene microdischarges
- The effect of nitrogen concentration on the properties of N-DLC prepared by helicon wave plasma chemical vapor deposition
- Development of low power non-thermal plasma jet and optimization of operational parameters for treating dyes and emerging contaminants