
Numerical simulation of the start-up process of a miniature ion thruster
2022-08-01 11:33:54XinyongYANG楊鑫勇LiqiuWEI魏立秋WenjiaJIANG蔣文嘉TianyuanJI紀(jì)添源LiweiZHOU周立偉HongLI李鴻YongjieDING丁永杰JingfengTANG唐井峰NingGUO郭寧andDarenYU于達(dá)仁
Plasma Science and Technology 2022年7期
Xinyong YANG(楊鑫勇),Liqiu WEI(魏立秋),?,Wenjia JIANG(蔣文嘉),Tianyuan JI(紀(jì)添源),Liwei ZHOU(周立偉),Hong LI(李鴻),Yongjie DING(丁永杰),Jingfeng TANG(唐井峰),Ning GUO(郭寧)and Daren YU(于達(dá)仁)
1 School of Energy Science and Engineering,Harbin Institute of Technology,Harbin 150001,People’s Republic of China
2 Key Laboratory of Aerospace Plasma Propulsion,Ministry of Industry and Information Technology,Harbin 150001,People’s Republic of China
3 Science and Technology on Vacuum Technology and Physics Laboratory,Lanzhou Institute of Physics,Lanzhou 730000,People’s Republic of China
Abstract A particle-in-cell Monte Carlo collision model of a discharge chamber is established to investigate the start-up process of a miniature ion thruster.We present the discharge characteristics at different stages(the initial stage,development stage,and stable stage)according to the trend of the discharge current with time.The discharge current is the sum of the sidewall current and the backplate current.During the start-up process,the sidewall current lags behind the backplate current.The variation and distribution characteristics of the discharge current over time are determined by the electron density distribution and electric potential distribution.
Keywords:miniature ion thruster,discharge chamber,start-up process,Monte Carlo collision
1.Introduction
Ion thrusters have a high specific impulse,efficiency,and adjustable thrust,and are widely used in propulsion tasks,such as position maintenance and orbit transfer of satellites;however,due to their size,conventional ion thrusters cannot be used in small satellites.To fulfill the needs of missions that consider small satellites,conventional ion thrusters must be replaced with miniature ion thrusters as the propulsion system.
An ion thruster consists of a discharge chamber(including a cathode and an anode),an ion optical system(including a screen grid and an accelerator grid)and a neutralizer.The discharge chamber produces the plasma,the ion optical system accelerates ions to produce an ion beam,and the neutralizer emits electrons to neutralize the beam.Numerical simulation is one of the main methods to study the plasma in the discharge chamber of an ion thruster.Since the 1980s,researchers have investigated the discharge process of ion thrusters based on this methodology.Brophyet al[1]established a zero-dimensional model to estimate parameters of the ion thruster discharge chamber such as discharge loss,ionization rate,and discharge efficiency,based on the energy conservation equation.This model requires experimental data as input parameters.Goebelet al[2]improved the model by estimating the plasma parameters based on the geometrical dimensions of the thruster and its anode potential.Arakawaet al[3]established a two-dimensional axisymmetric model,by treating the primary electron as a collision-free fluid and neutral gas as the background,and analyzed the confinement effect of the magnetic field configuration on the plasma.Since the 1990s,the particle-in-cell Monte Carlo collision(PICMCC)method was used to study the discharge process of ion thrusters.Arakawaet al[4]developed a two-dimensional electronic tracking model based on the PIC-MCC method.Hirakawa coupled the ionization process into the model,and,thereafter,calculated the ion loss rate on the wall.To increase the speed of the PIC-MCC model,Mahalingamet al[5,6]increased the vacuum dielectric constant and reduced the mass of heavy particles,therefore realizing the full simulation of the discharge process in the discharge chamber.Wirzet al[7–10]established a two-dimensional axisymmetric particlefluid mixing model in which the motion of the primary electrons and neutral atoms was calculated by the PIC-MCC and View Factor methods,respectively.The motion of the plasma was determined by the bipolar diffusion model based on the quasi-neutral assumption.The results show that the magnetic field configuration greatly influences the performance of the thruster,as the high-energy primary electrons can be guided away from the center of the discharge chamber by optimizing the magnetic field configuration,reducing the divalent ion density near the central axis.
To study the discharge process of the miniature ion thruster,researchers improved the model of the conventional ion thruster.Arakiet al[11,12]improved the interpolation method of the unstructured grid of the Wirz model and the generation algorithm of the magnetic field line grid,greatly increasing the accuracy of the results near the boundary.The improved model can simulate the discharge process considering a small geometry and strong magnetic field;therefore,it can be employed to simulate the features of a miniature ion thruster.This simulation was conducted by Mao and Wirz[13],who concluded that a weak magnetic field at the cusp increases the plasma density and uniformity upstream of the screen grid,improving the efficiency of the thruster.Dankongkakulet al[14–16]applied the same model to optimize the magnetic field configuration and cathode size of the miniature ion thruster.As a result,the upstream magnetic field significantly affected the loss behavior of electrons at the cusp,electron injection and magnetic field asymmetric azimuth will increase the loss area of electrons.Huerta and Wirz[17]optimized the memory management and solver algorithm of the model to refine the mesh,and applied analytical methods to solve the magnetic field,improving the accuracy of primary electron tracking and ion diffusion model at the cusp.The adaptive time step was adopted to more accurately and efficiently track the primary electrons.The results of the improved model agreed with experimental data.Liet al[18]applied the improved model to study the recombination behavior of the primary electron and plasma in the ARCH-type miniature ion thruster,and the influence of the thruster configuration,such as the backplate potential,neutral gas injection method,magnet position,and cathode type,on the performance of the thruster.
Although the research on the steady-state plasma characteristics of the discharge chamber of the miniature ion thruster has greatly progressed,the start-up process of the thruster has not been sufficiently investigated.The success of the startup process is a prerequisite for the normal operation of the miniature ion thruster;therefore,further research on the behavior of this procedure is needed.The small geometry of the discharge chamber of the miniature ion thruster and the short duration of the start-up process are great challenges in the investigation of the start-up process through experiments;therefore,a numerical simulation of this procedure is a more suitable method.In this study,the PIC-MCC model of the discharge chamber of the miniature ion thruster is applied to analyze the start-up process of the thruster and the plasma characteristics in the discharge chamber at different times during the start-up.Furthermore,the variations in the discharge current throughout the procedure are obtained.
The remainder of this paper is organized as follows.Section 2 presents the model of the miniature ion thruster discharge chamber model,section 3 indicates the results of this model,and section 4 presents the analysis and discussion of these results.Finally,the conclusions are provided in section 5.
2.Discharge chamber model
PIC-MCC was employed to simulate the start-up process of the miniature ion thruster.In the particle-in-cell(PIC)method,the plasma is assumed to be composed of macroparticles,which represent a large number of real particles that can collide,penetrate and fuse between them.To fully determine the behavior of this process,first,the charge of the charged macro particle is distributed to the surrounding grid nodes,and the electromagnetic field distribution is calculated.Afterward,the macro particle moves and interacts due to the influence of the electromagnetic field.The displaced charged particles alter the electromagnetic field,which continues to influence the movement of these macroparticles.The calculation of equations(1)and(2),which represent this phenomenon,is repeated until the predetermined execution step is reached.
The discharge chamber model of the miniature ion thruster is shown in figure 1.The discharge chamber had a radius of 15 mm and a length of 30 mm,and was composed of a hollow cathode and an anode.During the discharge process,the hollow cathode emitted primary electrons and a small number of ions into the discharge chamber.Since the ionization process was dominated by electrons,the ions emitted by the cathode were ignored in this model.In addition,only the keeper of the hollow cathode was directly exposed in the discharge chamber,so the keeper potential was used as the potential boundary condition of the cathode in the model.The radius of the cathode was 6 mm,and the length of the part extending into the discharge chamber was 4 mm.The anode corresponded to the left and upper boundaries of the simulation domain,and consisted of a backplate and a sidewall,responsible for receiving charged particles(mainly electrons)reaching the boundary of the simulation domain.The backplate corresponded to the left boundary of the simulation domain,and the sidewall corresponded to the upper boundary of the simulation domain.The screen grid corresponded to the right boundary of the simulation domain and was responsible for receiving charged particles(mainly ions)leaving the discharge chamber.The axis of the discharge chamber corresponded to the lower boundary of the simulation domain.The ring-shaped magnets were alternately arranged to generate a ring-cusp magnetic field,in which the width of the magnetic pole was 3 mm.The electric potential at each boundary of the discharge chamber was 28 V(anode voltage)on the backplate and sidewall,10 V on the cathode keeper,and 0 V on the screen grid.
The mesh size is limited by Debye length λD.Debye length of the plasma is calculated through equation(8):
wherekbis the Boltzmann constant andTeis the electron temperature.The PIC method obtains the electric field by solving the Poisson equation,and the mesh size is usually smaller than Debye length.
The time step is limited by the plasma frequency ωpe.The plasma frequency is calculated through equation(9).
In order to accurately simulate the behavior of the plasma,the time step needs to satisfy the following condition:
For an ion thruster,the plasma density in the discharge chamber is usually less than 1018m?3,and the electron temperature is about several electron volts.The model assumed a plasma density of 1018m?3and an electron temperature of 5 eV,from which the Debye length was 1.66×10?5m and the plasma frequency was 5.64×10¹⁰s?1.
Due to the limitation of the time step and the mesh size,PIC method has a huge amount of calculation and very slow convergence speed.In order to reduce the amount of calculation and shorten the simulation time,it is necessary to simplify the model.Taccognaet al[19]proposed a selfsimilarity approximation,scaling down the size of the computational domain using a scaling factor of ζ.The parameter details of the scaling law are reported in table 1.The total time for the model to converge is the same order of magnitude as the time of xenon ions passing through the simulation domain.Therefore,the total time of model convergence decreases with the decrease of computational domain size.At the same time,with the decrease of computational domain size,the grid number decreases,which reduces the amount of computation.Szabo[20]reduced the amount of calculation by reducing the mass ratio of ions to electrons and increasing the permittivity.Reducing the mass ratio of ions to electrons can increase the speed of ion movement in the electric field and reduce the total time of convergence.Increasing the permittivity can increase Debye length and decrease the plasma frequency,thus increasing the grid size and time step and reducing the calculation amount.
In this model,a self-similar system was adopted to reduce the size of the discharge chamber by 5 times,so that the characteristic length of the simulation domain was 1/5 of the original.At the same time,the mass ratio of xenon ions to electrons was reduced by a factor of 100,which increased the speed of xenon ions by a factor of 10.In addition,the permittivity was enlarged 144 times to amplify the grid size and the time step.After the calculation,the scaling process was reversed to get the results back to the full-size discharge chamber.
All three numerical acceleration techniques mentioned above can lead to errors.Yuanet al[21]analyzed the effects of numerical acceleration techniques on simulations of ion thrusters.The results showed that increasing the permittivity or a self-similarity system will affect the potential distributions as well as the plasma distributions in the discharge chamber,and reducing the mass ratio of ions to electrons will diminish the plasma number density in the discharge chamber.However,numerical acceleration techniques have great advantages in saving computational costs.In Mahalingam’s work[22,23],a large artificial permittivity was applied to study the discharge chamber of the NASA Solar electric propulsion Technology Application Readiness(NSTAR)system and a self-similarity system was used to study the discharge chamber of NASA’s Evolutionary Xenon Thruster(NEXT)ion thrusters.Numerical acceleration techniques reduced the computation time from several years to several weeks,and the comparison between simulation results and experimental data showed that Mahalingam’s models are acceptable.In addition,Yuan[21]suggested applying suitable numerical acceleration techniques to make a balance between simulation reliability and speedy computation.In this work,the parameters for numerical acceleration are quite conservative in order to reduce the errors,so the simulation results can be considered realistic,and the computational time and costs are unacceptable if the real physical process is completely simulated.
To further accelerate the numerical calculations and to reduce the computational time of simulations,electrons and ions moved in a uniform neutral gas background.The neutral gas density in the discharge chamber of a miniature ion thruster is typically about 1019m?3,which is estimated from the size of the discharge chamber and the flow rate of neutral gas.In this model,the neutral gas density was set as 2×10¹⁹m?3.The elastic collision,excitation collision,and ionization collision,which occur between electrons and environment gas,were mainly considered.After the particles move to the boundary of the discharge chamber,different forms of reactions occur between the particles and boundaries.Table 2 lists the reactions of each particle at each boundary of the discharge chamber.
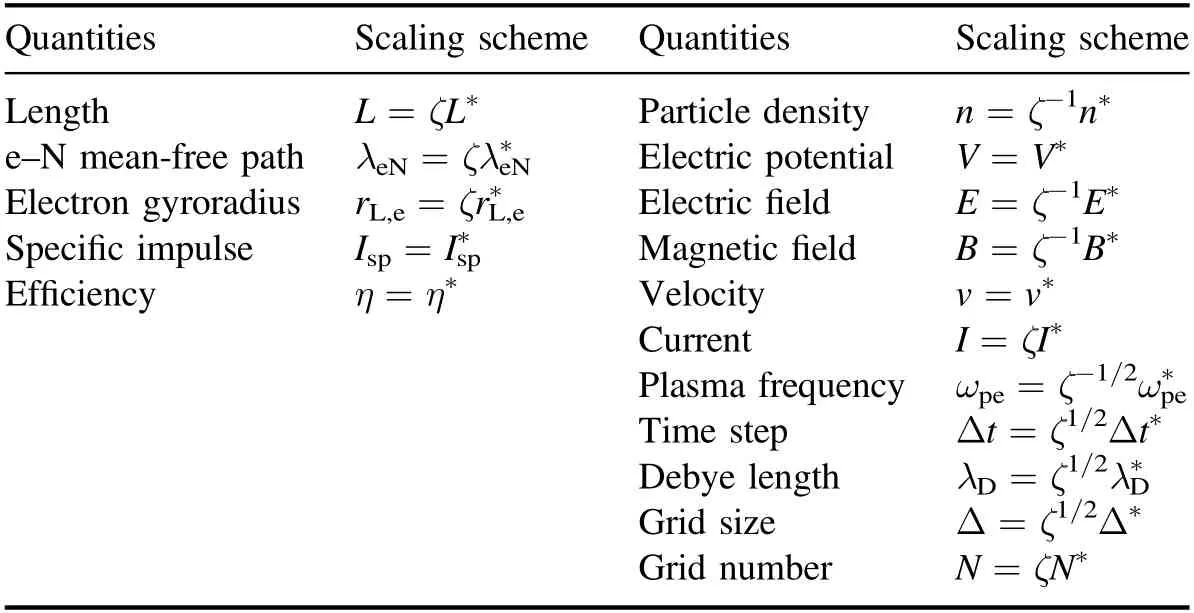
Table 1.The scaling law of the self-similar system(unscaled quantities are designated with an asterisk).
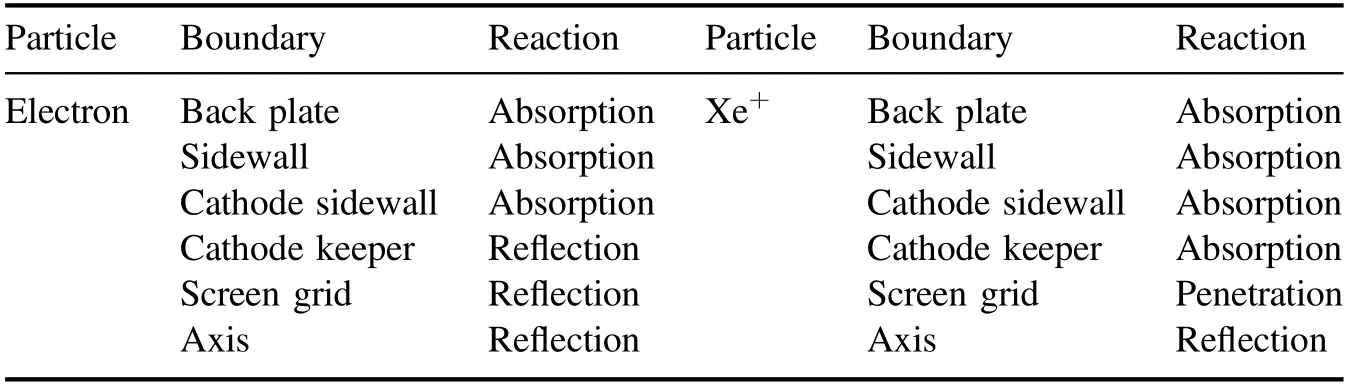
Table 2.Wall surface reaction types.
3.Results
3.1.Model verification
The proposed model was used to simulate the start-up process of the miniature ion thruster.As shown in figure 2(a),the discharge current(displayed in logarithmic coordinates after filtering)was stable after approximately 20 μs,indicating the end of the process.The distribution of the electron density in the discharge chamber at 20 μs is shown in figure 2(b).The ionization occurs mainly between the cathode,screen grid,and middle cusp.The electrons were confined in this area due to the magnetic field;therefore,the electron density outside this area rapidly dropped.Figure 3 shows Dankongkakul’s[15]diagnosis results of the plasma in discharge chamber with 3 R configuration.The area where the plasma density was the highest was located between the middle cusp and the screen grid.Due to the difference in the position of the cathode and the configuration of the magnetic field,the simulation results were different from Dankongkakul’s experimental results;however,the general features were similar,confirming the concept of the model,which can,therefore,be used to analyze the physical process of the thruster discharge chamber.
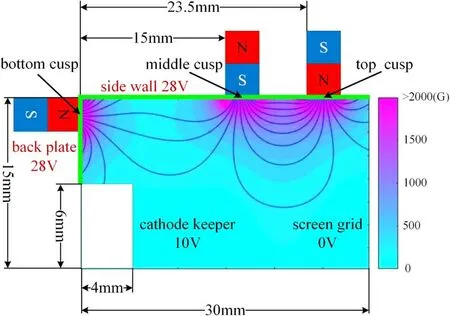
Figure 1.Discharge chamber model.
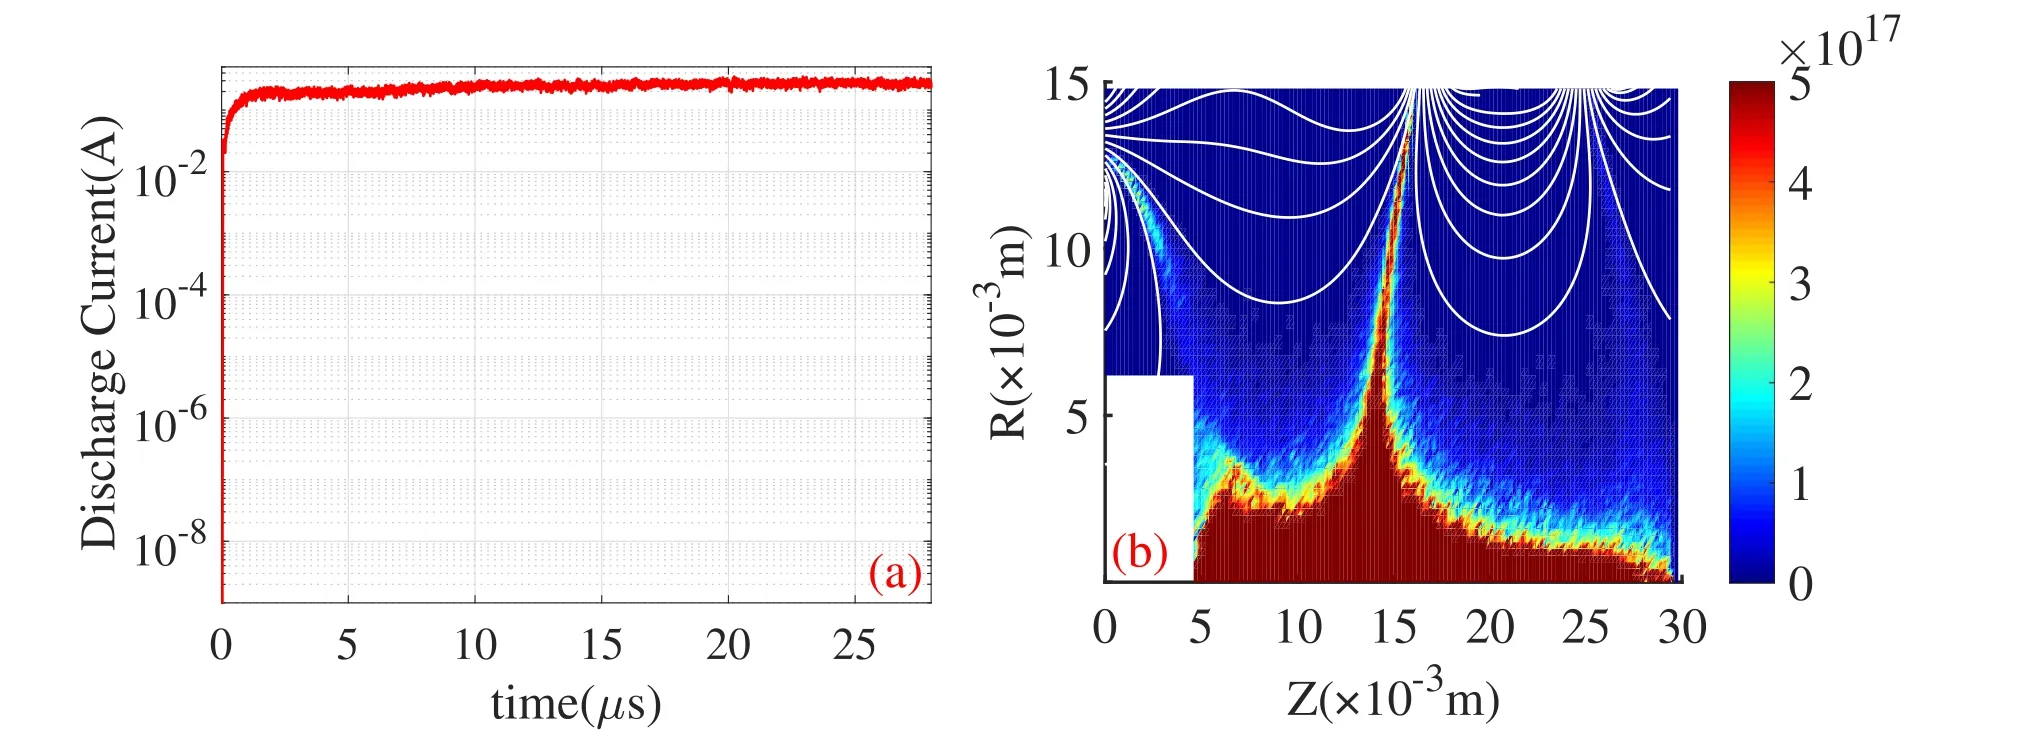
Figure 2.Simulation results of the model.(a)Discharge current with time.(b)Electron density in steady-state.
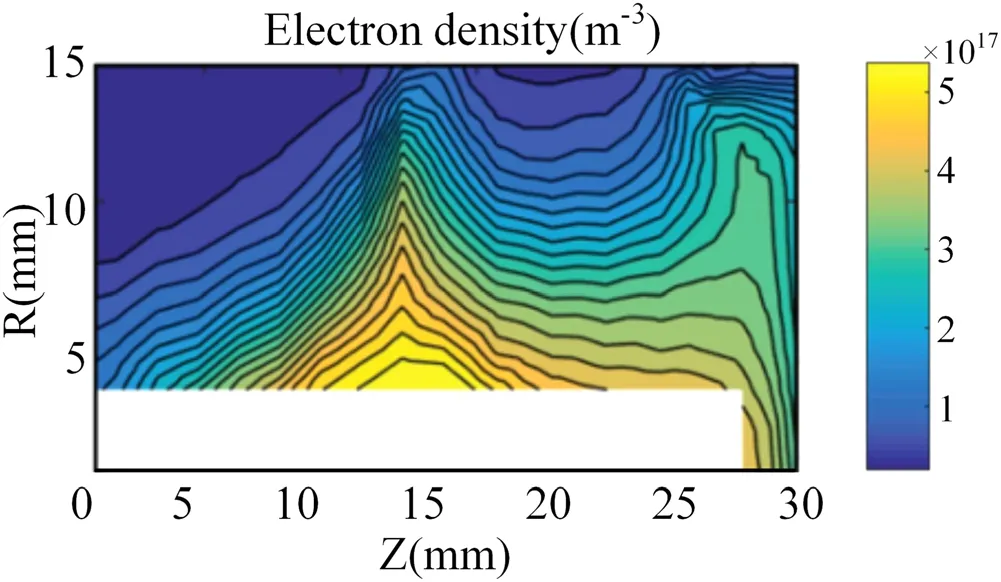
Figure 3.The probe diagnosis result of the electron density in a steady-state[15].
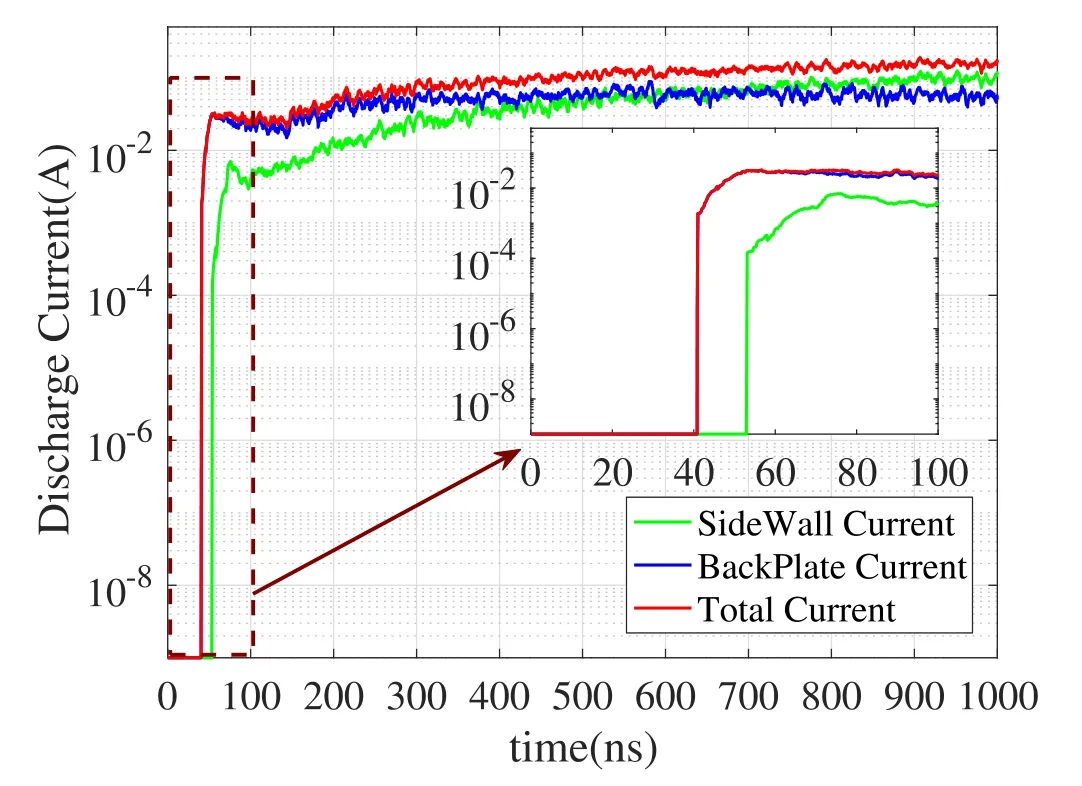
Figure 4.The discharge behavior at the beginning of the start-up process.
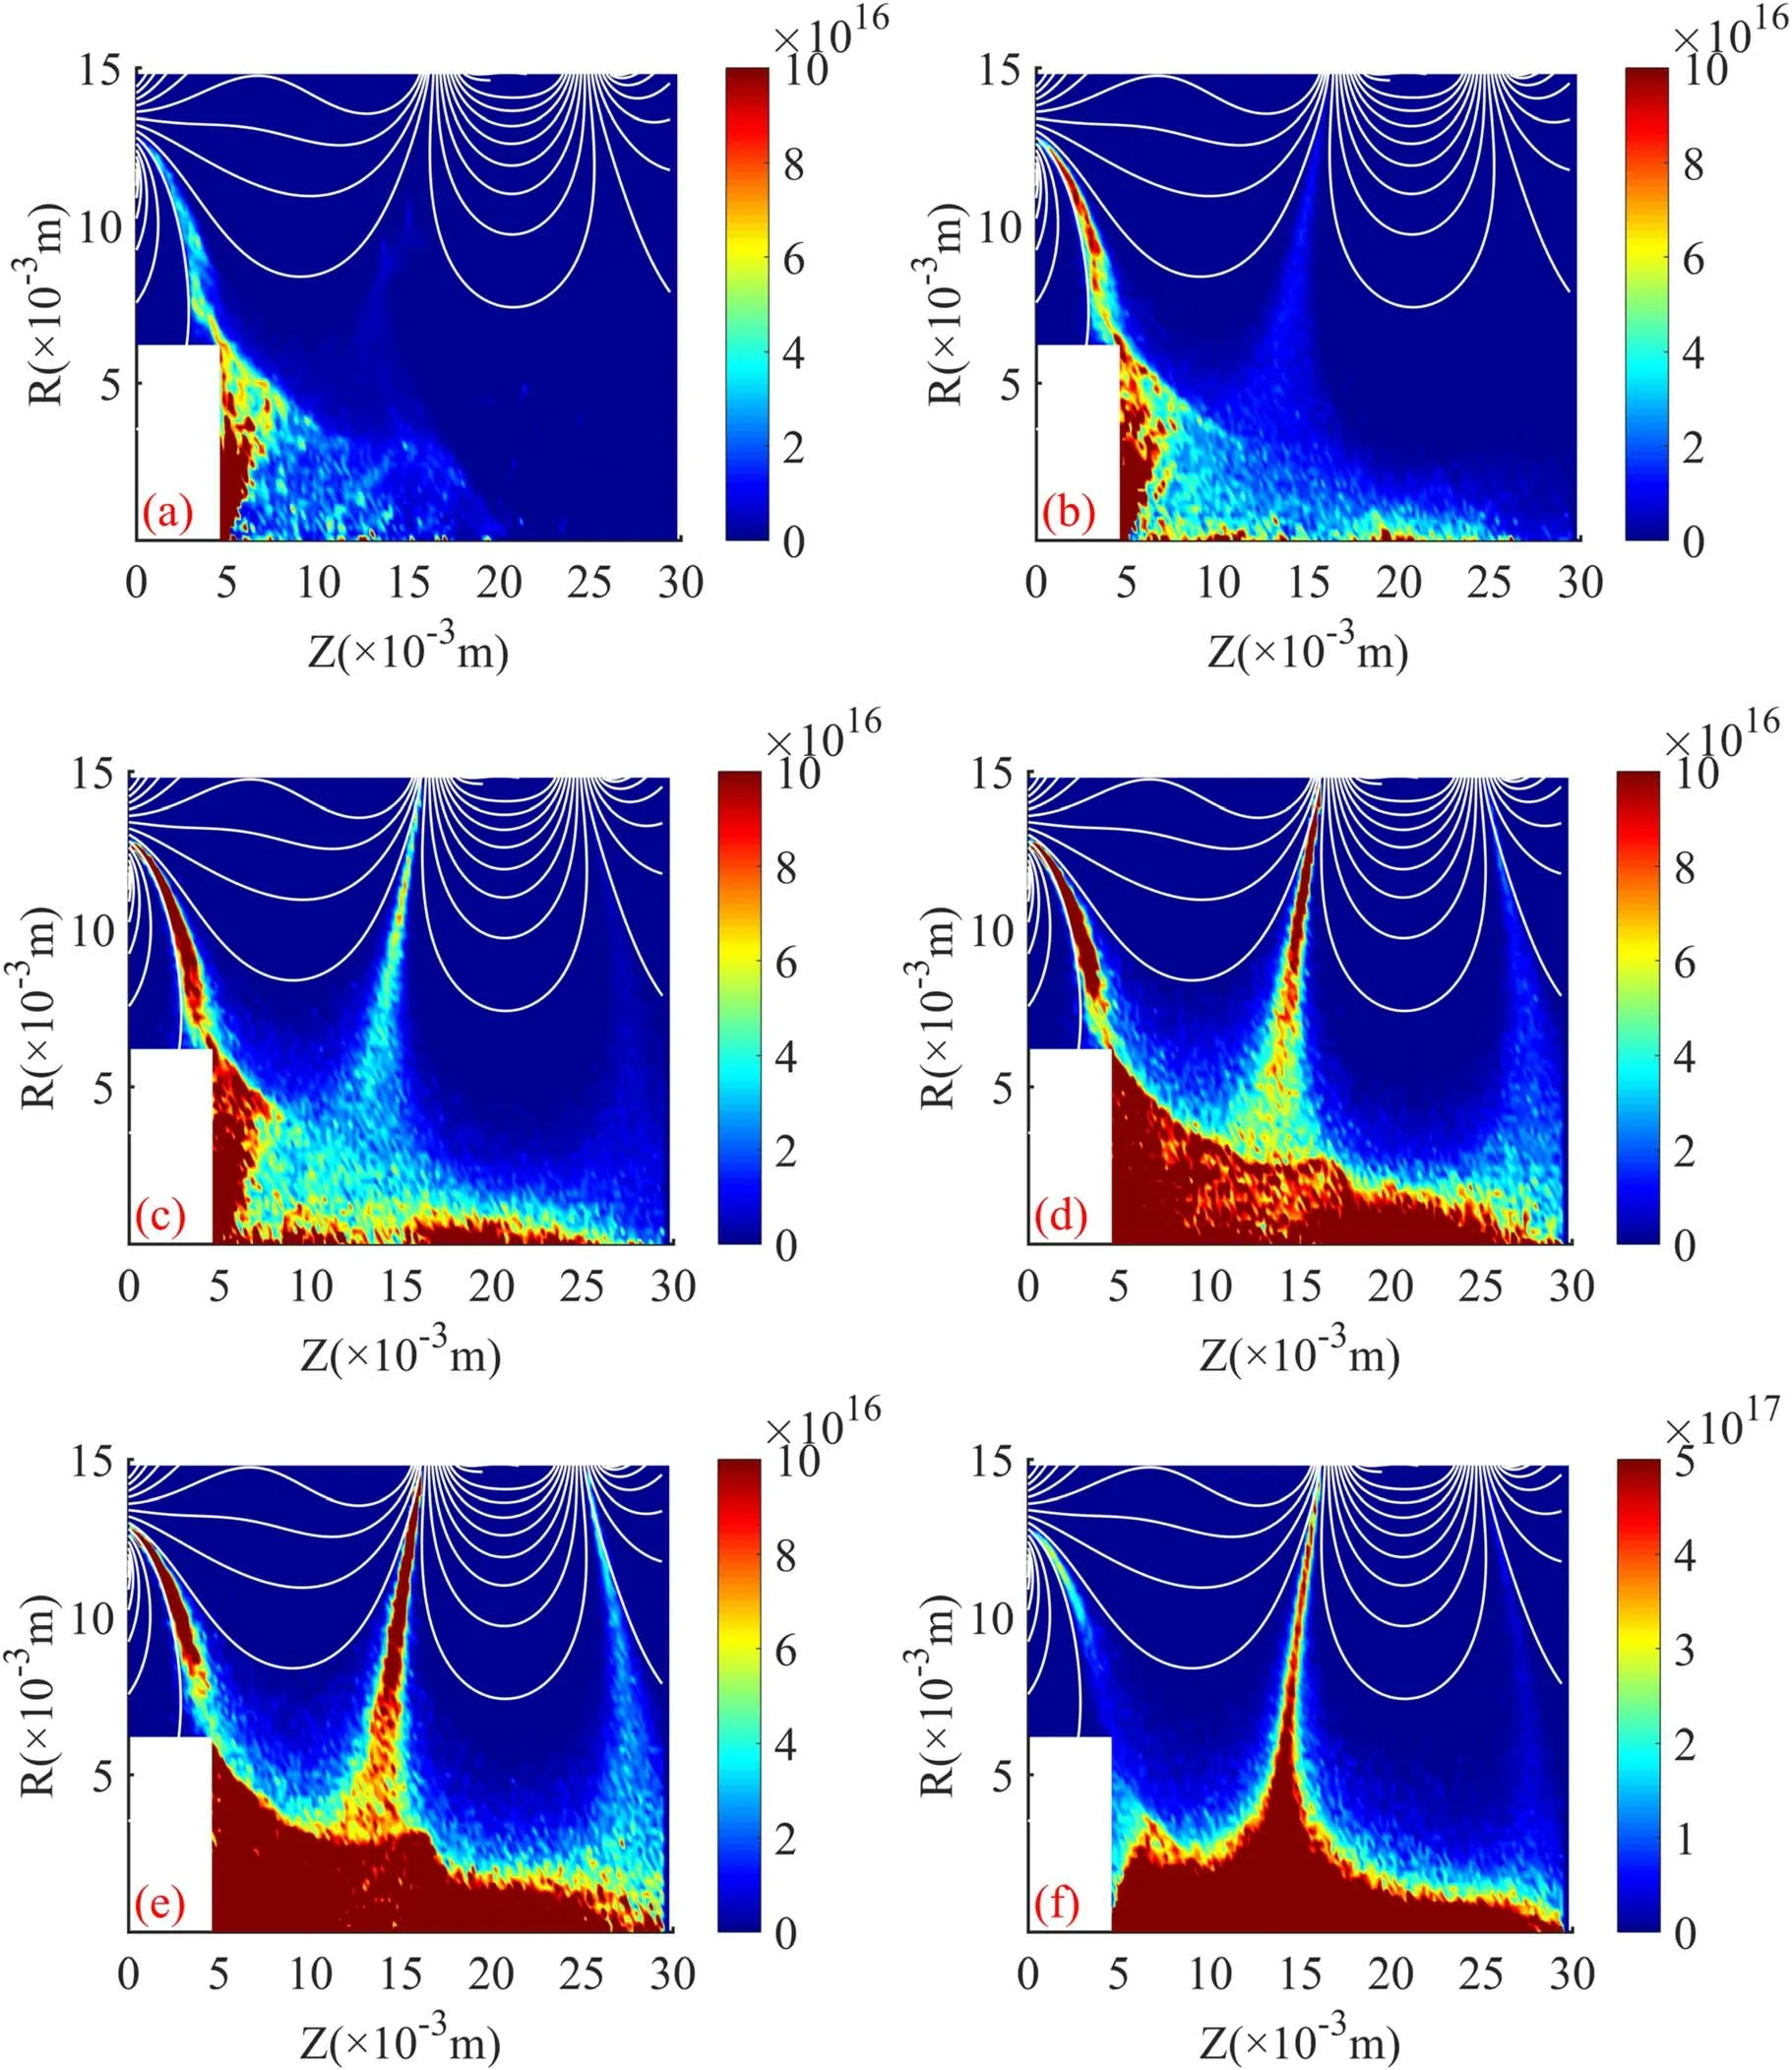
Figure 5.The electron density distribution at different stages of the startup process(m?3).(a)50 ns,(b)100 ns,(c)300 ns,(d)700 ns,(e)1 μs,(f)20 μs.
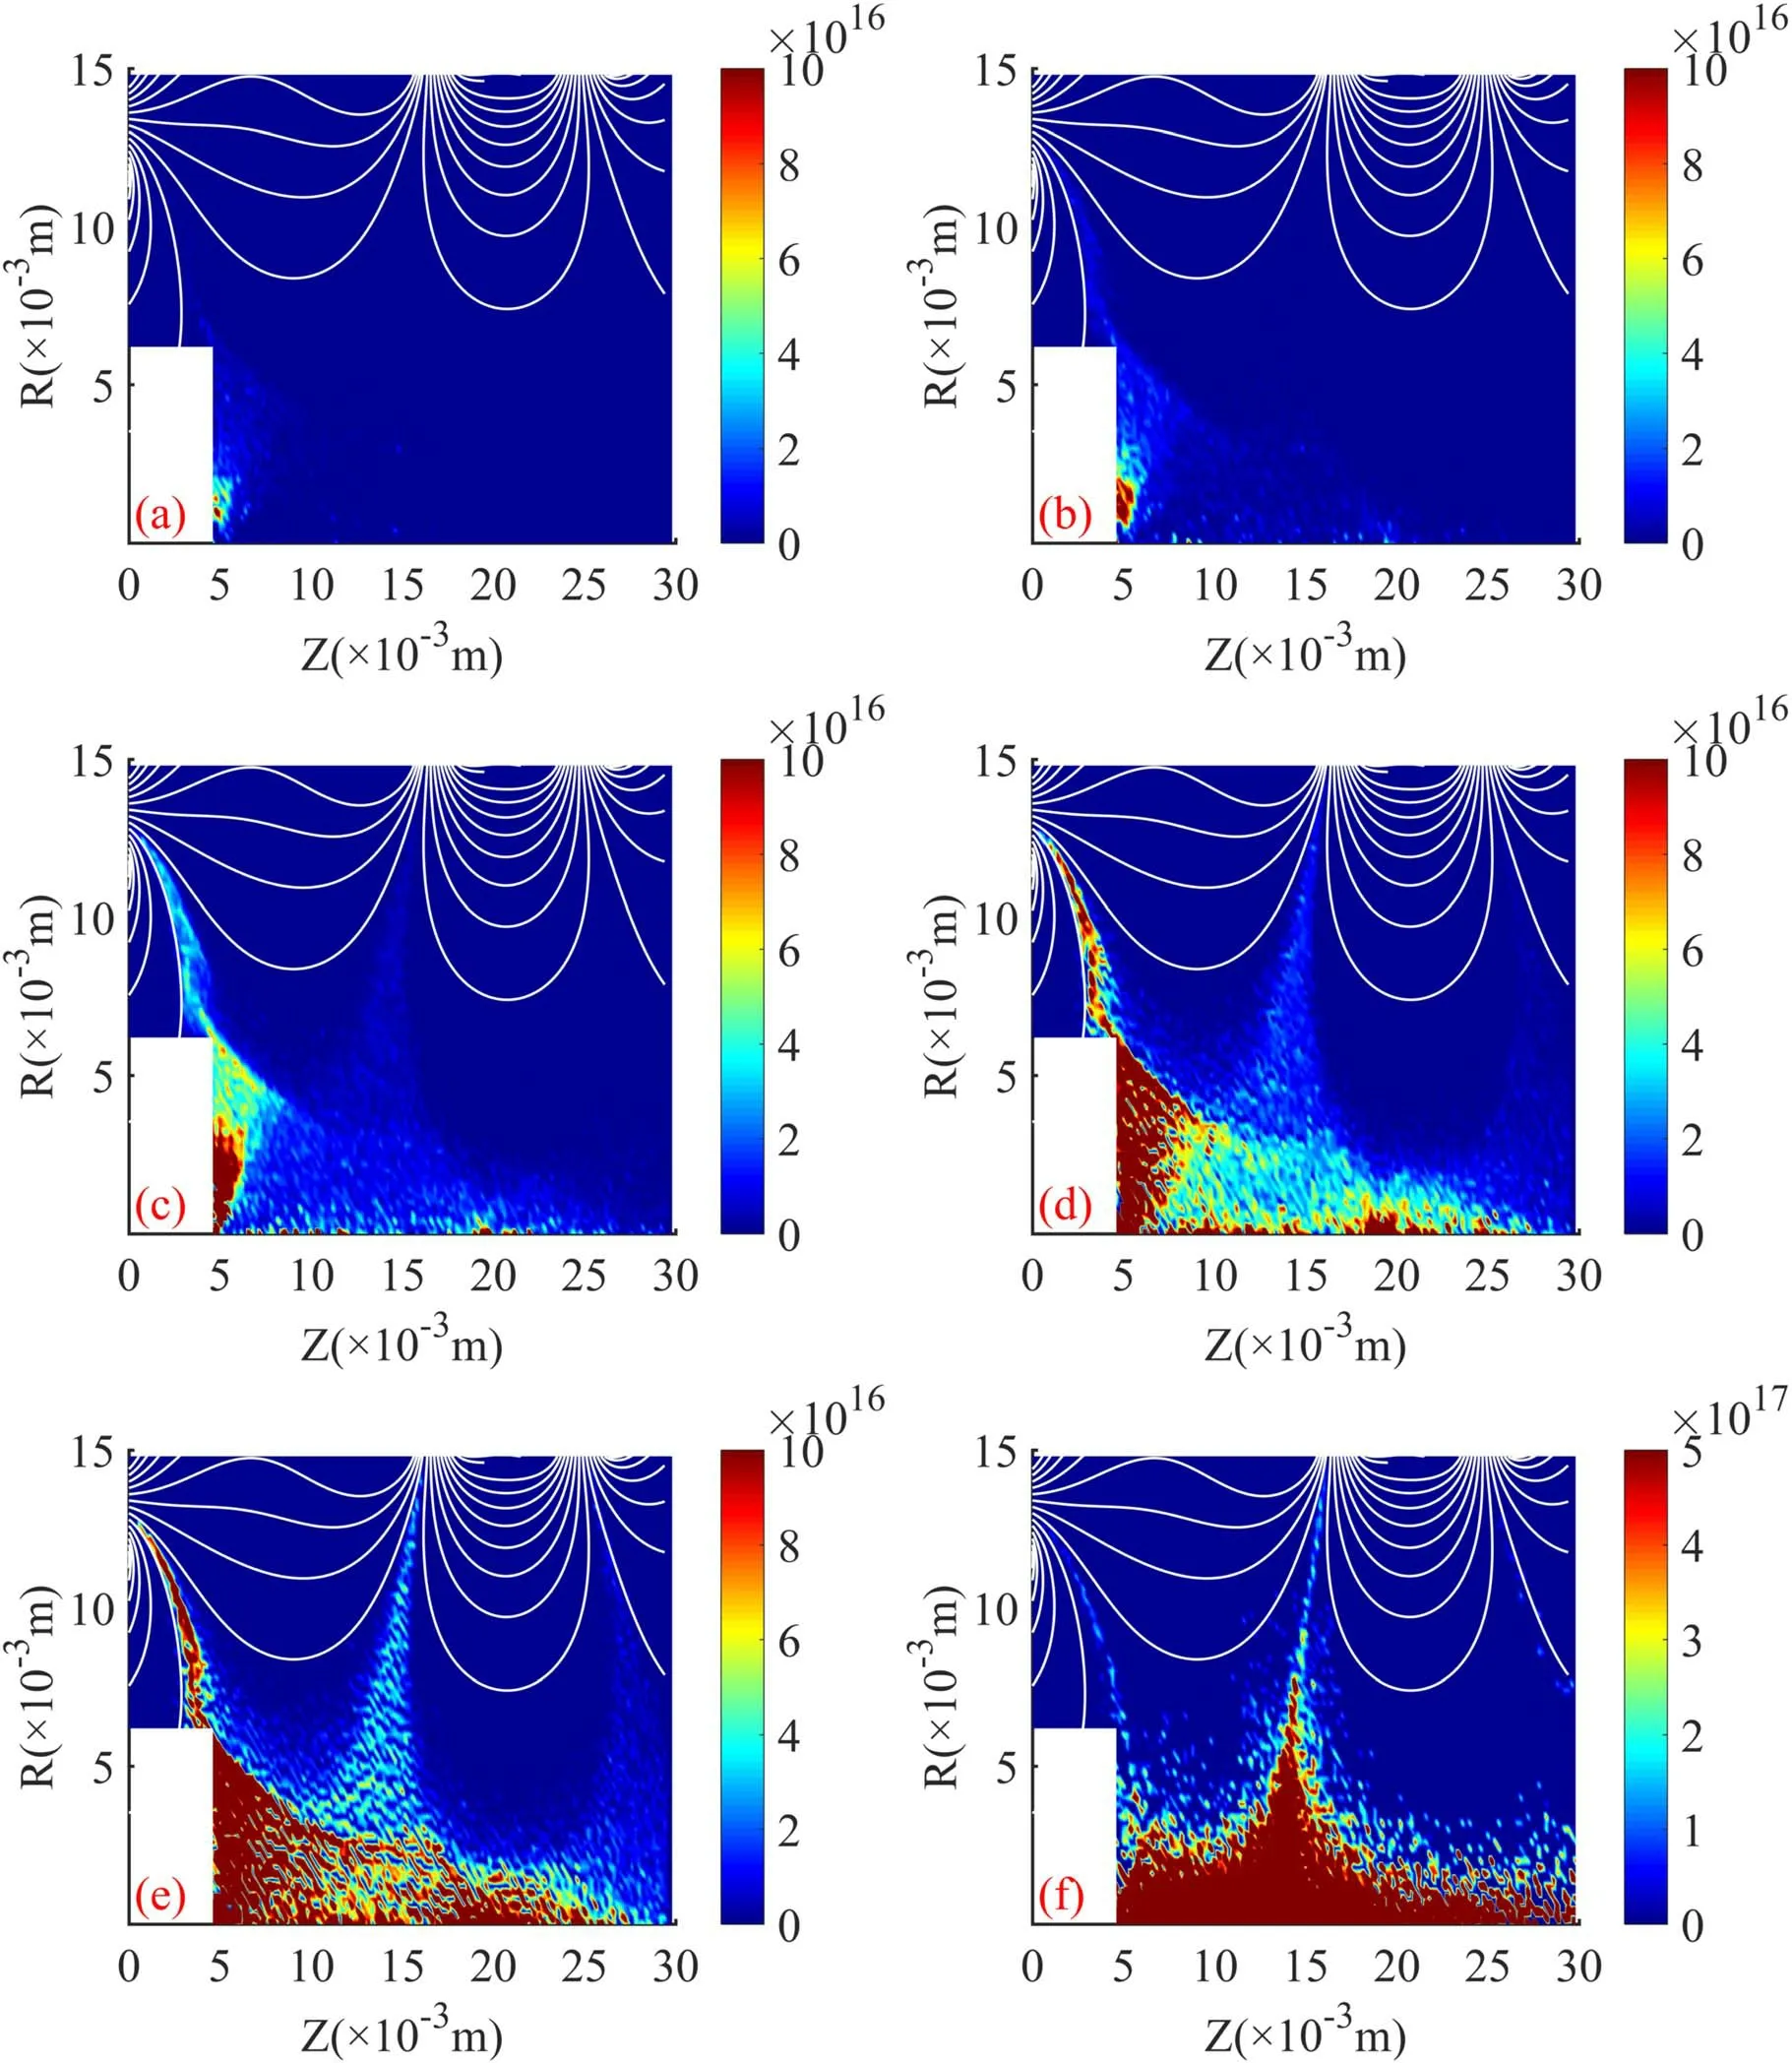
Figure 6.Ion density distribution at different stages of the startup process(m?3).(a)50 ns,(b)100 ns,(c)300 ns,(d)700 ns,(e)1 μs,and(f)20 μs.
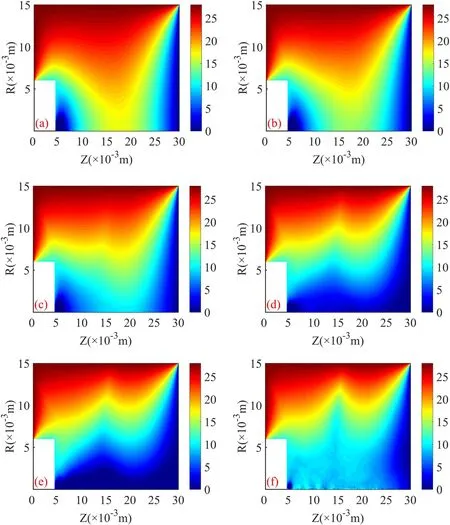
Figure 7.Electric potential distribution at different stages of the startup process(V).(a)50 ns,(b)100 ns,(c)300 ns,(d)700 ns,(e)1 μs,(f)20 μs.

Figure 8.Ionization collision frequency at different moments during the start-up process.(a)50 ns,(b)100 ns,(c)300 ns,(d)700 ns.
3.2.Characteristics of the discharge current at the beginning of the start-up process
To analyze the start-up process of the miniature ion thruster,we evaluated the currents received by the anode(the left and upper boundaries of the simulation domain),and referred to the current received by the left boundary as the backplate current,the current received by the upper boundary as the sidewall current,and the sum of the backplate current and the sidewall current as the discharge current.As shown in figure 4,the backplate first received the current,followed by the sidewall(after approximately 10 ns).At this initial stage,the discharge current was composed of the backplate and sidewall current,and the backplate current was greater than the sidewall current.As the startup process progressed,the backplate current stabilized first whereas the sidewall current progressively increased with time,exceeding the backplate current.Afterward,the sidewall current continues to increase,becoming much larger than the backplate current.At this stage,therefore,the current was dominated by the sidewall current.
3.3.Electron density and ion density distribution
According to the characteristics of the discharge current during the startup process,the startup process can be divided into three stages.In the initial stage(before 100 ns),the backplate current is significantly greater than the sidewall current.Afterward,in the second stage(development stage),the backplate current increases until it reaches stabilization,whereas the sidewall current progressively increases until it reaches the same value as the backplate current.In the last stage(stable phase),which occurs after approximately 700 ns,the sidewall current continues to increase until it stabilizes,and the discharge current is dominated by the sidewall current.
To analyze the start-up process of the miniature ion thruster,the results of the electron density in the discharge chamber were compared at different stages,as shown in figure 5.
In the initial stage of the start-up process,the diffusion of electrons near the bottom of the discharge chamber was noticeable.At 50 ns,as shown in figure 5(a),the electron density between the cathode and the bottom cusp reached 4×10¹⁶m?3,which is only lower than that of the cathode outlet.Furthermore,the discharge current is dominated by the backplate current,as shown in the discharge current curve.
As the start-up process progressed,the electron density near the axis of the discharge chamber gradually increased.At 100 ns,as shown in figure 5(b),the electron density near the bottom cusp reached 1017m?3,which is significantly higher than those at other positions.The electron density in the center of the discharge chamber increased to 4×10¹⁶m?3,and the electrons began to diffuse toward the middle cusp.
At 300 ns,as shown in figure 5(c),the electron density near the middle and bottom cusps increased to 4×10¹⁶m?3,and stabilized,respectively.The discharge current curve shows that the backplate current was stable and the sidewall current still increased.
At 700 ns,as shown in figure 5(d),the electron density near the center and the middle cusp of the discharge chamber greatly increased,becoming close to that of the near the bottom cusp.The electron density near the top cusp also increased.At this stage,the backplate current and the sidewall current were approximately equal,as shown in the discharge current curve.
At 1 μs,as shown in figure 5(e),the electron density in the center and the middle cusp of the discharge chamber continued to increase,and that near the top cusp also significantly increased.In this stage,the discharge current curve shows that the sidewall current exceeds the backplate current,becoming the dominant component of the discharge current.
At the end of the start-up process,as shown in figure 5(f),the electron density near the center of the discharge chamber and the middle cusp significantly increased.At 20 μs,the electron density of the discharge chamber tends to stabilize,and the electron density near the center and the middle cusp of the discharge chamber was much higher than that near the bottom and top cusps.In this step,the sidewall current accounted for approximately 80% of the discharge current,whereas the backplate current corresponded to much less than the ratio of the discharge current.The electron density from the center of the discharge chamber to the middle cusp was much higher than that near the bottom and top cusps,indicating that electrons were difficult to diffuse to the top cusp.
The trend of the ion density in the discharge chamber over time was similar to that of the electron density;however,this trend lagged behind the electrons,as shown in figure 6.At 50 ns,the ionization was only noticeable near the cathode exit.Afterward,the ionization zone has expanded toward the discharge chamber.Before 300 ns,the ionization zone successfully expanded to the bottom cusp,moving,thereafter,towards the center of the discharge chamber(mainly),and the middle and bottom cusps.At 700 ns,the ion density near the cathode exit and the bottom cusp was the highest,followed by that at the center of the discharge chamber.At 1 μs,the ion density at the center of the discharge chamber reached the same level as that at the cathode exit.The ion density further increased and the high ion density area expanded towards the middle cusp,following the distribution of the electron density.
3.4.Electric potential
To further understand the behavior of electrons in the discharge chamber,we compared the results of the electric potential distribution in the discharge chamber at different stages,as shown in figure 7.In the initial stage of the start-up process,electrons gather near the cathode outlet,as shown in figure 7(a).An electric potential lower than that at the cathode keeper was generated in the area corresponding toz=5–10 mm andr=0–5 mm,wherezandrare the axial and radial coordinates.The areas where the potential was lower than the cathode keeper potential(10 V)were named low-potential areas.The screen grid potential was significantly lower than the anode potential;therefore,a lowpotential area was also generated near the screen grid.The axis of the discharge chamber was far away from the sidewall;therefore,it was less affected by the anode potential.The lowpotential area generated by the screen grid near the axis could be extended toward the center of the discharge chamber by approximately 5 mm.As a result,the low-potential area near the screen grid can become an arc-shaped area protruding to the inside of the discharge chamber.The electric potential from the sidewall to the center of the discharge chamber decreased from 28 V to lower than 20 V,and the corresponding gradient pointed to the axis of the discharge chamber.The areas where the electric potential was between 10 and 20 V and higher than 20 V were named transition and highpotential areas.
As the start-up process progressed,electrons diffused into the discharge chamber,gradually decreasing the electric potential near the axis of the discharge chamber.As shown in figure 7(b),the low-potential area at 100 ns did not significantly change compared to that at 50 ns;however,this quantity dropped to below 15 V near the axis due to the diffusion of electrons at the center of the discharge chamber,and the transition area started to expand toward the backplate and the sidewall along the direction of the electric potential gradient.
The electron density in the center of the discharge chamber at 300 ns significantly increases compared to that in the initial stage of the start-up process.As shown in figure 7(c),the accumulation of electrons in the center of the discharge chamber allowed the low-potential area near the cathode and the screen grid to extend toward the center of the discharge chamber.The transition area continued to expand toward the backplate and sidewall.
As shown in figure 7(d),the electron density in the center of the discharge chamber significantly increased at 700 ns,and the electric potential was further reduced,moving the transition area far away from the axis of the discharge chamber.The low-potential areas near the cathode and the screen grid were connected.Compared to the initial stage,the transition area was greatly reduced,and the electric field strength greatly increased.
After the beginning of the stable stage,the potential distribution in the discharge chamber tended to be stable.At 1 μs,as shown in figure 7(e),no significant change was noticeable in the low-potential area and the high-potential area,indicating that diffusion of electrons was influenced by the magnetic field.The low-potential area and the main ionization zone mostly overlap;however,electrons were not accelerated in the radial direction in the area close to the screen grid due to the influence of the low-potential area near the screen grid.As a result,the ionization near this location was concentrated near the axis.Afterward,due to the further progress of ionization,the density of ions in the center of the discharge chamber significantly increased,and the electric potential rose to approximately 10 V,as shown in figure 7(f).
4.Analysis and discussion
In the steady state,the electron density,ion density and potential had some correlation.Plasma existed only in the center/right region,there were almost no charged particles in the upper/left region,and there was a low density of electrons at the junction of the two regions,but almost no ions.This was because the closer to the upper and left boundaries,the stronger the magnetic field.The primary electrons were emitted from the center/left boundary and mainly concentrated in the center/right region under the constraint of the magnetic field.Therefore,the closer to the upper and left boundaries,the lower the electron density.Only the electrons in the center/right region can generate the plasma,and at the junction of these two regions,it was difficult for the lowdensity electrons to generate ions by ionization.In this model,the potential was obtained by solving the Poisson equation.The center/right region was quasi-neutral due to the plasma,and the upper/left region had no charged particles,so the potential did not change significantly in these two regions.At the junction of the two regions,the electron density decreased rapidly as electrons spread to the upper and left boundaries,so the potential increased rapidly,resulting in the result that the potential is low in the center/right region and high in the upper/left region.
The formation process of the discharge current can be explained based on the electron density and electric potential distributions in the discharge chamber.In the initial stage of the start-up process,according to the results of the potential distribution shown in figures 7(a)and(b),the distance between the low-potential area in front of the cathode and middle cusp was approximately 16.55 mm and the average electric field strength was approximately 1691.8 V mm?1.Furthermore,the distance between the low-potential area and the bottom cusp was approximately 9.86 mm,and the average electric field strength was approximately 2839.8 V mm?1.The electric field strength between the low-potential area and the bottom cusp was,therefore,stronger.According to the results of electron density shown in figures 5(a)and(b),in the initial stage,the velocity of the electrons emitted by the cathode was redistributed after colliding with the neutral gas,greatly reducing the axial velocity.The diffusion of electrons in the axial direction was suppressed,allowing them to concentrate near the cathode exit.The electrons diffused to the backplate faster due to the acceleration of the electric field.The ionization collision frequency,shown in figures 8(a)and(b),between the cathode and the backplate,was the highest;therefore,in the initial stage,the backplate received electrons earlier than the sidewall.As a result,the backplate current appeared before and was greater than the sidewall current.
According to the results of the electric potential distribution shown in figure 7(c),the low-potential area in front of the cathode expanded,and the electric field strength between the low-potential area and the middle cusp increased in the early stage of the development stage.According to the results of electron density shown in figure 5(c),the main ionization zone was generated at this stage and the electron density near the center of the discharge chamber and the middle cusp increased,however,it was significantly smaller than that near the bottom cusp.Based on the frequency of ionization collisions shown in figure 8(c),the ionization collision frequency between the cathode and the sidewall started to increase,however,it was still lower than that between the cathode and the backplate.As a result,the sidewall current began to increase at this stage;however,it was still lower than the backplate current.
In the later stages of the development stage,according to the results of the potential distribution shown in figure 7(d),the low-potential area was significantly enlarged and the distance between this area and the bottom cusp was equal to that between this area and the middle cusp.Furthermore,the electric field strength between the low-potential area and the sidewall was approximately equal to that between this area and the backplate.According to the result of the electron density shown in figure 5(d),the electron density in the ionization zone and near the middle cusp greatly increased.As shown in figure 8(d),the frequency of ionization collisions between the cathode and the sidewall was similar to that between the cathode and the backplate;therefore,the backplate and sidewall currents were roughly equal at this stage.
In the stable stage,according to the results of the electric potential distribution shown in figures 7(e)and(f),the ionization zone further expanded.The distance between the low-potential area and the bottom cusp was approximately 11.63 mm,and the average electric field strength was approximately 2407.6 V mm?1.Moreover,the distance between the low-potential area and the middle cusp and the average electric field strength were approximately 8.25 mm and 3393.9 V mm?1,respectively.The electric field strength between the low-potential area and the middle cusp was,therefore,stronger.According to the electron density distributions shown in figures 5(e)and(f),the electron density near the middle cusp was significantly higher than that near the bottom cusp;therefore,the electrons diffused faster to the sidewall due to the acceleration of the electric field,indicating that the sidewall current was greater than the backplate current.
Based on the previous analysis,the discharge current and distribution characteristics change during the startup of the miniature ion thruster,following the combined effect caused by the electron density distribution and electric potential distribution in the discharge chamber.
5.Conclusion
A PIC-MCC model of the discharge chamber was established to investigate the behavior of a miniature ion thruster during the start-up process.The physical parameters of the plasma inside the discharge chamber have been obtained by PICMCC numerical simulations.The results showed that the start-up process of the miniature ion thruster considering a ring-cusp magnetic field can be divided into an initial,a development,and a stable stage.In the initial stage,the discharge mainly occurs between the cathode and the back plate and the sidewall current is smaller than the backplate current,which is generated before the sidewall current.Due to the combined effect of electron density distribution and potential distribution,the sidewall current increases faster than the backplate current,therefore becoming significantly higher than the backplate current at the stable stage,which is dominated by the discharge between the cathode and the sidewall.
Only a single working condition and magnetic field configuration has been currently considered to simulate the start-up process.In the future,the influence of parameters such as cathode position,magnetic field configuration,and anode voltage during the start-up process will be studied,allowing a better understanding of the mechanism of the startup process of the miniature ion thruster.
 Plasma Science and Technology2022年7期
- Plasma Science and Technology的其它文章
- Special issue on selected papers from CEPC 2021
- Highly efficient γ-ray generation by 10 PWclass lasers irradiating heavy-ion plasmas
- Surface properties of Al-doped ZnO thin film before and after CF4/Ar plasma etching
- Photoexcited carrier dynamics in a GaAs photoconductive switch under nJ excitation
- Molecular mechanism study of Astragalus adsurgens Pall synergistically induced by plasma and plasma-activated water
- Microwave method based on curve fitting method for high-precision collision frequency diagnosis