
Simulation assessment and prediction of future temperatures in Northwest China from BCC-CSM Model
2022-06-21 12:41:14YuFeiPeiMinHongSongXiaoLingMaTongWenWuShaoBoZhang
YuFei Pei ,MinHong Song* ,XiaoLing Ma ,TongWen Wu ,ShaoBo Zhang
1.School of Atmospheric Science,Chengdu University of Information Technology,Chengdu,Sichuan 610225,China 2.National Climate Center,China Meteorological Administration,Beijing 100081,China
ABSTRACT Three deterministic prediction evaluation methods,including the standard deviation,root-mean-square error,and time cor‐relation coefficient,and three extreme temperature indices were used to assess the performance of the BCC_CSM2_MR model from CMIP6 in simulating the climate of Northwest China based on monthly grid air temperature data from ground stations.The model performance was evaluated using the daily mean temperature,daily minimum temperature,and daily maximum temperature from 1961 to 2014 and future temperature changes in Northwest China under different radiative forcing scenarios.The BCC_CSM2_MR model reproduces well the seasonal changes,spatial distribution,and other char‐acteristics of the daily mean temperature in Northwest China,especially in the Tarim Basin,the Kunlun and Qilian moun‐tains,and Shaanxi.There is still some deviation in the simulation of the daily mean temperature in the high terrains of the Tianshan,Kunlun,and Altai mountains.The model better simulates the daily minimum temperature than the daily maxi‐mum temperature.The simulation error is smallest in summer,followed by autumn and winter,and largest in spring.In terms of extreme temperature indices,the deviations are smaller for cold nights,warm nights,and the annual maximum daily minimum temperatures.Furthermore,the model can capture the increase in warm events and the decrease in cold events.Under different forcing scenarios,there is a general warming trend in Northwest China,with the greatest warming in Xinjiang.
Keywords:Northwest China;BCC_CSM2_MR;extreme temperature index
1 Introduction
Climate system models can help us understand the evolution of the Earth's climate in the current context of global warming and extreme weather events.Cli‐mate system models can be used to describe the inter‐action of the five circles of the climate system and their impact on climate change and are applied to study both the characteristics and behavior of the cur‐rent climate and to predict future changes (Wanget al.,2004;Huanget al.,2014;Zhouet al.,2014).Ear‐ly climate models are physical models that only con‐sider changes in energy and water flux between the at‐mosphere,oceans,land surface,and sea ice.They have evolved into geoclimatic system models that al‐so account for biogeochemical and human processes(such as the carbon and nitrogen cycles) (Penget al.,2004;Yanget al.,2019) and models that also interact with the solid Earth and space weather (Wanget al.,2008).
The National Climate Center of China developed the BCC_CSM1.1 model with different resolutions to participate in the experimental Fifth International Coupled Model Comparison Program (CMIP5) pro‐gram.Simulation results from the BCC_CSM1.1 mod‐el have been used by researchers worldwide (Xinet al.,2012;Wuet al.,2014;Jianget al.,2015).The Na‐tional Climate Center has continued developing new versions of the BCC-CSM model with improvements in horizontal and vertical resolutions,the parameter‐ization schemes for the atmospheric model,the physi‐cal processes in the land surface model,and the ocean and sea ice component model.Several versions of the second-generation climate system model (BCC_CSM2) (Wuet al.,2018) have been established,in‐cluding the Beijing Climate Center Climate System Model version 2 with a moderate resolution (BCC_CSM2_MR).The BCC_CSM2_MR is a new-genera‐tion climate system prediction model and participated in the CMIP6 Multi-Model Comparison subprogram.This model has had a significant positive impact on future climate predictions(Jianget al.,2020).
Northwest China(37°N?50°N,73°E?123°E)com‐prises five inland provinces,including Xinjiang,Qing‐hai,Gansu,Ningxia,and Shaanxi.The frequency and intensity of extreme weather and climate events in Northwest China have increased in recent years,and the water resource system (mainly meltwater from snow and ice) is fragile.Northwest China has seen in‐creased precipitation and melting snow and ice,rising water levels in lakes,and decreasing days with dust storms (Shiet al.,2003).Recent changes in the cli‐mate have caused ecological degradation and frequent natural disasters in this region (Shiet al.,2003),and the number of extreme low-temperature events has in‐creased significantly (Shanget al.,2018).The fre‐quent natural disasters have affected agriculture,ecol‐ogy,and people's livelihoods (Zhanget al.,2008).As the average temperature in Northwest China is pre‐dicted to continue to rise over the next ten years (Xueet al.,2012;Fenget al.,2019),it is crucial to model the distribution and trends of changes in temperature in this region.
Due to the complex topography in Northwest Chi‐an,the simulation effect of the numerical model is poor.It is conducive to conducting an in-depth analy‐sis of the simulation errors on the temperature in Northwest China to improve the parameterization pro‐cess of the model and the setting of relevant parame‐ters and provide a reference for improving the simula‐tion.By evaluating the impact of climate system mod‐els on temperature and precipitation simulations,fu‐ture climate conditions in Northwest China can be bet‐ter predicted to help reduce climate disasters and loss‐es caused by extreme weather events,improve our un‐derstanding of climate change patterns in the region,and ensure social and agricultural development.Previ‐ous studies of Northwest China have focused on trends in multi-year observations and climate ex‐tremes,and the BCC_CSM model has not been evalu‐ated separately for the Northwest region in the past.Hence,it is important to assess the complexity of the model simulations for the Northwest region.This pa‐per evaluates the daily mean temperature,daily maxi‐mum temperature,daily minimum temperature,and multiple extreme temperature indices separately to give a more comprehensive assessment of the perfor‐mance of the BCC_CSM2_MR model in simulating temperatures in the arid and semi-arid regions of Northwest China.Additionally,this assessment ex‐plores the temperature trends and spatial variations for the next century under four different types of radi‐ative forcing.
2 Materials and methods
2.1 General information
The BCC_CSM2_MR model comprises four mod‐el components,including the BCC-AGCM3-MR at‐mospheric model developed by the National Climate Center,the BCC-AVIM2 land surface model,the MOM5-L50 ocean model developed by the US Fluid Dynamics Laboratory,and the Sea Ice Simulator sea ice model.The vertical stratification of the atmospher‐ic model has been increased to 46 layers,with the top layer at 1.459 hPa,to improve the simulation of the stratosphere.The BCC_CSM2_MR model has been used in eight comparative sub-programs of the CMIP6 program,of which the DECK test,the Histori‐cal and seven model comparison sub-programs have been completed.Evaluation of the Historical experi‐ment showed that the model's simulation of the evolu‐tion of global temperatures over the past 100 years and the climatological distribution of the annual mean precipitation in China are significantly improved over the earlier BCC-CSM1.1 m model (Xinet al.,2019;Jianget al.,2020).However,simulations of the atmo‐spheric wind and temperature fields still need to be enhanced,and there is a significant bias in the simula‐tions of Antarctic sea ice(Wuet al.,2018).
The model data used in this study are the(1.125°×1.125°) monthly average data from the BCC_CSM2_MR model provided by the World Climate Research Program participating in CMIP6(the Historical exper‐iment).In December 2014,four radiative forcings,i.e.,RCP2.4,RCP4.5,RCP6.0,and RCP8.5,were select‐ed for the simulation period of January 2015 to De‐cember 2100.
The observations used are the monthly (0.5°×0.5°)grid point dataset (V2.0) for surface air temperature retrieved from the latest database compiled by the Na‐tional Meteorological Information Center (NMIC)Special Fundamental Data Project using the Thin Plate Sample System of ANUSPLIN software.Note that the data were collected from China's 2,400 nation‐al meteorological surface stations.The spatially inter‐polated data from the NMIC were used to generate monthly air temperature on a grid with a horizontal resolution of(0.5°×0.5°)from 1961 to the latest avail‐able ground level in China.The data consists of two sources:(1) monthly temperature data from 1961 to the latest national level stations (basic,base,and gen‐eral)collected and collated by the NMIC for basic da‐ta;and (2) a (0.5°×0.5°) digital elevation model for China's landmass generated by resampling the GTO‐PO30 data (0.05°×0.05°).The observation period was chosen from January 1961 to December 2014.
Due to the difference in resolution between the model simulation data and the measured data,the 1.125°×1.125° model data were interpolated on a grid with the same resolution (i.e.,0.5°×0.5°) as the mea‐sured data for ease of comparison.
2.2 Research methods
The difference fields were plotted by calculating the root-mean-square error (RMSE) and time correla‐tion coefficient of the measured and model data and used to compare the seasonal variation and spatial dis‐tribution of these data in Northwest China.The RMSE was calculated using the following formula:
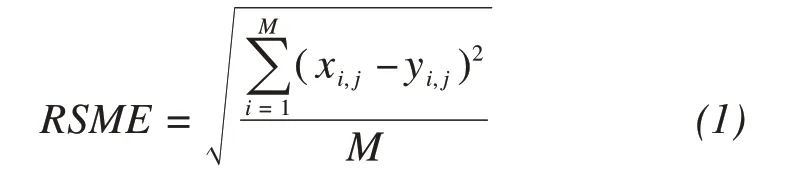
And the time correlation coefficient was calculat‐ed using the following formula:
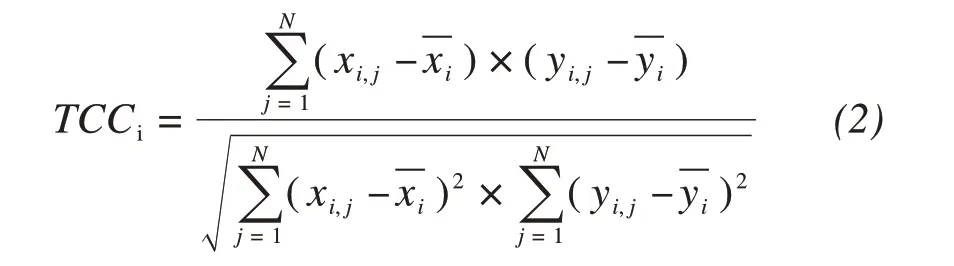
The 12 extreme climate indices defined by the Ex‐pert Team on Climate Change Detection and Indices(IPCC,2013) were adopted to reflect the changes in extreme temperatures,including frost days,ice days,summer days,tropical nights,cold nights,cold days,warm nights,and warm days,the minimum daily minimum temperature,the minimum daily maximum temperature,the maximum daily minimum tempera‐ture,and the maximum daily maximum temperature(Table 1).
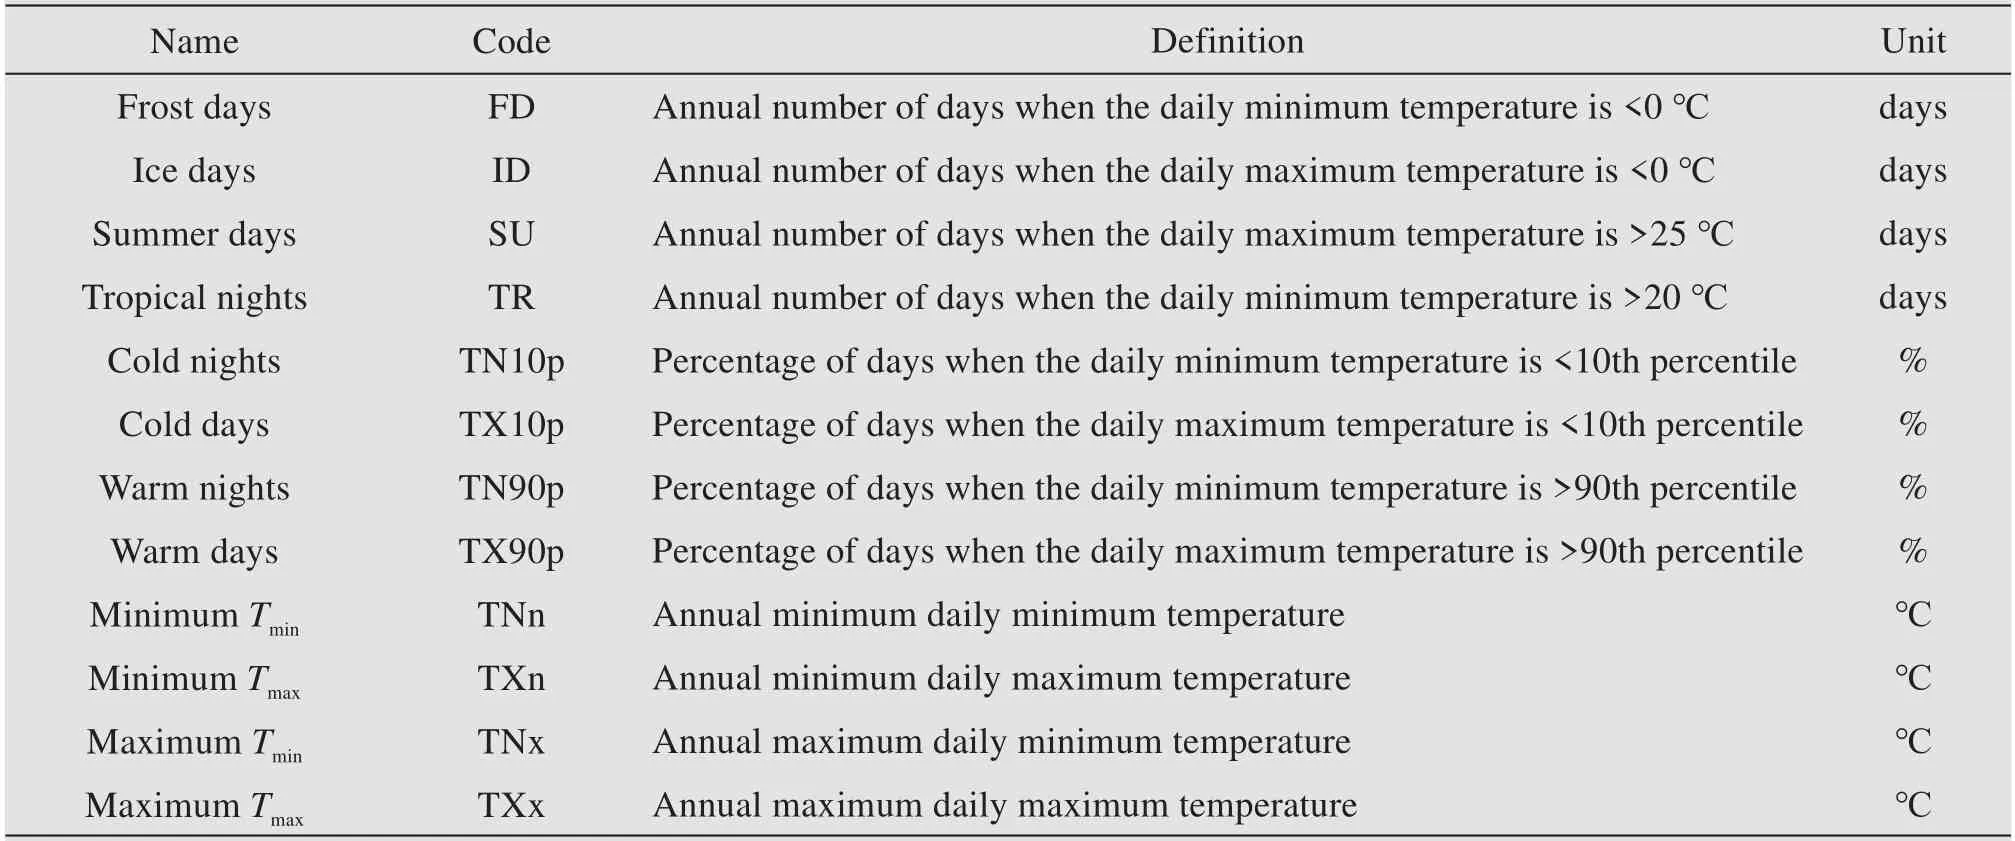
Table 1 Definition of the 12 extreme temperature indices
3 Results
3.1 Comparative analysis of model and measured data
Figure 1 shows the spatial distribution of the mea‐sured and simulated mean daily temperature,maxi‐mum daily temperature,and minimum daily tempera‐ture and their differences for the multi-year average of 1961?2014 in Northwest China.Figure 1 shows that the regions with daily mean temperatures>0°C in the observed data are concentrated in the Tarim and Jung‐gar basins,Gansu,Ningxia,and Shaanxi,whereas the regions with annual mean temperatures <0 °C are lo‐cated in the Altai,Tianshan,Kunlun,and Qilian mountains and southern Qinghai.The BCC_CSM2_MR model simulates the spatial variation of surface temperatures well,including the topography of the ba‐sins along the mountains and the characteristics of high desert temperatures but with low values.The low-temperature zone in the Tianshan Mountains and the high-temperature zone in the Tarim Basin of Qing‐hai are not represented.Figure 1c shows the differenc‐es between the simulated and observed daily mean temperature values for Northwest China.A small num‐ber of areas have errors>10°C,with the larger differ‐ences concentrated in the Tianshan and Qilian moun‐tains.The underestimated areas with an error >10 °C are mostly located in the western Kunlun Mountains and the Qaidam Basin(Wanget al.,2013).
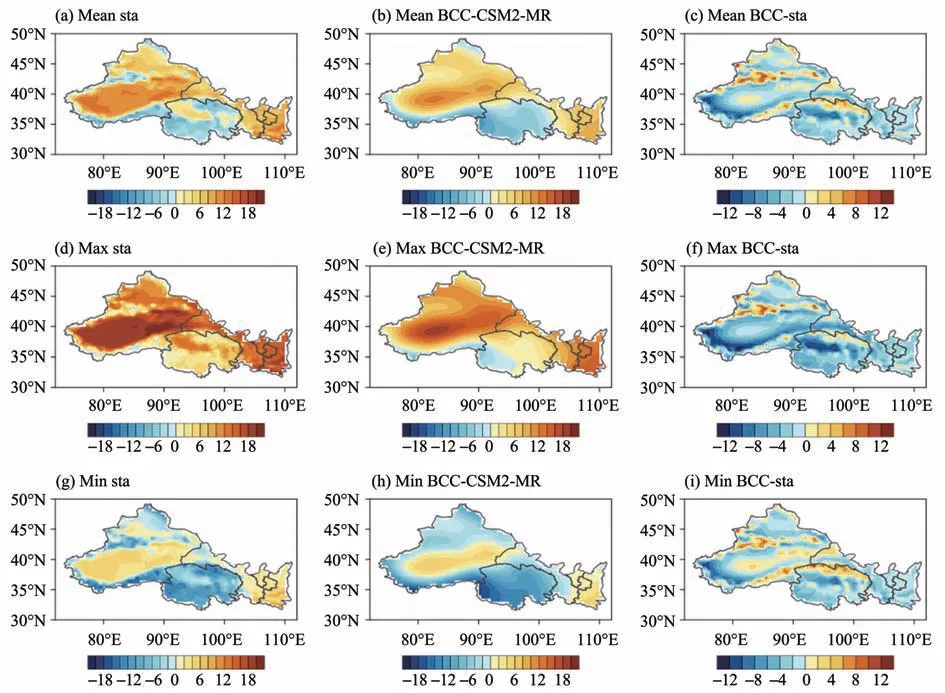
Figure 1 Spatial distribution in the measured values(left-hand panels)and pattern values(middle panels)of the(a?c)daily mean temperature,(d?f)daily maximum temperature,and(g?i)daily minimum temperature and their differences(right-hand panels)for Northwest China from 1961 to 2014(units:°C)
The spatial distribution of the daily maximum and minimum temperatures is similar to that of the daily mean temperature.Still,the model simulates a lower daily maximum temperature.The underestimation is more pronounced in the Kunlun Mountains and Qaid‐am Basin,and the overestimation is more pro‐nounced in the Tarim Basin and the eastern part of the Kunlun Mountains.Most of the model simulation errors for the three temperatures are within ±6 °C,with errors >6 °C only in the Tianshan,Kunlun,and Qilian mountains and the Qaidam Basin.
The RMSEs were calculated to compare the dis‐persion between the model and measured data.The spatial distribution of the RMSE between the mea‐sured and model data in Northwest China from 1961 to 2014 (Figure 2) shows that most of the RMSE for the three temperatures are within 8°C.The high RMSE values of the daily mean temperature(Figure 2a)mainly occur in the western Kunlun,Tian‐shan,and Qilian mountains and the Qaidam Basin,whereas the low values (e.g.,<1 °C) take place in the Junggar and Tarim basins,central and eastern Xinji‐ang,and northern Shaanxi.The daily maximum tem‐perature (Figure 2b) is highest in Northwest China.The daily maximum temperature (Figure 2b) increas‐es where the RMSE exceeds 8 °C relative to the daily mean temperature,with further increasing in the RMSE in the Kunlun Mountains and the Qaidam Ba‐sin and decreasing in the areas with low RMSE.The results indicate that the overall model simulation of the highest temperature in Northwest China is biased.The minimum daily temperature (Figure 2c) has the lowest RMSE among the three maps,with only a few areas where the RMSE exceeds 8 °C.This shows that the simulation is relatively good for the minimum temperature.
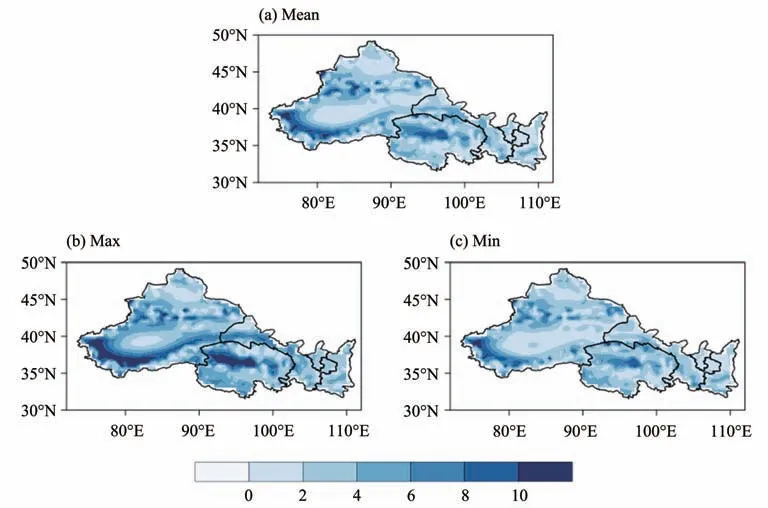
Figure 2 Spatial distribution of the RMSE for the measured and modeled data for(a)daily mean temperature,(b)daily maximum temperature,and(c)daily minimum temperature in Northwest China from 1961 to 2014(units:°C)
The correlation coefficients between the mea‐sured data and the model were calculated to further assess the model performance.Figure 3 shows the spatial distribution of the time correlation coeffi‐cients for the daily mean temperature,maximum temperature,and minimum temperature in North‐west China,with the areas passing the 95% confi‐dence level test indicated by dots.The correlation co‐efficients for the daily mean temperature (Figure 3a)are greater than 0,and exceed 0.2 in most areas,indi‐cating that the model data are positively correlated with the measured.The daily maximum temperature(Figure 3b) has smaller correlation coefficients rela‐tive to the mean temperature,and the area that pass‐es the 95%confidence level test is reduced,with neg‐ative correlations in southwestern Xinjiang,southern Qinghai,and southern Shaanxi.The daily minimum temperature (Figure 3c) has the highest correlation coefficient in northern Xinjiang and negative correla‐tions in the western Kunlun Mountains and south‐western Shaanxi.No correlation coefficient reaches 0.6 among the three temperatures,indicating that the correlation between the model data and the measured data is limited.
Figure 4 shows the changing characteristics of the four seasons and the spatial distribution of the multiyear mean temperature in Northwest China.Among the study areas,the Tarim Basin and southern Shaanxi have high multi-year mean temperatures in all four seasons (Figure 4a),whereas the Kunlun and Qilian mountains and southern Qinghai have low multi-year mean temperatures.The Turpan and Junggar basins are located in the center of the high multi-year mean temperature region in summer,whereas the Tarim Ba‐sin is not characterized by high temperatures in win‐ter.The model simulates the spatial distribution of temperatures and the centers of high and low tempera‐tures in all four seasons well,but the simulated values are still systematically lower,with the high-tempera‐ture centers too low and the lowest temperatures along the edge of the Qinghai?Tibetan high-pressure area well below the observed temperatures.The great‐est differences are found in the western section of the Kunlun Mountains,where the model-simulated tem‐peratures can be more than 8 °C lower than the ob‐served ones,and in the Tianshan and Qilian moun‐tains,where the overestimates reach up to 8 °C.The model can simulate the seasonal variations in tempera‐ture and the spatial distribution of the high-and lowtemperature centers,in addition to temperature varia‐tions due to terrain changes.But the high-temperature areas in the Qaidam Basin are not simulated,and there are systematic underestimations with deviations within ±6 °C and overestimations in the Altai and Tianshan Mountains and the eastern section of the Kunlun and Qilian mountains.
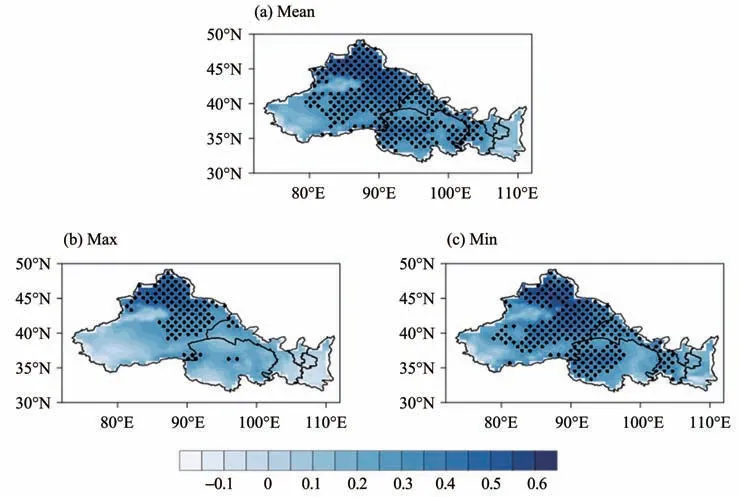
Figure 3 Spatial distribution of correlation coefficients between the measured and modeled data for the(a)daily mean temperature,(b)daily maximum temperature,and(c)daily minimum temperature in Northwest China from 1961 to 2014.Note that the points indicate the areas that pass the 95%confidence test
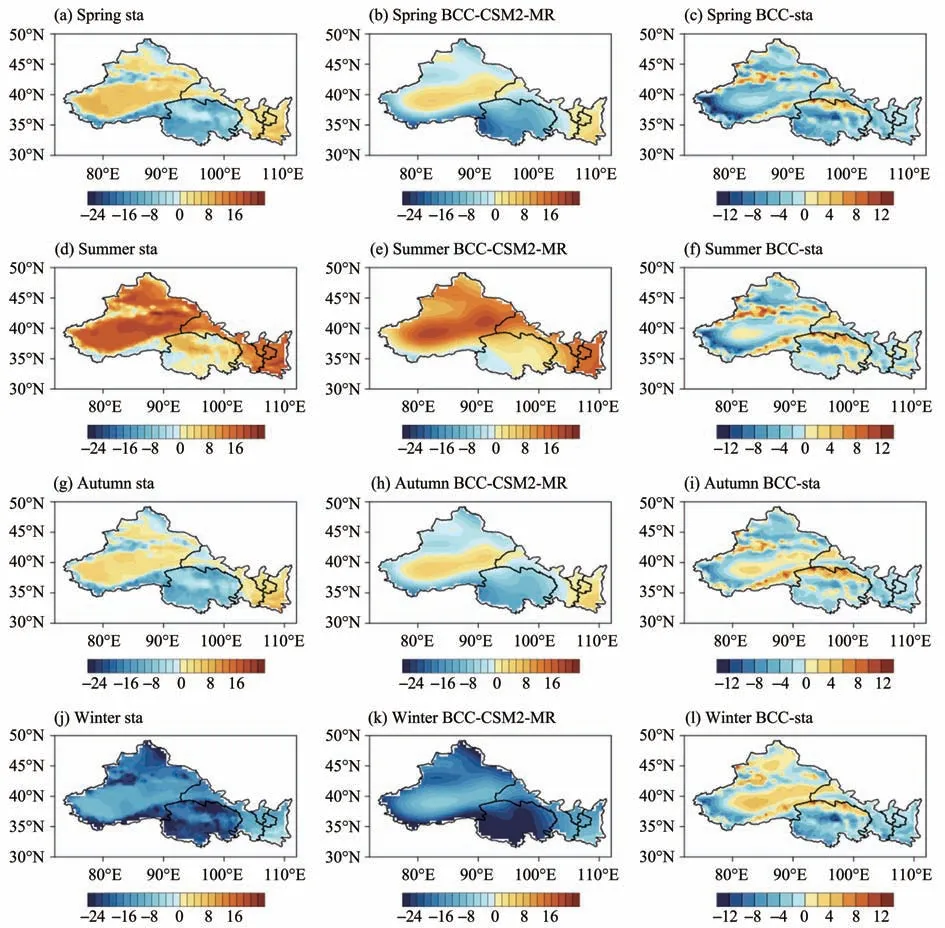
Figure 4 Spatial distribution of measured(left-hand panels)and modeled(center panels)multi-year mean temperature and the difference between them(right-hand panels)for the four seasons in Northwest China from 1961 to 2014(units:°C)
The spatial distribution of the RMSE for the four seasons was also calculated but not shown due to page limitations.Spatially significant deviations from the norm are evident in the Tianshan and Kunlun mountains and the Tarim Basin.The best simulation performance is for the summer months,with the smallest deviation (<5 °C) of the modelled values from the observed ones.In contrast,the worst simulation per‐formance is for the spring months,with the highest range of high values greater than 10 °C.The overall RMSE in autumn and winter is within 8 °C of the ob‐served values.
The spatial distribution of the time correlation co‐efficients for the four seasons was obtained,but the re‐sults are not shown due to page limitations.It shows that the model simulation performance is poorest in spring,with virtually no area passing the confidence test and most areas showing a negative correlation.The simulation performance was best in summer,with most regions passing the confidence test and positive correlations between the model and measured values.However,few areas had correlation coefficients equal to or greater than 0.6,and the correlation coefficients for autumn and winter were mostly between 0 and 0.4.The correlation between the four seasons simulat‐ed by the model is relatively poor,and there is still room for improvement.
Among the model simulation for provinces in Northwest China,Xinjiang is relatively poor due to the influence of the complex mountain ranges and ba‐sin topography,with the model simulations generating more obvious high and low deviations.Qinghai also exhibits poor performance,with pronounced high and low deviations due to the influence of the Qaidam Ba‐sin and Aljinshan.The deviations in Gansu,Ningxia,and Shaanxi are smaller.
The simulated topography by the BCC-CSM2 model is relatively better for flat terrain with minor deviations.However,it shows some degree of overes‐timation for mountainous terrains,such as the Kunlun Mountains,the Alpine Mountains,the Qilian Moun‐tains,and the Tianshan Mountains underestimation.For basin topography,such as the Tarim Basin,Tur‐pan Basin,and Qaidam Basin,more significant over‐estimation and underestimation also occur.For tall mountainous terrain and low elevation basins,the model cannot fully simulate the steep topographic variations of the mountains because of the spatial res‐olution.In addition,larger errors can accumulate when modelling the mountains and basins than in the flat terrain due to the discrepancies between the mod‐elled substrate and vegetation conditions and the actu‐al ones and systematic errors and biases arising from dynamical model calculations.The BCC_CSM2-MR model has a better simulation capability for the past historical temperature evolution than the previous BCC_CSM1.1m model.As a model developed locally in China,its ability to simulate China's complex ter‐rain areas such as Northwest China should be im‐proved in future iterations.
3.2 Extreme temperature index
To further assess the ability of the model to simu‐late the characteristics of temperature in Northwest China,12 extreme temperature indices were intro‐duced to reflect the extreme weather characteristics of an area.Table 2 shows the temporal trends of these 12 indices.For the absolute threshold indices,the model simulates a weakening trend in frost days and ice days over time and an increasing trend in summer days and tropical nights.This indicates a decrease in cold days and an increase in warm days,although there is still a gap between the measured data and the magnitude and value of these events.For the frequency indexes,the model simulates a downward trend in the number of cold nights and days over time and an upward trend in the number of warm nights and days over time,with a better simulation performance and small‐er gaps,indicating a decrease in the frequency of cold events and an increase in the frequency of warm days,similar to the overall trend in China.For the intensity index,the model simulates an increasing trend in the TNn,TXn,TNx and TXx temperatures over time.In general,the model was able to simulate an exponen‐tial trend tendency (Yaoet al.,2012;Liet al.,2014;Yinet al.,2019).
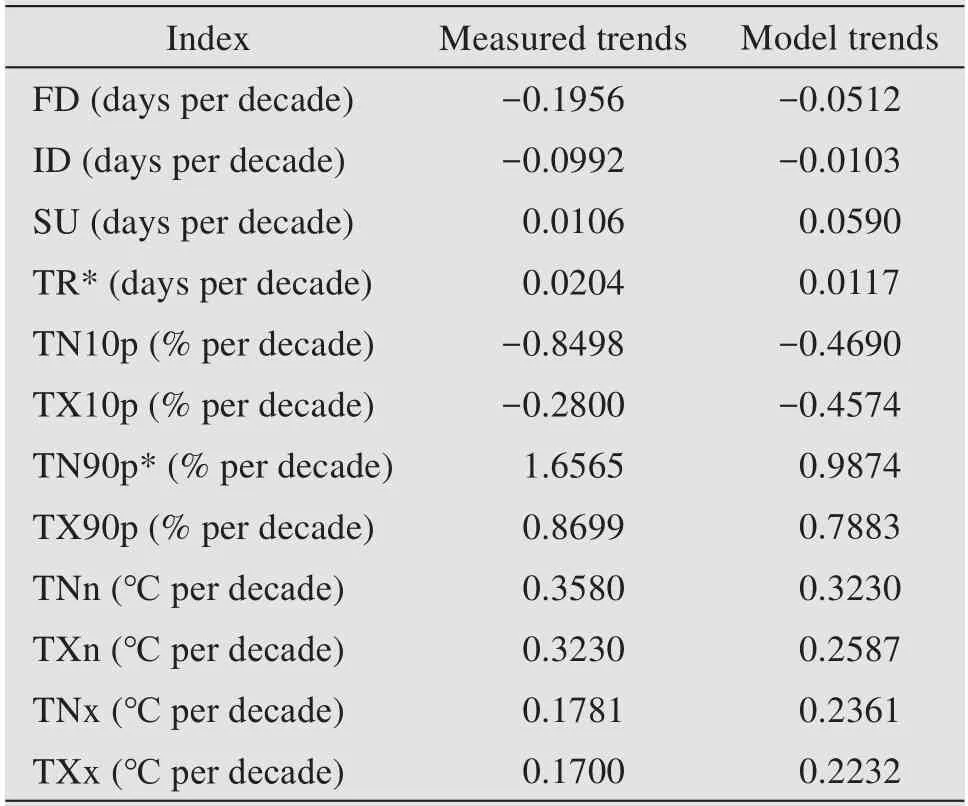
Table 2 Trends of 12 extreme temperature indices for the observed and modeled data in Northwest China
Figure 5 shows the spatial distribution of the num‐ber of frost days and summer days in Northwest Chi‐na and their differences from the observed data to give a further comparative analysis of the spatial dis‐tribution of the model and measured data for the abso‐lute threshold index.The multi-year average spatial distribution of frost days (Figure 5a) is within six days in the Tarim and Junggar Basins,northwestern and southern Gansu,Ningxia,and Shaanxi,with largevalue areas of >11 days in the Tianshan,Kunlun,and Qilian mountains.The model (Figure 5b) simulates low values in the Tarim Basin,southern Gansu,Ningxia,and Shaanxi,and high values in the Kunlun and Qilian mountains,but is unable to predict the high values observed in the Tianshan Mountains,and there is no area with less than two days.The differ‐ence field (Figure 5c) shows an overestimation by the model in most areas,with an overestimation of up to three days in the western section of the Kunlun Moun‐tains and an underestimation in the Tianshan Moun‐tains,the eastern section of the Kunlun Mountains and the Qilian Mountains,with model deviations with‐in two days.The spatial distribution of ice days is sim‐ilar to that of frost days,but the values are small,mostly within four days,and the model is much larger in its simulated values.
Summer days mostly occur in the Junggar Basin,the Cheddar Basin,Ningxia,and Shaanxi,with the Tarim Basin as a high-value center with an occur‐rence of up to five days per year,but the Altai,Tian‐shan and Kunlun Mountains and Qinghai most have less than one day per year of summer days (Figure 5d).The model simulates the high-value areas in the Tarim Basin and Shaanxi well but underestimates the high-value centers by up to five days per year (Figure 5e).The difference field represents the model's under‐estimation of summer days in the Tarim Basin in Xin‐jiang,the Junggar and Chaidam basins,Gansu,Ningx‐ia,and northern Shaanxi,an underestimation of four days per year in the Tarim Basin,and an overestima‐tion in the Tianshan Mountains and southern Shaanxi(Figure 5f).The number of tropical nights days is <0.5 in most areas,which means that tropical nights occur very infrequently in this location,with very few areas in the Turpan Basin in central Xinjiang and southern Shaanxi.The model simulates the occurrence of tropi‐cal nights in east-central Xinjiang and the Tarim Basin,which differs from the actual locations.

Figure 5 Spatial distribution of measured(left-hand panels)and modeled(center panels)data for(a?c)the number of frost days and(d?f)the number of summer days and the difference between modeled and measured data(right-hand panels)in Northwest China from 1961 to 2014(units:days)
Figure 6 shows the spatial distribution of cold nights and warm nights.The spatial distribution of av‐erage annual cold nights shows that the frequency of cold nights is mostly greater than 3.8% per year in the northwest,with high values in the Tarim Basin and northeast Xinjiang (frequencies up to 4.8% per year) and low values in the Kunlun Mountains,south‐ern Qinghai,southern Gansu,and northwestern Shaanxi(Figure 6a).Figure 6b shows that the model has a cold night index of more than 4% per year in the northwest.It predicts high values in the Qaidam Basin and northeast Qinghai with 4.6% per year frequen‐cies,which differs from the measured data.The dis‐tribution of the difference indicates a significant un‐derestimation in the Tarim and Junggar basins and southern Shaanxi and a significant overestimation in Qinghai,with most of the difference within ±0.4%(Figure 6c).The distribution of cold days is similar to that of cold nights.Still,the frequency of occurrence is generally higher,with high frequencies of 4.6% per year in the Tarim Basin,Gansu,Ningxia,and Shaanxi,and with the model simulation of cold days underes‐timating in most areas.The error ranges between?0.5%and 0.3%.
The spatial distribution of warm nights shows that low frequencies occur in the Altai and Tianshan moun‐tains and southern Shaanxi,with a minimum of 3.6%per year,and high frequencies appear in the Junggar Basin,the Kunlun and Qilian mountains,and southern Gansu,with a maximum of 4.8% per year (Figure 6d).The model predicts low values in the Tarim and Cheddar basins and is unable to simulate the mea‐sured values.Figure 6e shows the high-value concen‐trations for the data,with values ranging between 4%and 4.4% per year.The difference field (Figure 6f) in‐dicates mostly underestimation in the south of North‐west China and overestimation in the north,with a margin of error of 0.4%.The spatial distribution of warm days is similar to that of warm nights,but the values are generally low,and there is some overesti‐mation in the model simulation,with an error ranging between ?0.3%and 0.4%per year.
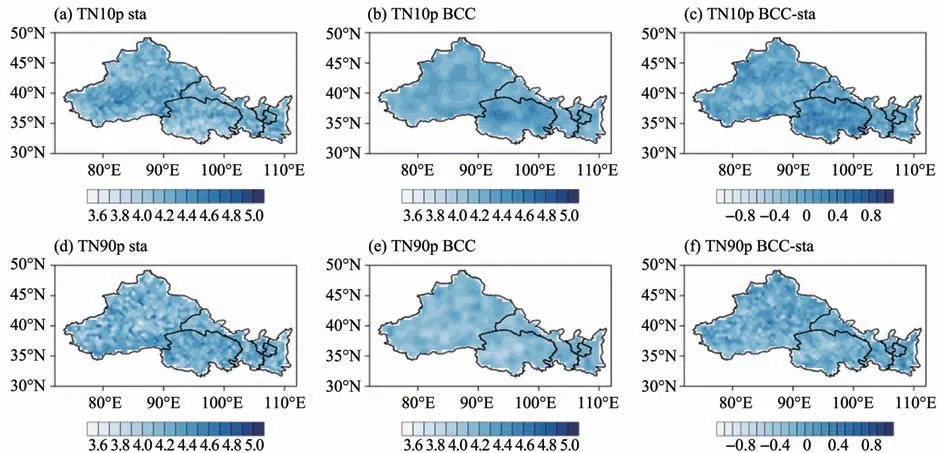
Figure 6 Spatial distribution of measured(left-hand panels)and modeled data(center panels)for(a?c)cold and(d?f)warm nights and the difference between the modeled and measured ones(right-hand panel)in Northwest China from 1961 to 2014(units:%)
Figure 7 shows the spatial distribution of the inten‐sity indexes TNn and TNx.The spatial distribution of the annual minimum daily temperature (Figure 7a) in‐dicates high values for TNn in the Tarim Basin,south‐ern Gansu,and southern Shaanxi,with a maximum of?6 °C,and low values in the Altai,Tianshan,Kunlun,and Qilian mountains and southern Qinghai,with a minimum of ?30°C.As shown in Figure 7b,the mod‐el predicts high values centering in the Tarim Basin and southern Shaanxi,with the simulated values be‐ing larger for the Tarim Basin and smaller for south‐ern Shaanxi.However,the simulations for western Qinghai are too low,exceeding ?32 °C.The differ‐ence field,as shown in Figure 7c,indicates a wide range of underestimations by the model.There is an overestimation in the Junggar and Qaidam basins,the eastern section of the Kunlun and Qilian mountains,and a large zone of underestimation up to ?10 °C in the western section of the Kunlun Mountains and cen‐tral Qinghai.The spatial distribution of the annual minimum daily maximum temperature is similar to that of the annual minimum daily minimum temper‐ature,with high values concentrating in the Tarim Basin and southern Gansu and southern Shaanxi,up to 6 °C,and low values centering in the Altai and Tianshan Mountains with a median temperature of?16°C.The simulation of TXn is similar to that of the annual minimum daily maximum temperature,with underestimation in most areas.The model predicts un‐derestimated high values of ?10°C centering in north‐ern Qinghai and overestimated high values of 8 °C focusing in the Junggar Basin.
The annual maximum daily minimum tempera‐tures,as shown in Figure 7d,occur in the Junggar and Tarim basins,east-central Xinjiang,and southeastern Shaanxi,with high values up to 24°C,and low values in the Tianshan and Kunlun Mountains and western Qinghai,with minimum values of ?4 °C.The model(Figure 7e) simulates high values in the Tarim Basin,east-central Xinjiang,and southeastern Shaanxi.How‐ever,the range of values is slightly smaller and cannot predict the high-value zone in the Qaidam Basin.The difference field (Figure 7f) shows overestimations of up to 12 °C centering the Altai and Tianshan moun‐tains,the eastern section of the Kunlun Mountains,and the Qilian Mountains.In contrast,there are under‐estimations of up to ?12 °C in the Junggar Basin and the western section of the Kunlun Mountains.The spatial distribution of the annual maximum daily max‐imum temperature is similar to the annual maximum daily minimum temperature,and the patterns of over‐estimation and underestimation are similar.
Their one comfort in their sad plight50 was the power of flying, and accordingly they often flew over the roofs of Bagdad to see what was going on there
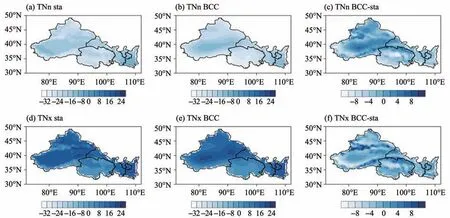
Figure 7 Spatial distribution of the measured(left-hand panels)and model data(center panels)of(a?c)the annual minimum daily temperature and(d?f)the annual maximum daily temperature and the difference between model and measured data(right-hand panels)in Northwest China from 1961 to 2014(units:°C)
In general,the model can simulate the spatial dis‐tribution of the indices and extreme variations in tem‐perature due to abrupt changes in topography well.However,it is unable to simulate the characteristics of the terrain.It ignores the temperature characteristics of the Tianshan Mountains and Junggar Basin and cannot predict the sudden changes in the indices in complex mountain ranges and basins.The spatial sim‐ulation of the absolute threshold index is the best of the three indices,with RMSE within 1.2 days,where‐as the simulation of the frequency index is relatively poor,with an RMSE of 5.2%.Of the 12 indices,the best simulations are for summer days,tropical night days,and the annual maximum and minimum daily temperatures,and the poorest spatial simulations be‐long to cold days and cold nights.
Figure 8 shows the Taylor diagram of the extreme temperature indices.The ratio of the standard devia‐tion of the simulated absolute threshold index and measured data is small,between 0.6 and 0.9,and the spatial correlation coefficient ranges between 0.7 and 0.85.But the spatial correlation of the heat-night in‐dex is small,or the model fails to simulate the spatial distribution because of the small probability of the oc‐currence of heat-night.Although the ratio of the stan‐dard deviation of the simulated frequency index and measured data is small,between 0.8 and 0.95,their spatial correlation coefficient is less than 0.1,indicat‐ing that the frequency index is poorly simulated spa‐tially.For the intensity indices,their ratios of standard deviation between the model and measured ones range between 0.95 and 1.05,and the spatial correla‐tion coefficients fall between 0.7 and 0.85,indicating that the model simulates such indices relatively well.
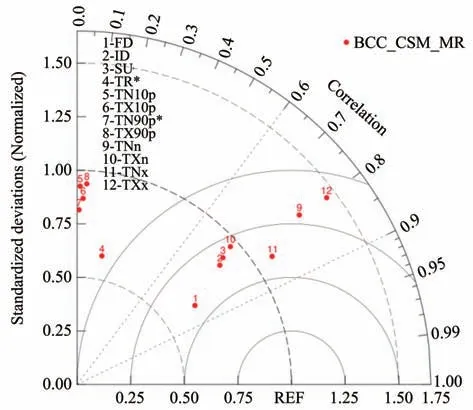
Figure 8 Taylor diagram for 12 climate indices
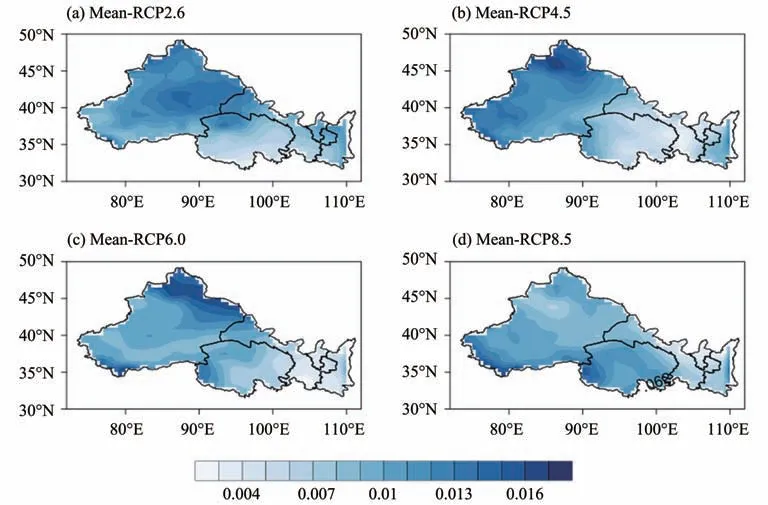
Figure 9 Spatial distribution of daily mean temperatures in Northwest China from 2015 to 2100(units:°C/100a)
3.3 Future scenarios
This assessment shows that the BCC_CSM2_MR model has some modeling capability and can predict future climate changes in Northwest China by analyz‐ing temperature conditions under four different radia‐tive forcing scenarios (RCP2.6,RCP4.5,RCP6.0,and RCP8.5).The spatial distribution of the linear trend in the annual mean temperature increase is different for each of the four scenarios.However,the magnitude of the warming increases significantly as the radiative forcing intensifies.Under the RCP2.6 scenario,signif‐icant increases in the daily mean temperature occur in Xinjiang,northwestern Gansu,and northern Qinghai.Under RCP 4.5,the warming rate is 3?4°C per centu‐ry across the region's northwest.Under RCP 6.0,the high values occur in northern Xinjiang,a small zone in southern Xinjiang and western Qinghai,with a rate of about 6 °C per century.Conversely,the warming rate is slightly smaller in Shaanxi,Ningxia,Gansu,and eastern Qinghai.Under the RCP8.5 scenario,the warming trend is more southerly in southern Xinji‐ang,Qinghai,and,to a lesser extent,in northern Xinji‐ang.The overall warming rate is 6?7 °C per century.The spatial distributions of the linear trends of the dai‐ly maximum and minimum temperatures are similar to that of the daily mean temperature.The warming trend differs among the four seasons under different radiation scenarios,with the smallest increase in spring.
The simulated future temperature changes were analyzed under different radiation scenarios,and the monthly average temperature from 2015 to 2018 was compared with the measured data.Graphical presenta‐tion of data is omitted due to page limitations.The dif‐ference between the simulated and measured data un‐der the four scenarios is within 0.5°C,and the month‐ly changes in temperature are the same.The simulated future annual average temperatures under the four sce‐narios show that the RCP2.6 scenario has the lowest warming rate,with a temperature rise of less than 2 °C by 2100.The warming in the RCP6.0 scenario is close to that of the RCP8.5 scenario but relatively smaller,with the average temperature rise not exceed‐ing 8°C by 2100.
4 Conclusions
We assessed the ability of the BCC_CSM2_MR model to simulate the spatial variability and future changes of temperature in Northwest China using three deterministic prediction evaluation methods and three extreme temperature indices.The main conclu‐sions are as follows.
(1) The BCC_CSM2_MR model can somewhat simulate the surface temperature in Northwest China ann simulate the changes in all four seasons and the spatial distribution of temperature.However,some systematic errors still exist in the model,producing lower simulated temperatures.The distribution of the simulated temperature is more closely aligned with the topographic changes in Northwest China,with bet‐ter simulations for the Tarim Basin,the Kunlun and Qilian mountains,and Shaanxi.However,there is still some bias in the simulations of the features of the Junggar and Qaidam basins and the Tianshan Mountains.
(2) The simulated daily mean temperature is the best,and its deviation relative to the measured data is mostly within 1?3°C.The deviation of the daily max‐imum temperature relative to the measured data is sig‐nificant,the correlation is low,and fewer regions pass the significance test.The model grossly underesti‐mates the Kunlun Mountains and Qaidam Basin and overestimates the Altai Mountains,Tianshan Moun‐tains,and Qilian Mountains.Also,it has the best simu‐lation for summer with an overall positive correlation and the worst simulation performance for spring with a low overall correlation.More areas are overestimat‐ed in winter,and more regions are underestimated in spring,summer,and autumn.The overall deviation falls within±4°C.
(4) By analyzing the spatial distribution of the lin‐ear trends in the annual mean temperature in each sea‐son under each scenario,one can see a clear warming trend in Xinjiang and throughout the southern part of Northwest China.In each scenario,future warming in Northwest China is 1?2 °C per century under RCP2.6,3?4°C per century under RCP4.5,5?6°C per century under RCP6.0,and 6?7°C per century under RCP8.5.
Although the BCC_CSM2_MR model has im‐proved accuracy compared with the BCC_CSM1.1 m and the simulated temperature is closer to the mea‐sured data,the model still has systematic errors when it is applied in Northwest China,where the terrain is complex.Improved temperature conditions modelling in Northwest China is required to better predict ex‐treme weather events and to improve disaster loss pre‐vention in this region.
It was not possible to select data with a higher temporal accuracy due to time constraints.Studies on the relative threshold and duration of extreme temper‐ature indices of the daily temperature variation,grow‐ing season length,continuous warm day index,and continuous cold day index were not carried out and need to be improved in the future.The selection of forecast assessment methods is limited,and a variety of tests,such as quantitative and qualitative assess‐ments,should be carried out to give a more compre‐hensive assessment and more accurate testing of these models.
Acknowledgments:
This work was supported by the Numerical model de‐velopment project of China Meteorological Adminis‐tration (QHMS2018018,QHMS2019016) and Re‐search Fund Project of Chengdu University of Infor‐mation Technology(KYTZ201721).
 Sciences in Cold and Arid Regions2022年2期
- Sciences in Cold and Arid Regions的其它文章
- Guidelines to Authors
- Effect of GGBS on performance deterioration of non-dispersible underwater concrete in saline soil
- Diversity and composition of culturable fungi in Horqin Sandy Land
- Coarse fragment content influences estimates of soil C and N stocks of alpine grassland on the northeastern edge of Qinghai-Tibetan Plateau,China
- Influence of meteorological elements on chemical evolution of snow and ice of Urumqi Glacier No.1,eastern Tianshan Mountains
- Estimating snow depth or snow water equivalent from space