
Integrated data analysis on the electron temperature profile of HL-2A with the Bayesian probability inference method
2022-06-01 07:56:20WenanPAN潘文安TianboWANG王天博ZhibinWANG王志斌YonghaoYANG楊勇濠HaoWU吳豪GeertVERDOOLAEGEZengchenYANG楊曾辰ChunhuaLIU劉春華WenpingGUO郭文平BingliLI李兵利ZijieLIU劉自結(jié)WenbinWU吳文斌andMinXU許敏
Plasma Science and Technology 2022年5期
Wenan PAN(潘文安),Tianbo WANG(王天博),Zhibin WANG(王志斌),Yonghao YANG (楊勇濠), Hao WU (吳豪), Geert VERDOOLAEGE,Zengchen YANG(楊曾辰),Chunhua LIU(劉春華),Wenping GUO(郭文平),Bingli LI (李兵利), Zijie LIU (劉自結(jié)), Wenbin WU (吳文斌) and Min XU (許敏)
1 Sino-French Institute of Nuclear Engineering and Technology, Sun Yat-sen University, Zhuhai 519082,People’s Republic of China
2 Southwestern Institute of Physics, Chengdu 610041, People’s Republic of China
3 Ghent University, Ghent B-9000, Belgium
4 University of Science and Technology of China, Hefei 230000, People’s Republic of China
Abstract Data analysis on tokamak plasmas is mainly based on various diagnostic systems, which are usually modularized and independent of each other.This leads to a large amount of data not being fully and effectively exploited so that it is not conducive to revealing the deep physical mechanism.In this work,Bayesian probability inference with machine learning methods have been applied to the electron cyclotron emission and Thomson scattering diagnostic systems on HL-2A/2M, and the effects of integrated data analysis(IDA)on the electron temperature of HL-2A with Bayesian probability inference are demonstrated.A program is developed to infer the whole electron temperature profile with a confidence interval,and the program can be applied in online analysis.The IDA results show that the full profile of the electron temperature can be obtained and the diagnostic information is more comprehensive and abundant with IDA.The inference models for electron temperature analysis are established and the developed programs will serve as an experimental data analysis tool for HL-2A/2M in the near future.
Keywords: electron cyclotron emission, Thomson scattering, electron temperature, Bayesian inference
1.Introduction
Data analysis on tokamak plasmas is mainly based on various diagnostic systems, which are usually modularized and independent of each other, i.e.the characteristic parameter profiles of the plasma distributed in different spaces are provided independently by each system (such as the core region plasma diagnostic system and the edge area plasma diagnostic system).This leads to a large amount of data that cannot be fully and effectively exploited, which is not conducive to revealing the deep physical mechanism of tokamak plasmas.
The application of Bayesian probability theory (BPT)provides a promising way to give an efficient data analysis method on tokamak plasmas.In Bayesian probability theory,probability distributions are used to describe the uncertainty of the variables that we are interested in.In the framework of Bayesian inference,experimental data from multiple diagnostic systems can be utilized simultaneously in the inference of the same physical parameter with a quantitative uncertainty(which is called the integrated data analysis(IDA)).In the IDA system,more accurate inference results will be obtained with more information or measured data, and the IDA system not only avoids the inconsistency caused by error propagation during modularized analysis but also makes full use of all the measurement information.Therefore, the utilization rate of experimental data can be improved effectively.
BPT is proved to be an effective tool for providing the straightforward and unified treatment of different sources with uncertainties [1].Generally, BPT provides the calculus on how to resolve an inference problem based on uncertain information.The outcome of BPT analysis is the probability density function (PDF) of the quantity that we are interested in, which encodes the knowledge drawn from the available information.Hence, the posterior PDF comprises the complete information which can be inferred from the data and the statistical model, and supplementary information (such as first-principle physics knowledge).BPT offers the possibility of linked analysis of complementary diagnoses measuring the same quantity by different physical principles, and it also offers the possibility to exploit the interdependences.
For future tokamaks, such as ITER and DEMO, the coupled analysis of the data from different diagnostic systems is quite important, due to the specific limitations of each specific diagnostic system.Therefore,the IDA concept which was first proposed by R Fischer and A Dinklage [2], could contribute to improving the use of detailed studies with supplemental theoretical modeling.The corresponding algorithms are intended to be used for detailed studies, which possibly require supplemental theoretical modeling.Meanwhile,suitable approximations are explored for the automated analysis of long-time discharges in advanced tokamaks.
The BPT method has been successfully applied on the Wendelstein 7-X stellarator for the integrated measurements of the ion and electron temperatures, the plasma flows, as well as the impurity densities, from the spectroscopic analysis of the tracer impurity radiation with the help of a forward modeling approach (namely the Minerva Bayesian analysis framework) [3].Specifically, the electron temperature profile reconstruction based on BPT has been implemented on MAST with a Thomson scattering (TS)diagnostic system, lithium beam emission spectroscopy,deuterium cyanide laser interferometry, and electron cyclotron emission (ECE) [4].Additionally, integrated analyses on electron temperature profile reconstruction have also been performed on JET with TS and ECE [5, 6].However,data analysis based on IDA combining all kinds of diagnostic systems has not been applied to HL-2A,which will be very important in the future, especially for the data analysis of HL-2M.This work provides a comprehensive analysis based on BPT in light of the existing electron temperature diagnostic systems on the HL-2A/2M.The electron temperature inference models have been established and the developed programs will serve as an experimental data analysis tool for the HL-2A/2M in the near future.
The paper is organized as follows.The ECE and TS diagnostic systems and the model based on Bayesian theory are described in section 2.The data analysis results on the electron temperature with the ECE and TS diagnostic systems of the HL-2A by the Bayesian model are presented in section 3, together with the IDA combined with both the ECE and the TS diagnostic systems.Finally, the paper is summarized in section 4.
2.Electron temperature diagnostics and the model
2.1.ECE diagnostic system
The ECE diagnostic system for the measurements of electron temperature of HL-2A consists of five groups of equipment[7], including three groups of multi-channel electron cyclotron emission diagnostic equipment(ECE1 and ECE2 with 16 channels, and ECE3 with 48 channels), one group of sweeping electron cyclotron emission (SECE) diagnostic equipment and one group of electron cyclotron emission imaging (ECEI) diagnostic equipment [8].On HL-2A, since the plasma cutoff frequency of the O-mode covers the fundamental signal of ECE, as shown in figure 1, the second harmonic signal with the higher frequency is generally selected for the temperature diagnostic.
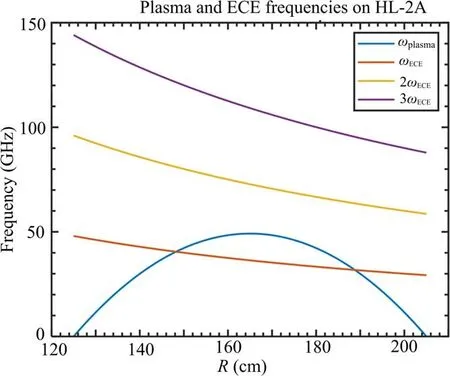
Figure 1.Schematic diagram of the plasma and ECE frequencies on HL-2A.
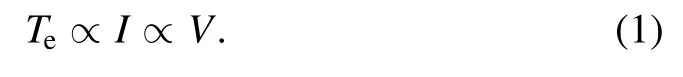
The original data of ECE is the evolution of the voltage signal with time.The voltage V is linearly proportional to the intensity I of the signal which is linearly proportional to the electron temperature [9, 10].Therefore, the electron temperature Teis linearly proportional to the voltage V, namely
However, the voltages measured have undergone many modulations, which makes it meaningless to compare the absolute value of the voltages between different independent channels directly.Therefore, calibration between channels is necessary [11].
As mentioned above, the frequency denotes the spatial position of the measured point.In the ECE diagnostic system,the electron cyclotron can be described by the centripetal motion formula:

where q is the electron charge, B is the magnetic field intensity, m is the electron mass, and ω is the electron cyclotron frequency.The relationship between the magnetic field intensity and the major radius R can be expressed as
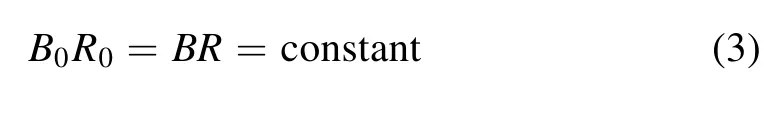
where R0= 1.65 m is the center of the plasma and B0is the magnetic field intensity at the corresponding point.The relation between the major radius and the signal frequency can be derived as
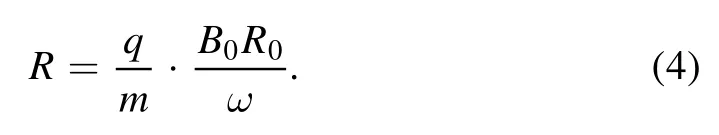
Therefore, the measurement position is inversely proportional to the signal frequency in the ECE system.
Calibration between different channels is required to give a meaningful electron temperature profile.For calibration purposes,two discharge experiments(denoted by subscripts 1 and 2) with quite comparable performance are required.It is assumed that the temperature profile of the plasma is smooth,i.e.the profile is considered to be gradual,and there will be no gradient jump.
Taking the calibration of two adjacent channels k and k+1 as an example, the schematic of calibration is shown in figure 2.There are four data points in total from two channels in two discharges, where the triangles represent the first discharge,and the circles represent the second discharge.It can be observed that the same channel measures different spatial positions for the two discharges due to the difference in magnetic field intensity.
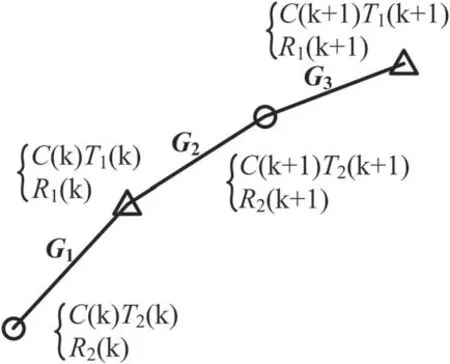
Figure 2.Schematic of the relative calibration.
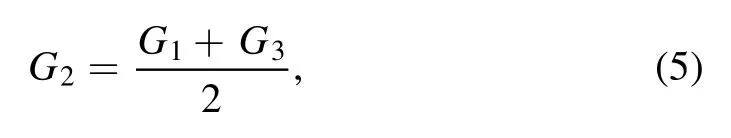
The following relation denotes the three gradients formed by the four points in the light of the hypothesis above
where
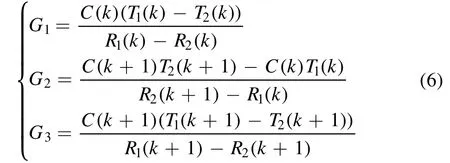
where C(k) is the calibration factor of the channel k, T(k) is the electron temperature, and R(k) is the major radius.
Substituting equation (6) into (5), it can be derived that

Dividing both sides by C(k) and combining the terms withit can then be obtained that

Finally, the relationship between C(k) and C(k + 1) can be derived as
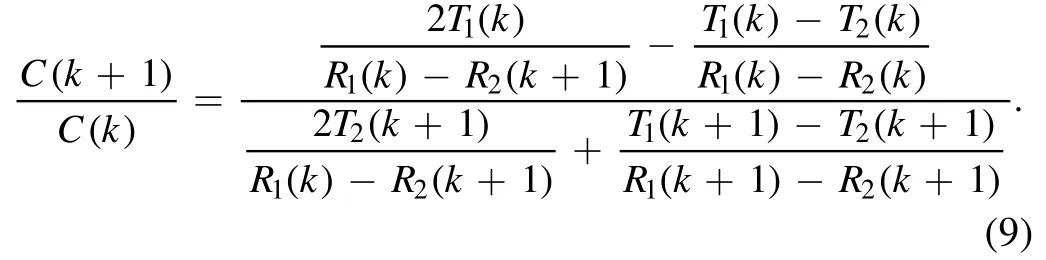
Therefore, the calibration factors of all the channels can be calculated by iteration once one channel is assigned, such as C(1) = 1.The joint calibration considers the data measured by different ECE systems, which is similar to the measurements taken at different spatial points for calibration.
Figures 3(a) and (b) show the data before and after the calibration on ECE3,respectively.The abscissa represents the major radius and the ordinate represents the temperature with an arbitrary unit.The left triangles in blue represent the data from the shot#32823 on HL-2A and the right triangles in red represent the data of the shot#32821.Figure 3(a)denotes the original data without processing and figure 3(b) denotes the data after multiplying by the calibration factors, which represents the electron temperature in the ECE diagnostic system.The ECE diagnostic system can only offer the electron temperature profiles without absolute electron temperature.It can be seen that before calibration, there is no connection between data from different channels.The electron temperature profile becomes meaningful after calibration.
2.2.Thomson scattering diagnostic system
The Thomson scattering(TS)diagnostic system possesses the advantages of higher measurement accuracy and wider measurement range,and the layout of the TS diagnostic system on HL-2A is shown in figure 4.The absolute temperature can be obtained by TS,which can be used for the cross-calibration of the ECE diagnostic.
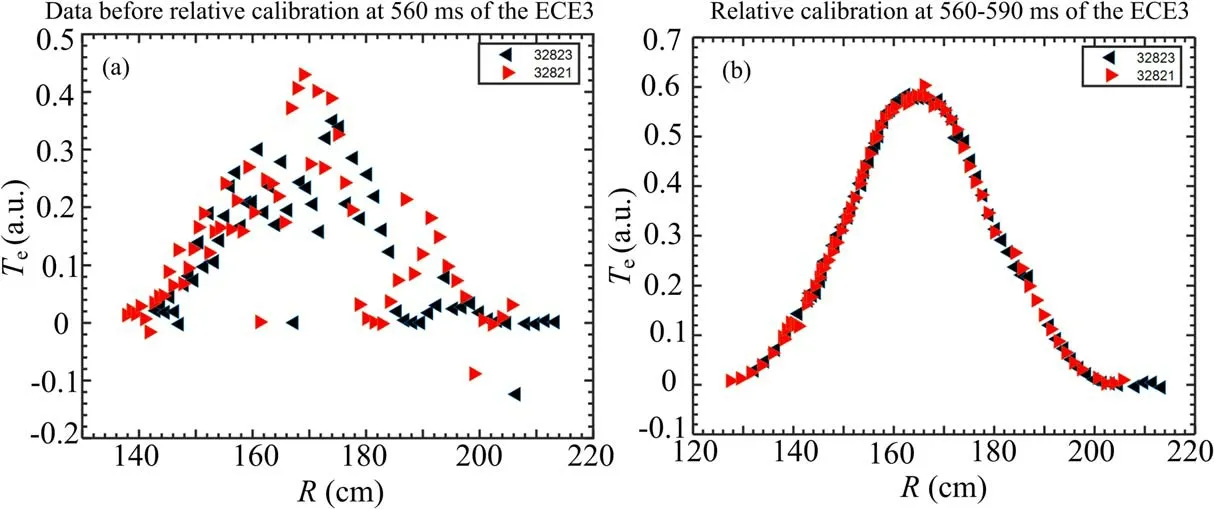
Figure 3.Data before (a) and after (b) the relative calibration.
As shown in figure 4,in the TS diagnostic system,the laser is emitted through an Nd:YAG laser transmitter and passes through the plasma vertically along the polar direction of the tokamak after being reflected by a mirror.Then the laser interacts with the electrons in the plasma and the scattered signals at different spatial points with different scattering angles along the polar direction are collected through more than 20 polychromators.Finally, the data Dijdenoting the spectral intensity from different spectral channels (each channel corresponds to a certain waveband of the scattered light) of each polychromator,and the electron temperature can be obtained through a series of data processing [13, 14].
Before each discharge, it is necessary to calibrate the spectral transmission coefficient τ, which is a function of wavelength λ and the scattering angle θ.The calibration system is mainly composed of a standard light source and an electroscanning monochromator [15].The light emitted from the standard light source is focused by the lens and converted into pulsed light by the chopper,before entering the monochromator through the UV filter [16].Then an adjustable monochromatic light source can be output into the polychromator to be calibrated after power measurement for each monochromatic light J(λ)δλ.Finally, the measured data D from each channel of the polychromator can be obtained and the spectral transmission coefficient can be calculated as τ = D/[J(λ)δλ].
Figure 5(a)presents the spectral transmission coefficient for the polychromator measuring the scattering light with a scattering angle of π/2.It can be observed that this polychromator possesses five channels from 750 to 1050 nm,which covers the scattering spectrum band of the high-temperature region, especially the core region of the plasma.As shown in figure 5(b),the scattering spectrum for the high-temperature region has a larger band but a lower peak value.Meanwhile,the scattering spectrum for the low-temperature region(such as the electron temperature at the plasma edge)has a narrower but greater peak value.This is why a polychromator from 850 to 1050 nm is applied for the low-temperature range.
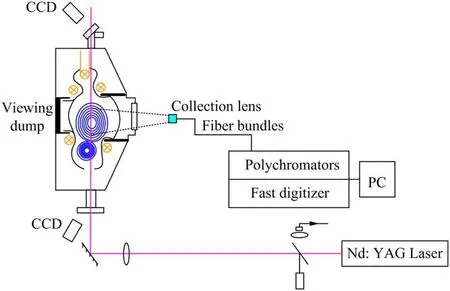
Figure 4.The layout of the Thomson scattering diagnostic system on HL-2A [12].
At present,the maximum likelihood method[15]and the ratio method [14] are mainly used for subsequent data processing in the TS diagnosis of HL-2A.The maximum likelihood method is introduced in this subsection, whose principle is also used in the inference model of TS.
2.3.The maximum likelihood method
The key concept of the maximum likelihood method is to find the parameters that make the likelihood probability function achieve the maximum value.In the context of TS diagnosis,a specific spectral channel j at a specific spatial point is considered.
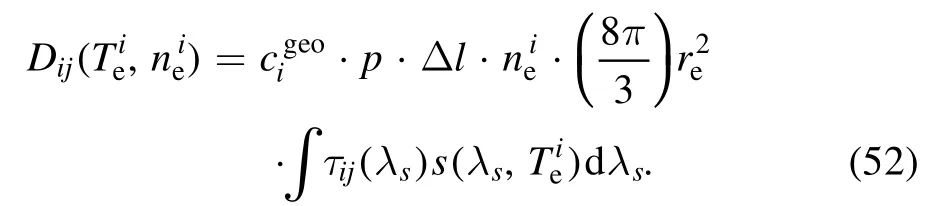
A fixed spatial point is considered as an example in this study.It is known that each spatial point corresponds to four spectral channels (j = 1-4), and the spectral intensity [17]obtained for channel j can be written as a function of the electron temperature Teand the electron density ne:
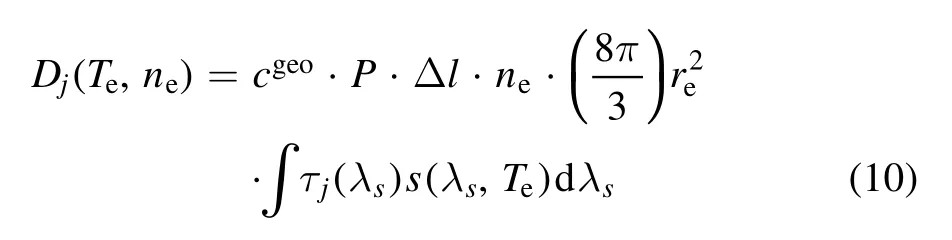
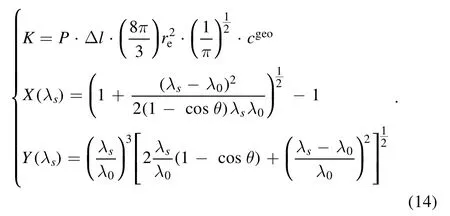
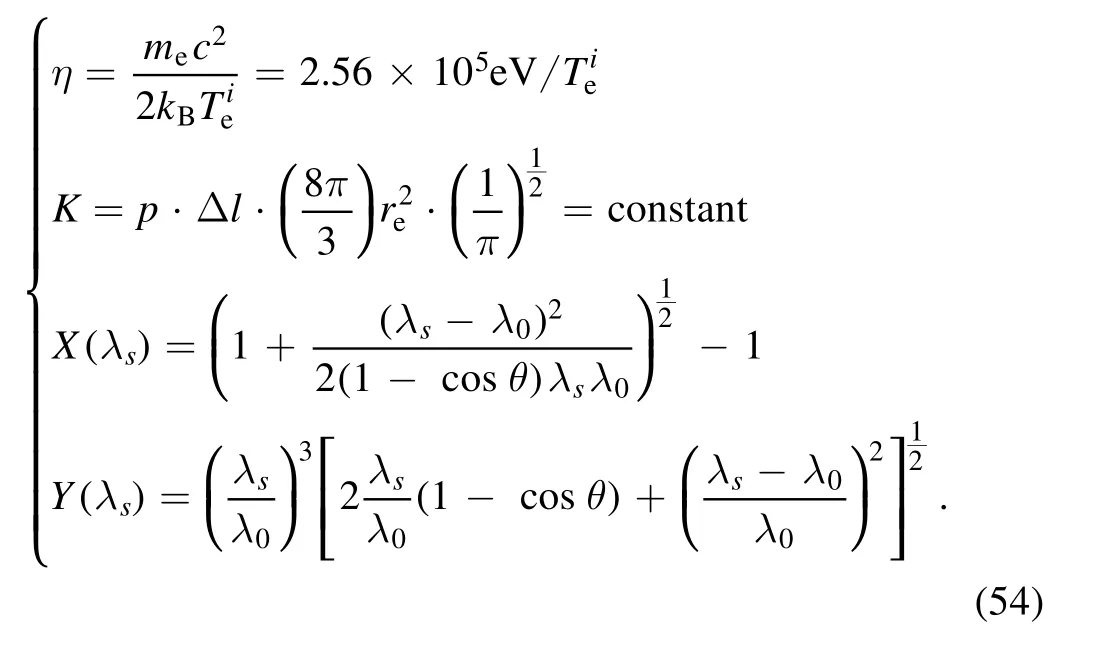
where cgeois called the geometrical factor and can be obtained with Raman calibration [18], P is the incident laser power,Δl is the length along the laser beam of the scattering volume, re= e2/(4πε0mec2) = 2.81×10⁻¹⁵m is the electron classic radius, τjis the spectral transmission coefficient,and S is the form factor.
The Selden expression is applied for the form factor S:
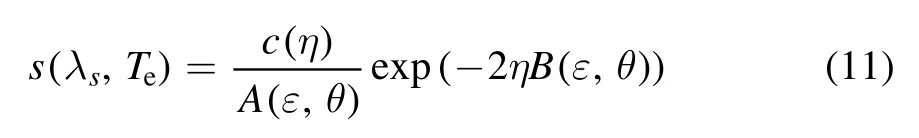
where
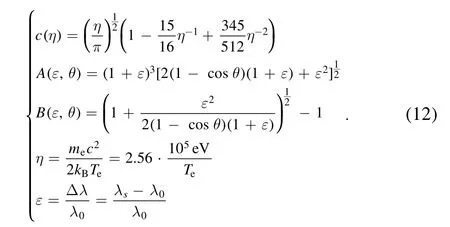
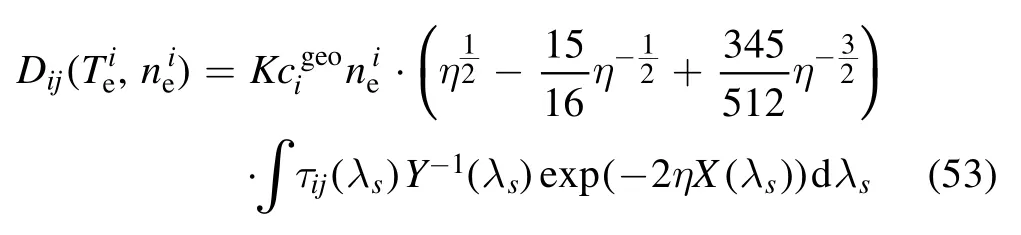
λ0(=1064 nm) is the incident wavelength.Combining equations (10)-(12), it can be derived that
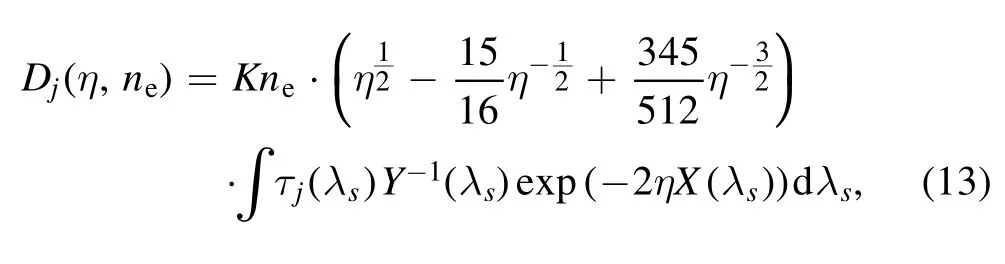
where
In order to improve the accuracy, assuming that the original data yjof each channel of the scattering system obeys the Poisson distribution, the likelihood function can be written as
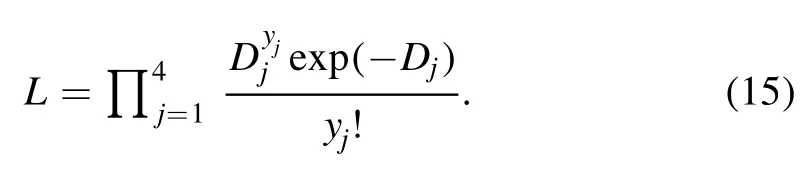
Equation(16)can be obtained by taking the logarithm of L, as well as formula transformation.
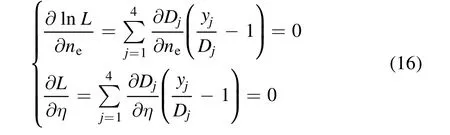
Substituting equation (13) into (16), it can be obtained that
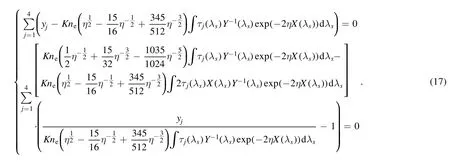
Solving equation set (17), we can get neand η, and further obtain Te.
2.4.Mathematical model for ECE
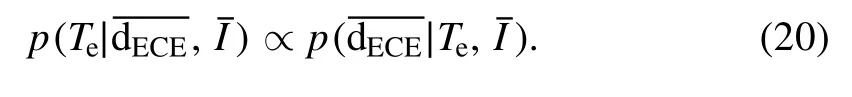
2.4.1.Single-point model.Considering the single-point electron temperature measurement, according to the BPT, it can be derived that:
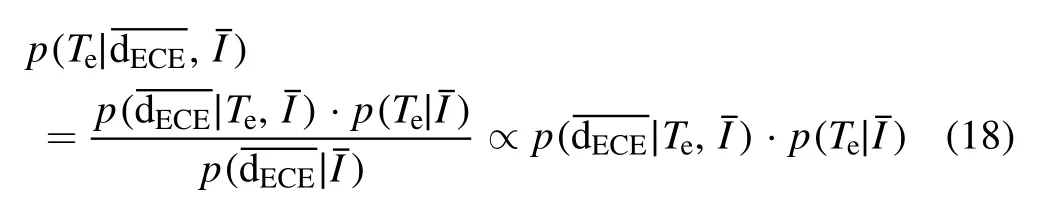
where Tedenotes the electron temperature,dECEdenotes the data measured from the ECE diagnostic system, anddenotes the additional information.
Assuming a uniform prior probability distribution function, i.e.
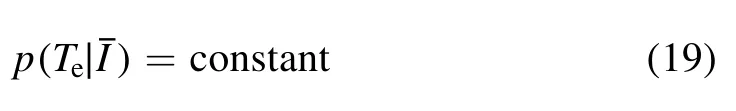
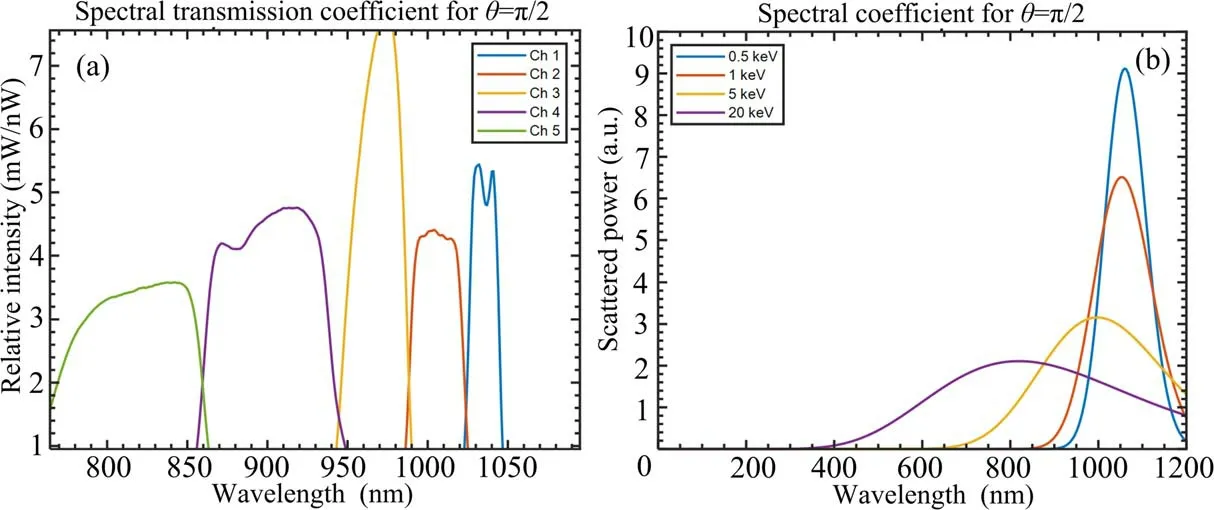
Figure 5.The spectral transmission coefficient (a) and the spectral spectrum of the scattered power (b) for scattering angle at π/2.
Substituting (19) into (18), it can be obtained that:
Taking N data points in 0.05 ms before and after the moment is selected as the measurement data,and considering each data point as one independent measurement, the likelihood functioncan be decomposed into the product of the likelihood of N independent measurements:

where dk,ECEis the data of the k-th time measurement.
Moreover, the electron temperature Teis linearly proportional to the measurement data, namely voltage V here with the presence of measurement uncertainty, thus the data dk,ECEis linked with the electron temperature by the following equation [19]:
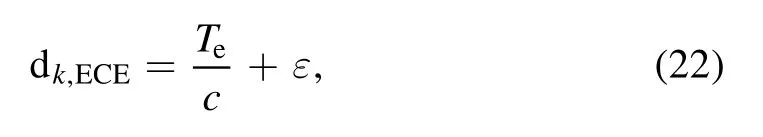
where ε denotes the noise and C denotes the calibration factor of the selected channel.
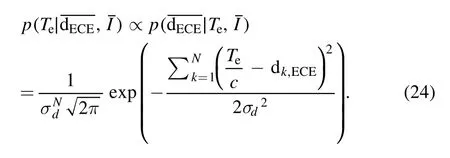
Assuming that the noise associated with the experimental measurement can be reasonably represented by a Gaussian process,then the likelihood PDF of a single data point can be written as:
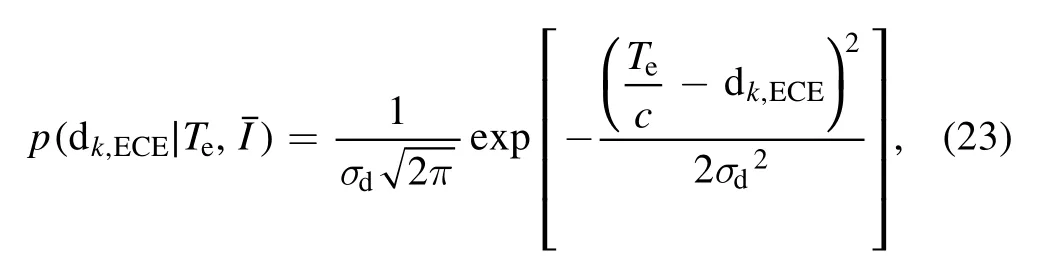
where σdis the error.Indeed, the calibration factors are variant in different discharge conditions, which is described by the response function.On the other hand,a raw calibration process was demonstrated by nearly identical discharges,and the measurement uncertainty was taken into account in the likelihood covariance term σd.That is an acceptable assumption when the uncertainty source is difficult to identify.
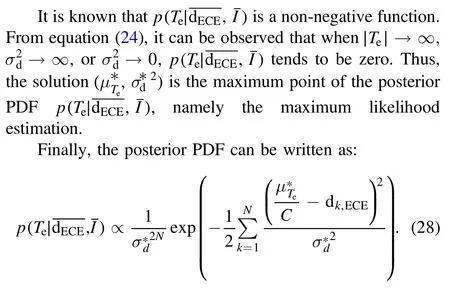
Combining equations (20)-(23), the posterior PDF can be derived as
Moreover, taking the logarithm of the posterior PDF, it can be obtained that
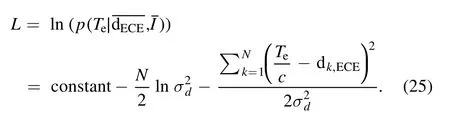
Derive L concerning the electron temperature and the error, and set the derivatives to be zero, therefore it can be obtained that
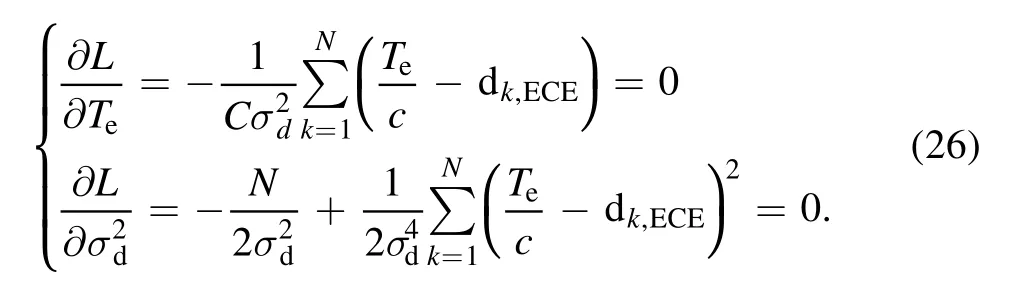
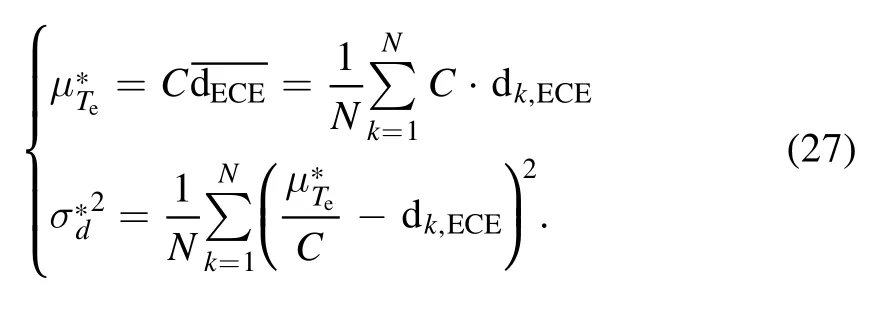
The solution can be written as:
2.4.2.Multi-point model.For the ECE diagnostic system with multi-points, applying the BPT, the posterior PDF can be derived as
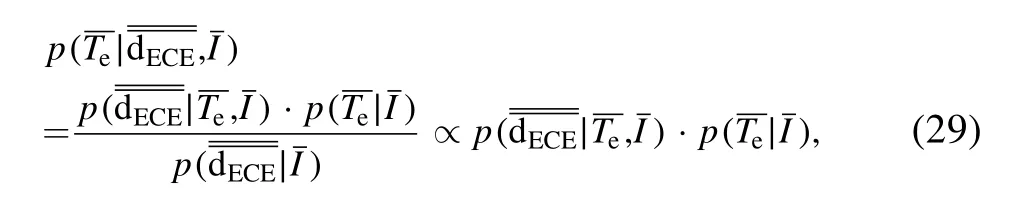
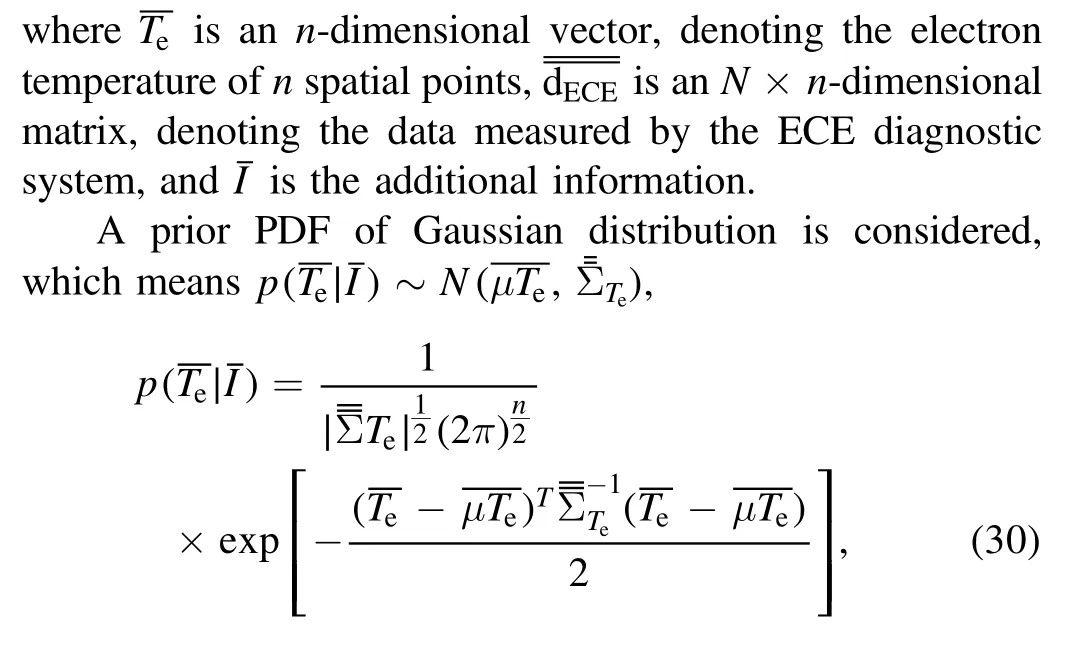
where
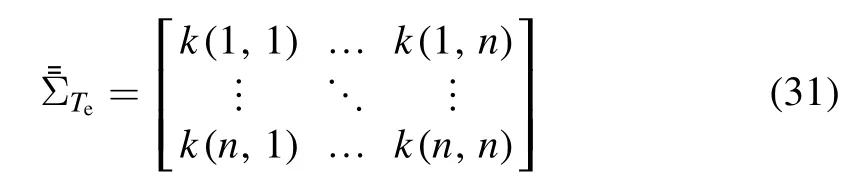
is the covariance matrix, and
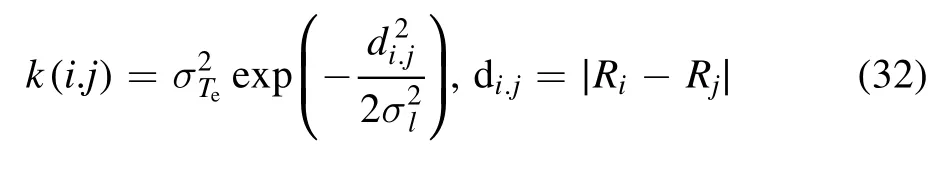
is the kernel function, whereis the inference uncertainty andis the smoothness parameter, which represents the level of how the inference is influenced by the surrounding data.Both are hyperparameters and can be optimized by Ockham’s Razor.
Similarly, taking N data points in 0.05 ms before and after the moment selected as the measurement data, the likelihoodcan be decomposed into the product of likelihood PDF of N independent measurements.Thus, it can be obtained that

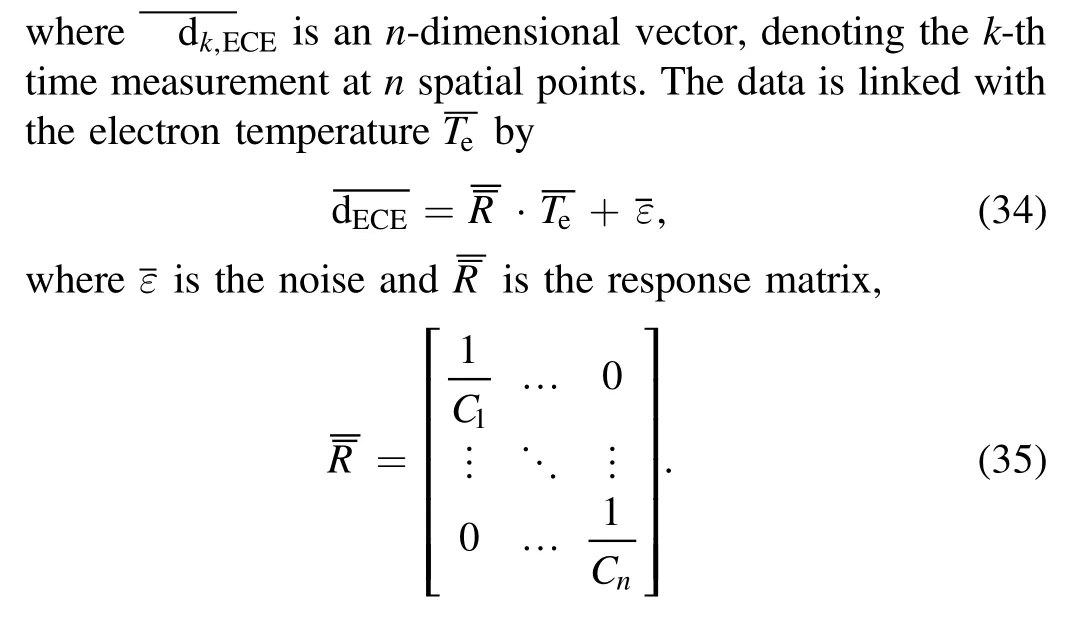
C1, C2, …, Cnare the calibration factors of each channel.
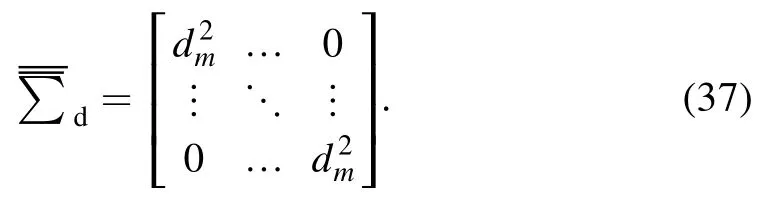
Assuming that the noise associated with the experimental measurement can be reasonably represented by a Gaussian process [19], then the likelihood PDF of the k-th time measurement of n spatial points can be written as:
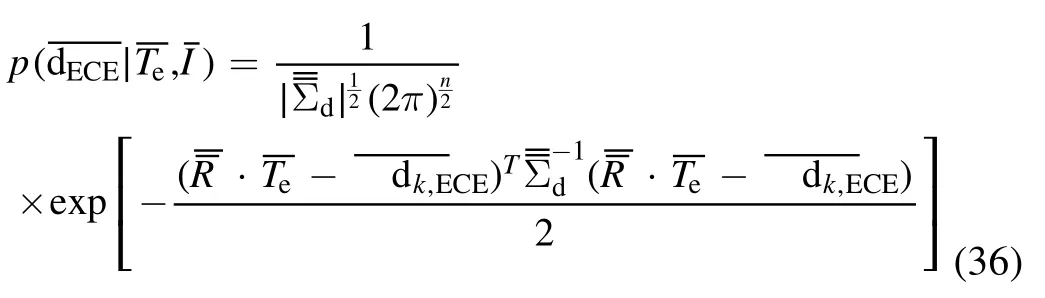
Considering that in the real measurement,the error of the channel with a small measurement value is not necessarily small, the average value dmof all the data is chosen as the noise.Then, the covariance matrix can be written as
Combining equations (29)-(37), the posterior PDF can be obtained with
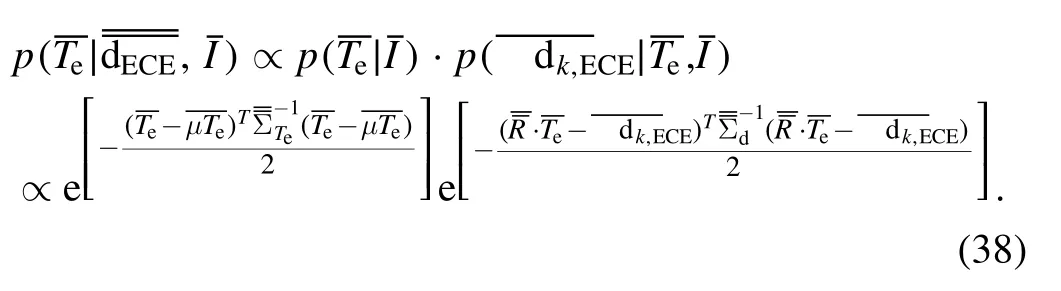
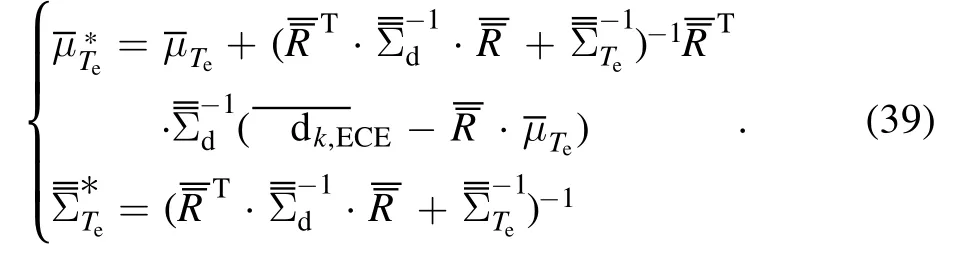
The posterior PDF is the production of the two Gaussian distributions, so it is also a Gaussian distribution, and the covariance matrix is given by the following formula,
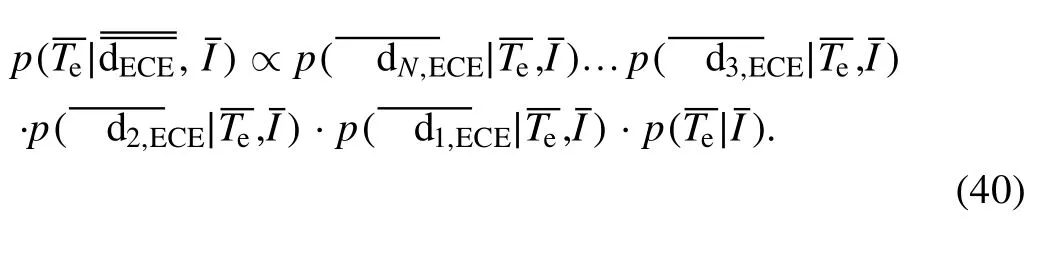
Iteratively calculating the posterior PDF of the previous measurement as the prior probability of the next measurement, we finally get

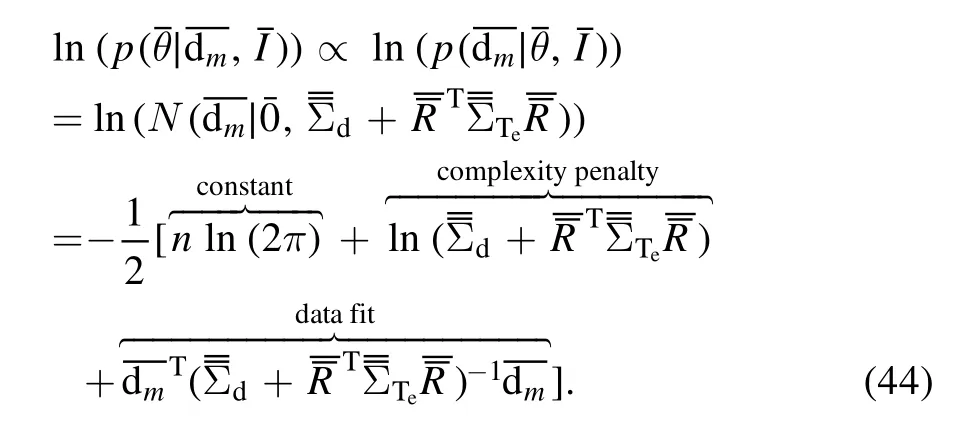
Taking the logarithm, the result is given by
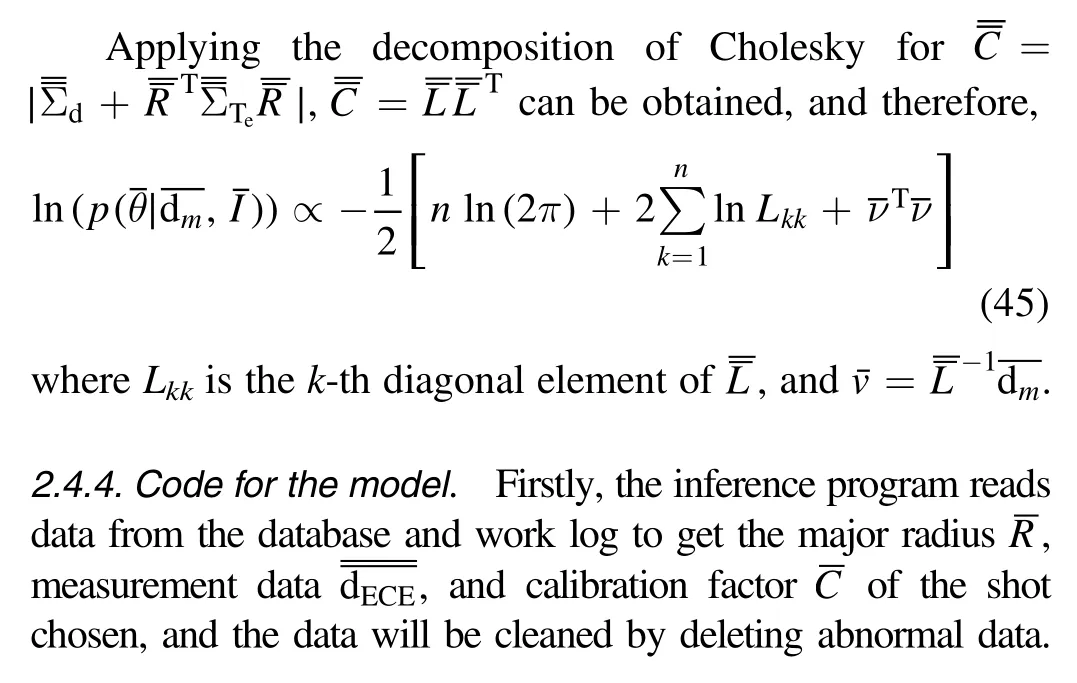
Based on the mathematic models above, the program is developed with MATLAB to infer the electron temperature profiles with confidence intervals.The program for ECE consists of one main function, three performance functions,and five tool functions, and figure 6 presents the basic framework of the program.The main function plays the role of identifying the input data, and initializing and calling the performance functions.The three performance functions realize the optimization of hyperparameters,and the inference of the electron temperature profiles,as well as the calculation of the probability density distributions.In addition, the five tool functions realize the data reading from the database,the interpolation for the density distribution map,the data sorting according to the major radius,the data reading from the ECE work log, and perform the Cholesky decomposition.
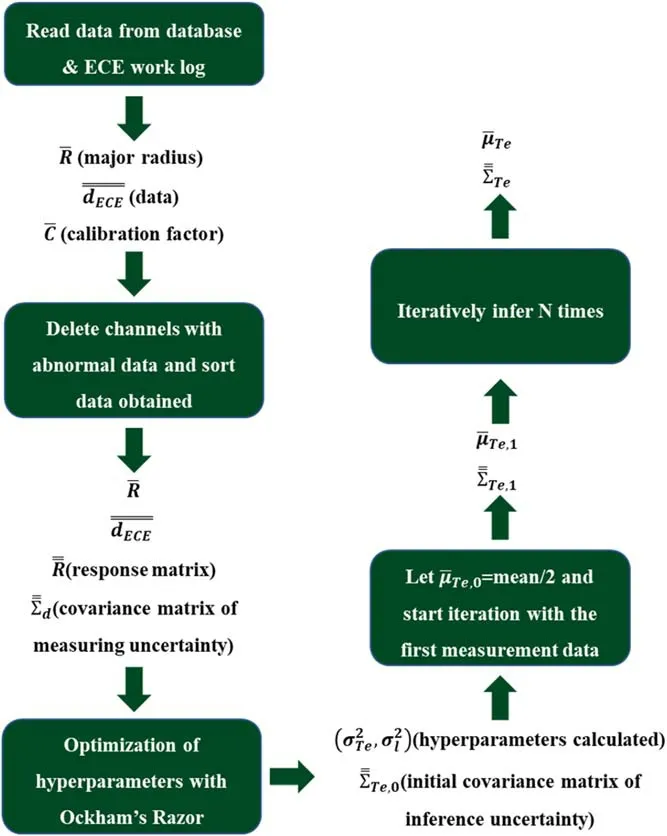
Figure 6.Implantation logic of the program.
2.5.Mathematical model for TS
Applying the BPT to the TS diagnostic system, it can be derived that
Moreover, the forward model can be written as
whereis the noise.
Considering a uniform prior PDF, the posterior PDF can be written as
In fact,in the real measurements,the data can be divided into two terms, and
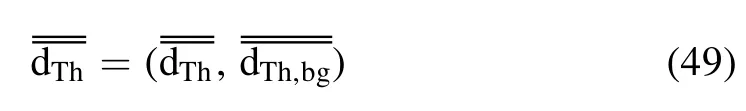
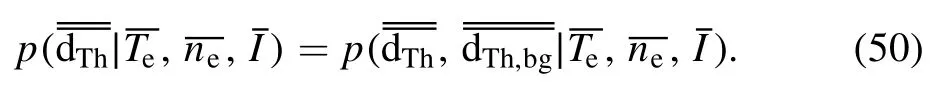
The TS system provides the data on Npspatial points with Ncspectral channels for each point.Thus,the likelihood can be derived as
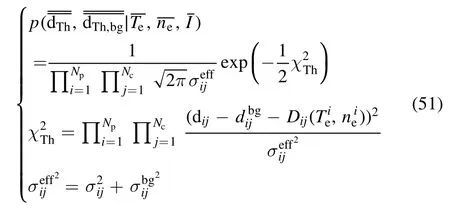
where Dijdenotes the ideal data with givenand it can be written as
It can be observed that due to the non-linearity brought by the forward model, the likelihood PDF and therefore the posterior PDF are no longer Gaussian.Hence, the Markov chain Monte Carlo method is needed to do sampling[21,22].
Regarding the model in the maximum likelihood method,it can be derived that
and,
Hamiltonian dynamics can be used to produce distant proposals for the Metropolis algorithm, thereby avoiding the slow exploration of the state space that results from the diffusive behavior of simple random-work proposals [23].Though originating in physics, Hamiltonian dynamics can be applied to most problems with continuous state spaces by simply introducing fictitious‘momentum’variables.A key to its usefulness is that Hamiltonian dynamics preserves volume,and its trajectories can thus be used to define complex mappings without the need to account for a hard-to-compute Jacobian factor, a property that can be exactly maintained even when the dynamics are approximated by discretizing time [24].To solve the nonlinear problem of the TS system,HMC (Hamiltonian Monte Carlo) sampler has been used in the inference program.By analyzing the result of the sampling distribution, the average value of electron temperatureis identified as the densest point in the sampling distribution while the uncertaintycan also be inferred.
2.6.Code logic for the model.
Firstly, the program will read data from the database and work log to get measurement dataand basic parameters including the calibration factor, and the spectral transmission coefficient of the shot chosen.Secondly, an HMC sampler with the logarithm posterior PDF is created.A MAP(maximum) estimation is used to approach the most possible Tevalue.Then,HMC sampling is done,and the average value of electron temperatureand the uncertaintycan be determined by the sampling distribution.
The computing program for TS is developed to infer the electron temperature at the point with scattering angle π/2.The program for TS consists of seven parts with four functions,and figure 7 presents the basic framework of the program.The seven parts realize in turn the functions of testing the Seldon factor,reading data, creating the Hamiltonian Monte Carlo (HMC)sampler, estimating MAP, adjusting parameters automatically,sampling, and visualizing samples.The first function computes the logarithm of the posterior PDF and the gradient concerning the electron temperature and the electron density.The three other parts calculate the term τij(λs)Y-1(λs)exp(-2ηX(λs)), the numerical integration, and the Selden factor.
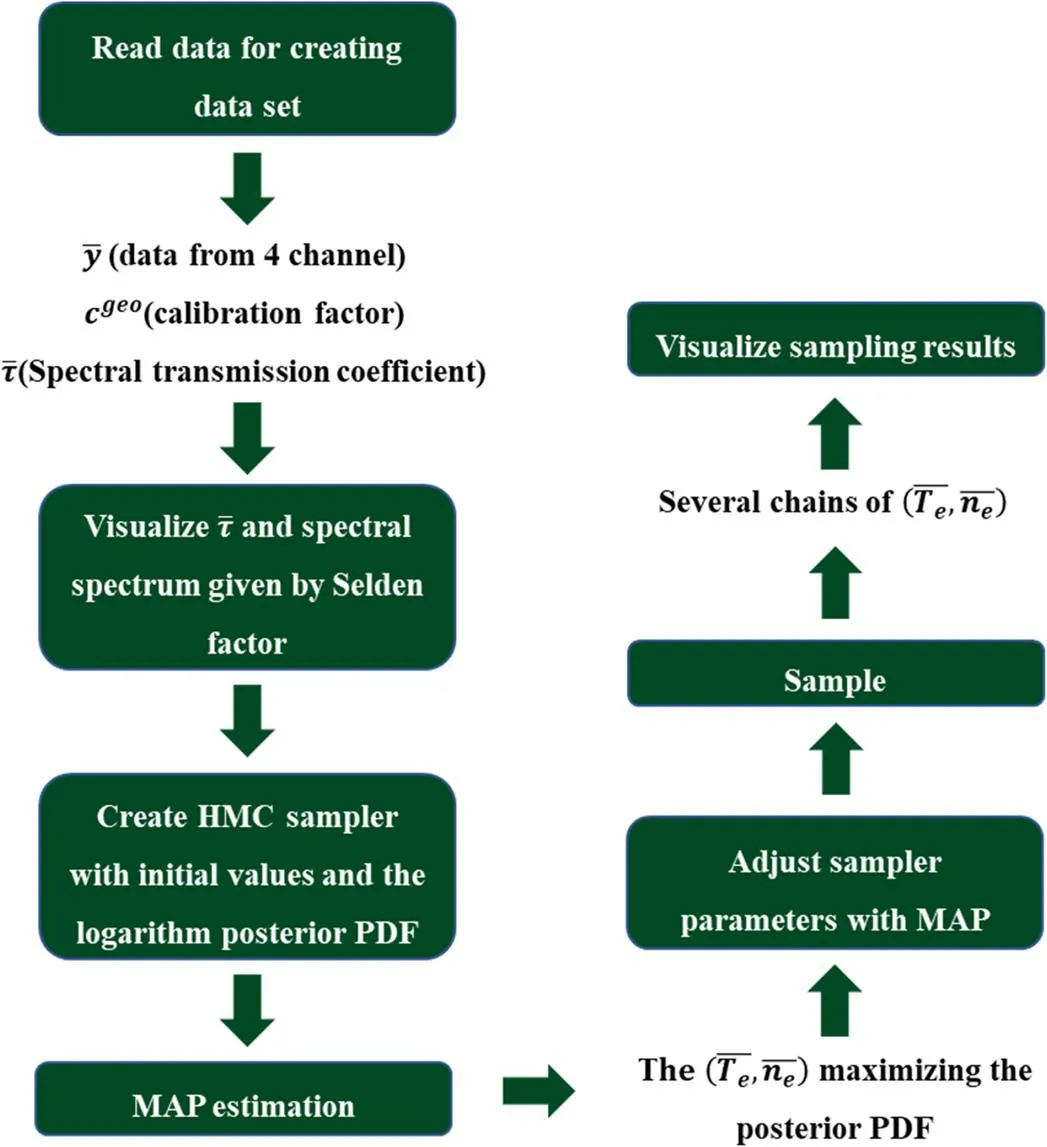
Figure 7.Implantation logic of the program.
3.Electron temperature results
3.1.Application to the ECE diagnostic
3.1.1.Hyperparameter optimization for the ECE diagnostic system on HL-2A.In this work,the discharge data at 500 ms of shot#32800 on HL-2A is used for the calculations.In shot#32800, the group of ECE2 is unavailable, and therefore only ECE1 and ECE3 are applied to obtain the diagnostic data.The results of hyperparameter optimization (see the hyperparameter optimization section above,whereandhas been summarized asfor the group ECE1 and ECE3 at 500 ms of the shot #32800 by maximizing the evidence are shown in figures 8(a) and (b), respectively.The abscissa represents the inference uncertainties of, and is added to the iteration as the initial standard deviation.The ordinate denotes the smoothness factors ofwhich represents the influential distance of the spatial measurement points.The colour of the figure quantifies the values of the evidence,where red represents greater evidence value and blue represents smaller evidence value, and the green square denotes the optimized point.It can be seen that= 0.198 and= 0.420, which means the inference uncertainty of group ECE1 is greater than that of group ECE3.For the smoothness factors,= 832 cm2and= 487 cm2, and thus it is obtained that σl,ECE1= 29 cm and σl,ECE3= 22 cm, which means that the inference is more smooth for group ECE1,compared with that of group ECE3.
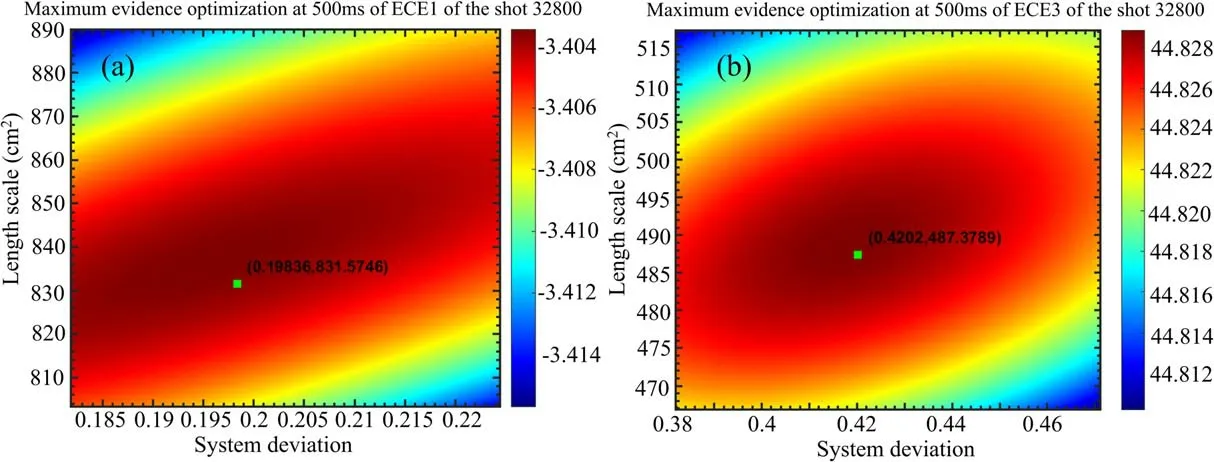
Figure 8.Optimized hyperparameters for ECE1 (a) and ECE3 (b).
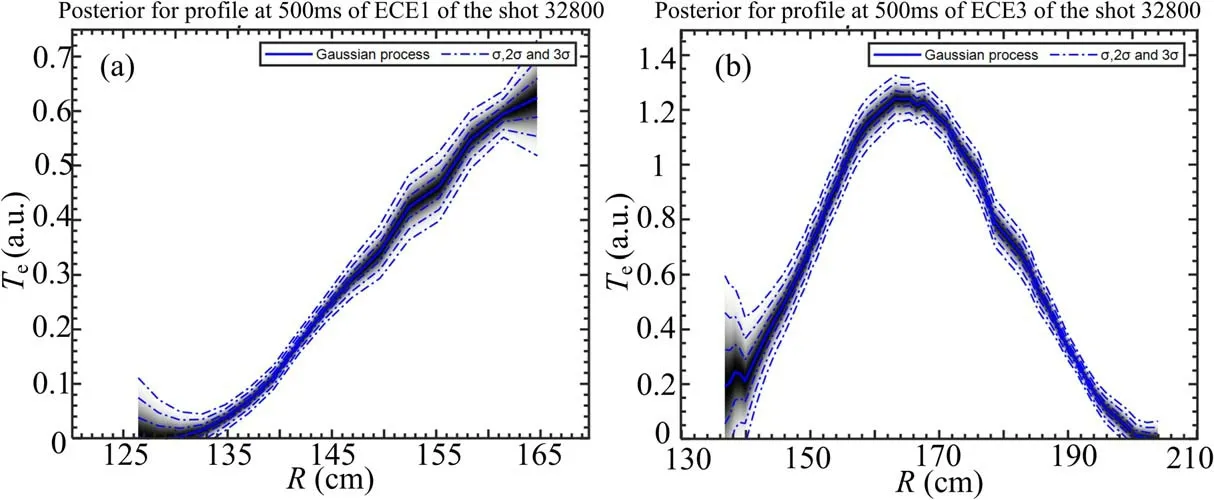
Figure 9.Posterior PDF of ECE1 (a) and ECE3 (b).
3.1.2.Posterior probability function distribution of the electron temperature.As mentioned in the multi-point model, the noise associated with the experimental measurement is assumed to have a Gaussian distribution.In other words,the measurement data on each measurement point follows the Gaussian distribution.Figure 9 shows the posterior probability function distribution for the ECE1 and the ECE3.The blue solid line represents the most probable electron temperature profile in the light of the measured data.The blue dotted lines denote respectively the standard deviation, the double standard deviation, and the triple standard deviation of Gaussian distribution, corresponding to the 68%Confidence Interval(CI),the 95%CI and the 99%CI, respectively.Additionally, the gray level represents the probability.The darker the colour is, the greater is the probability of this temperature.The electron temperature profiles obtained from ECE1 and ECE3 of the shot #32800 with posterior probability function distribution are an example of the abundant information that can be provided on the electron temperature for ECE diagnostic systems.
The previous program calculates the electron temperature profiles from the equation
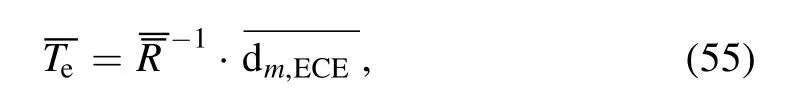
The electron temperature profiles obtained with the previous program for ECE1 and ECE3 are shown in figure 10.As shown in figure 10,the blue points denote the temperature calculated and the blue solid curve is fitted by the following formula
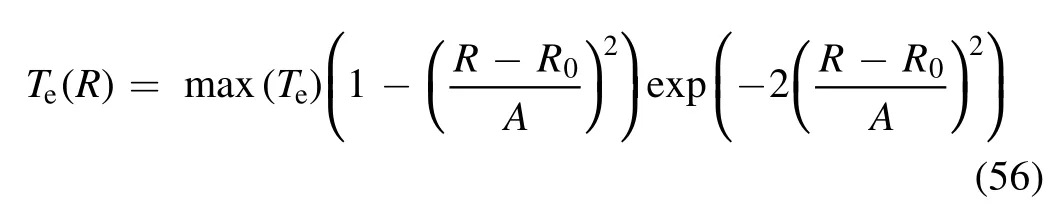
where A is the characteristic length.
By comparing the electron profiles obtained from the two methods, it can be concluded that, on the one hand, the inference with the BPT method can give the electron temperature with a confidence interval, which is quite essential for integrated data analysis with all diagnostic systems in the future.On the other hand,the correction of the electron temperature with BPT will be affected and corrected by the nearby points.
The uncertainty of the electron temperature with the amount of learning is shown in figure 11.It can be seen that for both ECE1 and ECE3, the errors of the electron temperature decrease with increasing iteration number,which reflects the characteristics of the Bayesian probability inference method.
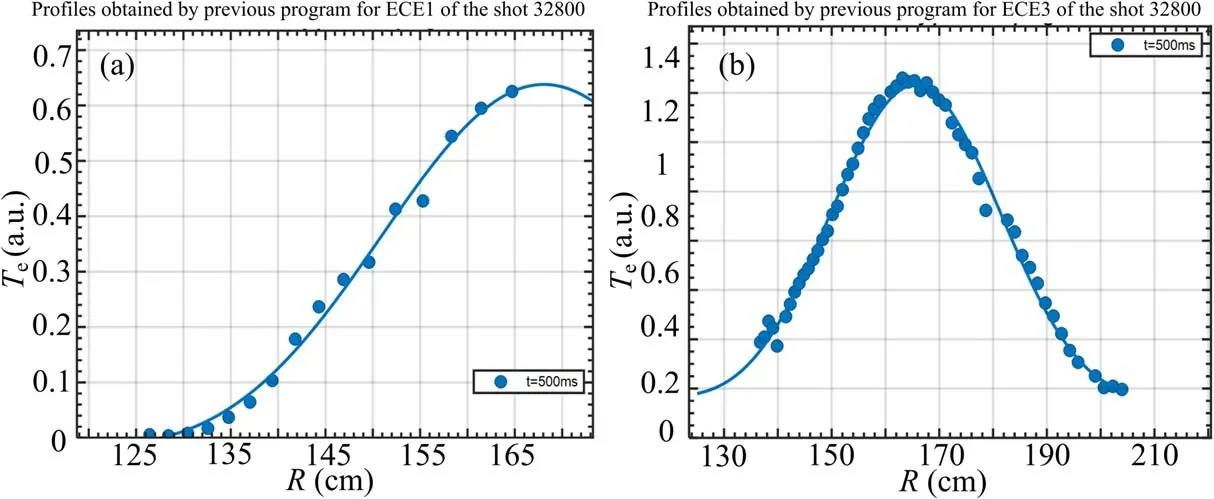
Figure 10.The electron temperature profiles obtained with the previous program for (a) ECE1 and (b) ECE3.
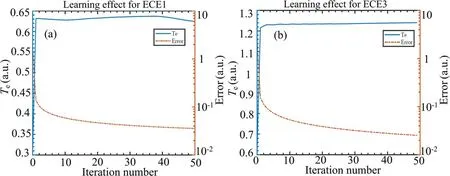
Figure 11.The uncertainty of the electron temperature with the amount of learning for (a) ECE1 and (b) ECE3.
Table 1 shows the computing time of the previous program and the program applying BPT.It can be seen that the new program consumes more computing resources due to the iteration inference,but it is still acceptable for present data processing.Therefore,this method can be used as a real-time diagnostic data processing tool on HL-2A.
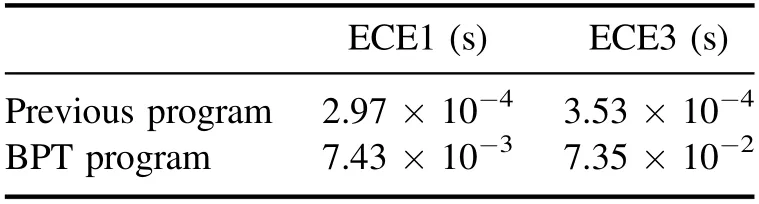
Table 1.The CPU time for different methods.
3.2.Application to the TS diagnostic
In this work, the data obtained from HL-2A are used to calculate the evolution of electron temperature with time at the point of π/2.Due to the lack of data for the geometrical factorthe electron density cannot be inferred correctly,thus the term A =is treated as a whole parameter for inference.
Figure 12 shows the sampling results at 2060 ms of shot#31019, which present similar performance to the sampling results of DINKLAGE A [25].Therefore, these results are reliable.From the frequency distribution of electron temperature in the diagrams,it can be seen that the posterior PDF is no longer a Gaussian distribution.
Figure 13 shows the electron temperature evolution with time calculated by the BPT inference of shot #31019.The abscissa denotes the time after discharge and the ordinate denotes the electron temperature.The black squares represent the temperature inferred with BPT and the error bars on the diagram denote the standard deviation of the inferred electron temperature,which convert to relative errors of around 10%-20%.The order of magnitude of these errors is regarded to be acceptable in the TS diagnostic on HL-2A.
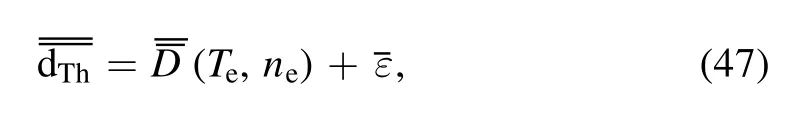
3.3.Electron temperature integrated data analysis
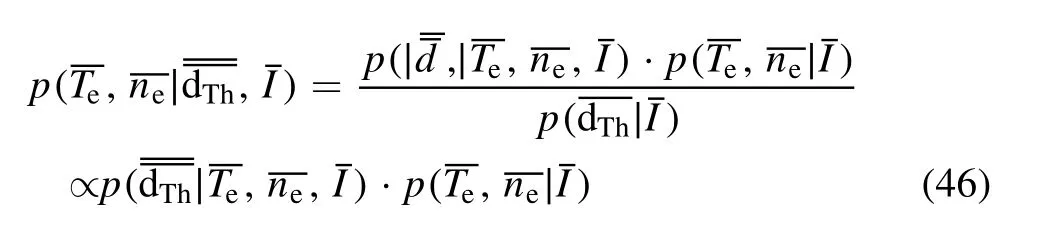
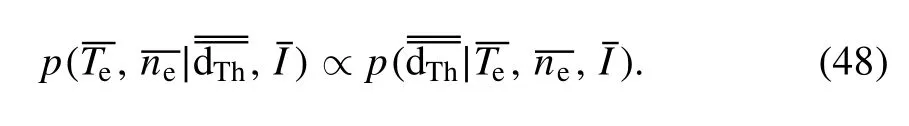
The posterior PDF of the electron temperature and the density profile can be written as equation (57) by applying the BPT,which considers the inference with the ECE diagnostic and the TS diagnostic together.
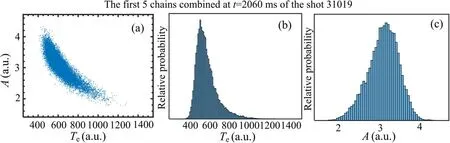
Figure 12.Sampling result of TS Bayesian inference at 2060 ms:(a)the scatter diagram between A and Te,(b)the distribution of the relative probability at different Te, and (c) the distribution of the relative probability at different A.
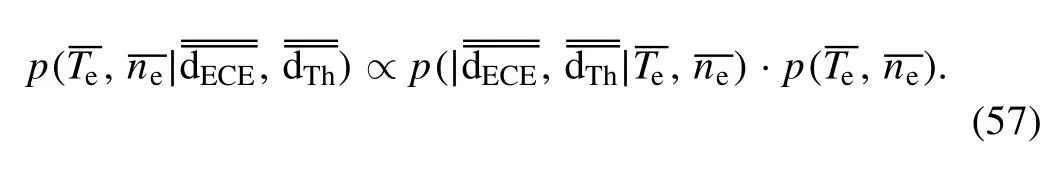
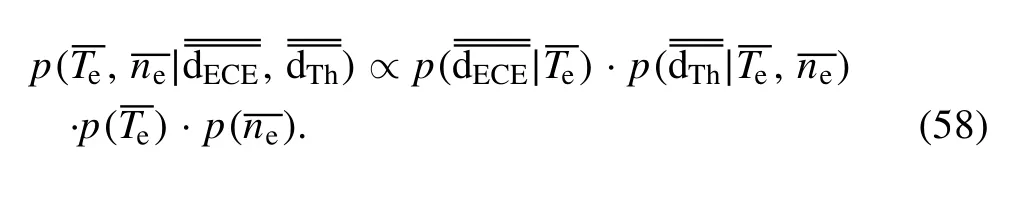
Due to the independence of the ECE diagnostic and the TS diagnostic, assuming that the ECE measurement depends only on electron temperature, then the posterior PDF can be decomposed as follows
Assuming that the noise associated with the experimental measurement can be reasonably represented by a Gaussian process, then the prior PDFs can be written as
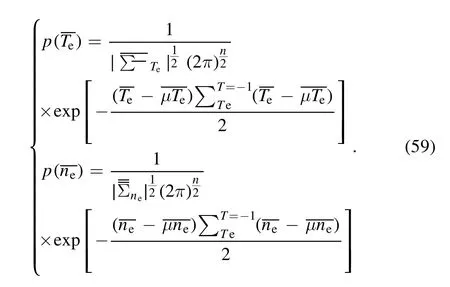
The likelihood PDFs can be written as follows
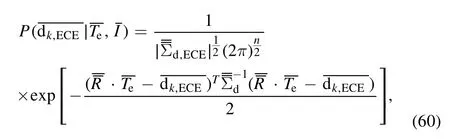
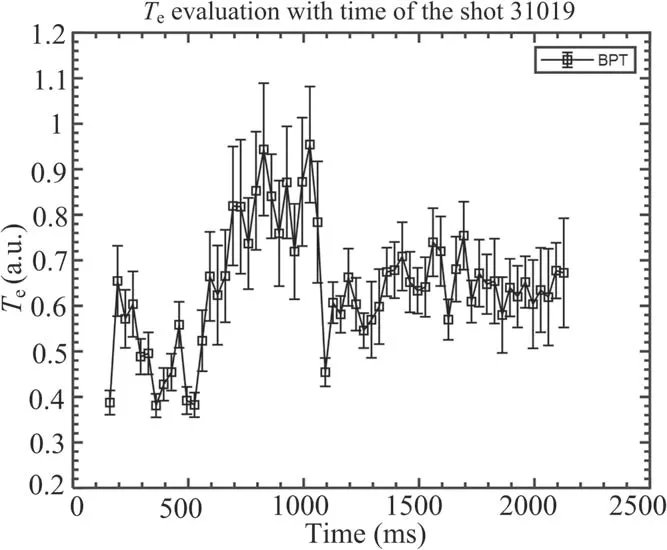
Figure 13.Evolution of the electron temperature with time of the shot #31019.
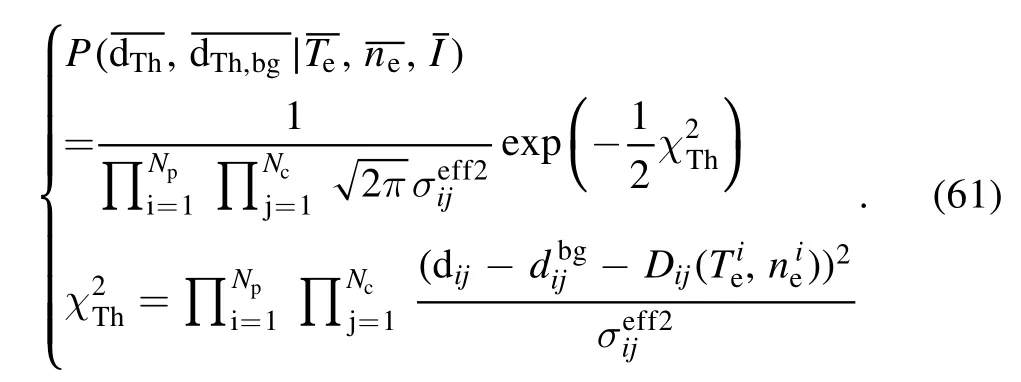
The three terms of the posterior PDF except the Thomson term are all Gaussian.Therefore, the posterior PDF can be simplified as a product of a Gaussian distribution and the Thomson term.However, it is important to note that the model becomes non-linear due to the Thomson scattering term and thus, the MCMC sampling is still needed for the IDA with these two systems.
For accuracy evaluation purposes,we firstly set a known Teprofile (represented by black squares in figure 14) from the previous typical inferred result on HL-2A, which lies on the high-field side,while a synthetic measurement was taken through the forward model of TS and ECE.From these synthetic measurements, three different inferences (namely the ECE inference,the TS inference,and the IDA inference)show different results.Finally, we evaluate the inference accuracy by comparing the results with the pre-set Teprofile,namely the phantom.Figure 14 shows the phantom test result and its relevant inference uncertainty,described as the 95% confidence interval, of the IDA result (represented by red triangles), together with the individual inference results from TS (represented by blue circles) and ECE (represented by green rhombuses).It should be stressed here that the ECE phantom test has only taken one measurement, thus the inference uncertainty remains relatively large compared to the previous result, where 50 experimental measurements could be taken.In the experiment, ECE has quite a high sampling rate,up to 50 kHz,while 50 measurements in 1 ms and the Teprofile has been considered as stable, thus 50 measurements could be used for the same Teprofile inference in 1 ms.It can be seen that TS and ECE can individually give inferences on the electron temperature profile by using Bayesian inference logic, while a lower uncertainty level can be achieved in IDA.In particular, in the core area of the plasma, roughly from 145 to 160 cm, both TS and ECE meet a considerable challenge in the accuracy.Although the TS case study gives the profile from the absolute error point of view,the smoothness of the inference result would present extra difficulty for the profile analysis.Typically, the theoretical analysis of micro-instability strongly relies on profile gradient.On the other hand,the individual ECE inference has larger absolute error, and the profile in the core area is poorly inferred.The combination of the measurements contain more information, and the IDA results give a much more reliable estimate of the Teprofile.
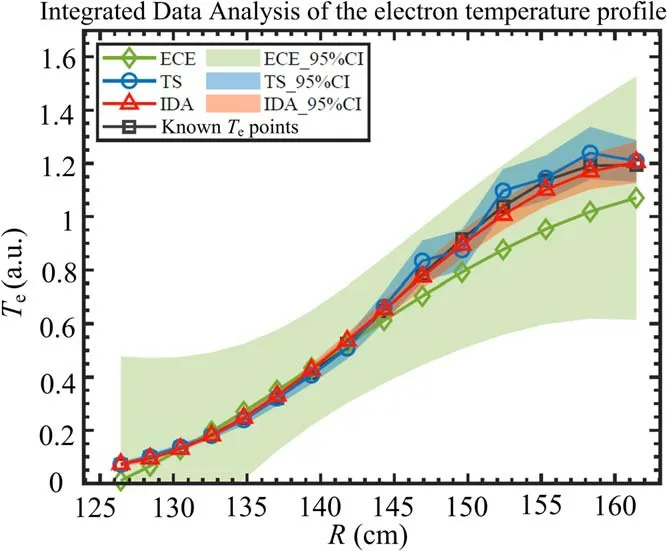
Figure 14.IDA of the electron temperature with ECE and TS.
Figure 15(a) displays the gradient of the Teprofiles and their uncertainty in the phantom test,while figure 15(b)is the corresponding error profile.It can be seen from the figure that the IDA provides the best inference among the three inferences, significantly improving the reconstruction of the Tegradient profile.The IDA inference will have a better performance during the experiments,as the ECE diagnostic data could be used during the phantom test.

Figure 15.The electron temperature gradient profiles (a) and the corresponding error profiles (b).
As a preliminary experimental demonstration, the IDA result of shot #38479 at three moments when the sawtooth crash appears is shown in figure 16.The IDA result produces a reasonable Teprofile and confidence interval.Note that in this shot, TS only has one measurement point in the plasma center.Due to the lack of information from TS, IDA keeps most diagnostic characteristics obtained by ECE.Further experimental validation will be investigated in a future study.
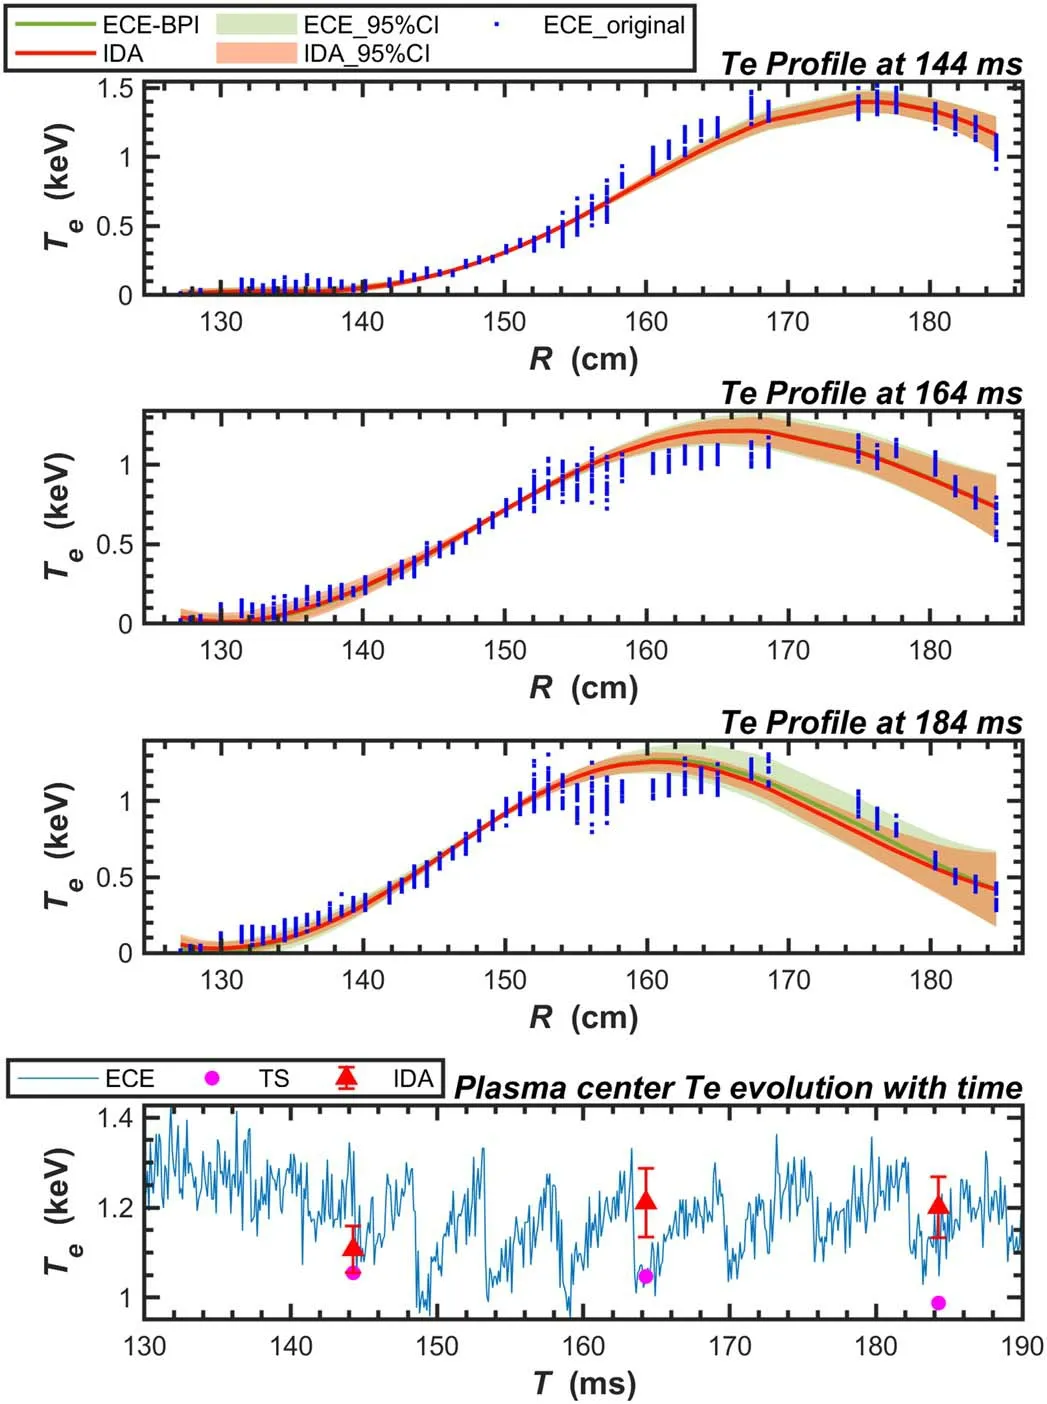
Figure 16.The IDA results of shot#38479 at 144 ms,164 ms,and 184 ms(note that in this shot TS only has one measurement point in the plasma center).
4.Conclusions
In this work, the Bayesian probability inference (BPI) of the Bayesian probability inference method has been applied to the electron cyclotron emission (ECE) and the Thomson scattering (TS) diagnostic on HL-2A/2M.The effects of integrated data analysis on the electron temperature of HL-2A are comprehensively demonstrated.It can be concluded that: (a)For the ECE diagnostic, the forward model between the data and the electron temperature is linear, thus the PDF is in Gaussian form, and the analytical expressions have been given.(b)The relevant program has been developed to deliver the electron temperature profile inference with a confidence interval, and the results with aggregable accuracy could be given in an extremely fast way, shedding light on real-time application.The integrated data analysis (IDA) model with ECE and TS diagnostic has been constructed for HL-2A/2M.(c)For the TS diagnostic,the forward model is in a non-linear form, where the posterior PDF is no longer Gaussian, and it should be inferred with the implementation of the Markov chain Monte Carlo (MCMC) sampling technique.(d) The Hamiltonian Monte Carlo (HMC) sampler is introduced to solve this non-linear sampling problem, and the program performed well in the phantom test.The application of experimental data for electron temperature profile evolution with time has been demonstrated on HL-2A.(e) The IDA model based on the ECE diagnostic and the TS diagnostic has been constructed, and the relevant phantom test results show that a full profile of the electron temperature can be obtained.The diagnostic information is more comprehensive and abundant with IDA.The reconstruction accuracy of the electron temperature profile and its gradient profile has been significantly improved by using IDA.
The IDA method used in this work has been successfully applied in the diagnostic of the electron temperature profile of HL-2A.The Ramen calibration for the TS diagnostic will be performed in the coming experiments, and the programs developed in this work will be widely applied as important guidance for future experiments.
Acknowledgments
This work was supported by the National Magnetic Confinement Fusion Energy Research and Development Program of China(Nos.2019YFE03090100,2019YFE03040004),and the National Science Foundation for Young Scientists of China (No.12005052).
 Plasma Science and Technology2022年5期
- Plasma Science and Technology的其它文章
- Prompt acceleration of a μ+ beam in a toroidal wakefield driven by a shaped steeprising-front Laguerre-Gaussian laser pulse
- The influence of weak transverse magnetic field on plasma dissipation process in the post-arc phase in a vacuum interrupter
- Numerical study of the effect of coflow argon jet on a laminar argon thermal plasma jet
- On the green aurora emission of Ar atmospheric pressure plasma
- Dynamic characteristics of multi-arc thermal plasma in four types of electrode configurations
- Formation and destruction of striation plasmas in helium glow discharge at medium pressures