
Signal-to-noise ratio of Raman signal measured by multichannel detectors?
2021-09-28 02:20:44XueLuLiu劉雪璐YuChenLeng冷宇辰MiaoLingLin林妙玲XinCong從鑫andPingHengTan譚平恒
Chinese Physics B 2021年9期
Xue-Lu Liu(劉雪璐),Yu-Chen Leng(冷宇辰),2,Miao-Ling Lin(林妙玲),Xin Cong(從鑫),2,and Ping-Heng Tan(譚平恒),2,?
1State Key Laboratory of Superlattices and Microstructures,Institute of Semiconductors,Chinese Academy of Sciences,Beijing 100083,China
2Center of Materials Science and Optoelectronics Engineering&CAS Center of Excellence in Topological Quantum Computation,University of Chinese Academy of Sciences,Beijing 100049,China
Keywords:multichannel detectors,signal-to-noise ratio,dark noise,shot noise
1.Introduction
The successful exfoliation of the first true twodimensional structure,monolayer graphene,[1]stimulates intense interest in two-dimensional materials(2DMs).[2,3]In 2DMs,the atoms within each layer are joined together by covalent bonds,while adjacent layers in 2DMs are weakly coupled to each other and can be easily exfoliated and isolated down to monolayer and few layers.The quantum confinement in atomic scale and the presence of interlayer coupling in multilayer 2DMs make their electronic and optical properties varying with layer number.[4]Plenty of spectroscopic techniques[5–9]have been used to characterized these novel properties of 2DMs.Among them,Raman spectroscopy,one of the most important nondestructive,fast and relatively inexpensive characterization tools,can provide abundant structural and electronic information with high spatial resolution at both laboratory and mass-production scales,which has been widely used to characterize layer numbers,interlayer coupling and layer-stacking configurations of 2DMs.[10–13]

Although Raman spectroscopy has shown lots of advantages in the characterization of 2DMs and vdWHs,the efficiency of Raman scattering is extremely low in comparison with other optical processes.Moreover,various noise signals could also be captured by the detector in Raman measurements,which further brings difficulties to spectrum analysis and peak assignment of weak Raman signals.Optimizing detection performance and reducing noise are common desires from scientific instrument companies as well as researchers.Signal-to-noise ratio(SNR or S/N ratio)is a commonly used estimator of a Raman system’s ability to extract analytical information of Raman signals from noise signals.The SNR largely depends on the estimation of noise in spectra.But it is still a subject of ongoing debate and confusion to determine the noise level from the experimental Raman spectrum.[28–33]It is of great practical significance to overview the different noise sources and their influences on SNR,and further to experimentally estimate SNR of Raman spectrum taken by multichannel detectors.
The noise level of the detector in Raman instrument is one of the main factors that affect the SNR and is also an important indicator to evaluate the performance of a detector.It is very important to choose a detector with low noise and high sensitivity for Raman measurements.Multichannel detector has high quantum efficiency,which can greatly reduce the time of signal acquisition in comparison with single-channel detector.The widespread popularity of multichannel detectors greatly promotes the application of Raman spectrometer in experimental research and the development of portable Raman spectrometer.For single-channel detector in traditional Raman system,the inhomogeneous current fluctuation would lead to noise level variation in consecutive acquisitions.Therefore,the statistical analysis of SNR should be based on the capture of single datum performed by single-channel detector with multiple acquisitions.In contrast,multichannel detectors used in modern Raman spectrometer generally consist of hundreds to thousands of independent photo-sensors or pixels in onedimensional direction to collect Raman signals with different wavelengths at the same time,which makes it unrealistic in technology to evaluate the SNR for Raman signal by monitoring each pixel with multiple acquisitions.Because every pixel in multichannel detector is expected to have basically the same quality and performance,it is reasonable to statistically analyze the pixels around the signal peak in one measurement to evaluate the general performance of the multichannel detector due to the high density of data in Raman spectrum.However,multichannel detector can be designed to work at different temperatures with software-selectable gains.Different detectors also exhibit specific non-uniformity and nonlinearity in photoelectric response.For example,the non-uniformity in photoelectric response of InGaAs(IGA)array detector can be up to±10%.Thus,the noise level,photoelectric response and efficiency of different pixels of a charge-coupled-device(CCD)detector and IGA detector can vary in a large range.In this case,in order to obtain the intrinsic noise level of multichannel detector,two or more Raman measurements are necessary to exclude the effect of non-uniformity and nonlinearity between different pixels.As the non-sample noise source has changed from inhomogeneous current fluctuation in single-channel detector to the non-uniformity of pixels in multichannel detector,the noise analysis for SNR estimation has changed accordingly.It is of great practical significance to propose more adaptive SNR evaluation methods based on a few acquisitions of spectra taken by multichannel detector.
In this mini-review,we will firstly address the recent investigations of 2DMs studied by Raman spectroscopy in Section 2,and then overview the importance of SNR in Raman spectroscopy in Section 3.Sections 4 and 5 will introduce different noise sources and experimentally analyze their influences on SNR of Raman signal detected by CCD detectors and IGA array detector.Finally,in Section 6,a generic analytical method is provided to estimate SNR of the measured Raman signals.
2.Recent advances on Raman spectroscopy of two-dimensional materials
Since the 1960s,the introduction of laser light sources,the development of weak signal detection techniques and computer applications have led to the rapid development of Raman spectroscopy technology and made it widely used in scientific and industrial applications to characterize lattice structure and physical properties of materials.[34]In recent years,the unique properties of graphene[35]triggered a huge amount of innovative scientific researches and experiments on 2DMs.As a non-destructive technique,Raman spectroscopy becomes increasingly important in the area of 2DMs.As mentioned before,Raman spectra of 2DMs contain interlayer and intralayer modes.In 2DMs,there are two types of interlayer modes,i.e.,the shear(S)and layer-breathing(LB)modes,which correspond to the relative motions of the atom planes parallel and perpendicular to the basal plane,respectively.In general,several branches of the S and LB modes can be observed in 2DMs.[36]For an N-layer(NL)2DM,there are N?1 pairs of S modes and N?1 LB modes,which are denoted as SN,N?jand LBN,N?j(j=1,2,...,N?1).Among them,SN,1(LBN,1)(i.e.,j=N?1)is the one with the highest frequency while SN,N?1(LBN,N?1)(i.e.,j=1)is the one with the lowest frequency.The frequencies of the S and LB modes are sensitive to interlayer coupling and can be well described by the linear chain mode(LCM).[19,36,37]Based on LCM,each layer of an NL 2DM can be treated as a single ball so that the 2DM can be simplified as a linear chain with balls in which only nearest-neighbor interlayer interaction is considered.Assuming that the nearest-neighbor force constants per unit area for the S and LB modes areα‖0 andα⊥0,respectively,the corresponding dynamic matrix can be built up.[38]By solving the dynamic matrix,the frequencies of the SN,N?jand LBN,N?jmodes in the NL 2DMs can be,respectively,expressed by[36]
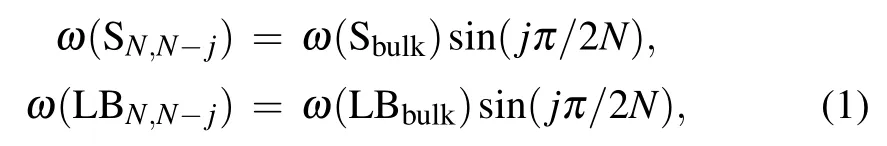
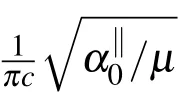
Figure 2(a)shows the typical layer-dependent interlayer modes in 2H-stacked N layer MoTe2(NLM).Both S and LB modes show significant dependence on the layer number N.The observed S modes come from the branch(j=N?1)whose frequency increases with increasing N,while the observed LB modes come from the branches(j=1,3)whose frequencies decrease with increasing N.Interlayer modes are also observed experimentally in vdWHs,[41,42]such as twisted multilayer MoTe2(also denoted as t(m+n)LM),[43]as illustrated in Fig.2(b).More LB modes arise in t(m+n)LM due to their low lattice symmetry.For S modes,only the S modes of the mLM and nLM constituents can be observed in Raman spectra,for example,S3,1in t(1+3)LM and t(2+3)LM(Figs.2(c)and 2(d)).No S mode is observed in t(1+1)LM.The experimental(blue diamonds and red circles)frequencies of interlayer modes in NLM and t(m+n)LM are summarized in Figs.2(c)and 2(d),respectively,showing good agreement with the theoretical(blue and red crosses)results that calculated by LCM.The results indicate that interface twist exhibits a little influence on the LB coupling strength in t(m+n)LM,andω(LB)is only determined by the total layer number N of t(m+n)LM(N=m+n).While the twisted interface weakens the interfacial shear coupling between the constituents of t(m+n)LM so that only the S modes of the mLM and nLM constituents can be observed in Raman spectra.Similar results have been observed in other vdWHs.[44,45]Based on the above discussions,one can conclude that,the total layer number of vdWH and its constituents can be identified according to the observedω(LB)andω(C),respectively.
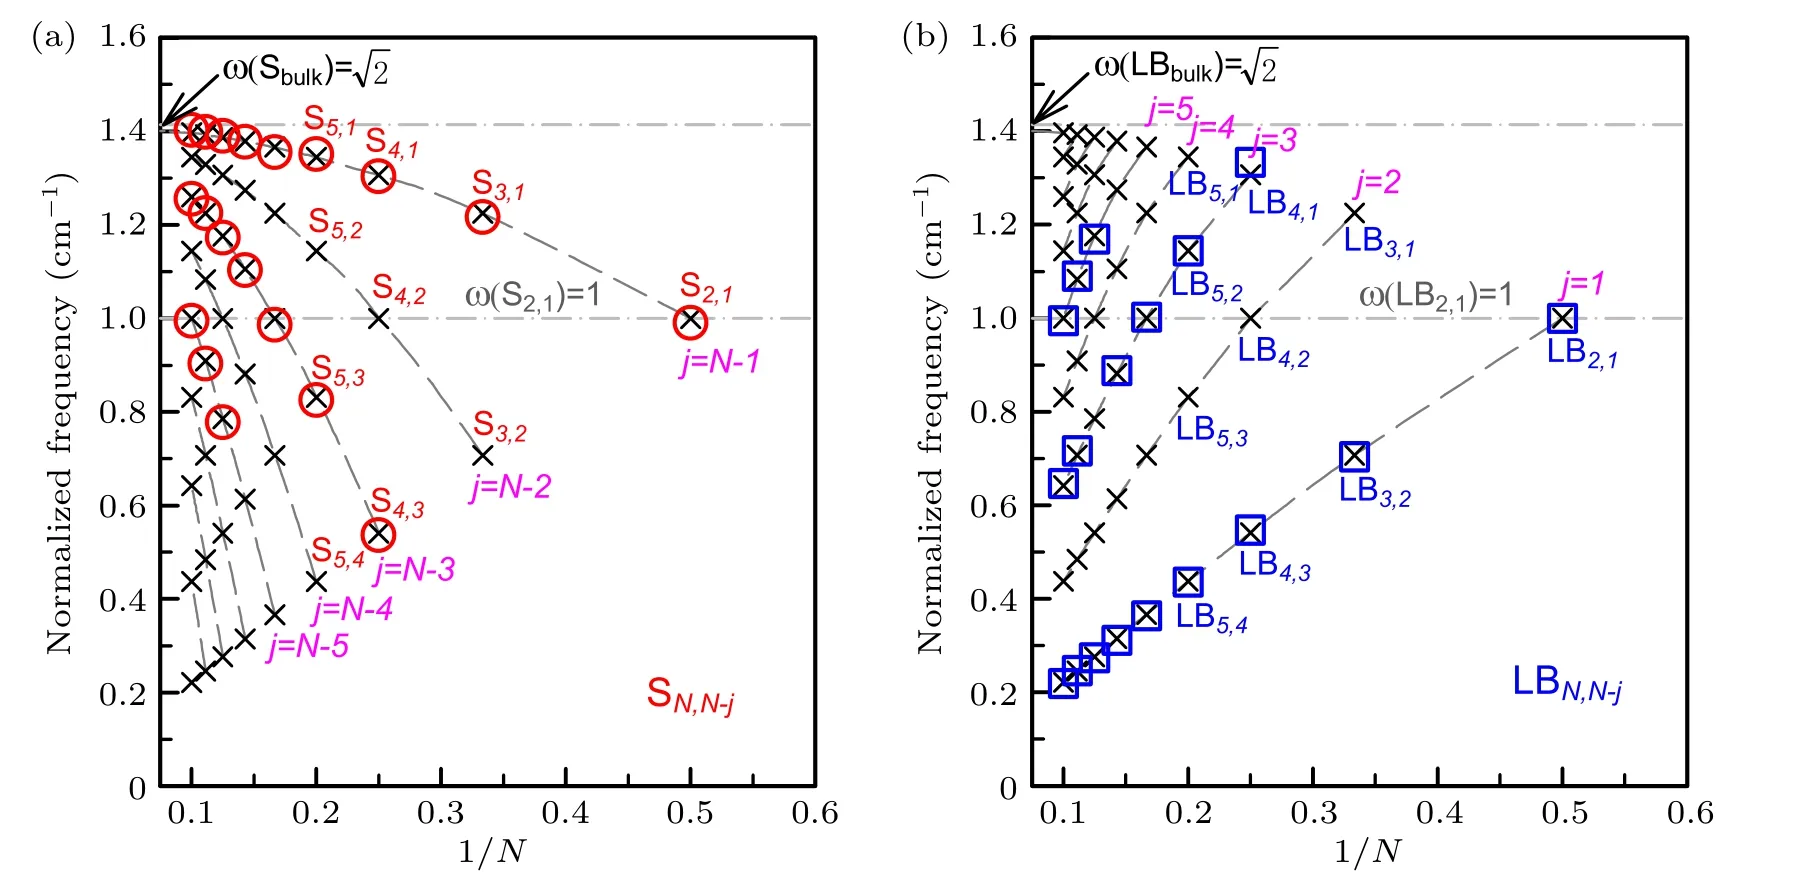
Fig.1.The frequencies of the interlayer S(a)and LB(b)modes in NL 2DMs as a function of inverse layer number(N),whereω(S2,1)and ω(LB2,1)are normalized to 1.The circles in(a)and squares in(b)are the normalized experimental frequencies[9]of the S and LB modes in NL MoS2 by the correspondingω(S2,1)andω(LB2,1),respectively.Reproduced from Ref.[36].Copyright 2016,the Royal Society of Chemistry.
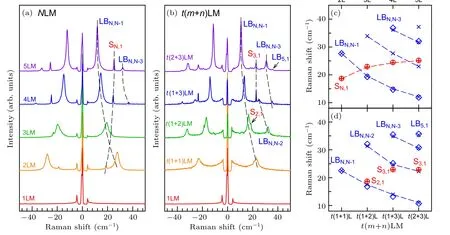
Fig.2.Raman spectra of interlayer modes in(a)NLM and(b)t(m+n)LM.The calculated frequencies of S(red crosses)and LB modes(blue crosses)in(c)2LM-5LM and the corresponding(d)t(m+n)LM based on LCM.The experimental frequencies of the S(red circles)and LB(blue diamonds)modes are also shown.
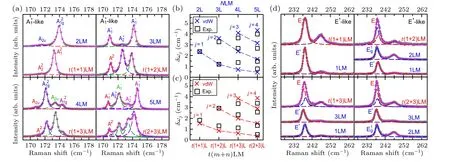
Fig.3.(a)The Raman spectra of Davydov splitting between Davydov entities of A′1-like modes of MoTe2 in t(m+n)LM and the corresponding NLM(N=m+n)at 4 K(gray crosses).The corresponding experimental(black squares)and calculated(crosses)frequency differences between each Davydov entity and the uncoupled one in(b)2LM-5LM and(c)t(m+n)LM.(d)The Raman spectra of E′-like modes in t(m+n)LM as well as its constituents mLM and nLM at 4 K(gray crosses)and the fitting results(dashed lines).Reproduced from Ref.[43].Copyright 2021,the Royal Society of Chemistry.

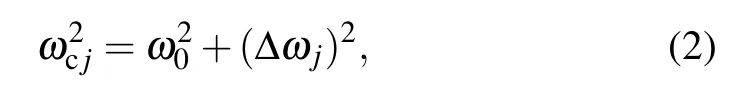
where j=1,2,...,N?1.The calculated frequency differences(δωj)between the coupled entities(ωcj)and uncoupled entity(ω0)in NLM and t(m+n)LM are depicted in Figs.3(b)and 3(c),respectively.The calculatedδωjare consistent with the experimental results.Based on the vdW model,the following equation can be easily obtained:
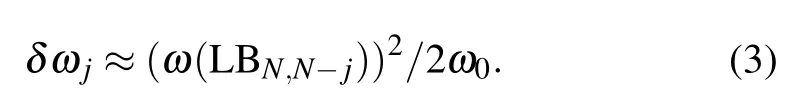
Because the weaker interfacial coupling at twisted interface results in smallerω(LBN,N?j),δωjin t(m+n)LM are smaller than those in corresponding NLM.In contrast to obvious Davydov splitting in out-of-plane intralayer modes,Davydov entities of the in-plane intralayer mode,E′-like mode,can not be resolved in t(m+n)LM and NLM.The spectral profile of the E′-like mode in t(m+n)LM can be fitted by those of the corresponding modes in nLM and mLM,as illustrated in Fig.3(d),suggesting that the in-plane intralayer modes in t(m+n)LM are localized within its constituents,similar to the case of the corresponding interlayer S modes.The investigation on Davydov splitting promotes the understanding of the effect of interlayer/interfacial coupling on the in-plane and out-of-plane intralayer modes in pristine and twisted 2DMs.
3.Importance of SNR in Raman spectroscopy
Compared with optical processes such as absorption,photoluminescence and Rayleigh scattering,the efficiency of Raman scattering is extremely low,which makes it quite difficult to detect weak Raman signals in the early years of Raman spectroscopy acquisition.How to design and build a Raman spectroscopy system with high efficiency has always been the goal of scientific instrument companies and researchers.Various noise signals could also be captured by the detector along with weak Raman signals in Raman measurements.The noise signals include photon signals from lasers,samples,optical components and external environment that are not the target of the analyzed Raman signals,such as PL,thermal radiation,stray light as well as ambient photons outside Raman system.These interferences may limit the accuracy of quantitative analysis or even determine whether the Raman feature is valid.

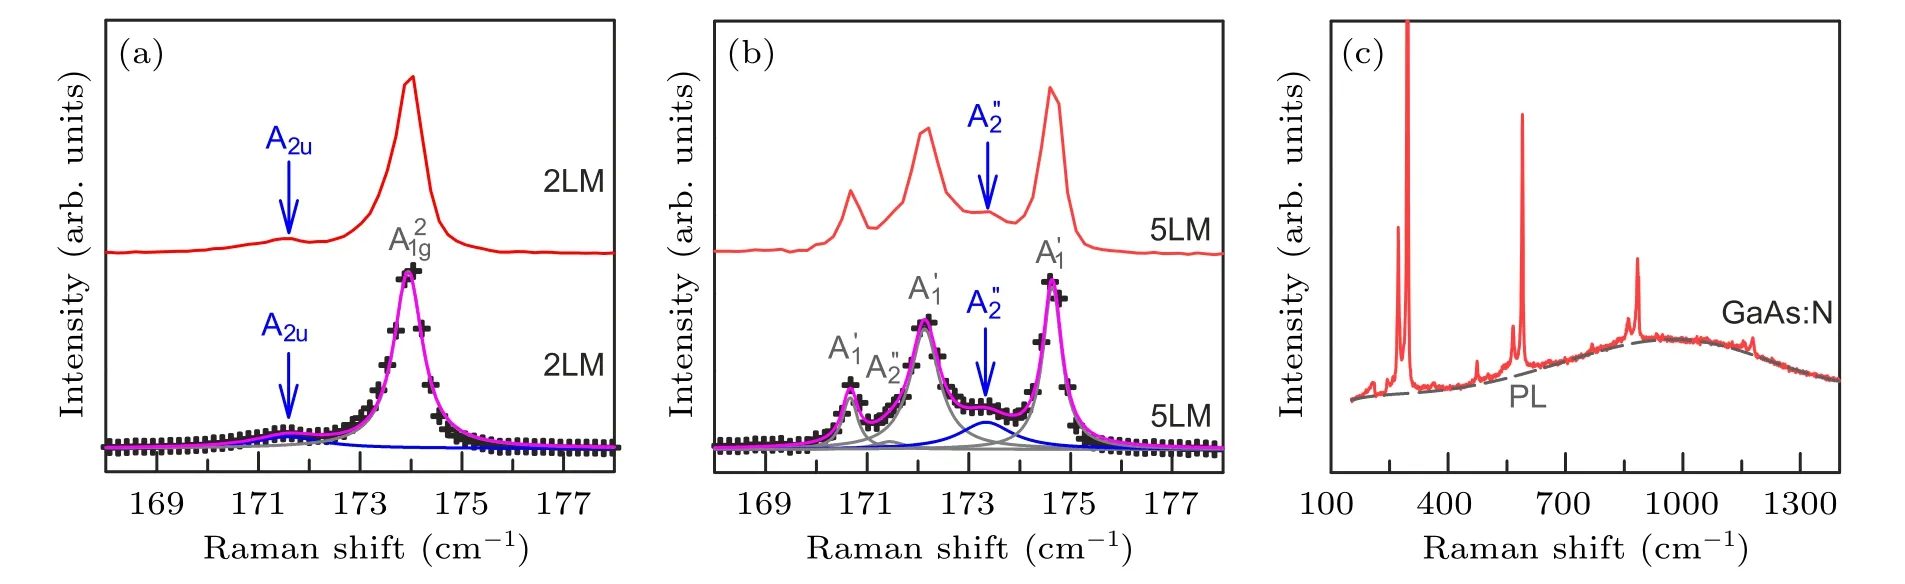
Fig.4.The Raman spectra of -like modes in(a)2LM and(b)5LM as well as the corresponding fitting results.(a)and(b)are adapted from Ref.[43].Copyright 2021,the Royal Society of Chemistry.(c)Typical Raman spectra of GaAs:N with a prominent PL background.
Because intensity scale and quantum efficiency may be incomparable in different Raman systems,SNR is always utilized in Raman measurement to evaluate the ability of a Raman system to extract analytical information from noises,instead of Raman signal intensity itself.SNR is also widely used in spectrum acquisition and image processing to indicate spectral quality.Since Raman spectrum contains not only the Raman signal but also baseline associated with various noises,the quantitative estimation of SNR is still a subject of ongoing debate and confusion in different applications.The most general definition of SNR is the ratio of the mean peak height above the baseline to the standard deviation of the peak height.[28–31]Another definition of SNR is the peak height above the baseline relative to the baseline noise[32]or the root mean square(RMS)of a flat region of the spectrum.[33]Sometimes signal-to-background ratio(SBR)is used instead,which is defined as the peak height above the baseline relative to baseline amplitude(baseline maximum minus baseline minimum).[32,51]Among these definitions,the key issue is how the noise level is determined from the experimental Raman spectrum,which affects the resulted SNR value accordingly.This may trouble the accurate indication of spectral quality and mislead the performance comparison between different Raman systems.
In the following,we will overview the various noise sources and take the commonly used CCD and IGA detectors as examples to discuss how to evaluate the SNR of Raman signal measured by Raman spectrometer without artificial background substraction and the influence of noise sources on the SNR.Based on this,strategies to improve the SNR ratio of Raman spectroscopy are proposed.
4.Noise analysis of dark spectrum measured by CCD detectors
As illustrated in the introduction,the SNR analysis of a Raman signal is directly related to the standard deviationσof this Raman signal after multiple measurements by a singlechannel detector or a single pixel of multichannel detector.The standard deviationσis defined as the RMS value of a set of measured values,which describes the mean value of all data’s deviations from average and elucidates the degree of dispersion of a data set.Suppose the measured data are y1,y2,...,yN,and their average value isˉy,thenσcan be described as
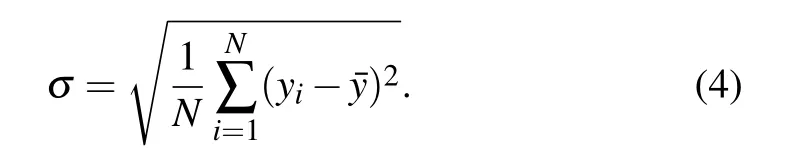
The smaller theσ,the less discrepancy of these values from the average.σcan also be estimated from the fitting to the measured values by the probability density function of Gaussian distribution,i.e.,
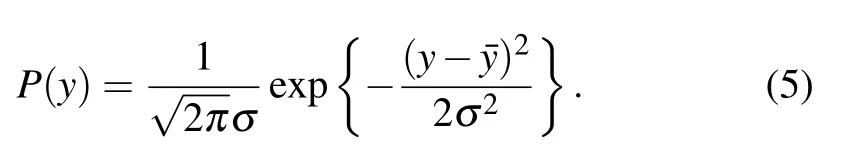
The probability(or confidence level)of the measured values lying in the confidence interval of[ˉy?σ,ˉy+σ]is 68%.A higher confidence level generates a wider confidence interval,for example,95%and 99.7%confidence levels correspond to confidence intervals of[ˉy?2σ,ˉy+2σ]and[ˉy?3σ,ˉy+3σ],respectively.This indicates thatσcan be roughly estimated by these two confidence intervals from the measured difference spectrum immediately.
In the absence of light,signal detected by detectors is the so-called dark signal,and its corresponding spectrum is known as dark spectrum.The higher the noise in the dark spectrum,the weaker the ability of the spectrometer to detect weak Raman signals.It should be noted that different CCD detectors have their distinct electronic offsets(or electronic bias),which lead to additive offset in the acquired counts or intensity of Raman spectrum.[52]This electronic offset is artificially set to ensure that the analogue-to-digital converter in CCD detector always receives positive signals.[53]Dark noise inherently exists in detectors due to the thermal agitation of electrons in the detector.It is commonly related to the dark signal of the detector that is produced in the absence of light.In principle,both the electronic offset and dark signal are present in a dark spectrum where no light is detected by detector.For LN2-cooled or TE-cooled CCD detectors working stably below?55°C,the dark signal is negligible and only electronic offset(~980 counts in Fig.5(a))are present in the dark spectrum.Raman software has an option to simply deduct this additive offset immediately after the spectrum acquisition and directly provides the resulting spectrum without the electronic offset,as shown in Fig.5(b).Because every pixel of the LN2-cooled or TE-cooled CCD detectors usually has the same quality and performance,one can statistically analyzeσin the dark spectrum measured by all the CCD pixels in a single acquisition,instead of a single CCD pixel with multiple measurements.As shown in Fig.5(c),we applied the fitting of the probability density function with Gaussian distribution(Eq.(5))to the data in Fig.5(b)and obtainedσof 3.6 for the dark spectrum.Thisσindicates the ability of the CCD detector to acquire Raman spectra with high quality.The smallerσ,the better ability of the CCD detector to measure the weak Raman signal emerging from the noise.
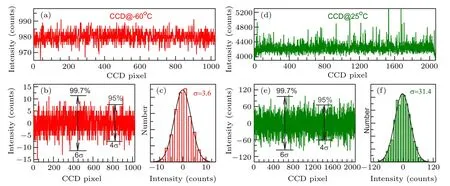
Fig.5.(a)Typical raw dark spectrum detected by CCD detector working at?60 °C.(b)The spectrum with the electronic offset already deducted from(a).(c)The statistical distribution of the counts of(b)withσ=3.6.(d)Typical raw dark spectrum detected by CCD detector working at 25 °C.(e)The difference spectrum of two successive measurements of(d).(f)The statistical distribution of counts of(e)withσ=31.4.The acquisition time of(a)and(d)is 1 second.

5.Overview of noise sources in measured Raman spectrum
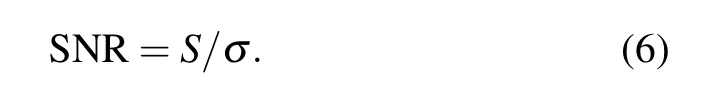
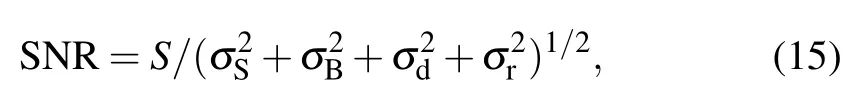
As discussed in Section 3,the SNR of the measured Raman signal is universally defined as the ratio of its peak height(S)to its standard deviationσ[28–31]
The determination of SNR requires the estimation of noise in a spectrum.In principle,σof the Raman signal mainly comes from the following independent aspects:[28]
σS—standard deviation of the Raman signal of interest;
σB—standard deviation of the background,including the uninterested Raman signal and the irrelevant photon signals from lasers,samples,and ambient light sources;
σd—standard deviation of the dark signal;
σF—flicker noise,also known as 1/f noise;
σr—readout noise.
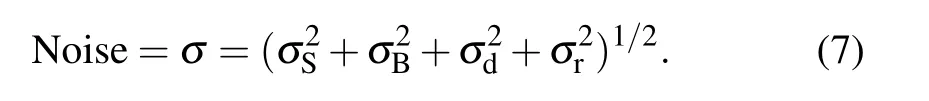
Among these noise sources,σSoriginates from the intrinsic property of the signal,which is independent of instrument and cannot be eliminated.σB,σd,σFandσrare basically instrument-dependent and vary in different devices.Flicker noise is related to the fluctuation in electronic components.It can usually be reduced to a negligible level for multichannel detectors in a well-designed instrument,while a scanning system is very sensitive to the flicker noise depending on the flicker frequency.[28]Therefore,to discuss SNR of Raman signal measured by multichannel detectors,the noiseσis estimated by adding the aforementioned contributions except flicker noise
In this section,we will overview the various noise sources ofσbased on the analysis in Ref.[28],and further discuss their influences on SNR based on the original Raman spectra measured by CCD detectors and IGA array detector.The following Raman spectra are mainly detected by two typical Raman systems.The home-made SmartRaman confocal micro-Raman module(developed by Institute of Semiconductors,Chinese Academy of Sciences)coupled with a Horiba iHR550 spectrometer,and a thermoelectric(TE)-cooled Si CCD detector is utilized for Raman measurement under the 633 nm excitation of a He–Ne laser.This module is also coupled with fiber-optic spectrometer Maya2000 Pro with backthinned CCD detector working at room temperature.A Horiba HR800 micro-Raman system equipped with a liquid-nitrogencooled(LN2-cooled)linear-array IGA detector and liquidcooled Si CCD detector is utilized for Raman measurements under 671 nm and 1064 nm excitations.
5.1.Signal shot noiseσS
Signal shot noiseσSis caused by the random arrival at the photodiode of the scattered photons,which is a fundamental process to probe Raman signal and exists in all kinds of photodetectors.Due to the particle-like nature of light,the number of photons arriving at the photodiode cannot stay constant all the time,even if the intensity of the scattered light is a constant.Such random fluctuation occurs when counting photons one by one,thus the corresponding noise is called as shot noise.In principle,a discrete random variable of the number of event occurrences is said to have a Poisson distribution,if the events occur with a known constant mean rate and independent on time.Although the scattered photons arrive at the detector randomly,the number of scattered photons captured by the photodetector per unit time˙S stays constant.Thus,the number of the scattered photons arriving at the photodiode follows the Poisson distribution,in which the probability of a given number of the photons arriving at the photodiode in a fixed time interval of t can be described as
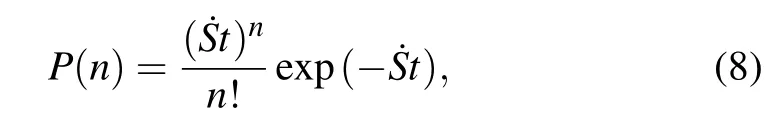

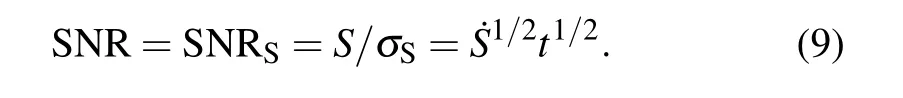

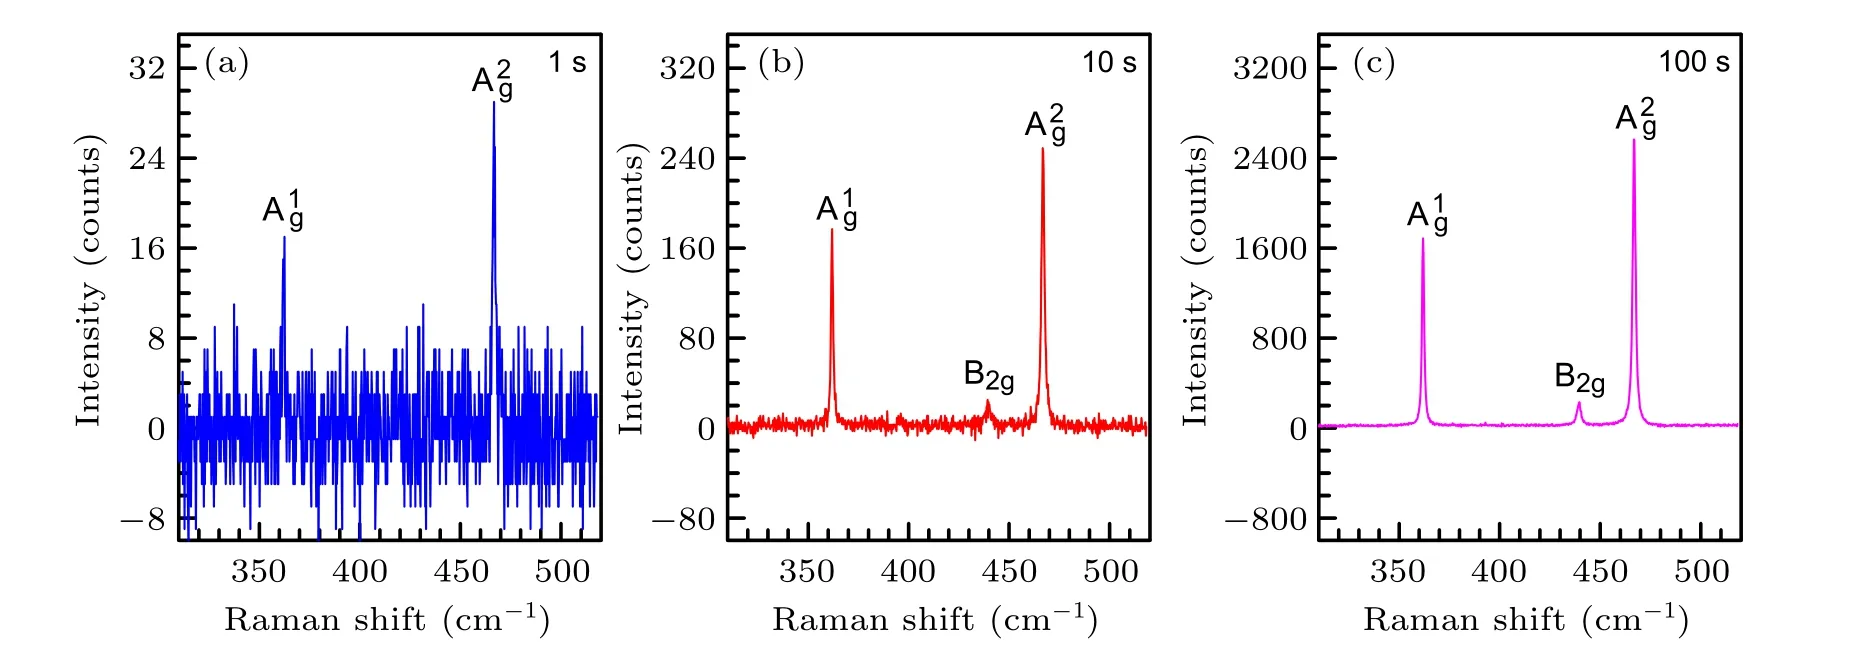
Fig.6.Raman spectra of black phosphorous excited by 633 nm with different acquisition time:(a)1 second,(b)10 seconds,(c)100 seconds.
5.2.Background shot noiseσB
”Background”here means any detected photons arising from the laser,sample and surrounding environment other than Raman photons from the analyte at the frequency of interest.Background can come from the Raman instrument,which mainly includes stray light such as laser and plasma,Rayleigh scattering light,non-Raman signals(such as photoluminescence)and uninterested Raman signals from the measured sample,as well as those generated from optical components due to the laser excitation,etc.Also Raman signals of the solvent or impurity and fluorescence from free fluorescent molecules will become the background noise in the obtained surface-enhanced Raman spectrum.[54]These contributions to background are generally sensitive to the change of the laser power.Also,background can also be contributed from stray light not originating in the laser or sample,such as room light,cosmic radiation and other ambient signals,which is generally not sensitive to the laser power.
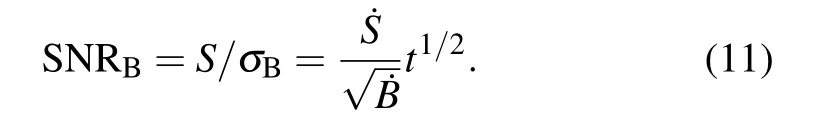
Background noise is also dominated by shot noise,i.e.,background shot noise,which is marked asσB.[28]According to the characteristics of shot noise,
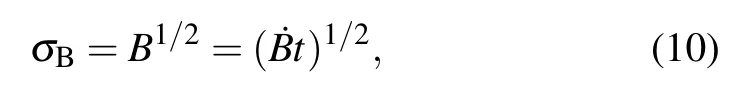
When the noise is dominated by background shot noise,the SNR can be expressed by
Based on Eq.(11),one can increase SNR by a longer acquisition time,even background may be very strong.Figure 8(a)shows Raman spectrum of a MoS2flake deposited on SiO2/Si substrate.The broad and relatively weak Raman feature of the MoS2flake in the range of 350–500 cm?1is almost overwhelmed by strong photoluminescence signal from the MoS2flake itself.When the acquisition time is extended,the SNR improves in the manner of t1/2.As a result of higher SNR,Raman features of the MoS2flake also become prominent despite the rising background,which are illustrated in Figs.8(b)and 8(c).
The noise from strong background can overwhelm the signal for short integration time.To minimize background shot noise from strong fluorescence is a major motivation for using the lasers in near-infrared or deep-ultraviolet range,especially for biological specimens and semiconductor materials.Background from room light can be partially eliminated by turning off ambient light sources,but such operation may cause inconvenience in daily maintenance,such as optical alignment and calibration.Therefore,in order to obtain high quality Raman signal with high SNR in the routine measurements,it is a key aspect in the design of Raman instruments to eliminate noise contributions from room light.
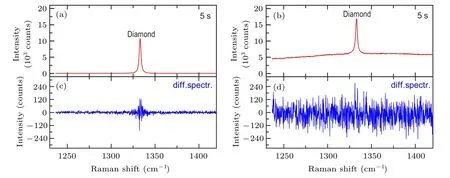
Fig.7.Raman spectra of diamond with(a)weak background and(b)strong background.(c)The corresponding difference spectrum(diff.spectr.)between two successive measurements of(a).(d)The corresponding diff.spectr.of(b).The acquisition time is 5 seconds.
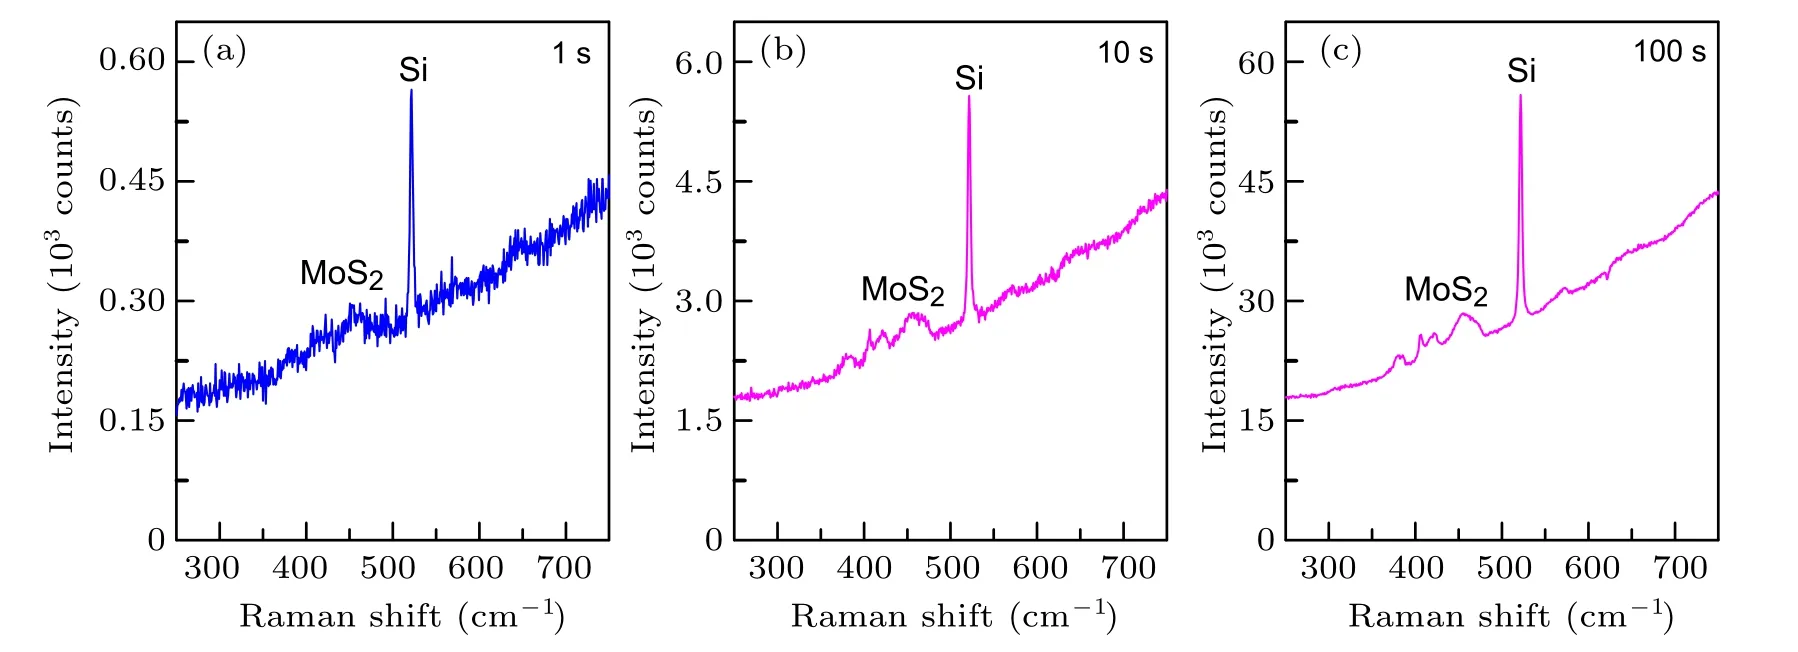
Fig.8.Raman spectra of a MoS2 flake on SiO2/Si substrate excited by 633 nm with integration time of(a)1 second,(b)10 seconds and(c)100 seconds.The strong background comes from photoluminescence of A exciton in MoS2.
5.3.Detector dark noiseσd
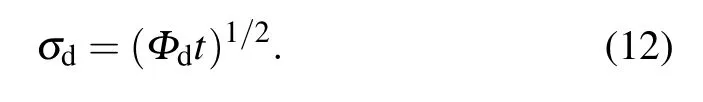
All detectors currently used in Raman instruments have a finite dark signal,mainly caused by thermal generation of electrons from a photomultiplier cathode or within a solidstate detector.[28]Dark signal directly relates to the acquisition time,which would produce additive quantity to the signal and contribute to the noise level in the measured spectrum.For a given experiment,the contribution of dark signal to the total signal isΦdt,whereΦdis the dark count rate in units of electrons per second(e?1·s?1)to illustrate the spontaneous generation rate of electrons in the detector.Φdstrongly depends on temperature and increases with rising temperature,thus it is usually necessary to cool the detector to reduce the dark signal as illustrated in Figs.5(a)and 5(d).Φdspans in a broad range,from a negligible value(<0.001 e?1·s?1)in LN2-cooled CCD detector to a large value(>100 e?1·s?1)in uncooled detector or near-infrared detector.[28]
As“dark”electrons are counted in the same way as signal or background,the noise of dark signal(also referred to as dark noise)also follows the Poisson statistical distribution as[55]
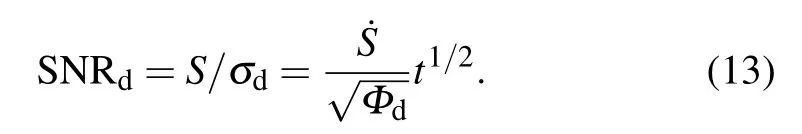
Dark noise limit happens whenΦdt of the detector(e.g.,uncooled detector or near-infrared detector)is much greater than other noises.In this case,the corresponding SNR of Raman signal is
The dark signal contributes to the detected signal,but it does not depend on the laser power or sample variables.CCD detector working around room temperature and InGaAs array detector usually exhibit highΦdand non-uniformity in noise level and photoelectric response between different pixels.The spectrum measured by a detector with highΦdhas a highlevel baseline along with electronic offset.Non-uniformity in dark signal also leads to significant irregular spikes in spectrum apart from Raman and PL signals.Here,we denote the Raman spectrum directly measured by the detector without any processing as raw Raman spectrum,in which the background signals and other stray photon signals are involved,and the Raman spectrum minus the CCD dark spectrum as dark-subtracted Raman spectrum.As shown in Figs.9(a)and 9(c),irregular spikes caused by non-uniform dark signals can overwhelm intrinsic Raman signal in the raw spectrum.In this case,one needs to measure a dark spectrum with the same acquisition time as the raw spectrum by closing the detector shutter or blocking laser incidence on the sample.After subtracting the dark spectrum from the raw spectrum,the resulting dark-subtracted spectrum shows intrinsic Raman signal from the sample with better spectral quality and higher SNR,as presented in Figs.9(b)and 9(d).
It is instructive to note that the Raman signal of interest is efficiently detected only by part pixels in CCD detector.Nonilluminated section of the CCD area would contribute dark noise and background shot noise to the measured Raman signal.In the Raman experiment,one can set a reduced CCD area by Raman software to exclude the noise contribution from the unused area.
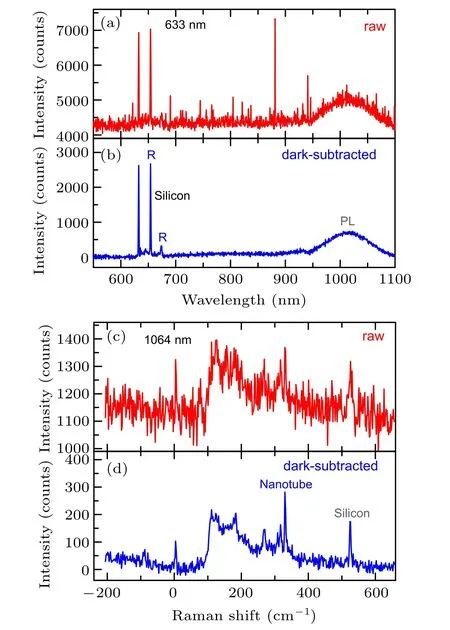
Fig.9.(a)Raw Raman spectrum of silicon under 633 nm excitation measured by fiber optic spectrometer with a back-thinned CCD detector working at room temperature and(b)the corresponding dark-subtracted spectrum.(c)Raw Raman spectrum of carbon nanotubes deposited on silicon substrate under 1064 nm excitation measured by confocal Raman spectrometer with a LN2-cooled InGaAs detector and(d)the corresponding dark-subtracted spectrum.Raman signals are marked as R while photoluminescence signals are marked as PL.
5.4.Readout noiseσr
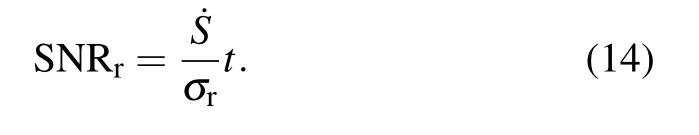
Readout refers to the process of converting electrons from the detector to a useful form,usually a digital value stored in a computer.Readout noiseσris the standard deviation of a large number of readouts from a constant detector signal.[28]For a common CCD detector,the readout noise originates from the transfer process from the stored electrons in the detector into intensity counts through analog-to-digital conversion,whose contribution mainly comes from the amplifier between the CCD detector and the analog-to-digital converter as well as Johnson(thermal)noise from electronic components.σris strongly related to the type of detector,which may span from a few electrons in a scientific CCD detector to thousands of electrons in a photodiode array.Specific value ofσris given in manufacturer’s specification.Compared with the dark current of a scientific CCD detector being as low as 0.3 e?/pixel/h,σrcannot be negligible.σris rarely dominant in scientific Raman spectrometer nowadays,except for the detection of rather weak signals or short integration time.[56]In readout noise limit,the SNR of Raman signal is
If Raman signal is not too weak,the effect ofσrcan be eliminated by increasing the integration time.
Readout noise can be regarded as a one-time added type of noise at each pixel for each measurement,thusσrdoes not depend on the signal amplitude nor acquisition time.[28,56]The dark noise and readout noise usually coexist during measurement.Sinceσdis proportional to the integration time while σrnot,the readout noise can be quantitatively distinguished from dark noise by multiple measurements with different integration time when laser is turned off and background noise is eliminated as much as possible.
Accumulation is often used to obtain a better SNR by repeatedly collecting spectrum and averaging the results.However,when readout noise is dominant,SNR cannot be improved by only increasing the accumulation time.For example,in Fig.10(a),Raman signal of black phosphorus(BP)is too weak to be detected,completely overwhelmed by readout and dark noises.In this case,it is necessary to increase integration time to improve SNR and make Raman signal more prominent as illustrated in Fig.10(b).Even though the Raman signal is as low as 2 counts per second,the peak can be clearly discerned from noise after an integration time of 100 seconds.As a comparison,the Raman spectrum with 1 second of integration under 100 times of accumulation in Fig.10(c)shows much worse SNR even with the same total measurement time as that in Fig.10(b).Multiple accumulation cannot efficiently improve SNR in readout noise limit because readout noise will pile up with increasing the accumulation number.
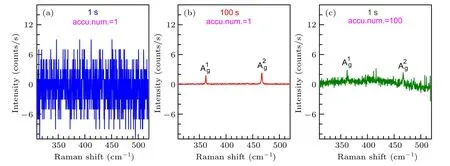
Fig.10.Raman spectra of BP with integration time of(a)1 second,(b)100 seconds,(c)1 second.The corresponding accumulation number(accu.num.)in(a),(b)and(c)are 1,1 and 100,respectively.The Raman intensity is in units of counts/s for direct comparison.
6.SNR estimation for the measured Raman signal
If we define the signal as that from the Raman band of interest,the SNR is defined by
where Itot=IRam+IBLis the total counts including Raman signal and baseline.
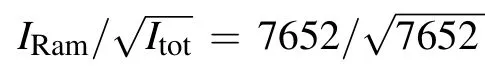
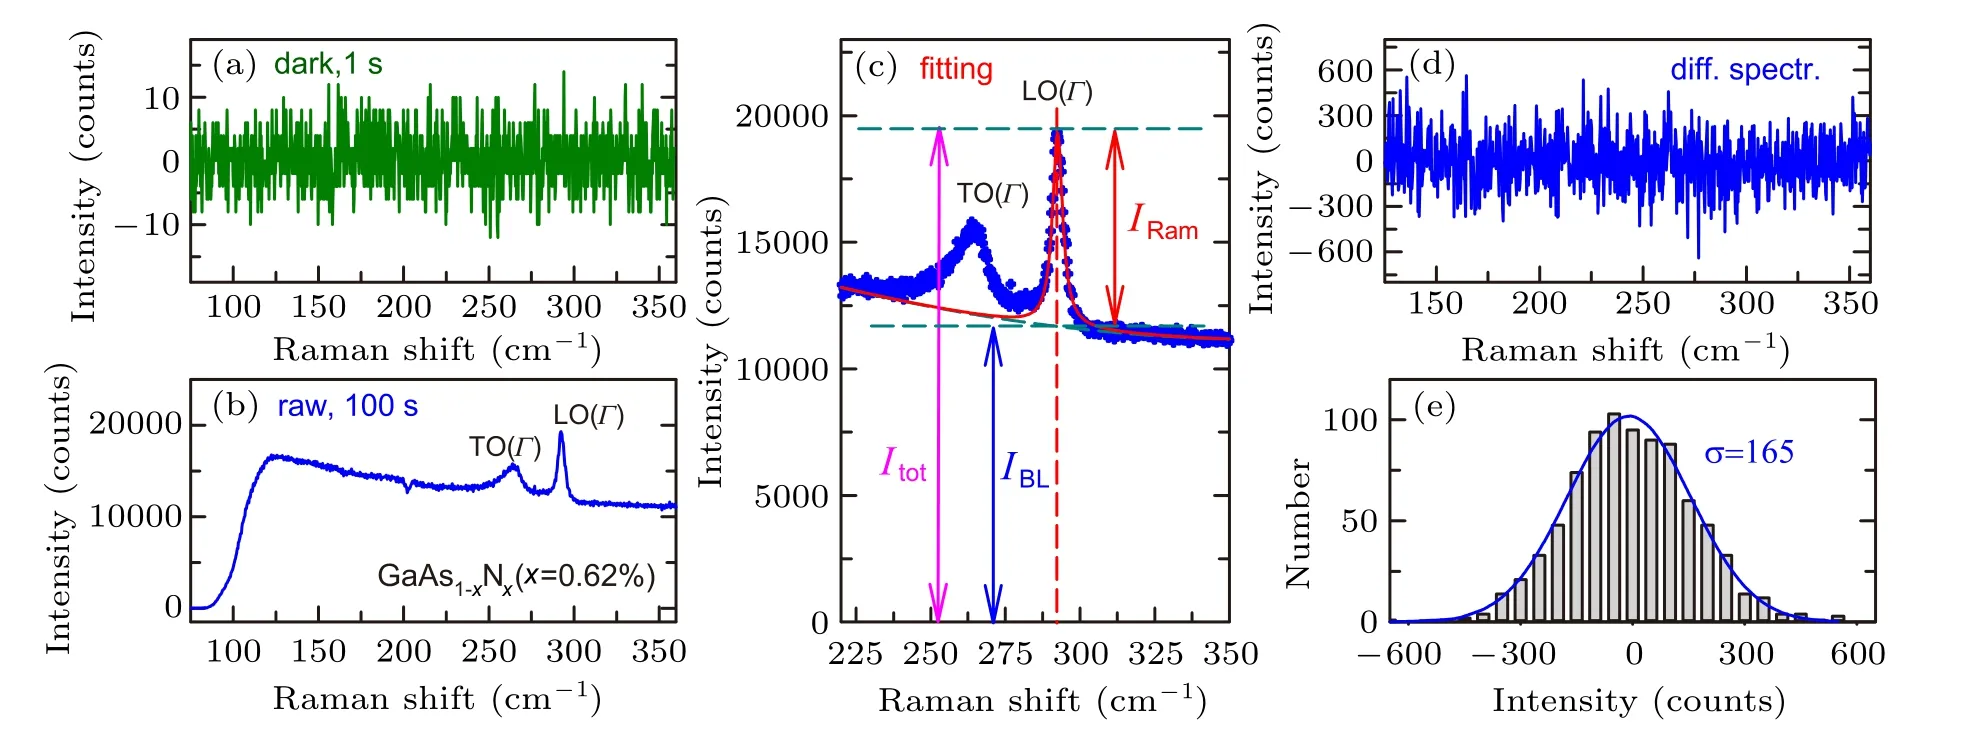
Fig.11.(a)Dark spectrum detected by liquid-cooled Si CCD detector.The acquisition time is 1 second.The electronic offset is deducted before acquisition.(b)The raw Raman spectrum of GaAs1?xNx(x=0.62%)under 671 nm excitation with acquisition time of 100 seconds.(c)Fitting of LO(Γ)peak for SNR analysis.The corresponding IRam,IBL and Itot are marked.(d)The corresponding difference spectrum(diff.spectr.)between two successive measurements of(b).(e)The statistical distribution of the counts in(d)withσ=165.
Fig.12.(a)Dark spectrum detected by CCD detector working at 25°C.(b)Raw Raman spectrum of BP.(c)The dark-subtracted Raman spectrum of BP.(d)The difference spectrum(diff.spectr.)between two successive dark-subtracted spectra.(e)The statistical distribution of count in(d)withσ=131.

For all the measured Raman signals by multichannel detectors,the raw Raman data should be used in the SNR analysis without any artificial and technical smoothing by software or technician.Any such smoothing would lead to overestimation of the SNR for the measured Raman signal.
How to design and build a Raman spectroscopy system with high SNR has always been the concern of scientific instrument companies and researchers.The SNR analysis above provides guidance to instrumental design and routine measurement.Generally speaking,Raman spectrometer with negligibleσr,σdandσBis recommended for measurement.When background is not a dominant source of noise,the simplest way to improve SNR is to improve the intensity of Raman signal by increasing the excitation power of laser or by extending the integration time of detector.Especially for LN2-cooled or TE-cooled detectors with extremely low noise level,to minimize noise from external sources is a primary concern in instrumental design,such as securing all covers and closing all unused entrance or exit ports.With respective to rather weak signals requiring longer acquisition time,the dark noise then becomes the dominant issue,detectors with high quantum efficiency and low dark current are quite necessary.
7.Conclusion
To conclude,we introduce the recent advances on Raman spectroscopy of 2DMs,including N-dependent interlayer modes and Davydov splitting of intralayer modes in NL twisted MoTe2.The relation between interlayer interactions and intralayer vibrations is directly established.We also overview various noise sources and their potential influences on SNR of Raman signals measured by CCD detectors and IGA array detector,which provides comprehensive strategies to reduce noise in Raman spectrum.This will be helpful to optimize SNR of Raman signal in instrument design and routine Raman measurements.

- Chinese Physics B的其它文章
- Origin of anomalous enhancement of the absorption coefficient in a PN junction?
- Protection of isolated and active regions in AlGaN/GaN HEMTs using selective laser annealing?
- First-principles study of plasmons in doped graphene nanostructures?
- Probing thermal properties of vanadium dioxide thin films by time-domain thermoreflectance without metal film?
- An improved model of damage depth of shock-melted metal in microspall under triangular wave loading?
- Molecular dynamics study of coupled layer thickness and strain rate effect on tensile behaviors of Ti/Ni multilayered nanowires?