
EWMA control chart based on its first hitting time and coronavirus alert levels for monitoring symmetric COVID-19 cases
2021-09-11 09:00:10AreepongYupapornSunthornwatRapin
Areepong Yupaporn, Sunthornwat Rapin
1Department of Applied Statistics, Faculty of Applied Science, King Mongkut's University of Technology North Bangkok, Bangkok 10800, Thailand
2Industrial Technology Program, Faculty of Science and Technology, Pathumwan Institute of Technology, Bangkok 10330, Thailand
ABSTRACT
KEYWORDS: COVID-19 alert levels; Symmetric pattern of the total number of COVID-19 cases; Monitoring COVID-19 situation;EWMA control chart
1. Introduction
Coronavirus disease 2019 (COVID-19) is caused by a singlestranded RNA virus, SARS-COV-2, which was firstly reported in Wuhan, Hubei, China, in the end of 2019. Common symptoms of COVID-19 infection are fever, fatigue, body ache, dry cough,appetite loss, and loss of the sense of smell[1,2]. The COVID-19 outbreak has affected the interaction and activities of people abiding by the strict measures to control COVID-19 outbreaks, such as mask-wearing, washing hands often, physical and social distancing,quarantining after traveling both between and within countries.COVID-19 has caused a new norm in the human lifestyle and has affected the economic and social systems of most countries in the world.
Emerging technologies are being deployed to combat the COVID-19 pandemic. For example, smartphone applications are being used for connecting infected patients and the management information systems of hospitals. The rapid deployment of applications for self-screening, self-health check-ups, and COVID-19 hospital information systems, along with surveillance, testing, tracing,quarantining, and hospital management to combat the COVID-19 outbreak have been forthcoming[3]. Artificial intelligence is being used in systems to detect SARS-COV-2, fever, and other suspected symptoms of COVID-19. Telemedicine and mobile applications in response to the COVID-19 situation have been deployed to enable consultations on medical conditions via video calls with the physicians. In addition, drones and robotics are being used in hazardous areas infected with SARS-COV-2[4]. The Internet of Things is being used for COVID-19 patients to connect to hospital networks, while blockchain is being used for effective supply chain management. Moreover, cloud computing and big data have been deployed to store and provide data storage capacity for information about the COVID-19 situation[5].
Plans and policies have been laid out to handle, control, and monitor the COVID-19 outbreak. Recognizing the pattern of the total number of COVID-19 cases is important for acting on the policies to control COVID-19 outbreaks. The levels of COVID-19 severities which are called the COVID-19 alert levels have been defined by the authorities based on the COVID-19 situation.Moreover, the statistical control chart has been applied to monitor and control the COVID-19 outbreak. Thus, many researches have been conducted on the symmetric pattern of the total number of COVID-19 cases, COVID-19 alert levels, and statistical control charts for monitoring the COVID-19 outbreak. For example, the total number of COVID-19 cases in many countries, such as Thailand,Singapore, Sweden and Norway, follows a logistic growth curve,which is a symmetric pattern[6,7]. The number of cases relative to the maximum cumulative infected, the total confirmed, and the total recovered cases have been fitted to a logistic growth curve model for the COVID-19 suppression dynamics for each region in China[8].Moreover, several countries and states have classified the COVID-19 alert levels for monitoring the COVID-19 situation and applied measures that people must abide by to protect the population from COVID-19 outbreak spikes. For example, New Zealand classified COVID-19 severity with a COVID-19 alert system[9]. The state of Alaska classified three statewide alert levels for evaluating the COVID-19 transmission risk[10]. The UK defined COVID-19 alert levels to communicate the current risk of COVID-19 transmission to the population[11].
Statistical control charts such as the exponentially weighted moving-average (EWMA) control chart and the proportional control chart have been adopted to monitor COVID-19 outbreaks. The EWMA control chart is being used for monitoring and producing warnings of COVID-19 outbreaks in some major states in India[12],as well as to monitor and identify the control limits of the death variation of the COVID-19 situation in Pakistan[13]. The proportional control chart is being used to monitor the COVID-19 positivity rate,COVID-19 healing rate, and COVID-19 mortality rate over time[14].Using quantitative methods to set the COVID-19 alert levels is a useful approach for supporting the authorities when making decisions about launching measures to protect the population during a COVID-19 outbreak. Therefore, the objective of the present research is to apply a quantitative and probability method (a quantile function) that is an inversion of the cumulative distribution function of the time over the total number of COVID-19 cases to set the COVID-19 alert levels when monitoring COVID-19 outbreaks by using a EWMA control chart. The two methods for estimating the expected value and variance of the COVID-19 cases as the population for the EWMA statistic and the results from the EWMA control chart based on the optimal first hitting time were evaluated and compared for COVID-19 outbreaks in Thailand, Singapore,Vietnam, and Hong Kong where the pattern of the total number of COVID-19 cases follows a logistic growth curve, which is a symmetric pattern.
2. Subjects and methods
This section contains the data collection protocol, mathematical and statistical methods, probabilistic analysis, COVID-19 alert levels, and the EWMA control chart for describing and monitoring a COVID-19 outbreak.
2.1. Data collection
The data for this research is the total number of COVID-19 cases over time. The total number of COVID-19 cases, which are secondary data, were collected and downloaded from the website Worldometer[15]. The total number of COVID-19 cases was specifically selected as the sample because the theories and analyses reported herein that comprise the main purpose for this research are based on the symmetric growth curve. The collected data of the total number of COVID-19 cases was complete with no missing values. The sampled countries or region for this research(Thailand, Singapore, Vietnam, and Hong Kong) were specifically selected because their total numbers of COVID-19 cases follow a symmetric growth curve (the logistic growth curve), and are suitable for estimation based on the symmetric pattern of the total number of COVID-19 cases[6] for the duration of February 15, 2020, to December 16, 2020.
2.2. The model for describing the behavior of a COVID-19 outbreak
The behavior of a COVID-19 outbreak can be represented by a logistic differential equation of the total number of COVID-19 cases[6,7]. The total number of COVID-19 cases can be described by using a logistic growth curve that is the solution for the logistic differential equation. Let I (t) be the total cases at any time t≥0 and C be the carrying capacity of the environment. Thus, the logistic differential equation can be modeled as
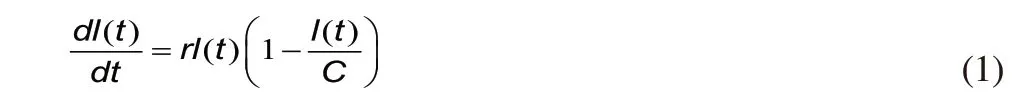
where r is an intrinsic growth rate.
One of the variables in Equation (1), I (t), can be evaluated as a logistic growth curve (a symmetric growth curve) as follows:
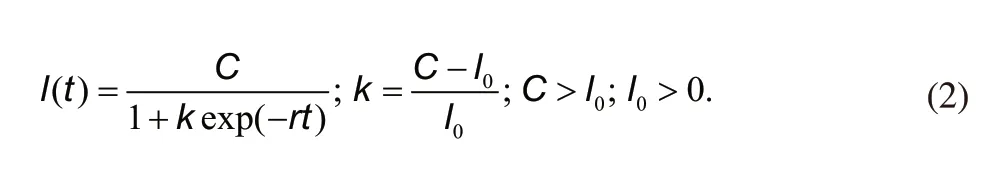
where Iis the initial total number of COVID-19 cases.
The logistic growth curve in Equation (2) has an inflection point or median at C/2. Moreover, the parameters for the logistic growth curve consist of C, k and r. The least-squares-error method can be adopted to estimate these parameters as follows:

?
(t) is the estimated logistic growth curve for time t=0, 1, ..., n. Hence, the partial derivative with respect to parameters C,k and r can be applied to respectively estimate these parameters as: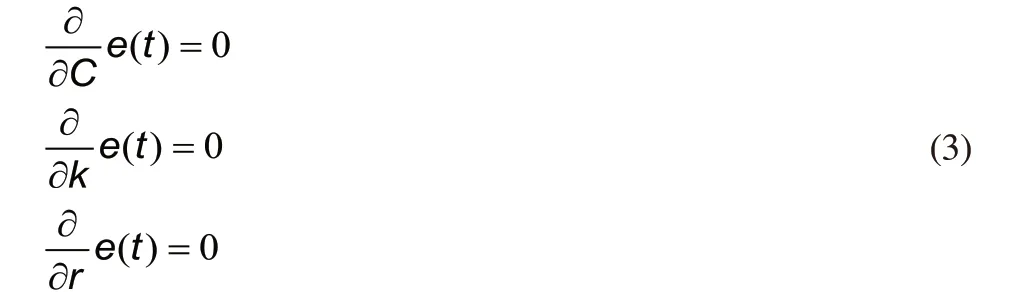
The parameters C, k and r can be solved from the system of Equation (3).
The accuracy of the estimation parameters and estimated logistic growth curve which represents the total number of COVID-19 cases is measured as the Root Mean Square Percentage Error (RMSPE).

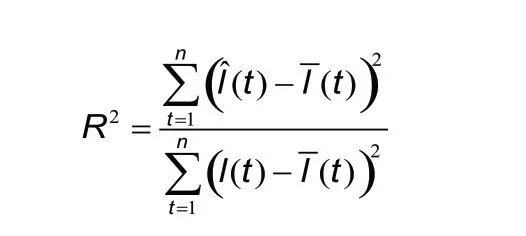
The explanation of the independent variable (time) in relation to the dependent variable (estimated logistic growth) can be measured by using the coefficient of determination (R).
2.3. The probability density function, expected value, and variance of the time for the total number of COVID-19 cases
The cumulative distribution function (CDF: F) of the time for the total number of COVID-19 cases is defined as:
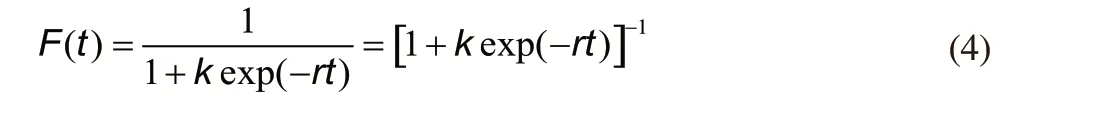
The probability density function (PDF: f) of the time for the total number of COVID-19 cases is a derivative of the CDF expressed as:
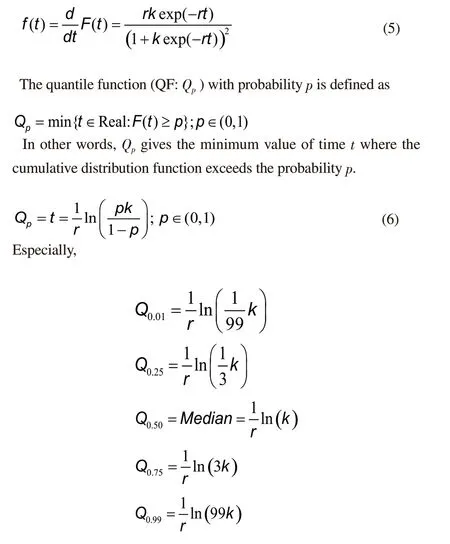
Γ
) as: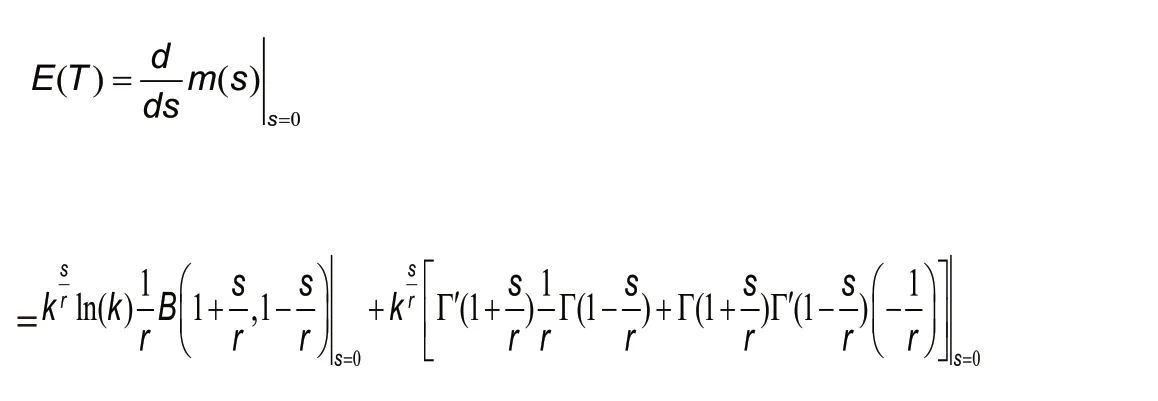
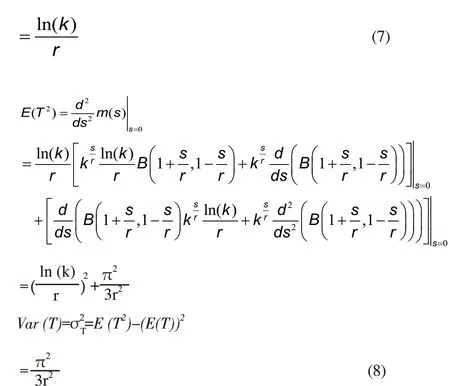
Next, the estimate expected value and estimate variance of the total COVID-19 cases are evaluated.
2.4. Estimating the expected value and variance of the total number of COVID-19 cases
These can be calculated via two methods.
2.4.1. The delta method[16]
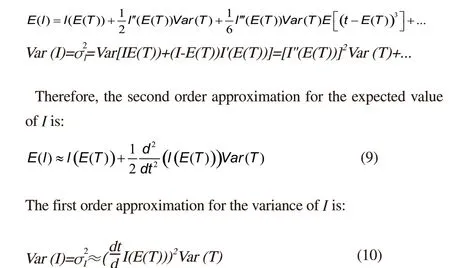
Obviously, the total number of COVID-19 cases I is a function of time t, i.e., I=I(t). The respective estimated expected value and variance of random variable I based on a Taylor series expansion about t=E(T) are:
2.5. The exponentially weighted moving average control chart for monitoring a COVID-19 outbreak
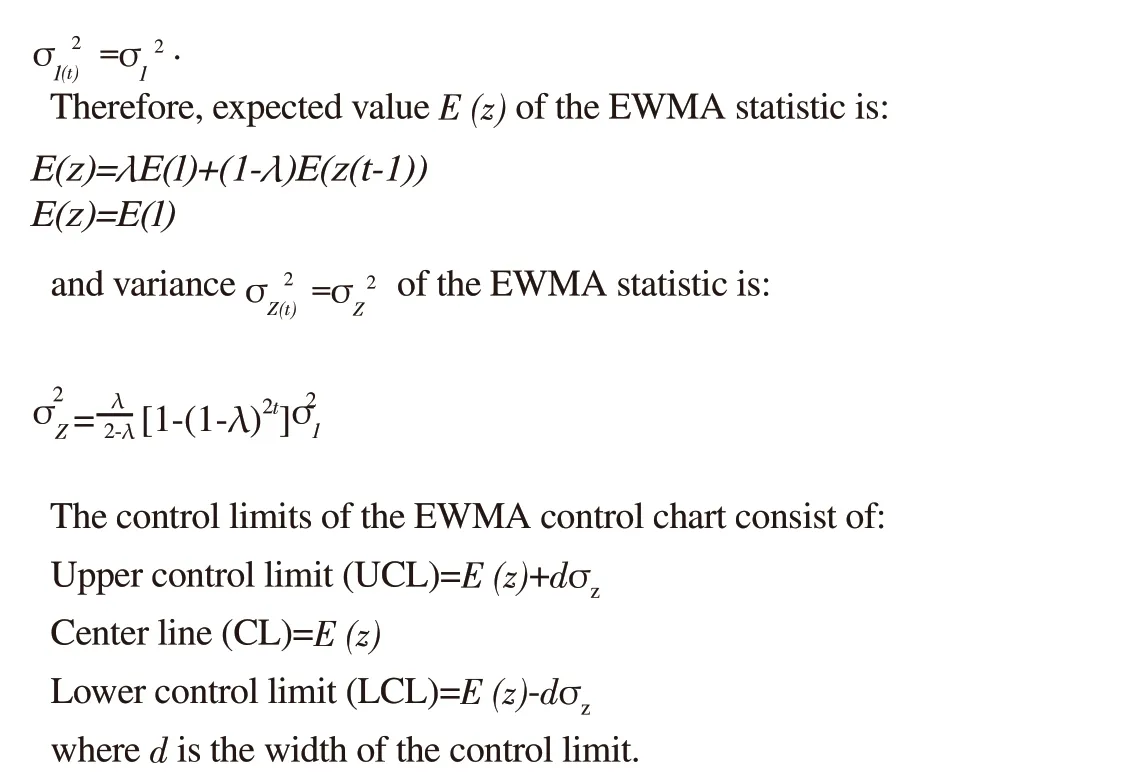
The EWMA control chart[17-19] is based on EWMA statistic z (t)for smoothing parameterλ∈(0, 1], which can be written as:

In this research, the EWMA control chart was applied for monitoring the total number of COVID-19 cases. Thus, the assumption is that the I(t)’s are independent identically distributed random variables with expected value E(I(t))=E(I) and variance
Moreover, the total number of COVID-19 cases is estimated via logistic growth, which is a gradual increase in the first period,exponential growth in the middle period, and slow growth in the end period. To monitor the total number of COVID-19 cases, the first hitting time (FHT), or first passage time[20-22], is the run length of the number of samples at which point the EWMA control chart gives the first signal over the upper control limit. The first hitting time of the EWMA control chart is defined as:
FHT
=inf{t>0
|z(t)>UCL}
The first hitting time for monitoring a COVID-19 outbreak through the EWMA control chart should be as large as possible because it reveals the efficiency of controlling the COVID-19 outbreak.
2.6. The COVID-19 alert levels
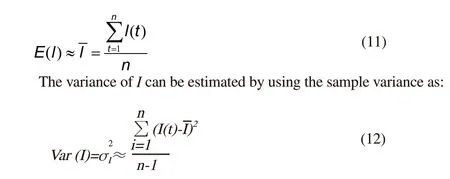
2.4.2. The sample mean and variance method
The expected value of I can be estimated by using the sample mean as:
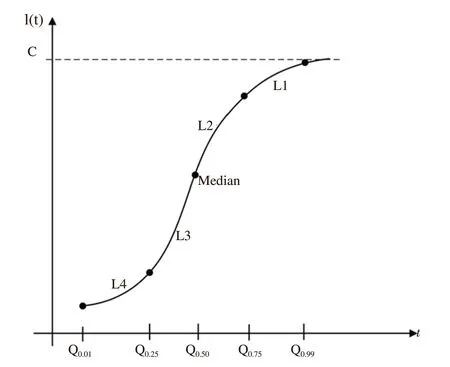
Here, we present the COVID-19 alert levels for monitoring a COVID-19 outbreak. The COVID-19 alert levels are important for the authorities to make decisions on monitoring, controlling, and protecting the population during a COVID-19 outbreak. In this research, the COVID-19 alert levels were classified into four levels.However, the total number of COVID-19 cases for a logistic growth curve can be described by a symmetric growth curve.
Figure 1 shows a plot of the quantile functions corresponding to the COVID-19 alert levels. The total number of COVID-19 cases starts increasing over the range (Q, Q) in alert level 4 (L) with very high outbreak severity. Subsequently, the total number of COVID-19 cases exponentially increases over the range (Q, Q) in alert level 3 (L) with high outbreak severity. After the inflection point(median), the total number of COVID-19 cases starts decreasing over the range (Q, Q) in alert level 2 (L) with medium outbreak severity. Following this, the total number of COVID-19 cases significantly decreases and then becomes stable over the range (Q,Q) in alert level 1 (L) with low outbreak severity.
3. Results
3.1. The COVID-19 outbreak in Thailand
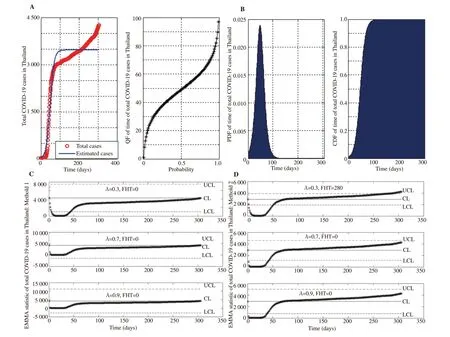
As shown in Figure 2A, the estimated logistic growth curve for the total number of COVID-19 cases in Thailand from February 15,2020, to December 16, 2020, is:
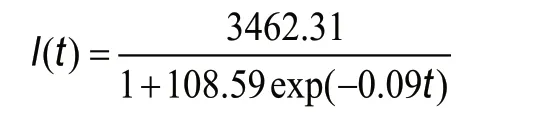
and the quantile functions of the total number of COVID-19 cases are 0.96, 37.44, 48.91, 60.36 and 96.84.
As shown in Figure 2B, the PDF of the time for the total number of COVID-19 cases in Thailand is positively skewed. The probability of the total number of COVID-19 cases in Thailand from February 15,2020, to December 16, 2020, reached the maximum value at around day 50 and approached zero at around day 120. The expected value and variance of the times for the COVID-19 outbreak in Thailand are 319.08 and 1.52e+04, respectively. The sample value and variance of the COVID-19 outbreak in Thailand are 2.89e+03 and 1.38+06,respectively.
As shown in Figure 2, the EWMA control chart was applied for monitoring the total number of COVID-19 cases in Thailand from February 15, 2020, to December 16, 2020. The results from the experiment, the first hitting time based on the delta method (method 1)was 0 for all values of the smoothing parameter (Figure 2C) whereas the sample mean and variance method (method 2) (Figure 2D) for smoothing parameter λ=0.3 and d=2 more effectively detected the first hitting time (280 days) than with the other smoothing parameter values. Hence, the optimal first hitting time on the EWMA control chart for monitoring a COVID-19 outbreak in Thailand is approximately 280 days for λ=0.3 and d=2.
3.2. The COVID-19 outbreak in Singapore
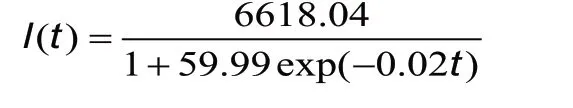
As shown in Figure 3A, the estimated logistic growth curve for the total number of COVID-19 cases in Singapore from February 15,2020, to December 16, 2020, is:
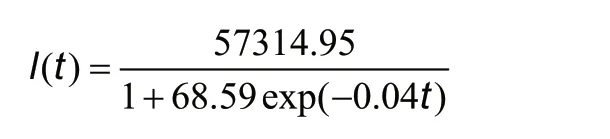
and the quantile functions of the total number of COVID-19 cases are: -8.71, 74.25, 100.32, 126.39 and 209.35.
As shown in Figure 3B, the PDF of the total number of COVID-19 cases in Singapore is positively skewed. The probability of the total number of COVID-19 cases in Singapore from February 15,2020, to December 16, 2020, reached the maximum value at around day 100 and approached zero at around day 290. The expected value and variance of the times for the COVID-19 outbreak in Singapore are 200.57, and 7.40e+03, respectively. The sample value and variance for the COVID-19 outbreak in Singapore are 3.79e+04, and 5.13e+08, respectively.
As shown in Figure 3, the EWMA control chart was applied for monitoring the total number of COVID-19 cases in Singapore from February 15, 2020, to December 16, 2020. The results from the experiment, the first hitting time based on the delta method (method 1)was 0 for all values of the smoothing parameter (Figure 3C) whereas the sample mean and variance method (method 2) (Figure 3D) for smoothing parameter λ=0.3 and d=2 more effectively detected the first hitting time (208 days) than for the other smoothing parameter values. Thus, the optimal first hitting time on the EWMA control chart for monitoring the COVID-19 outbreak in Singapore is approximately 208 days for λ=0.3 and d=2.
3.3. The COVID-19 outbreak in Vietnam
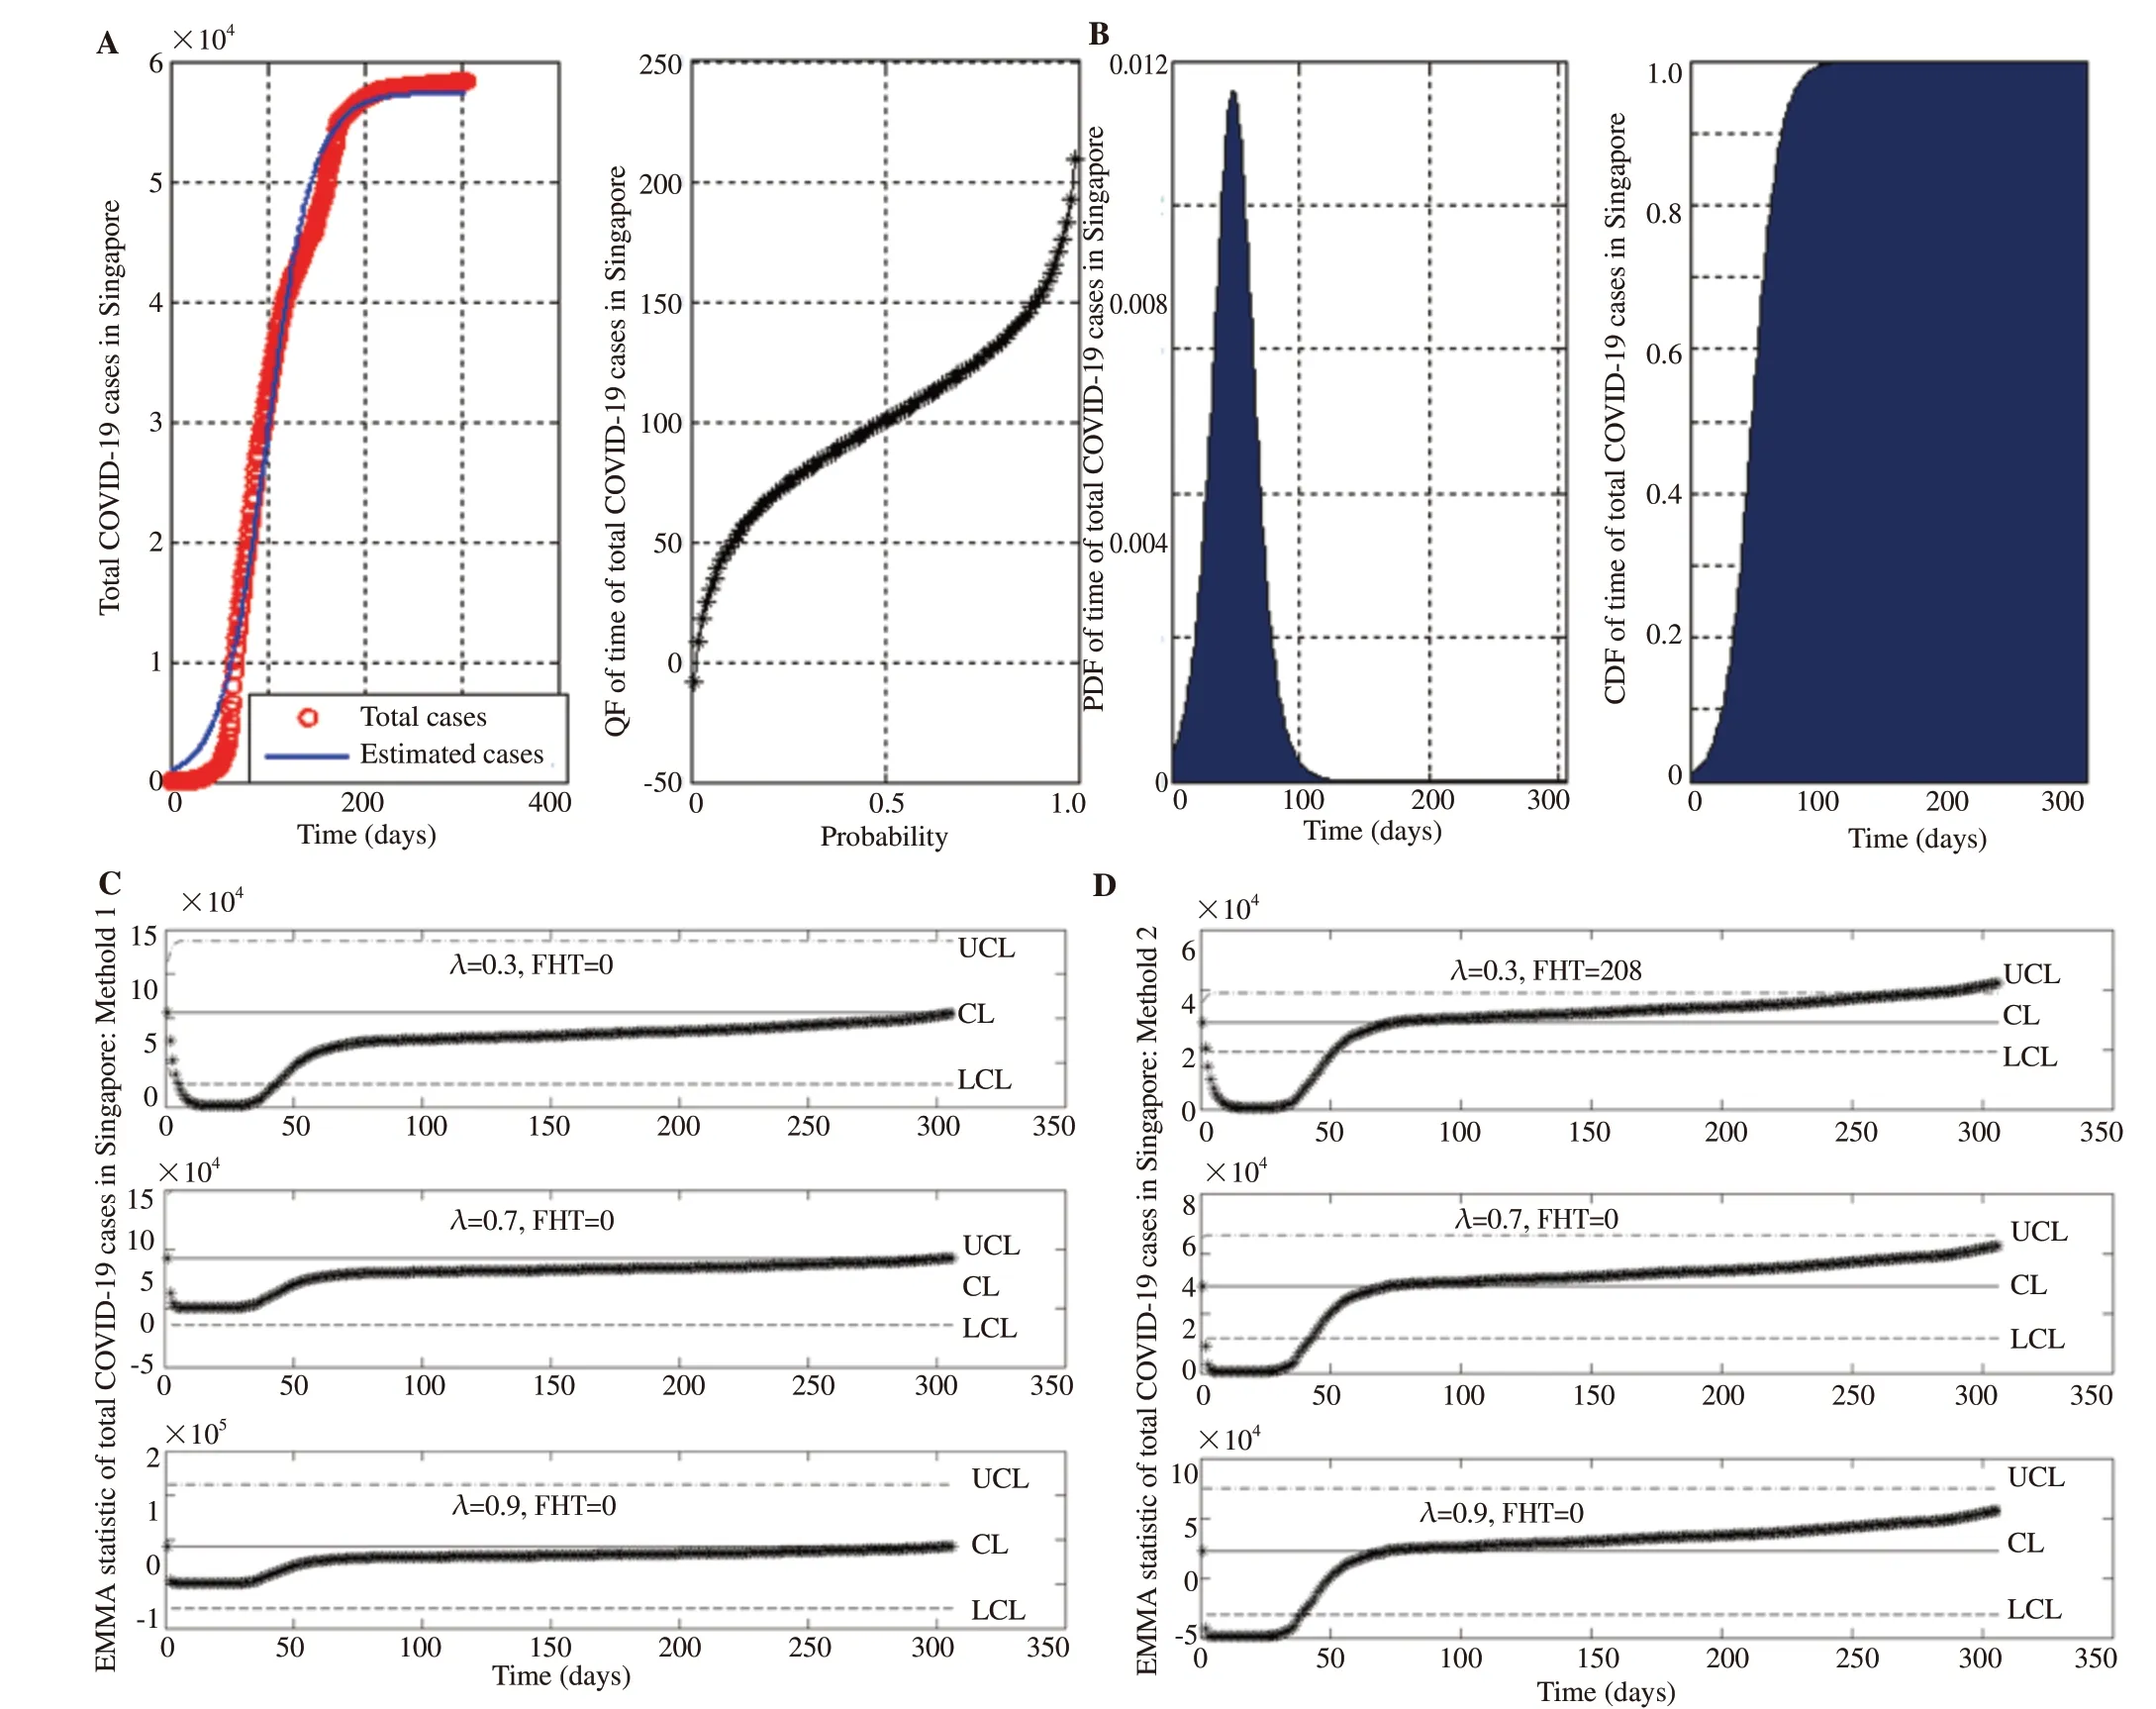
As shown in Figure 4A, the estimated logistic growth curve for the total number of COVID-19 cases in Vietnam from February 15, 2020 to December 16, 2020, is:
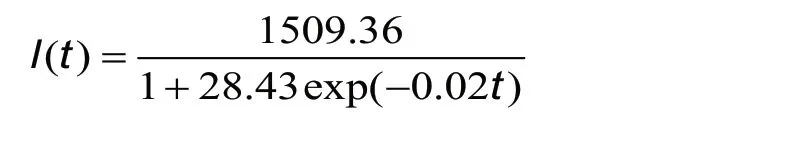
and the quantile functions of the total number of COVID-19 cases are: -66.42, 119.69, 178.16, 236.63 and 422.74.
As shown in Figure 4B, the PDF of the total number of COVID-19 cases in Vietnam is quite symmetric. The probability of the total number of COVID-19 cases in Vietnam from February 15, 2020, to December 16, 2020, reached the maximum value at around day 170.The expected value and variance of the time for the total number of COVID-19 cases in Vietnam are 240.17 and 1.69e+04, respectively.The sample value and variance of the COVID-19 outbreak in Vietnam are 646.02, and 2.11e+05, respectively.
As shown in Figure 4, the EWMA control chart was applied for monitoring the total number of COVID-19 cases in Vietnam from February 15, 2020, to December 16, 2020. The results from the experiment, the first hitting time based on the delta method (method 1)was 0 for all values of the smoothing parameter (Figure 4C) whereas the sample mean and variance method (method 2) (Figure 4D)detected first hitting times of 198, 286, and 0 for λ=0.7 and d=2,respectively. For smoothing parameter λ=0.3, 0.7 and 0.9, the sample mean and variance method more effectively detected the first hitting time (286 days) than for the other smoothing parameter values.Hence, the optimal first hitting time on the EWMA control chart for monitoring the COVID-19 outbreak in Vietnam is approximately 286 days for λ=0.7 and d=2.
3.4. The COVID-19 outbreak in Hong Kong
As shown in Figure 5A, the estimated logistic growth curve for the total number of COVID-19 cases in Hong Kong from February 15,2020, to December 16, 2020, is:
and the quantile functions of the total number of COVID-19 cases are: -21.24, 127.04, 173.63, 220.22 and 368.50.
As shown in Figure 5B, the probability density function of the total number of COVID-19 cases in Hong Kong is quite symmetric.The probability of the total number of COVID-19 cases in Hong Kong from February 15, 2020, to December 16, 2020, reached the maximum value at around day 160. The expected value and variance of the time for the COVID-19 outbreak in Hong Kong are 319.08,and 1.52e+04, respectively. The sample value and variance of the COVID-19 outbreak in Hong Kong are 2.91e+03, and 5.12e+06,respectively.
As shown in Figure 5, the EWMA control chart was applied for monitoring the total number of COVID-19 cases in Hong Kong from February 15, 2020, to December 16, 2020. The results from the experiment, the first hitting time based on the delta method (method 1) was 0 for all values of the smoothing parameter (Figure 5C) whereas the sample mean and variance method (method 2) (Figure 5D) detected first hitting times of 202, 290, and 298 for λ=0.3, 0.7 and 0.9,respectively. For smoothing parameter λ=0.9 and d=2, the sample mean and variance method more effectively detected the first hitting time (298 days) than for the other smoothing parameter values.Thus, the optimal first hitting time on the EWMA control chart for monitoring the COVID-19 outbreak in Hong Kong is approximately 298 days for λ=0.9 and d=2.
Here, we compare, discuss, and suggest applying the EWMA control chart and parameter estimation for monitoring symmetric patterns of the total number of COVID-19 cases for the sampled countries and region: Thailand, Singapore, Vietnam, and Hong Kong.
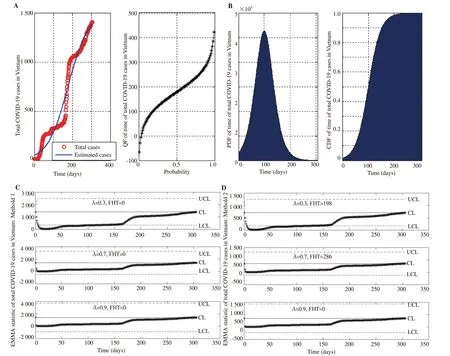
Table 1 reports the estimated parameters, EWMA control chart, and the COVID-19 alert levels for monitoring COVID-19 outbreaks to illustrate the levels of severity in each country. The delta model for estimating the expected value and the variance of the total number of COVID-19 cases could not detect the first hitting time on the EWMA control chart. However, the mean and variance model with the optimal smoothing parameter for the EWMA control chart of the total number of COVID-19 cases could detect the following first hitting times: 280 days with λ=0.3 for the COVID-19 outbreak in Thailand, 208 with λ=0.3 for the COVID-19 outbreak in Singapore,286 days with λ=0.7 for the COVID-19 outbreak in Vietnam, and 298 days with λ=0.9 for the COVID-19 outbreak in Hong Kong.Furthermore, when using smoothing parameter λ=0.3 with the EWMA control chart for monitoring the COVID-19 outbreaks, the maximum first hitting times were 280, 208, 202, and 198 days in Thailand, Singapore, Hong Kong, and Vietnam, respectively. These results imply that Thailand can more effectively hold the COVID-19 outbreak time before breaking the upper control limit of the EWMA control chart and thus better protect its population from COVID-19 outbreaks compared to the other countries or region. Moreover, the total number of COVID-19 cases escalate rapidly in COVID-19 alert level 4, thus signifying that policies for controlling a COVID-19 outbreak, such as lockdown, social distancing, etc., should be strictly encouraged. COVID-19 total cases are exponentially increasing for alert level 3, which suggests that the policies mentioned for level 4 should be strictly maintained to suppress the total number of COVID-19 cases. For alert level 2, the COVID-19 total cases are starting to gradually decrease after having passed the inflection point at Q. However, applying the policies mentioned previously should still be strictly applied to suppress the total number of COVID-19 cases. For alert level 1, the total number of COVID-19 cases is low or almost nonexistent, and so considerations in adjusting public health and social measures are recommended.

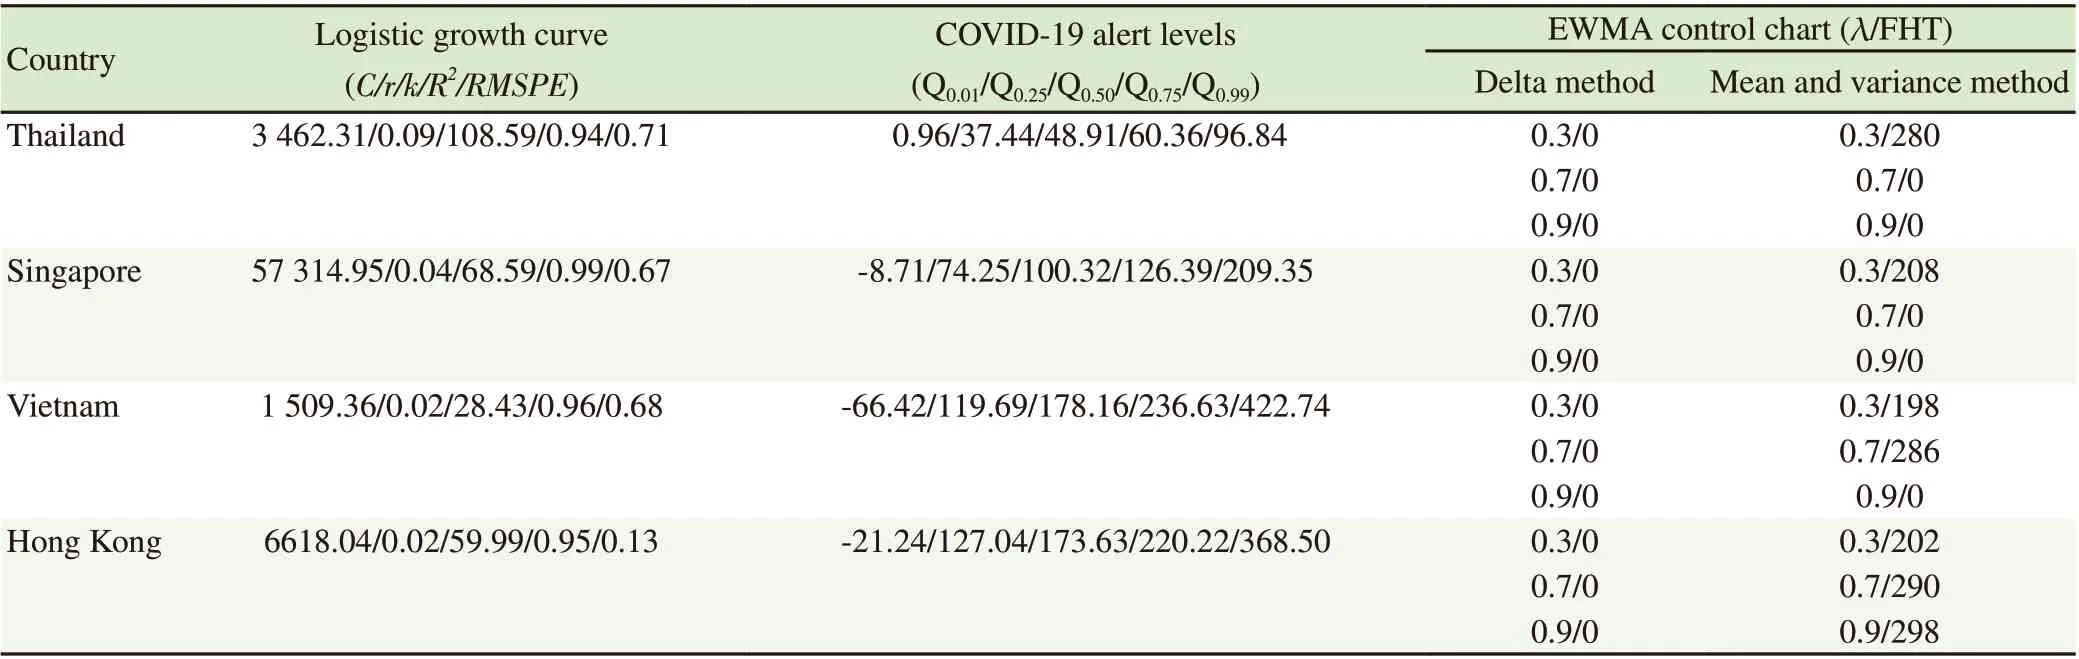
Table 1. Comparison of the COVID-19 outbreaks in sampled countries and region.
4. Discussion
The scope of this research was the study of probabilistic methods for the symmetric pattern of the total number of COVID-19 cases.The findings of this research are restricted to investigating the PDF of the symmetric pattern of the total number of COVID-19 cases.The samples are from only four countries or region: Thailand,Singapore, Vietnam, and Hong Kong. The outbreak time range was restricted to the period of February 15, 2020, to December 16, 2020.The approaches outlined in this research could be applied to symmetric patterns of the total number of COVID-19 cases in other countries. Moreover, we only used the EWMA control chart for monitoring the COVID-19 outbreaks. The application of the approach in this research on COVID-19 outbreaks in other countries has been left for the future. Asymmetric patterns for the total number of COVID-19 cases could be forecasted and estimated by using the PDF. Furthermore, other control charts such as the modified EWMA and cumulative sum, etc., for monitoring COVID-19 outbreaks could be applied to classify the COVID-19 alert levels.
Probabilistic methods such as the PDF, quantile functions, and optimal first hitting times were used to set COVID-19 alert levels for the total number of COVID-19 cases with a symmetric pattern. The EWMA control chart was adopted to monitor and set the alert levels for COVID-19 outbreaks. Symmetric patterns of the total number of COVID-19 cases in Thailand, Singapore, Vietnam, and Hong Kong,were investigated. The sample mean and variance method and the delta method were used for estimating the mean and variance to detect the first hitting time on the EWMA control chart, of which the former method detected the first hitting time better than the latter.Four COVID-19 alert levels were defined for monitoring COVID-19 outbreaks based on quantile functions: (Q, Q) for level 4, (Q,Q) for level 3, (Q, Q) for level 2, and (Q, Q) for level 1. For example, the quantile functions for Thailand were Q=0.96,Q=37.44, Q=48.91, Q=60.36, and Q=96.84. However,for this research, the delta method which was used for estimating the mean and variance to compare the sample mean and variance method. The sample countries for this research: Thailand, Singapore,Vietnam, and Hong Kong, the delta method could not detect the first hitting time on the EWMA control chart but the delta method could detect the first hitting time on the EWMA control chart for the other countries.
The COVID-19 alert levels identified by using the probabilistic methods mentioned earlier are to help the authorities to enact policies that monitor, control, and protect the population from a COVID-19 outbreak. For example, a strict lockdown policy should be employed for a COVID-19 alert level 4 situation to flatten the total number of COVID-19 cases following a symmetric logistic growth curve while relaxation of the policy should be applied for a COVID-19 alert level 1 situation. Moreover, a new COVID-19 wave can be identified by the EWMA control chart when the monitoring shows that the infection rate is out-of-control, i.e., exceeds the upper control limit.
Conflict of interest statement
We declare that we have no conflict of interest.
Funding
The research was funding by King Mongkut's University of Technology North Bangkok Contract no. KMUTNB-61-KNOW-014.
Authors’ contributions
All authors substantially contributed to drafting, revising the article as well as the final version of the manuscript. R.S. contributed to the conception and design of the study and the theoretical proof. Y.A.provided data and performed the data analysis. Both R.S. and Y.A.authors contributed to analyze, interpret, and summarize the results of the study. Asian Pacific Journal of Tropical Medicine2021年8期
- Asian Pacific Journal of Tropical Medicine的其它文章
- Pediatric perspectives on treating uncommon genotypes of hepatitis C in the United States
- Determinants of COVID-19 vaccine acceptance and encountered side-effects among the vaccinated in Bangladesh
- Failure of space spraying to eliminate dengue virus-infected Aedes aegypti may explain failure to prevent secondary cases in Southern Thailand
- Co-expression of HBZ, TAX and FOXp3 and HTLV-1-associated myelopathy/tropical spastic paraparesis development in HTLV-1-infected individuals: A systematic review
- Predictors of in-hospital mortality by logistic regression analysis among melioidosis patients in Northern Malaysia: A retrospective study
- Prevalence and clinical significance of antiphospholipid antibodies among hospitalized COVID-19 patients