
Investigation of non-thermal atmospheric plasma for the degradation of avermectin solution
2021-05-22 07:01:30YueLV呂悅LiangZOU鄒亮HuidongLI李慧冬ZileiCHEN陳子雷XiaolongWANG王曉龍YingSUN孫瀅LipingFANG方麗萍TongZHAO趙彤andYuantaoZHANG張遠濤
Plasma Science and Technology 2021年5期
Yue LV (呂悅), Liang ZOU (鄒亮), Huidong LI (李慧冬), Zilei CHEN (陳子雷), Xiaolong WANG (王曉龍), Ying SUN (孫瀅), Liping FANG (方麗萍),Tong ZHAO (趙彤)and Yuantao ZHANG (張遠濤)
1 School of Electrical Engineering, Shandong University, Ji’nan 250061, People’s Republic of China
2 Institute of Agricultural Quality Standards and Testing Technology, Shandong Academy of Agricultural Sciences, Ji’nan 250061, People’s Republic of China
Abstract Increasing concern with regard to food safety in the presence of pesticide residues (PRs) on the surface of agricultural products has resulted in the rapid development of practical degrading technologies for corresponding PRs.In this paper, an unconventional method of degrading pesticides, non-thermal atmospheric plasma (NTAP), was proposed to degrade the avermectin(AVM) in aqueous solution.Optical emission spectroscopy shows that NTAP, consisting of filamentary streamers, contains a variety of reactive oxygen species (ROS) that may interact with AVM.The high-performance liquid chromatography (HPLC)-MS/MS results indicate that the efficiency of AVM degradation seriously depends on multiple operation parameters of the NTAP,including the applied voltage, treatment time and gas flow rate.The maximum degradation rate of AVM was observed to be 97.47% after 240 s exposure under NTAP with an applied voltage of 18 kV and gas flow rate of 1 l min?1.Molecular dynamics simulation based on a reactive force field for the interaction between O (ground state atomic oxygen) and AVM was performed to analyze the underpinning mechanisms.The simulation result shows the possible pathways of the NTAPgenerated O degrading AVM by destroying the glycosyl group or fracturing the ester group.
Keywords: non-thermal atmospheric plasma, pesticide degradation, avermectins, molecular dynamics simulation
1.Introduction
Avermectin (AVM), as a common pesticide to control pests on fruit and vegetables,is one kind of 16-membered macrolide with a unique chemical interaction mechanism.Many researches have reported the correlation between AVM and human chronic diseases,which demonstrates the toxicity of AVM[1–3].Therefore,effective and reliable methods of removing the residual AVM on agricultural products need to be developed to adhere to current pesticide residue regulations [4] and ensure food safety.
Recently,the application of non-thermal atmospheric plasma(NTAP)in the degradation of pesticides on agricultural products has been widely implemented[5].Mousaviet al[6]demonstrated that the highest degradation rates of diazinon and chlorpyrifos were 87.38%and 86.96%,respectively,with the dielectric barrier discharge (DBD) plasma treatment time of 10 min and applied voltage of 13 kV.Gliding arc discharges were applied to degrade cypermethrin and chlorpyrifos on the surface of mangoes in[7] and the level of pesticide was reduced by 63% and 74%,respectively, after being treated by NTAP for 5 min.
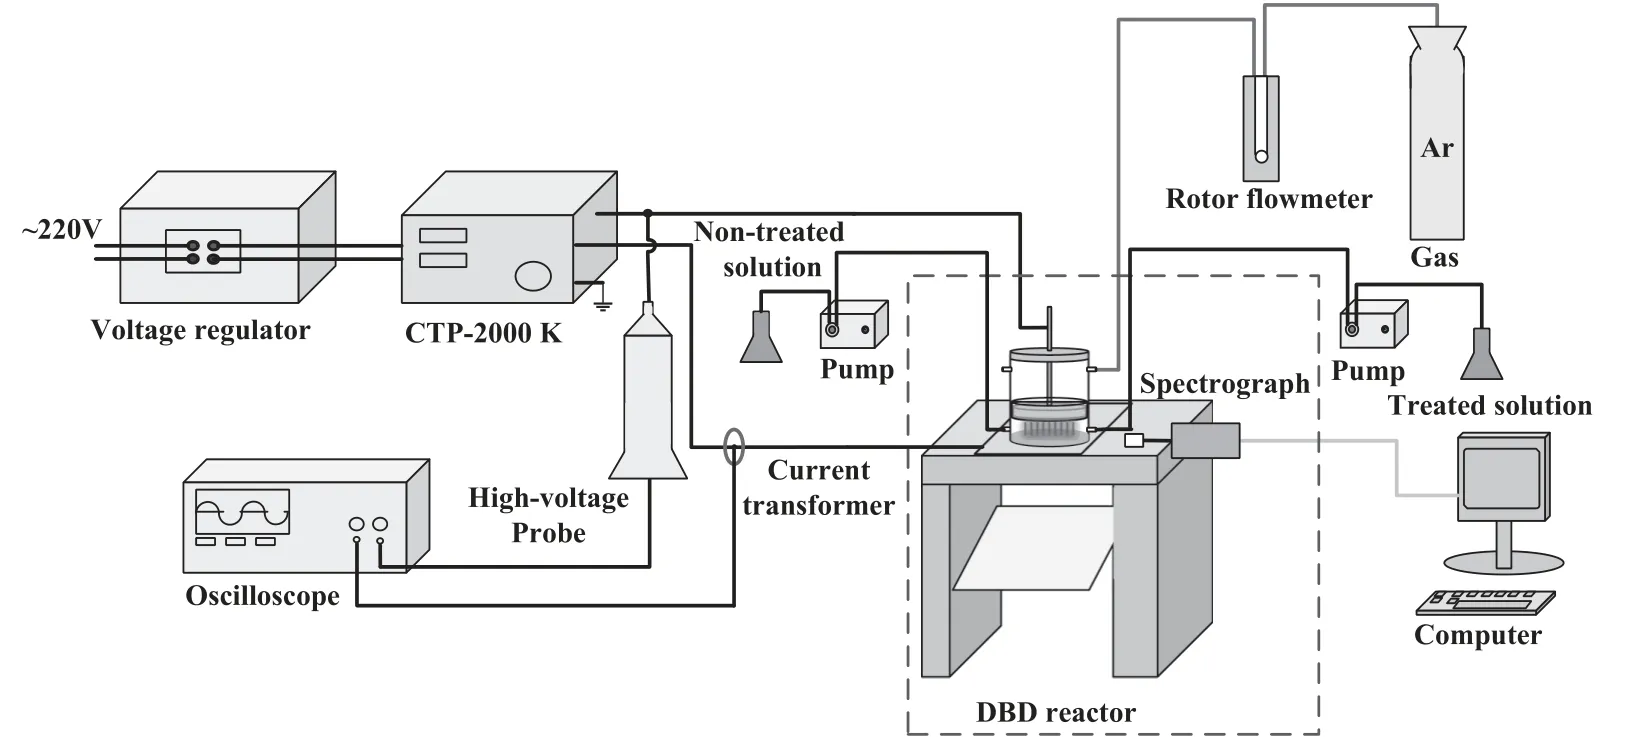
Figure 1.Schematic diagram of the experimental setup of NTAP for AVM degradation.
The degradation effect of the NTAP results from the interaction between NTAP-generated particles and pesticide molecules.As reported in [8], the NTAP produces numerous high-energy electrons and plenty of ROS species,such as O3,OH· and H2O2, which can be tailored by the operation parameters, including gas mixture, gas flow rate, voltage,frequency, etc.According to [9, 10], the electrons in atmospheric plasmas gain energy, which varies from 0–10 eV mainly through electron heating, and some pesticide molecules with similar bond-dissociation energy to that of the discharge gas are expected to be damaged during plasma treatment.During the cold plasma treatment process,reactive oxygen species (ROS) with high oxidation potentials may result in pesticide degradation, which has been examined in[11,12]in detail.Zhuet al[13]found that highly ROS,such as ground state atomic oxygen and metastable oxygen, produced by atmospheric pressure radio-frequency plasma jet at relatively low temperatures could degrade the malathion by the breaking of the C–S bond and P–S bond and the oxidation of the P=S bond.In[14],a similar result was obtained where the degradation pathway of omethoate treated by air surface DBD plasma begins with the attack of high-energy electrons and ROS on P–S and C–S.It has been proved that plasma is a potential pesticide degradation method that could be applied in practical AVM-degrading operation for agricultural products.
Few studies focus on the NTAP-degrading AVM and the corresponding mechanism is still undiscovered.Consequently, a series of advanced experimental and numerical investigations are performed for the purpose of establishing a comprehensive understanding of the interactions between NTAP and AVM.
There are several discharge modes available to be applied for the generation of NTAP in present researches[15],such as homogeneous DBDs, gliding arcs [16], corona discharges[17], microwave-driven discharges [18] and plasma jets [19]driven by various power sources.Among these options,DBDs, especially large-volume and homogeneous DBDs show many significant advantages over others, which could be sustained for a long time without serious gas heating because of the barriers in the atmospheric environment [20].In practice, DBDs that were employed to generate plasma in the NTAP-AVM degradation system have proved to be most suitable for the pesticide-degrading treatment on fruit and vegetables with irregular shapes [21, 22].The reactive force field molecular dynamics(ReaxFF MD)simulation,based on the bond order of the instantaneous distance between atoms,has proved to be effective in revealing the reaction mechanisms of ROS and organic molecules [23–25], which can be extended to the research of plasma application on pesticide degradation.
In this paper, the correlation between the operation parameters(applied voltage,treatment time and gas flow rate)and the degradation effects on AVM are investigated, which can be used to optimize the operation of the NTAP-degrading-AVM systems and tailor their degradation parameters to specific practical requirements.The possible reaction pathways between NTAP-generated O and AVM are obtained from computational data in ReaxFF MD simulation.The experimental and simulation results will help promote the application of DBD-generated NTAP in agricultural pesticide-degrading industries.
2.Experimental setup
The degradation effect of NTAP on AVM and its corresponding characteristics have been experimentally investigated.Figure 1 shows the schematic configuration of the experimental setup, including the high-frequency AC power generation system,NTAP generation and AVM treatment device,and diagnostic system.
The AC power generation system consists of an AC transformer and a high-frequency power supply (CTP-2000 K),producing a sinusoidal high-voltage(HV)waveform with amplitude of up to 30 kV and frequency less than 10 kHz.In this experiment, only when the frequency is larger than 8.3 kHz, can a stable discharge be sustained.
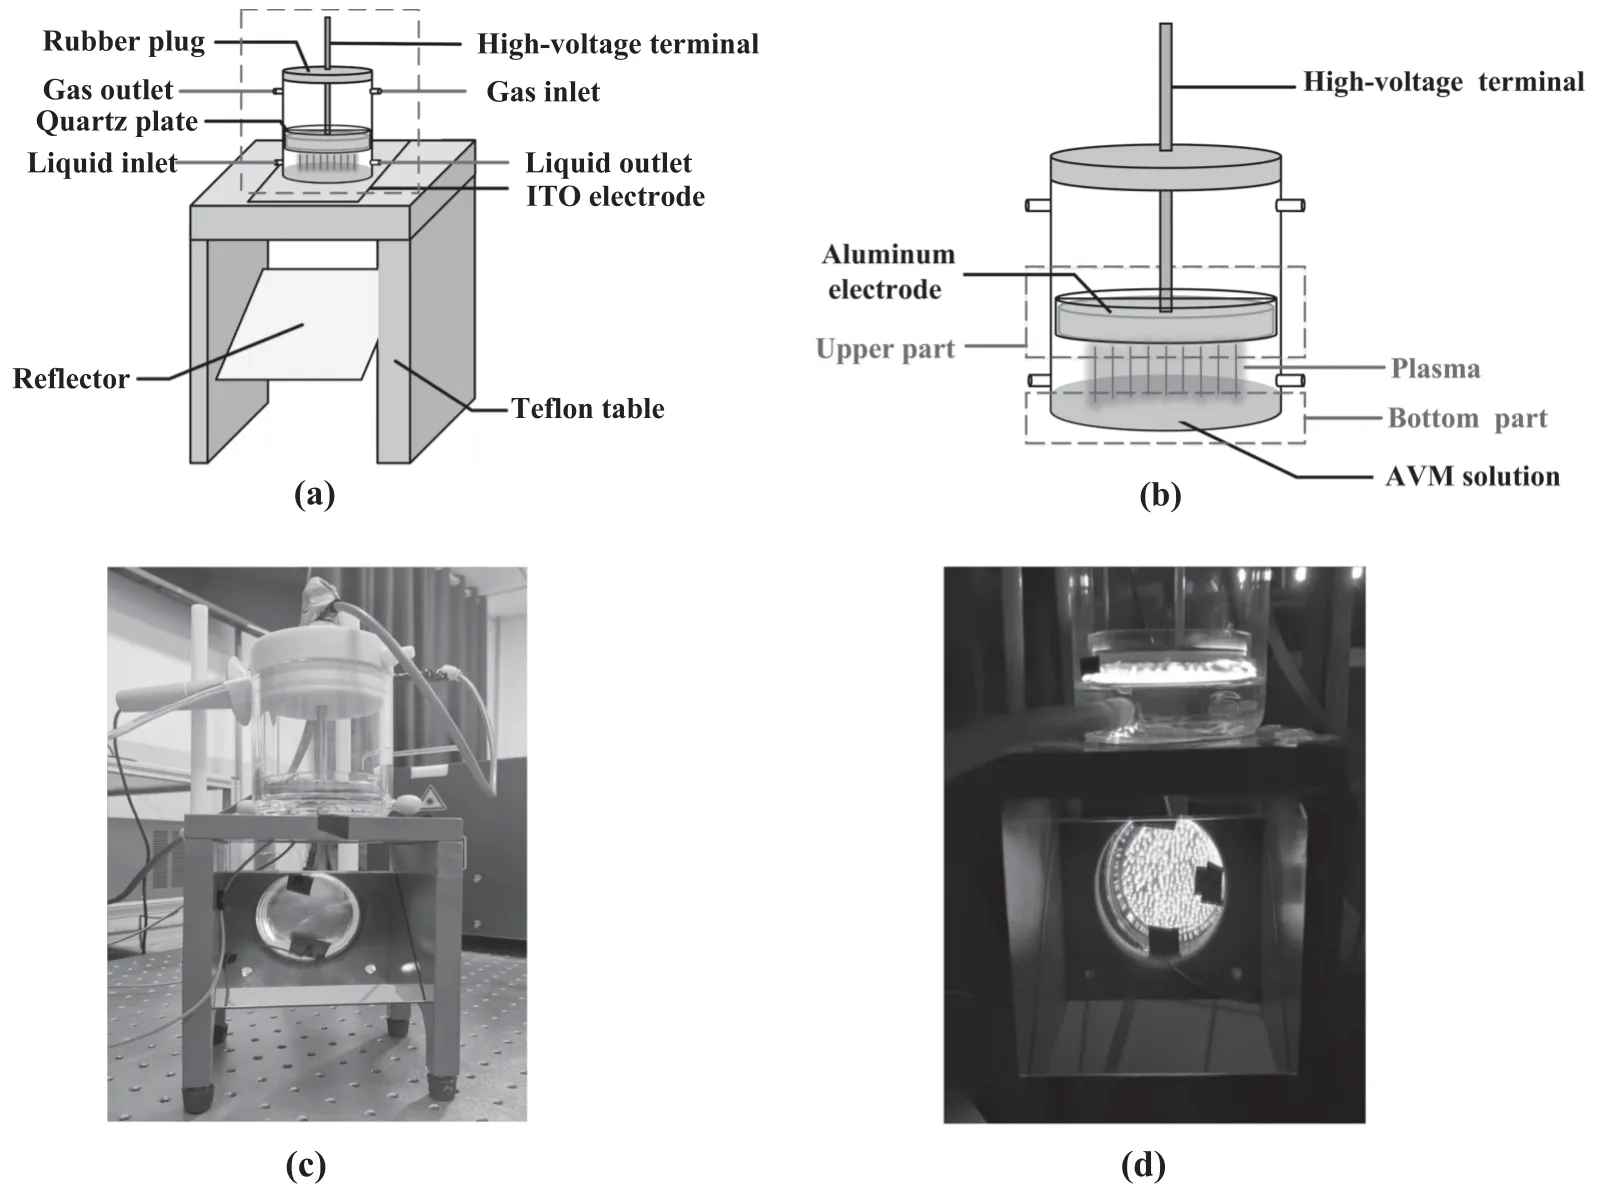
Figure 2.(a) Schematic diagram of the NTAP generation and AVM treatment device, (b) schematic diagram of the NTAP reactor, (c)photograph of the reactor and (d) photograph of AVM treatment.
The configuration and actual structure of the NTAP generation and AVM treatment device are shown in figure 2,where figure 2(a)is the schematic design of the test cell while figure 2(b) demonstrates the interaction between the generated NTAP and the liquid solution.The plasma reactor is a sealed cylindrical quartz container(with the inner diameter of 80 mm and outer diameter of 85 mm),consisting of two parts,the top HV seal and the bottom body.The top HV seal is a round duralumin electrode(with the outer diameter of 70 mm)fixed in the middle of a quartz glass dish for HV input.The quartz glass dish, as a charge trapping agent, effectively restricts the charge transported in the discharge and prevents the appearance of arcs.The bottom body holds AVM solution or pure water, contacting with the DBD-generated NTAP directly.Standard AVM (100 mg l?1, purity >98%) was obtained from Tianjin Alta Technology Co., Ltd.A transparent electrode composed of indium tin oxide (ITO) film is placed under the reactor.Gaseous Ar (purity ≥99.999%) is the working gas and its flow rate is controlled by a gas mass flow controller from Nanning Xinkong Instrument Co., Ltd.The pesticide solution is injected into the reactor by using a peristaltic pump.When high voltage is applied to the HV electrode,the Ar in the reactor is excited and ionized,leading to the generation of plasma in contact with the solution and thereby massive ROS in the gap between the HV electrode and solution surface.A reflector with a 45 degree tilt was installed under the reactor to observe the discharge in the reactor intuitively.
The diagnostic system includes electrical diagnosis analysis, optical emission spectroscopy, conductivity and pH analysis, and high-performance liquid chromatography(HPLC)-MS/MS analysis.An HV probe,Tektronix P6015A,and a current transformer probe, CT-C2.5-SMA, were employed to capture the voltage and current waveforms for DBDs, which were recorded by using a digital oscilloscope,Agilent Technologies DSO1024A.The fiber optic cable of the spectrometer,BWTEK,Exemplar LS,was placed pointing to the DBDs from the outside container, to obtain the optical spectra for DBDs to examine the species of the high-energy particles.Only pure water was selected, in this case, to interact with NTAP to avoid the appearance of non-ROS as potential disturbance from the liquid.The conductivity meter,DDS-307A,and a pH meter,SANXIN-SX721,were selected to diagnose the conductivity σ and pH of the solution after NTAP treatment.An Agilent 6460 Triple Quadrupole LC/MS system (Agilent Technologies, Santa Clara, CA) was employed to analyze the concentrations of AVM that remained in the solution after the treatment by using an Agilent ZORBAX Eclipse Plus-C18 column (50 mm × 2.1 mm I.D., 1.8 μm).It is worth noting that the degradation of AVM in this study refers to the destruction of the original structure of AVM, which was not able to be detected by HPLC-MS/MS.The degradation rate η indicates the degradation effect of NTAP on AVM, which is defined as:
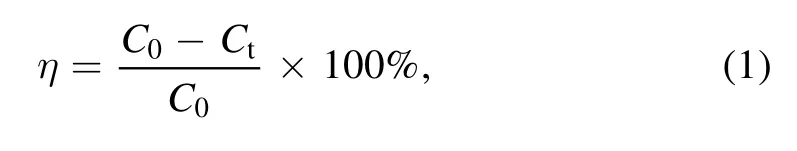
whereC0is the initial concentration of AVM before treatment andCtis the concentration of AVM after treatment for a specific period.The degradation data are fitted to a pseudofirst-order kinetics model and the rate constant is calculated by the following equation:
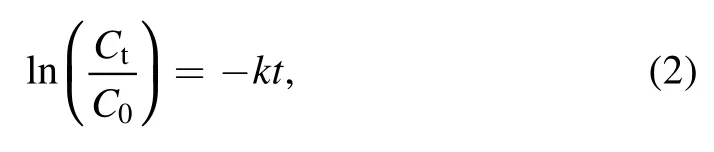
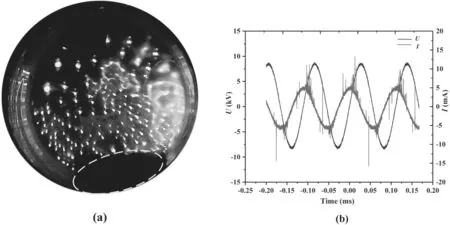
Figure 3.(a) NTAP discharging image and (b) corresponding CVCs.
whereCtandC0are the same as in equation (1),kis the rate constant (s?1) of the reaction andtis the treatment time (s).The model fitting is evaluated based on the coefficient of regression [R2].Moreover, the power of the NTAP reactor is obtained by calculating the Lissajous figure.The 0.47 μF capacitance built-in CTP-2000 K is regarded as the sampling capacitance.The Lissajous figure of DBD discharge in a fixed frequency can be obtained by measuring the discharge voltage and the voltage at both ends of the sampling capacitor,respectively.The calculation equation of discharge power is as follows:
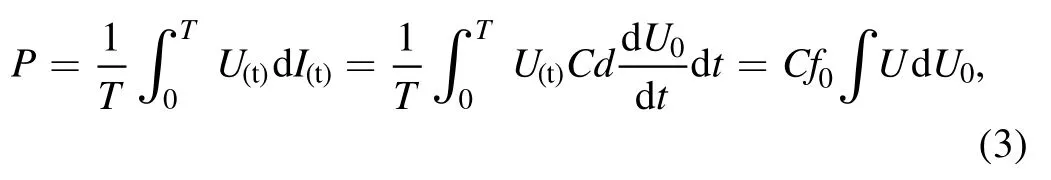
whereCis the measured capacitance,f0is the driving frequency,Uis the discharge voltage andU0is the voltage at both ends of the sampling capacitance.The mass of pollutant per unit energy when the target pollutant is degraded by 50%,G50,is defined to measure the energy efficiency of the NTAP reactor.The calculation equation is:
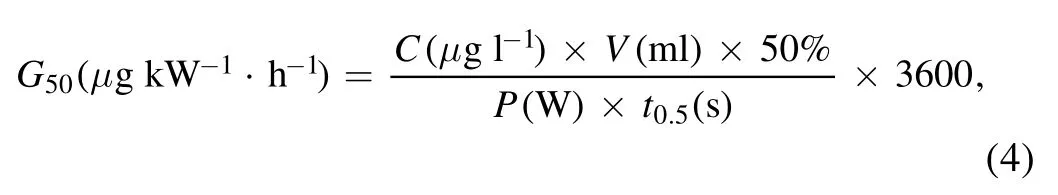
whereCis the initial concentration of AVM,Vis the solution’s volume,t0.5is the time it takes for the AVM to degrade by 50% andPis the corresponding discharge power.
3.Results and discussion
Diagnostic experiments for DBDs under the same specific conditions were conducted three times to ensure the consistency of the results, including the optical spectrum and degradation rate of the AVM solutions.A mathematical analysis, one-way analysis of variance, was employed to analyze the effect of NTAP on the degradation of AVM at a significance level ofp≤0.05.
3.1.Characteristics of DBDs
The appearance of DBDs in pure gases at atmospheric pressure normally corresponds to the short-lived pulses in current waveforms,which are randomly distributed in time and space over the dielectric surface [26].Figure 3 shows the typical discharging phenomenon and corresponding current–voltage characteristics(CVCs)of NTAP.After the breakdown of gas,numerous randomly distributed discharge channels can be observed in the discharge gap.The dark image marked with a yellow circle in figure 3(a)represents the reactor area visually blocked by the ground tape, where discharge filaments exist.The area marked in a red circle is an enhanced discharge area,which may be explained by the adhesion of discharge filaments near the gas inlet under the influence of the gas flow rate.The ROS generated by NTAP could enter the solution through the gas–liquid interface [27] and degrade pesticides in the solution.As shown in figure 3(b), many discharge pulses are observed due to the filamentary discharge mode at atmospheric pressure.The discharge CVCs indicate that the experimental circuit is a resistance-capacitance circuit.
Figure 4(a) is the Lissajous figure at 18 kV.The discharge power of the NTAP reactor can be obtained by calculating the area of the Lissajous figure.Figure 4(b) reveals that the discharge power increases gradually with the increase in applied voltage with the frequency of 9 kHz.When the applied voltage is 18 kV, the discharge power of the NTAP reactor is 287.82 W.
3.2.Optical emission spectra of NTAP
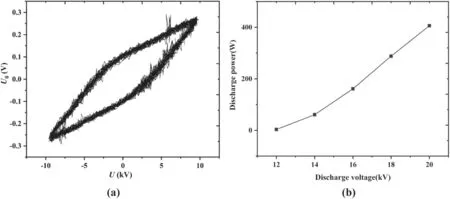
Figure 4.(a) Lissajous figure of DBDs at 18 kV with a fixed frequency of 9 kHz and (b) the relation diagram of discharge voltage and discharge power of the NTAP reactor.
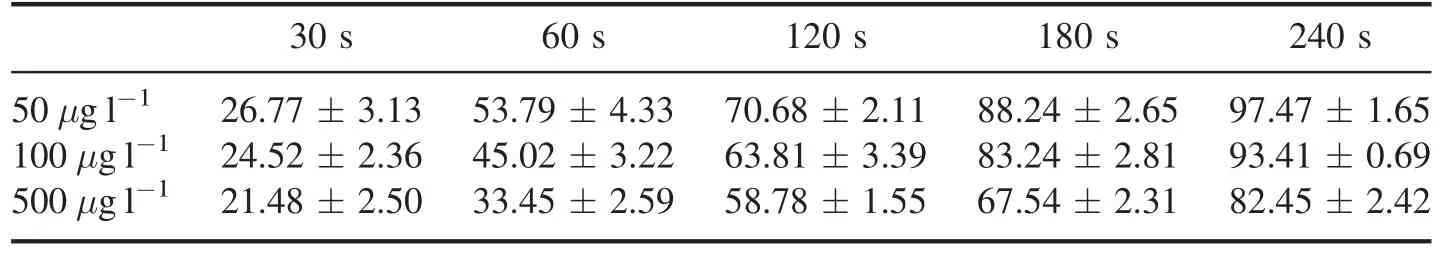
Table 1.Degradation rate (%) of AVM at different treatment times with the applied voltage at 18 kV and gas flow rate at 1 l min?1.
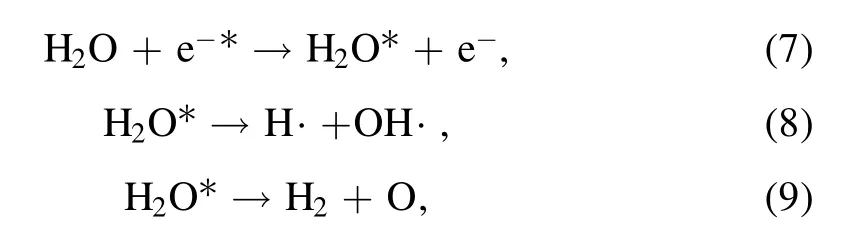
In atmospheric DBDs, a variety of ROS can be produced in plasmas, which could be detected and distinguished by emission spectroscopy [28].Figure 5 shows the optical emission spectra, ranging from 200–900 nm for DBDs and the emission spectrum intensity was quantified as a function of wavelength.As mentioned above,ROS plays an important role in pesticide degradation.In this case,only pure water was selected to interact with NTAP, which contributed to the analysis of ROS species in plasma and eliminated the potential disturbance caused by the direct interaction between the NTAP and solution.The intensity of spectral emission at 20 kV is higher than that at 18 kV.Both emission spectra are dominated by Ar atomic emission lines (690–810 nm), some of which are related to the high-energy metastable state of Ar atoms (Ar?).For example, the emission lines at 696 and 763 nm are related to Ar?at3P2with excitation energy of 13.328 and 13.172 eV, respectively, while the emission lines at 772 nm are related to Ar?at3P0with excitation energy of 13.328 eV [29, 30].Moreover, the spectral lines of OH·(309 nm) and O (798.7 nm) with strong oxidizability are observed.It is suspected that the collision of Ar?and highenergy electrons with H2O may contribute to the generation of these ROS [31].During this collision process, water molecules are excited due to the energy transfer.The excited water molecules are further decomposed into OH·and O[32].Optical emission spectra indicate the potential effectiveness of NTAP in pesticide degradation.The relevant chemical reactions are [33, 34]:
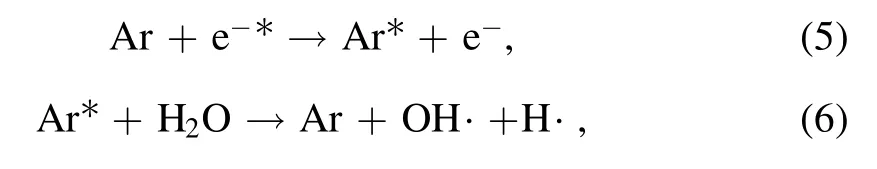
where e??is the high-energy charge, Ar?is the high-energy metastable state of Ar atom and H2O?is the excited state of H2O molecule.The H·, OH·and O are hydrogen atom,hydroxyl radical and oxygen atom, respectively.
3.3.Degradation effect of AVM by NTAP
3.3.1.Effect of plasma treatment time on the degradation of AVM.The effect of plasma treatment time on the degradation of AVM is investigated in this section.The treatment time ranged from 30–240 s with increments of 30 s.Three different values of the initial concentration were designed when the applied discharge voltage was kept at 18 kV,exciting frequency at 9 kHz and gas flow rate at 1 l min?1.
As shown in figure 6, the value of η increases with the increase in the treatment time for all three values of the initial concentration.Table 1 shows that the values of η are 26.77%, 53.79%, 70.68%, 88.24% and 97.47% when the 50 μg l?1AVM solutions were treated by NTAP for 30,60,120, 180 and 240 s, respectively.These observations are similar to the experimental results obtained for the degradation of dimethoate and chlorpyrifos after plasma treatment in [35, 36].It can be explained by the fact that as the treatment time is extended, the amount of ROS generated by NTAP increases.In this case, more reactive species could diffuse into the solution through the gas–liquid interface and collide with pesticide molecules,leading to more AVM being decomposed.
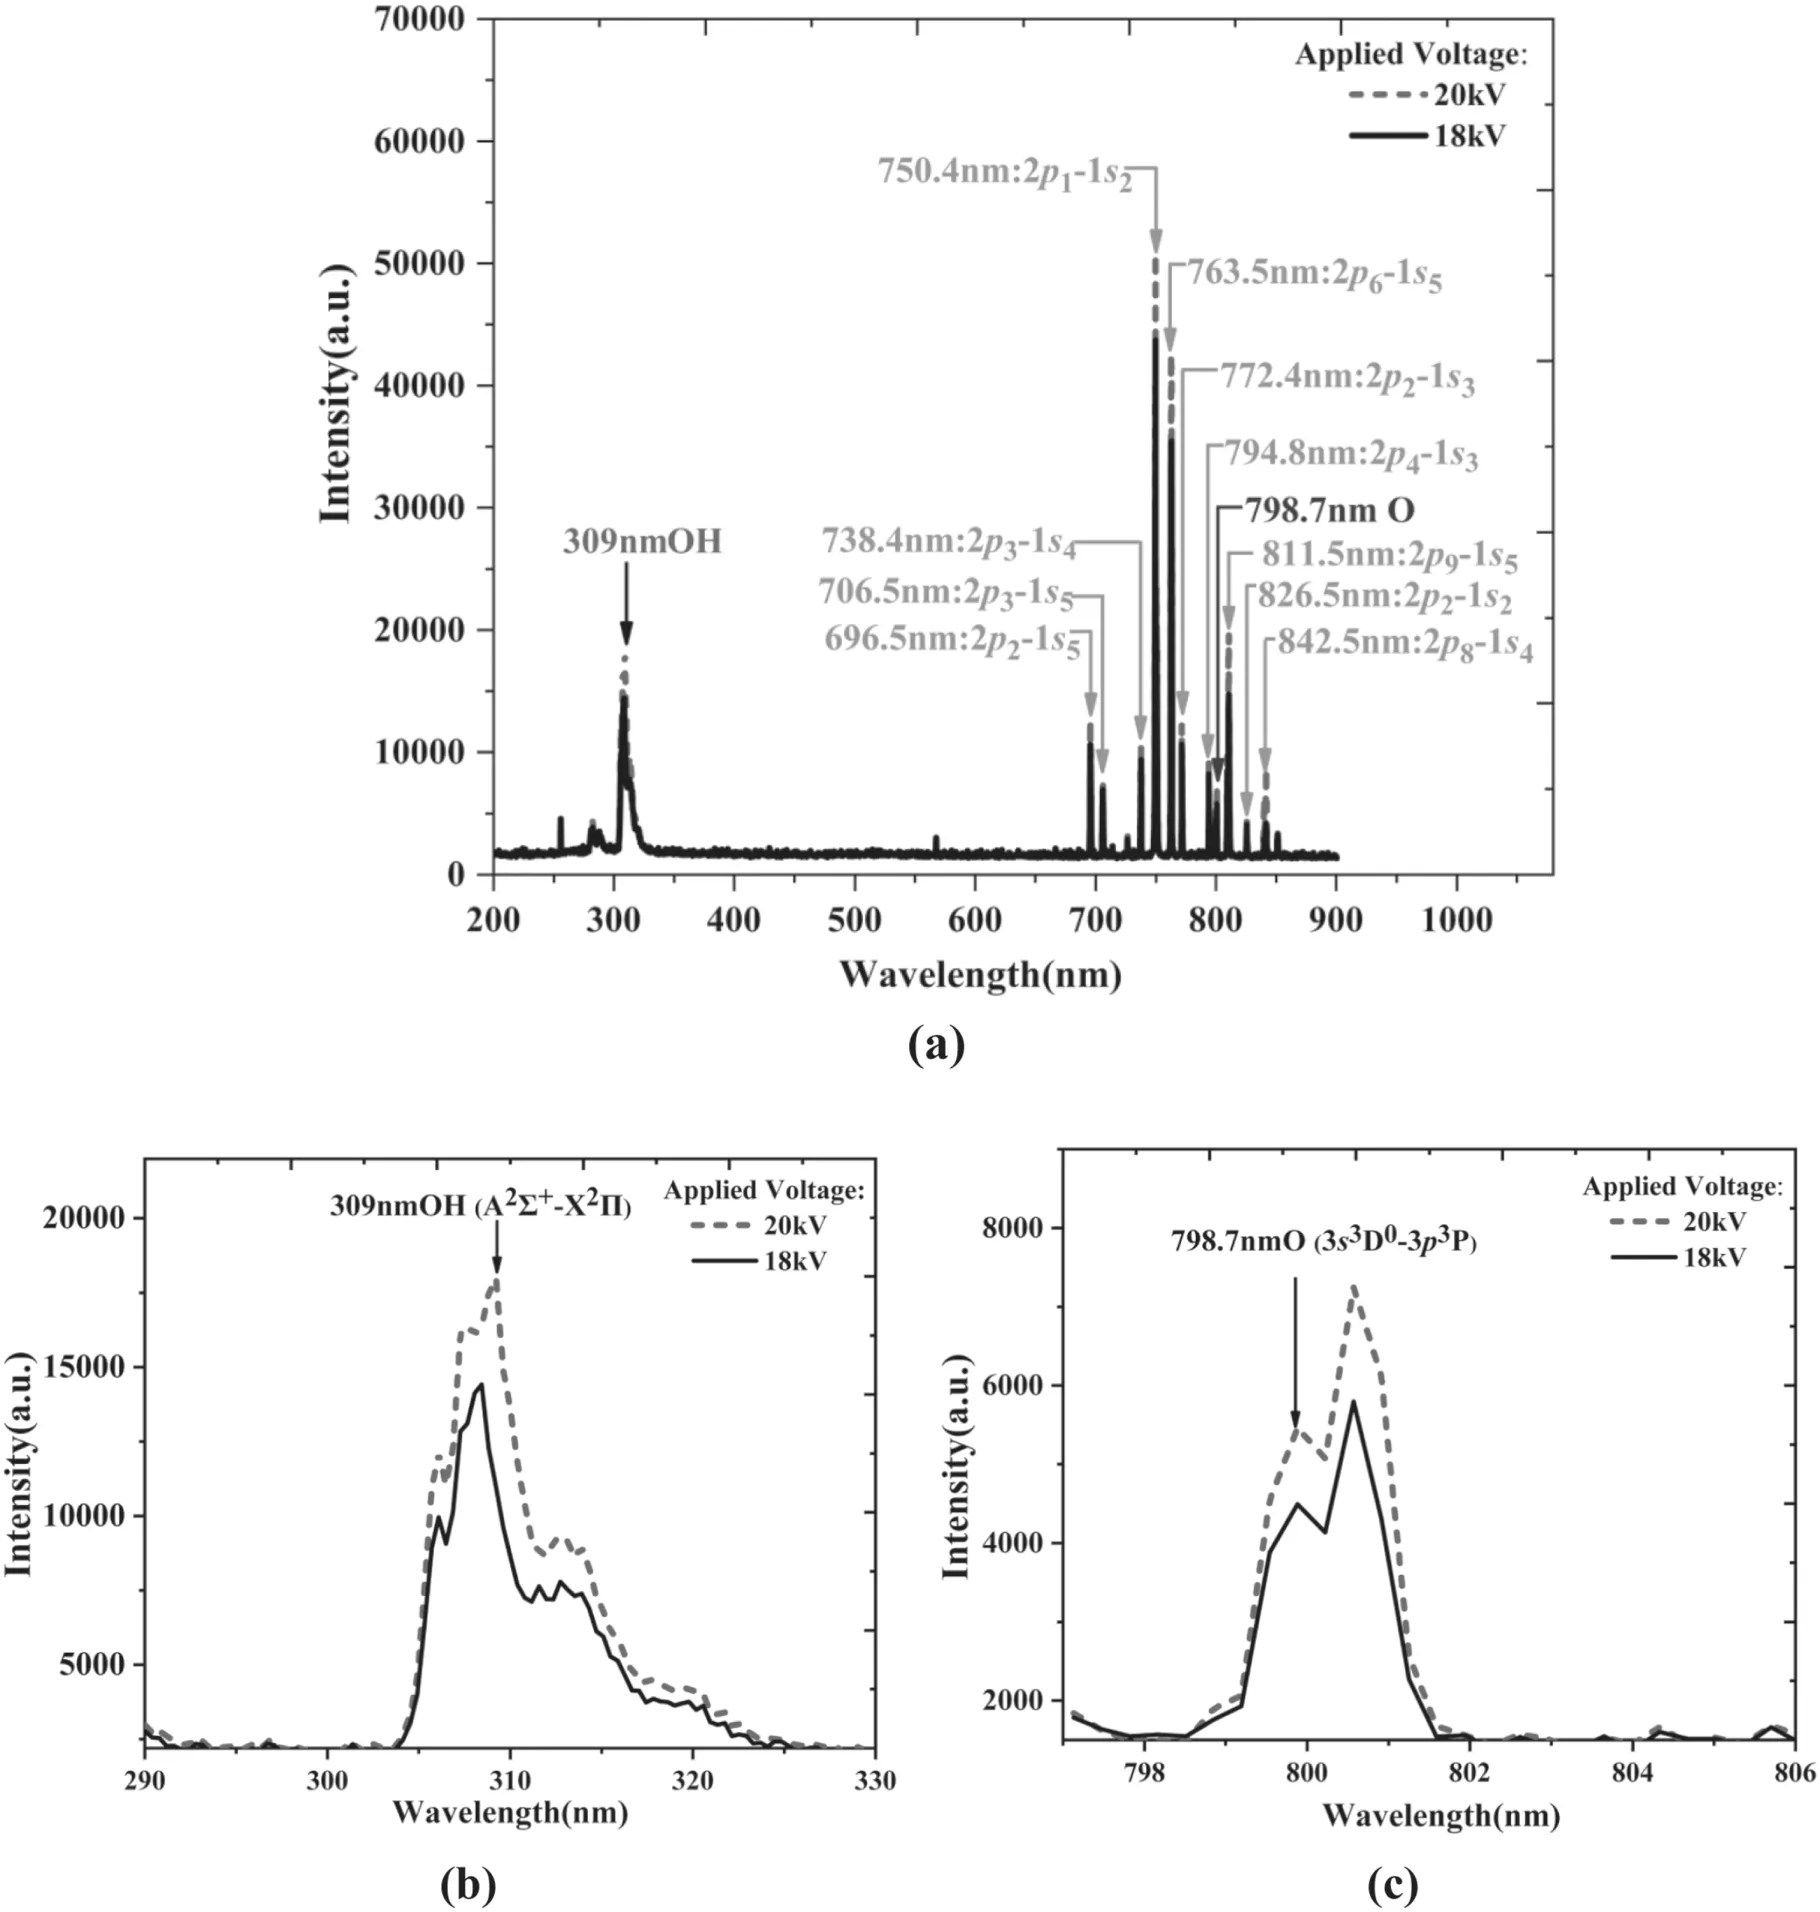
Figure 5.(a)Optical emission spectrum of the NTAP,(b)OH·(309 nm)and(c)O(798.7 nm)emission spectra intensities of NTAP.Red line and black line represent the 18 and 20 kV cases, respectively.
The initial sample concentration is another important parameter determining the values of η.As shown in figure 6,the degradation rate for AVM solution with higher initial concentration is smaller than that with lower initial concentration under the same treatment conditions.However, the actual number of AVM molecules degraded by ROS is larger in the higher initial concentration case.For example, the absolute degraded AVM molecules for 500 μg l?1with 240 s treatment time can be estimated asn500=82.45%× 500×V=412.25V(Vis the volume of the solution),which is much larger than that for the 50 μg l?1case,n50=97.47% × 50×V=48.735V.This can be explained by the difference in the number of AVM molecules making effective contact with ROS for different initial concentration cases under the same ROS conditions.The generated ROS is distributed in the vicinity of the discharge filament areas,shown as luminous dots in figure 3(a), in which case, only some of the AVM molecules have the chance to make direct contact with ROS, especially the ones located near the gas–liquid surface.As a result, AVM solution with higher initial concentration will provide more AVM molecules to interact with ROS,though the corresponding degradation rate may be smaller compared with AVM solution with lower initial concentration.Figure 7 shows that the initial concentration of the solution conforms to the first-order reaction kinetics for the degradation of AVM.The values ofkare 0.0151, 0.0113 and 0.0069 for 50, 100 and 500 μg l?1AVM, respectively.
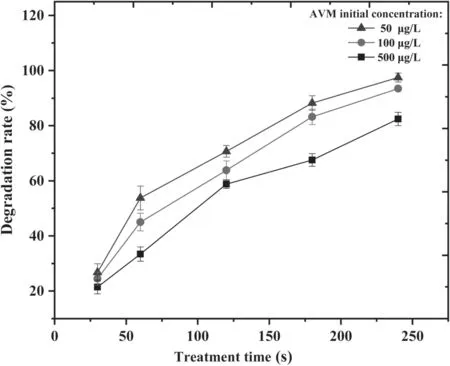
Figure 6.Degradation rate as a function of plasma treatment times for various AVM initial concentrations of 50,100 and 500 μg l?1 at a fixed applied voltage of 18 kV and gas flow rate of 1 l min?1(the error bars represent the values of the standard deviation, the significant difference index is less than 0.05).
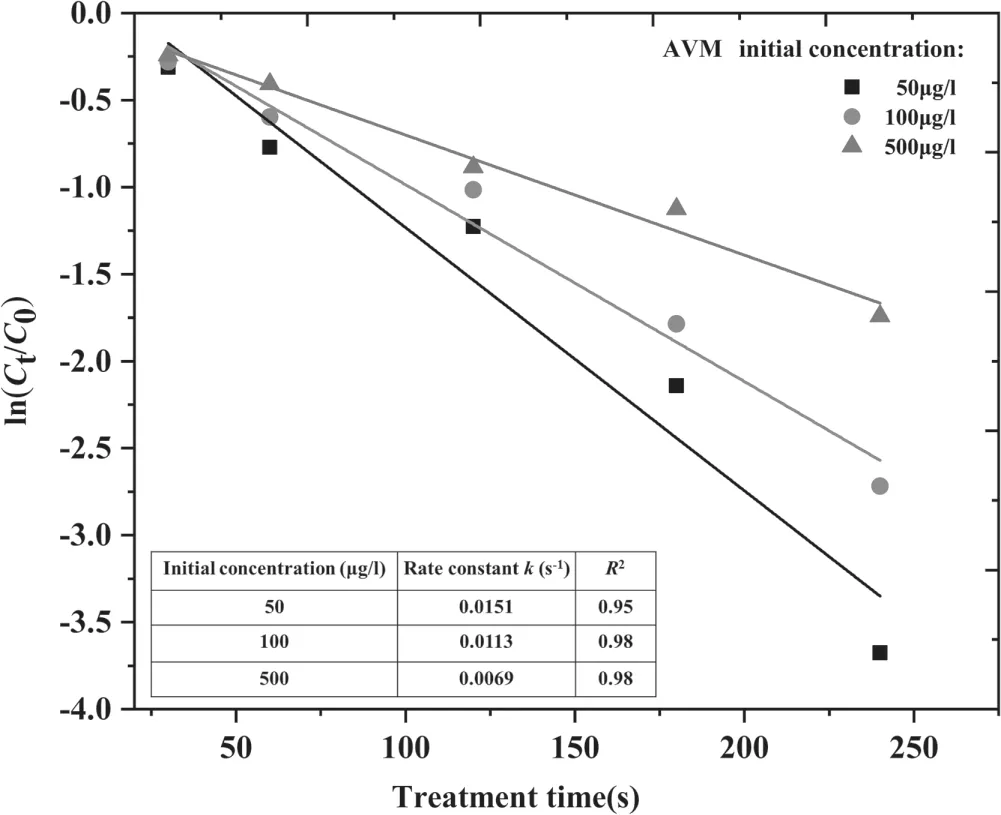
Figure 7.First-order kinetics for AVM degradation at different initial concentrations.
3.3.2.Effect of plasma discharge voltage on the degradation of AVM.The degradation rate of AVM as a function of the applied voltage for three values of AVM initial concentration is demonstrated in figure 8.The voltage ranges from 12–20 kV when the driving frequency is kept at 9 kHz, with a gas flow rate of 1 l min?1and treatment time of 180 s.
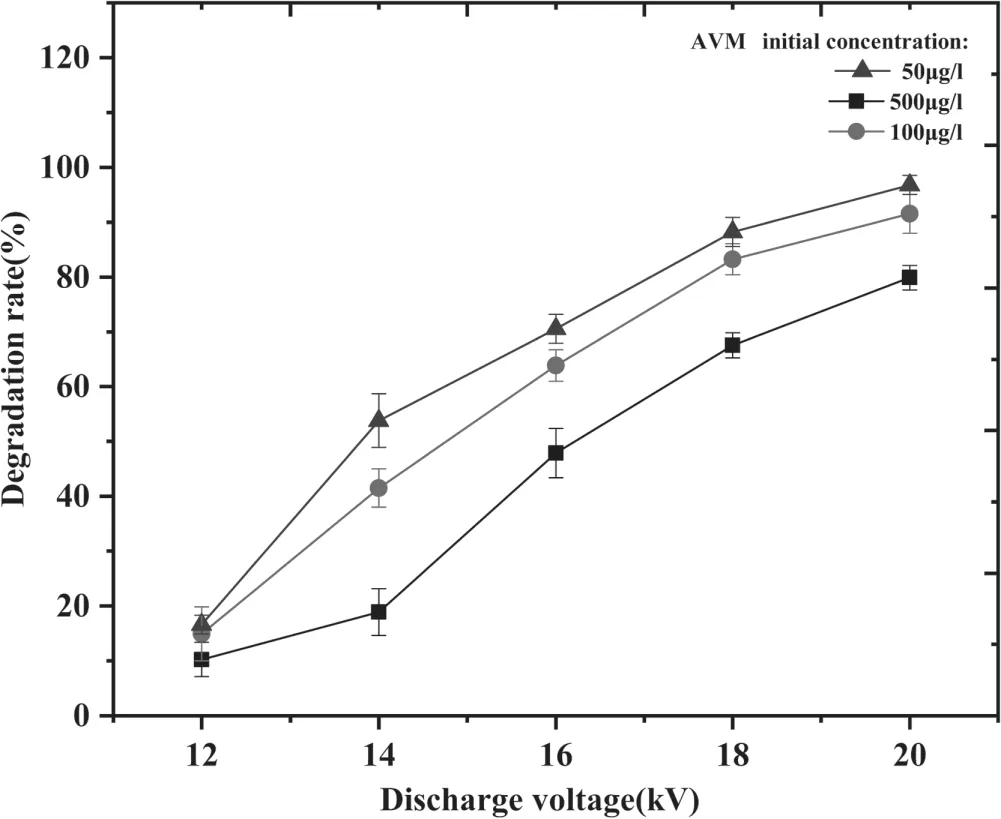
Figure 8.Degradation rate as a function of discharge voltage for various AVM initial concentrations of 50, 100 and 500 μg l?1 at a fixed treatment time of 180 s and gas flow rate of 1 l min?1.(the error bars represent the values of the standard deviation, the significant difference index is less than 0.05).
It can be seen from figure 8 that larger applied voltage implies better degradation effect of ROS on AVM.A similar significant increase in the degradation rate of omethoate and dichlorvos (DDVP), treated by a gas phase surface discharge plasma system was observed with the increase in the applied voltage [37].The applied voltage affects the strength of the electric field and the number of discharge filaments in the reactor.Figure 9 is the discharge images with the applied voltage of 12 and 18 kV.As shown in figure 9(a), discharge filaments cover only a small part of the solution at a low value of applied voltage.More energy can be transferred to plasmas, leading to more discharge filaments appearing in the discharge gap when the applied voltage is increased to 18 kV, as shown in figure 9(b).In this case, the generation of ROS in NTAP is enhanced, resulting in the increase in the degradation of AVM.
3.3.3.Effect of gas flow rate on the degradation of AVM.The effect of the gas flow rate on the degradation of 100 μg l?1AVM is investigated in this section.The treatment time ranged from 30–240 s with increments of 30 s.Five different values of gas flow rate were set when the applied discharge voltage was kept at 18 kV with an exciting frequency of 9 kHz.
As shown in figure 10, the value of η increases with the increase in the treatment time for all five values of gas flow rate.From table 2,the value of η first increases from 89.78%to 96.70%as the Ar flow rate changes from 0.5 to 2.5 l min?1,then decreases from 96.70% to 63.97% when the flow rate changes from 2.5 to 12.5 l min?1, with the treatment time of 240 s.The degradation of AVM at different gas flow rates was modeled using a first-order kinetics linear regression model.As shown in figure 11, the model agrees with the experimental data with high correlation coefficients.In[38],it was observed that the gas flow rate influences the plasmagenerated ROS distribution characteristics in the target liquid.For the gas flow rate of 0.5 l min?1, the force induced by the gas flow leads to a small range of ROS distribution in the radial direction.As the gas flow rate increases to 2.5 l min?1,the force in the radial direction enhances and the radial distribution range of ROS in the liquid expands, which contributes to the reactions and interactions of ROS and AVM.According to [39], the dimpled liquid surface formed by the gas flow prevents the gas flow along the liquid surface.This phenomenon may limit the spreading of ROS in liquid,leading to a decrease in AVM degradation with the gas flow rates of 5,7.5 and 12.5 l min?1.Overall,the optimal Ar flow rate of the reactor is 2.5 l min?1with the maximum value of η being 96.7%.
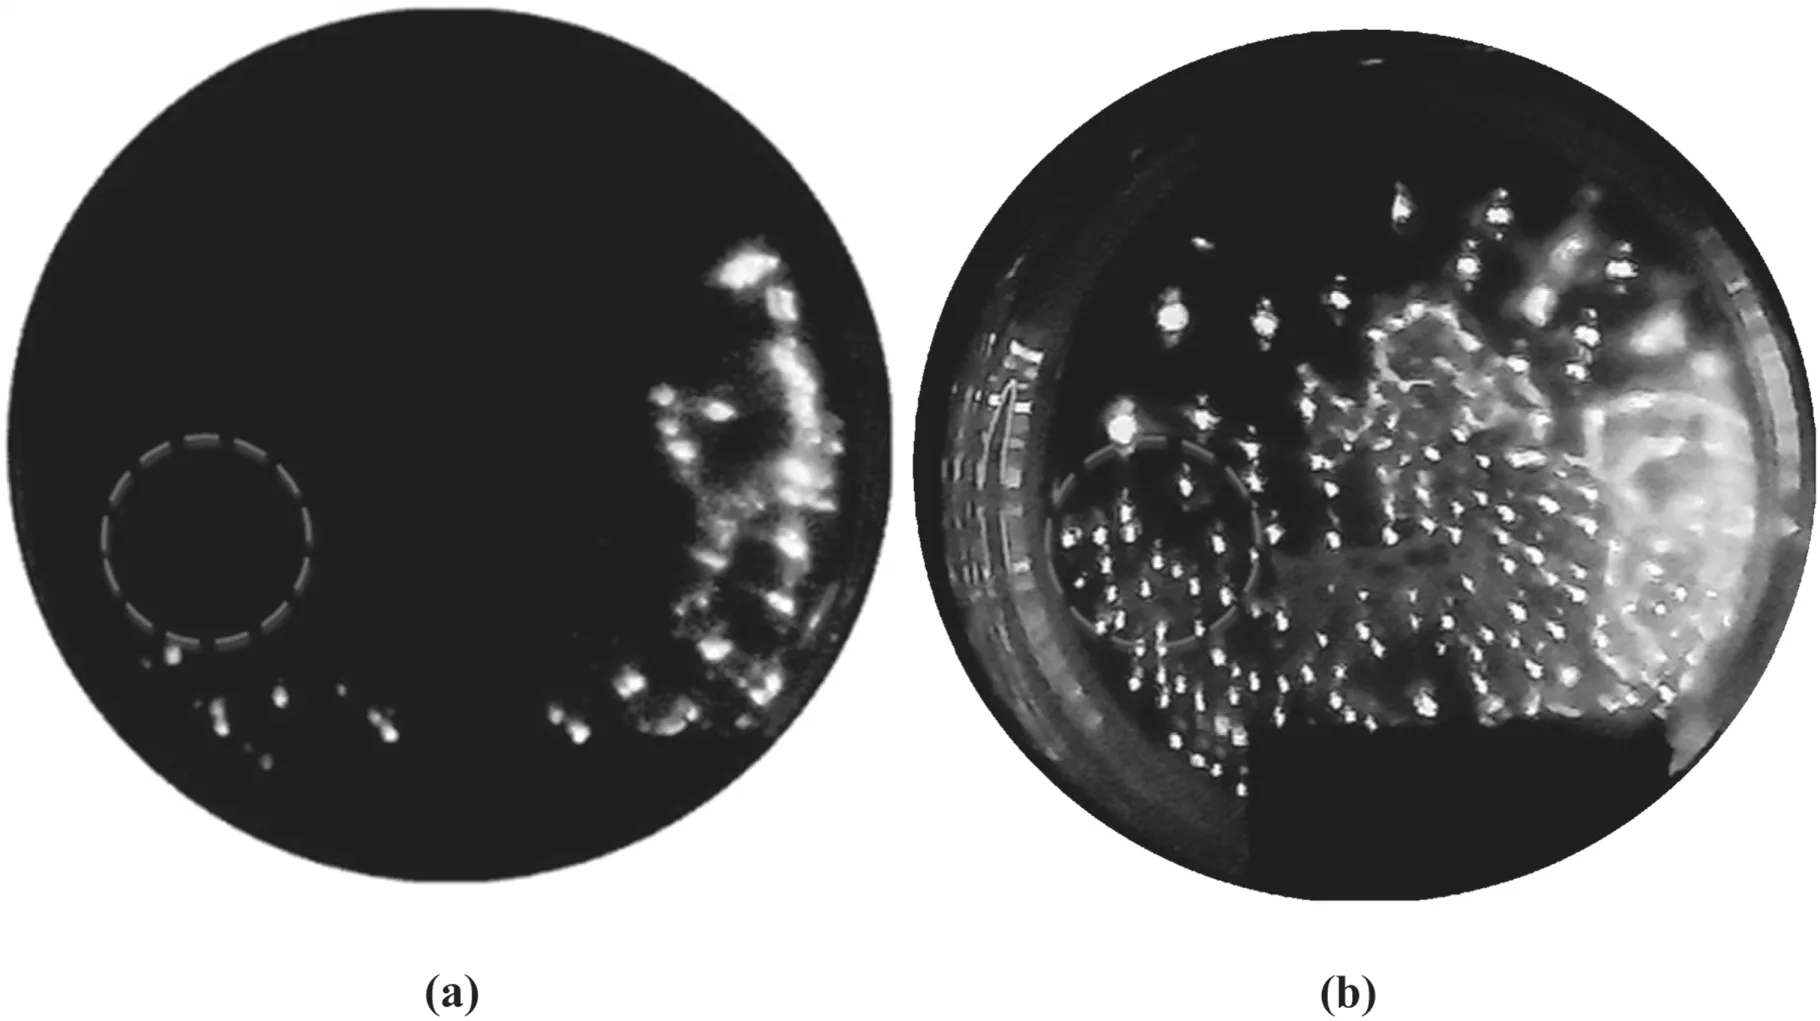
Figure 9.Discharge images of 50 μg l?1 AVM solution treated by NTAP with the applied voltage of (a) 12 kV and (b) 18 kV.
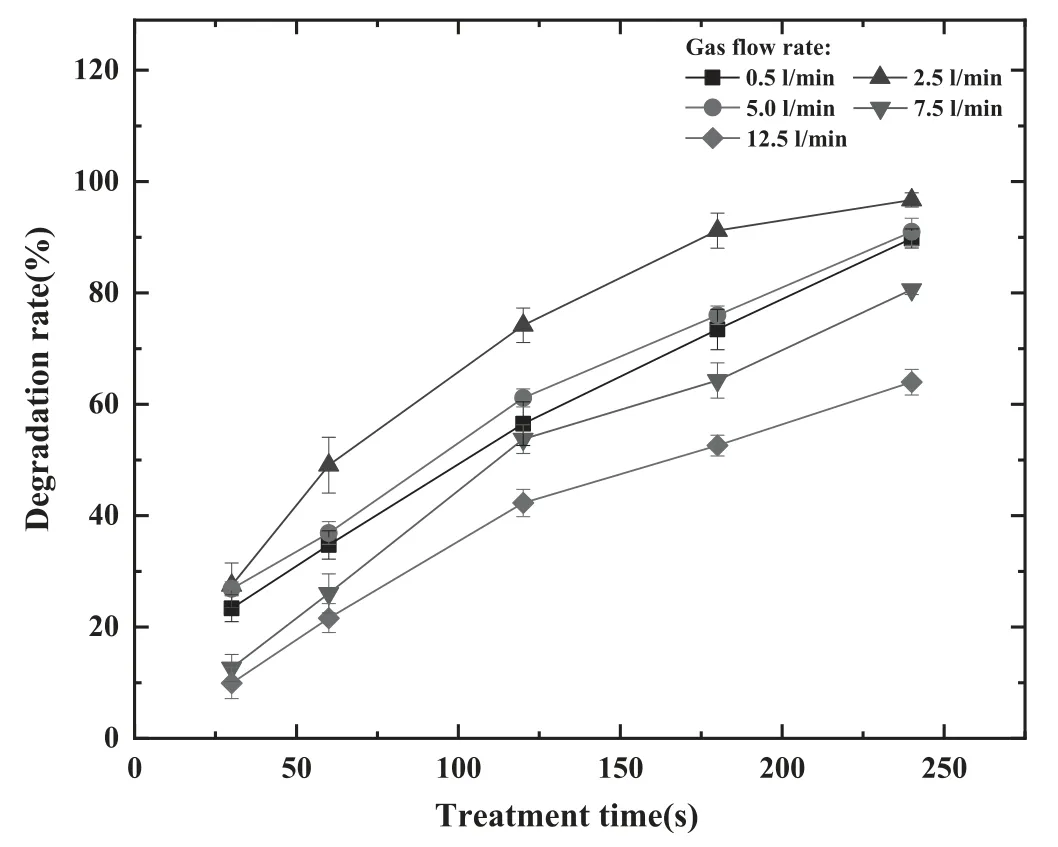
Figure 10.Degradation rate as a function of treatment time for various gas flow rates of 0.5,2.5,5.0,7.5 and 12.5 l min?1 with the fixed discharge voltage of 18 kV and driving frequency of 9 kHz(the error bars represent the values of the standard deviation, the significant difference index is less than 0.05).
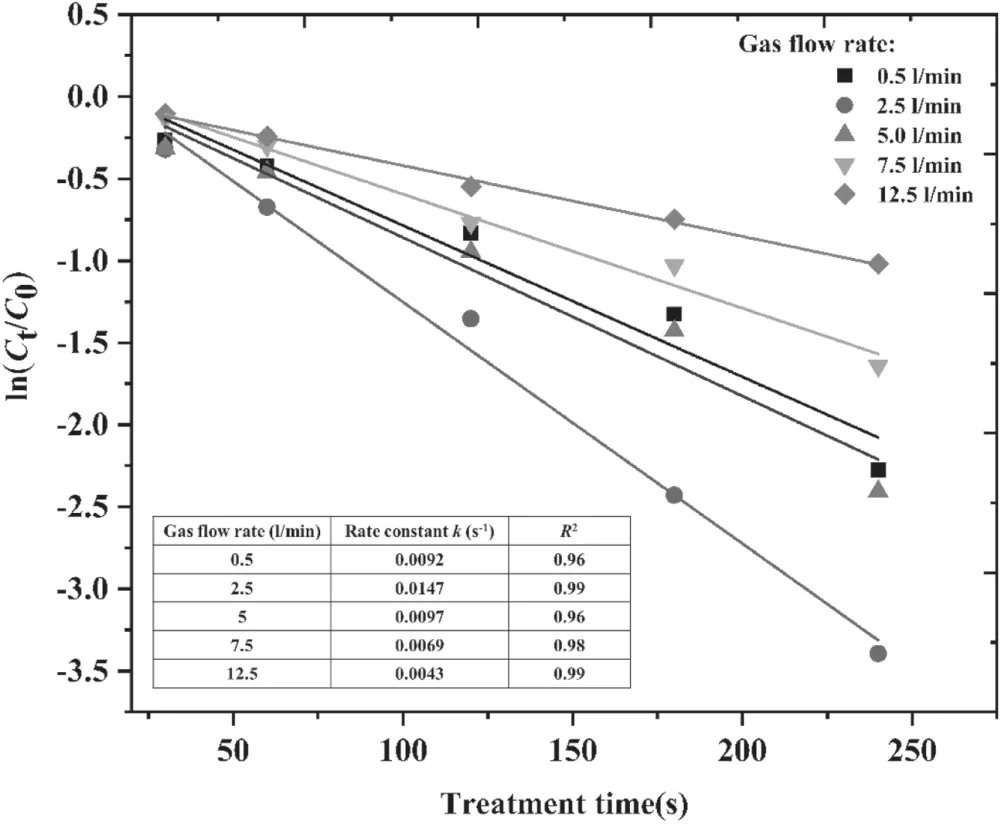
Figure 11.First-order kinetics plots for 100 μg l?1 AVM degradation at different gas flow rates.
3.4.Energy yield of degradation of AVM
The energy yield is an index to evaluate the performance of the NTAP reactor, which depends on the type of NTAP reactor,initial concentration and nature of the compound.It is observed that higher concentration leads to better performance of the NTAP reactor.As shown in table 3, the concentration increases from 50 to 500 μg l?1and the energy yield enhances from 140.13 to 788.14 μg kW?1·h?1.
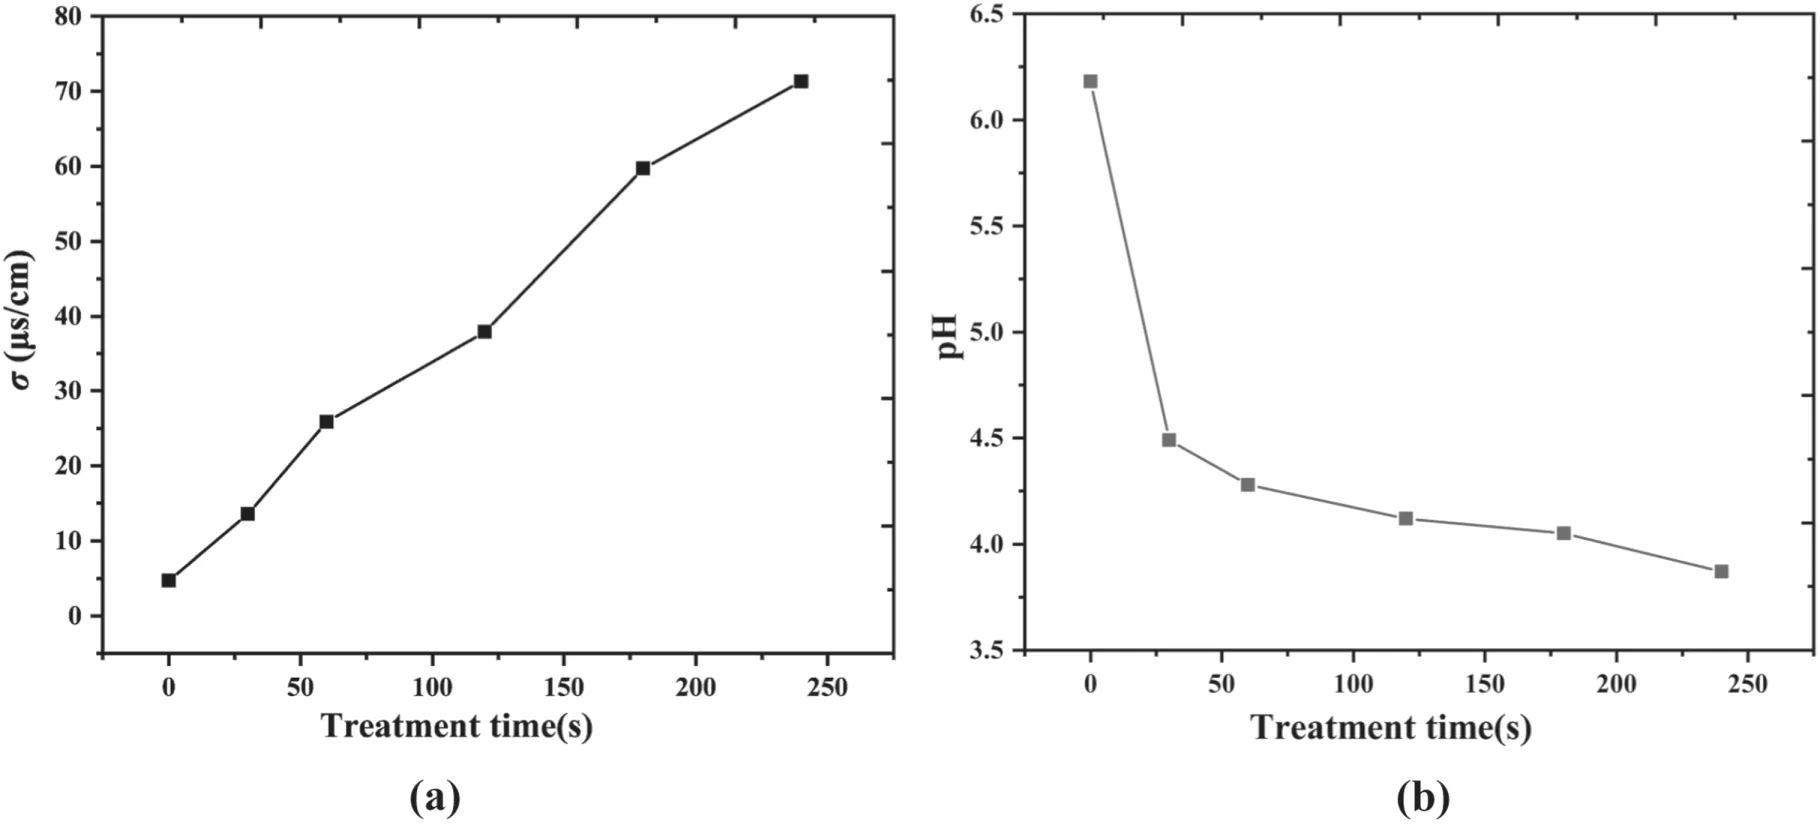
Figure 12.(a) Conductivity and (b) pH of 100 μg l?1 AVM at different treatment times.
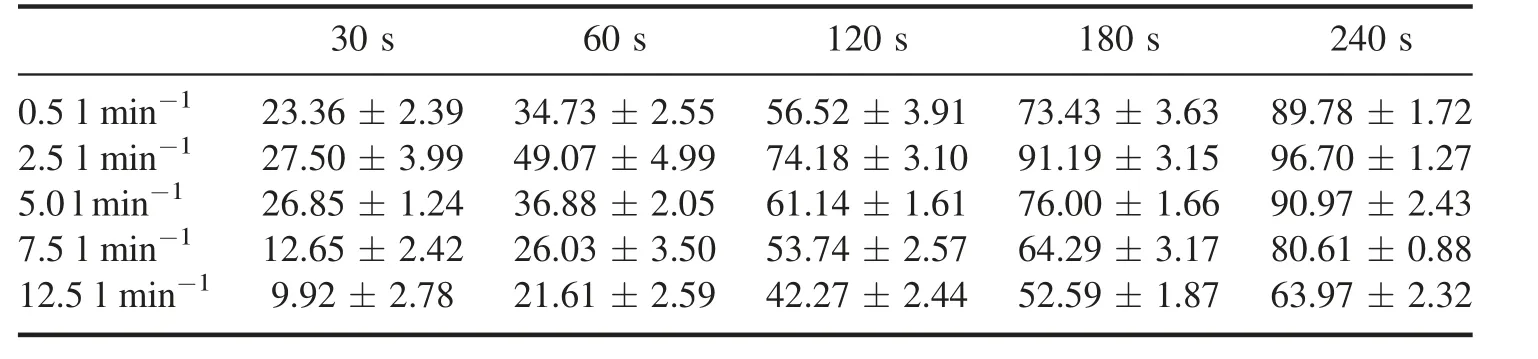
Table 2.Degradation rate (%) of AVM at different gas flow rates with the applied voltage of 18 kV and driving frequency of 9 kHz.
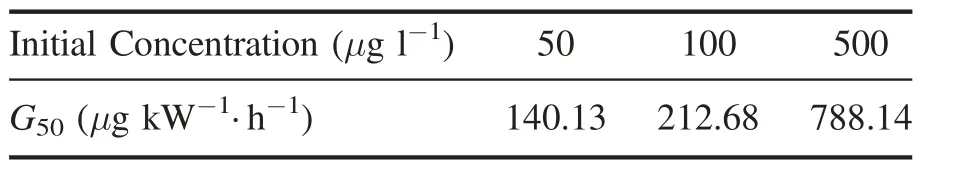
Table 3.Energy yield G50 of degradation of AVM with different initial concentrations.
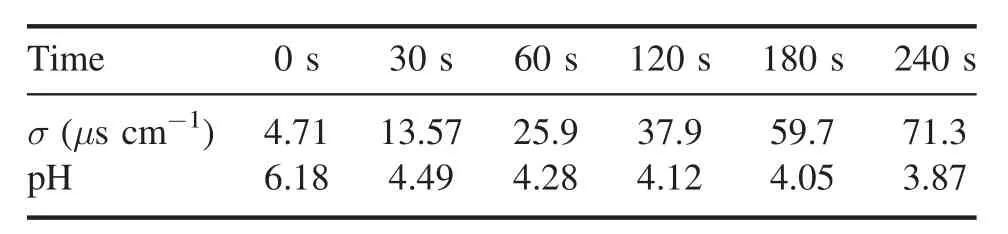
Table 4.Conductivity and pH of 100 μg l?1 AVM with different treatment times.
3.5.Conductivity and pH analysis
Figure 12 shows the values of σ and pH of 100 μg l?1AVM solution after the NTAP treatment.The treatment time ranges from 30–240 s when the discharge voltage is kept at 18 kV,with a driving frequency of 9 kHz and gas flow rate of 1 l min?1.It is observed that the value of σ increases and the corresponding pH decreases with the increase in the treatment time.Based on table 4, the value of the σ of AVM increases from 4.71 to 71.3 μs cm?1and the pH decreases from 6.18 to 3.87 with the treatment time at 240 s.Since the discharge gas is Ar in this reactor,the pH variation can be accounted for by H+, the existence of which is speculated due to the consumption of OH·radicals by AVM.The reaction process is shown in equations (10) and (11) [40].Moreover, some ions generated in the AVM degradation process may contribute to the increase in conductivity.

3.6.Possible reaction pathways between O and AVM
The experimental results indicate that NTAP could degrade AVM in solution, but the interaction mechanism between them is still under investigation.MD simulation in the field of plasma biomedicine has been widely accepted as an effective tool to discuss the interactions of ROS in plasmas and biological tissue [41, 42].According to the emission spectrum,plenty of OH·and O can be produced in the NTAP reactor.O(ground state atomic oxygen), with a stronger oxidation performance ratio than OH·, is selected as the representative ROS in NTAP to study the reaction pathways between AVM.The AVM used in the experiment is a mixture of avermectin B1a and B1b,and the content of B1a was not less than 90%,which was selected to represent AVM in the simulation.Figure 13 shows an avermectin B1a molecular structure,including double bonds, two oleanosyls linked by C13 to a16-membered ring macrolide (as shown in the blue circle in figure 13).
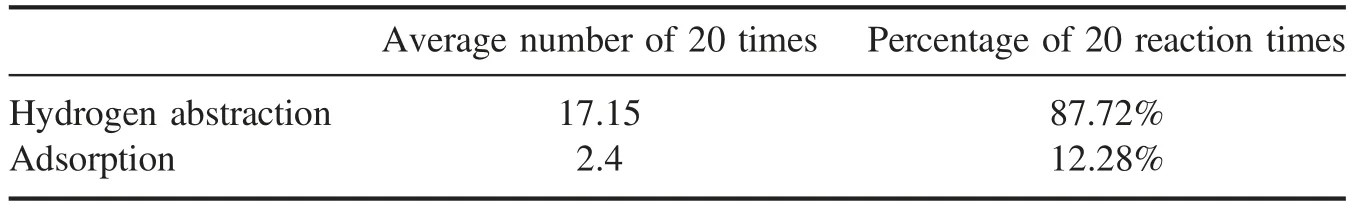
Table 5.Hydrogen abstraction and adsorption reactions between O and AVM.
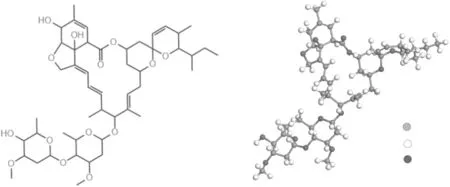
Figure 13.Simplified unit structure of AVM.(a) Chemical structure and (b) simulation model.
The MD simulations in this paper are based on the ReaxFF reactive force field using the avermectin B1a parameters.The avermectin B1a is placed in a box with dimensions of 17.8 ? × 17.8 ? × 30 ?.The structure is equilibrated at room temperature (300 K).Due to the synergistic effect of multiple ROS in the actual system, the concentration of O was appropriately increased in the simulation.At the beginning of each operation,18 O atoms are randomly positioned in the simulation box.The simulation was based on the canonical ensemble (NVT), which has a constant number of atoms under a constant volume and temperature system [43].The MD time step is set to 0.1 fs.Each computational example is operated for 300 ps.The simulations were performed 20 times to obtain statistical results for bondbreaking processes.Figure 14 explains the process of two main reactions between O and AVM, in which the small red ball is O.In a simulation reaction,most O particles participate in the hydrogen abstraction reactions, as shown in figure 14(a), which causes the C=O to form, while a small number of O particles adsorb on C atoms, as shown in figure 14(b).The average number of hydrogen capture reactions and the average number of adsorption reactions are defined as the total occurrence times in the simulation results divided by the simulation times.From table 5, the average hydrogen abstraction reactions account for 87.72% of total reactions, which is the main reaction of O and AVM.After the hydrogen abstraction reactions, the AVM structure is unstable, inducing a series of subsequent breakage of C–O and C–C and the formation of C=O and C=C.These transformations will destroy the stability of the original structure.

Figure 14.Reaction mechanism of O and AVM.(a)O abstracts an H atom from AVM and (b) the O adsorbs on a C atom.
There are three main degradation pathways according to the simulation results, as shown in figure 15, accounting for 70%,65%and 35%of the total number of structure cleavages by O, respectively (table 6).Figure 16(a) shows the first pathway where the O removes H atoms from–OH attached to C4″ and –CH3 attached to C5″ respectively, while the original single bonds C4″–O as well as C5″–C change to C4″=O and C5″=C.Figure 16(b)shows the second pathway where O removes H atom from C19, leading to the fracturing of the ester group and formation of C19=C20.The third pathway,as shown in figure 16(c), is where O removes H atom from C5′,which results in the breaking of C4′–O and formation of C4′ = C5′, leading to the glycosyl group at C4′ breaking off from the AVM molecule.
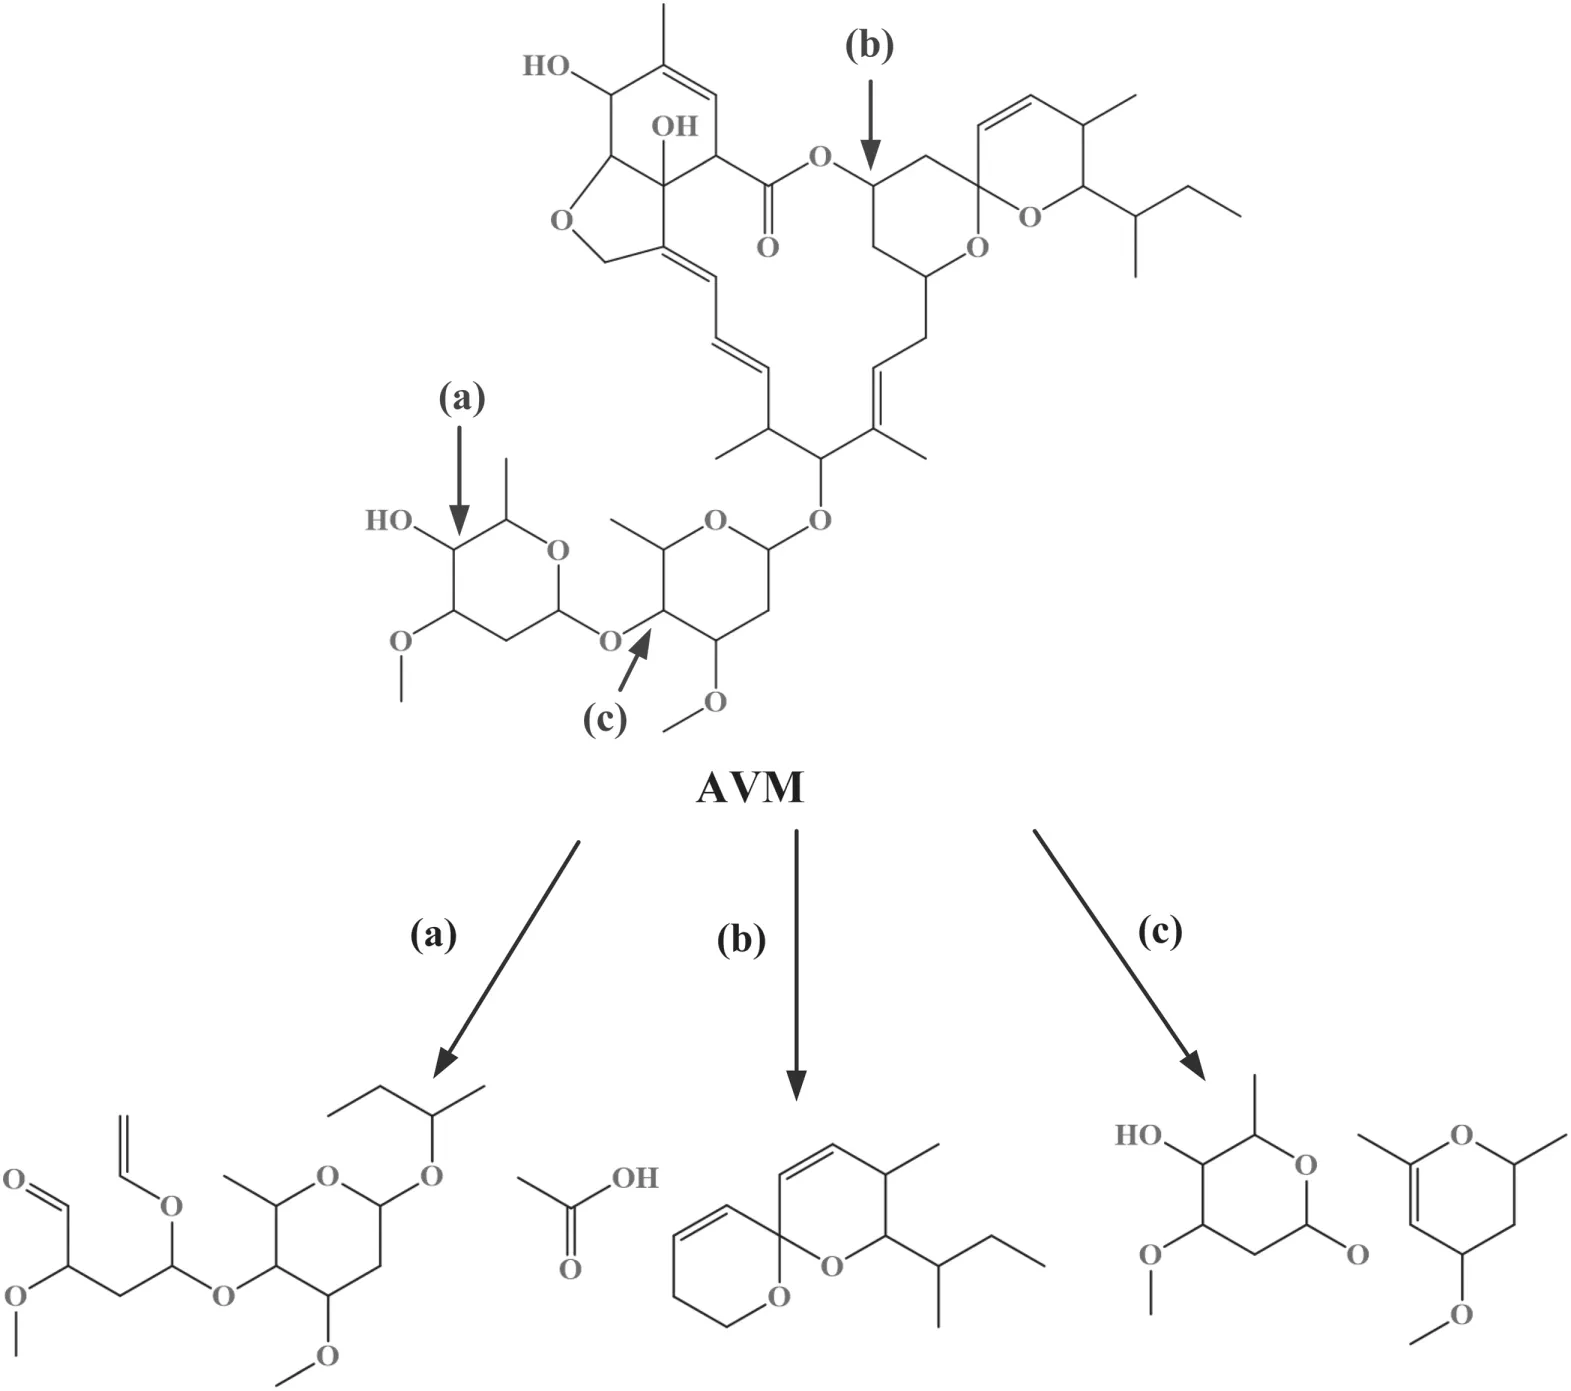
Figure 15.Three degradation pathways of AVM by O.(a)Destruction of the glycosyl group at C4″,(b)fracturing of the ester group at C19 and (c) breaking of the glycosyl group at C4′.
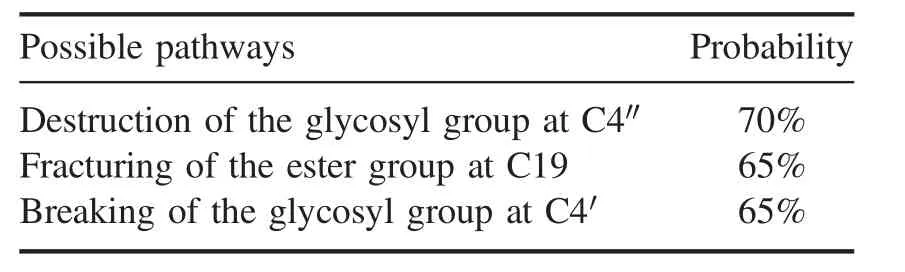
Table 6.Three possible pathways of AVM caused by NTAP.
Comparing the different emission optical spectra of 18 and 20 kV, it was found that the intensity of the O emission spectrum rises with the increase in applied voltage.According to the experiment results, the degradation rate of AVM is enhanced with the increase in applied voltage.In this case,the possibility of the first and second degradation pathway,namely NTAP-induced destruction of the glycosyl group at C4″ and ester group at C19, may dominate the interaction of NTAP and AVM.It is worth noting that the above simulation results show the possible degradation pathways of AVM after NTAP treatment, but whether the metabolites will generate new biotoxicity needs further experimental study.
4.Conclusion
A non-thermal atmospheric plasma composed of many discharge filaments was produced by DBD at atmospheric pressure and was confirmed to be effective in the generation of ROS.The maximal degradation rate of AVM by NTAP achieved in this paper was 97.47%.
The relationship between the degradation rate of AVM and the NTAP operation parameters, including the treatment time, applied voltage and gas flow rate have been investigated.The ROS in NTAP increases with plasma treatment time and applied voltage as more power is dissipated into the discharge system, leading to the enhancement of AVM degradation.The increase in gas flow rate affects the ROS distribution in solution,leading to the AVM degradation first increasing then decreasing, which indicates that an optimum value of the gas flow rate should be carefully examined in applications.The initial concentration of AVM solutions determines the potential number of AVM molecules, which have the chance to make direct contact with ROS species.In other words,the spatial distribution of NTAP-generated ROS species over the discharge gap has a significant impact on the effective interaction between ROS and AVM molecules.Further experimental and theoretical investigation is required on the movement of ROS in the discharge space and the diffusion inside the pesticide solution.
According to the MD simulation results,the ground state atomic oxygen in NTAP could induce the destruction of the glycosyl group and fracturing of the ester group, which provides the underpinning mechanisms of degradation o
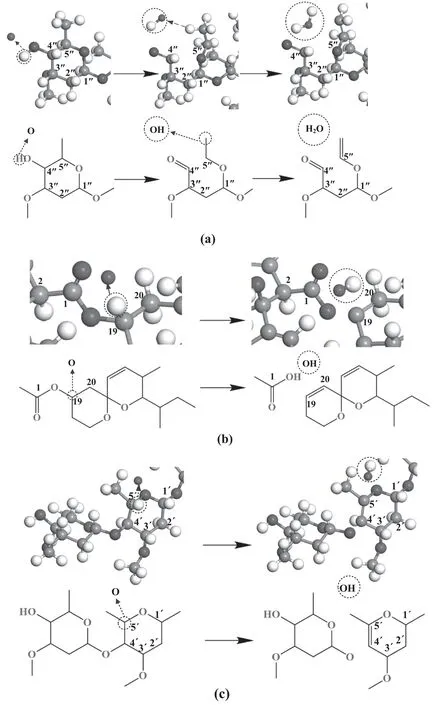
Figure 16.Specific process of AVM degradation pathways.(a)Destruction of the glycosyl group at C4″,(b)fracturing of the ester group at C19 and (c) breaking of the glycosyl group at C4′.
f AVM in theory.The efficiency of NTAP in AVM degradation was demonstrated experimentally and numerically.Further experiments should focus on the influence of the driving frequency on AVM degradation, the improvement of system energy utilization and the coordination among multiple optimal parameters of NTAP,to facilitate the future application of DBD-generated NTAP in agricultural pest degrading industries.
Acknowledgments
The authors thank National Natural Science Foundation of China (Grant Nos.11675095 and 52077128) and the Fundamental Research Funds of Shandong University(Grant No.2017JC017) for supporting the research.
ORCID iDs
 Plasma Science and Technology2021年5期
- Plasma Science and Technology的其它文章
- UV and soft x-ray emission from gaseous and solid targets employing SiC detectors
- The acceleration mechanism of shock wave induced by millisecond-nanosecond combined-pulse laser on silicon
- Laser-induced breakdown spectroscopy for the classification of wood materials using machine learning methods combined with feature selection
- Colorimetric quantification of aqueous hydrogen peroxide in the DC plasma-liquid system
- Plasma-assisted Co/Zr-metal organic framework catalysis of CO2 hydrogenation:influence of Co precursors
- Quantitative analysis of uranium in electrorecovery salt of pyroprocessing using laserinduced breakdown spectroscopy