
Quantitative analysis of uranium in electrorecovery salt of pyroprocessing using laserinduced breakdown spectroscopy
2021-05-22 07:01:20SeulKiHANSeHwanPARKandSeongKyuAHN
Plasma Science and Technology 2021年5期
Seul-Ki HAN, Se-Hwan PARK and Seong-Kyu AHN
Korea Atomic Energy Research Institute, Yuseong-gu, Daejeon 34057, Republic of Korea
Abstract The amounts of nuclear materials in the LiCl-KCl salt in pyroprocessing have to be analyzed to prevent the diversion of the nuclear material.An alternative method to the chemical analysis has been pursued,and laser-induced breakdown spectroscopy(LIBS)is one candidate.In the present work,an in situ and quantitative analysis method of electro-recovery(ER)salt was proposed and demonstrated by using LIBS combined with dipstick sampling.Two types of simulated salt samples were prepared:ER salt sample and salt obtained from the dipstick sampling,and pulsed neodymium-doped yttrium aluminum garnet(Nd:YAG)laser with a wavelength of 532 nm was focused on the salt to generate plasma.The plasma emission was measured by using an Echelle spectrometer with a resolution of 0.01 nm in conjunction with an Intensified Charge-Coupled Detector camera.The U and other rare earth peaks in the spectra were identified.The best Limit of Detection and Root Mean Square Error of Calibration of U were 38 ppm and 0.0203 wt%,respectively.Our work shows that the U in the pyroprocessing ER salt can be monitored with LIBS.
Keywords: LIBS, uranium, LOD, RMSEC
1.Introduction
Electrolytic reduction and electro-recovery (ER)are the main process of pyroprocessing, which is applied to recycle spent nuclear fuel.In the electrolytic reduction, oxide spent fuel is reduced to the metal form using lithium chloride (LiCl) salt.The uranium (U) is selectively recovered from the metallic spent fuel using lithium chloride-potasium chloride(LiCl-KCl) salt at 500°C, after which the remaining uranium/transuranic elements (U/TRU) in the LiCl-KCl salt is recovered in the ER.Nuclear materials such as U and plutonium (Pu) in the ER salt have to be monitored during the ER process in order to detect nuclear material diversion[1–4].However,the monitoring of ER salt during this process is not easy due to the high temperature of LiCl-KCl salt and highradiation conditions [5].In general, salt is sampled, and the samples are transferred to a laboratory for analysis such as by Inductively Coupled Plasma Mass Spectrometry (ICP).Although accurate analysis results can be obtained using this method,it requires sample taking,sample transfer,and careful sample treatment.Therefore, it takes significant time from sample taking to obtaining the analysis results [6].An alternative analysis method for thein situanalysis of ER salt is required for timely monitoring of ER salt, and one candidate is laser-induced breakdown spectroscopy (LIBS), by which a laser beam is incident on the sample, plasma is generated on the sample surface, and the plasma emission is measured for quantitative and qualitative analysis.In LIBS, most elements from hydrogen to uranium can be analyzed, sample pretreatment is not required, the analysis time is very short, and eitherin situor remote analysis is possible [7–11].
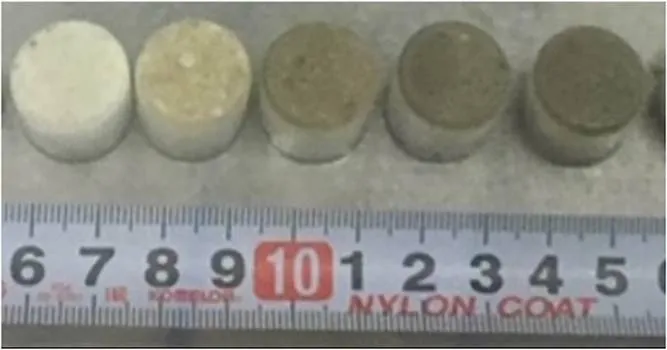
Figure 1.Salt samples in the present work.
Previously, researchers have explored the feasibility of LIBS for the analysis of nuclear material in pyroprocessing salt.Weisberget almeasured concentrations of europium(Eu) and praseodymium (Pr) in LiCl-KCl salt [12].Williamset almeasured the U concentration in aerosol LiCl-KCl-UCl3salt [13].The ER salt obtained after the process of the spent fuel contains various elements such as rare earth(RE)as well as nuclear materials.The above works on the LIBS were performed only on the salt with a simple composition.Also,there was not enough measurement of U in the salt using LIBS.Recently,Hanet alreported LIBS analysis results of U in simulated ER salt sample.The ER salt sample contained RE and U to simulate the ER salt, and the U concentrations range from 1.5 wt% to 6.8 wt% [14].Various U peaks were identified, and calibration curves normalized with potassium(K) 399.180 nm peak intensity were plotted for five highintensity U lines.The values of Root Mean Square Error of Calibration (RMSEC) and Limit of Detection (LOD) were 0.1031 wt% and 0.0942 wt%, respectively.However, measurement error and LOD were not optimized.Also,thein situanalysis method of ER salt was not included in Han’s work[14] since this work was performed only on the ER salt samples.
In the present work, to confirm the possibility of the quantitative analysis of U concentration in ER salt using LIBS in a more realistic environment, the measurement error and LOD of LIBS for U analysis were optimized, and anin situanalysis method of ER salt with the LIBS, which was LIBS combined with dipstick sampling,was proposed and assessed for the first time.
2.Experiment
2.1.Salt sample fabrication
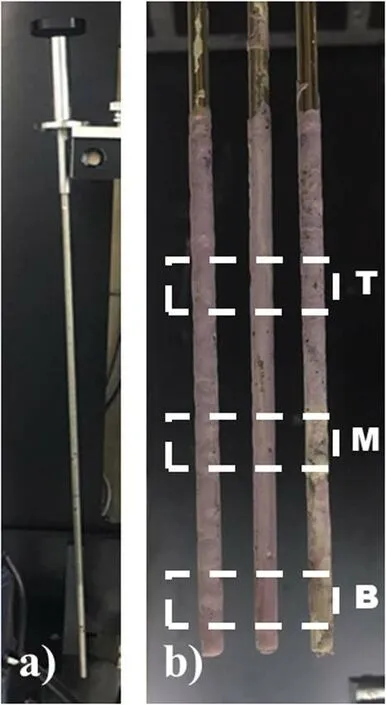
Figure 2.(a) Dipstick, (b) salt on dipstick.
ER salt samples were fabricated to simulate ER salt, which was generated while processing spent nuclear fuel using pyroprocessing.The samples contained the following elements: LiCl-KCl eutectic salt (Alfa, 99.95%), lanthanium trichloride (LaCl3) Junsei Chemical Co., Ltd, 95%, cerium trichloride (CeCl3) (Junsei Chemical Co., Ltd, 98%), barium chloride (BaCl2) (Aldrich, 99.9%), praseodymium trichloride(PrCl3)(Alfa,99.99%),neodymium trichloride(NdCl3)(Alfa,99.9%), yttrium trichloride (YCl3)(Alfa, 99.9%), samarium trichloride (SmCl3) (Alfa, 99.9%), and uranium trichloride(UCl3).The salts except UCl3were homogenized by grinding and mixing using a mortar and a pestle,the salts were divided into 5 groups, and the amount of UCl3added to each group was varied to make ER salt samples with different U concentrations.The UCl3was produced at Korea Atomic Energy Research Institute.U concentrations in the salt samples were 0.27 wt%, 0.57 wt%, 1.00 wt%, 1.70 wt%, and 3.70 wt%,which were obtained by Inductively Coupled Plasma Optical Emission Spectroscopy (ICP-OES).The concentrations of all the composition elements except Cl were also analyzed for only a sample(sample with U concentration of 3.70 wt%)with ICPOES, and the concentrations of the REs from the ICP-OES were 2.0 wt%–3.3 wt% (Y: 3.1 wt%, Sm: 3.0 wt%, Ba:2.8 wt%, Ce: 2.0 wt%, La: 2.0 wt%, Nd: 3.3 wt%, and Pr: 2.8 wt%), which were, on average, 44% lower than the amount initially put in the sample preparation.In the preparation of sample fabrication, additional salt samples were made.The differences of concentration of REs from two additional samples, which were obtained by ICP-OES, were less than 20%,and average was 10%.Iron(Fe)was included in the salt unintentionally during the fabrication of UCl3.The salts were mixed and put in a glassy carbon crucible(diameter: 24 mm, height: 39 mm).The salt samples were fabricated using a furnace placed in an Ar-filled glove box for which the oxygen and humidity were kept below 100 ppm due to the deliquescence of the salt.The temperature on the glassy carbon crucible was raised and maintained for 7 h at 650°C,and then cooled to room temperature.The salt samples used in the present work were shown in figure 1.The upper side of the samples in the figure 1 was darker,and the U concentration was higher in the upper side of the samples, which was observed from the LIBS signals.The LIBS spectra in the present work were measured only on the upper side of the sample, and only the salt on the sample surface where the laser was incident was collected for chemical analysis by scratching.In general, the color of UCl3is purple,and the darker color of the upper side of the sample is estimated due to the oxidation of U.
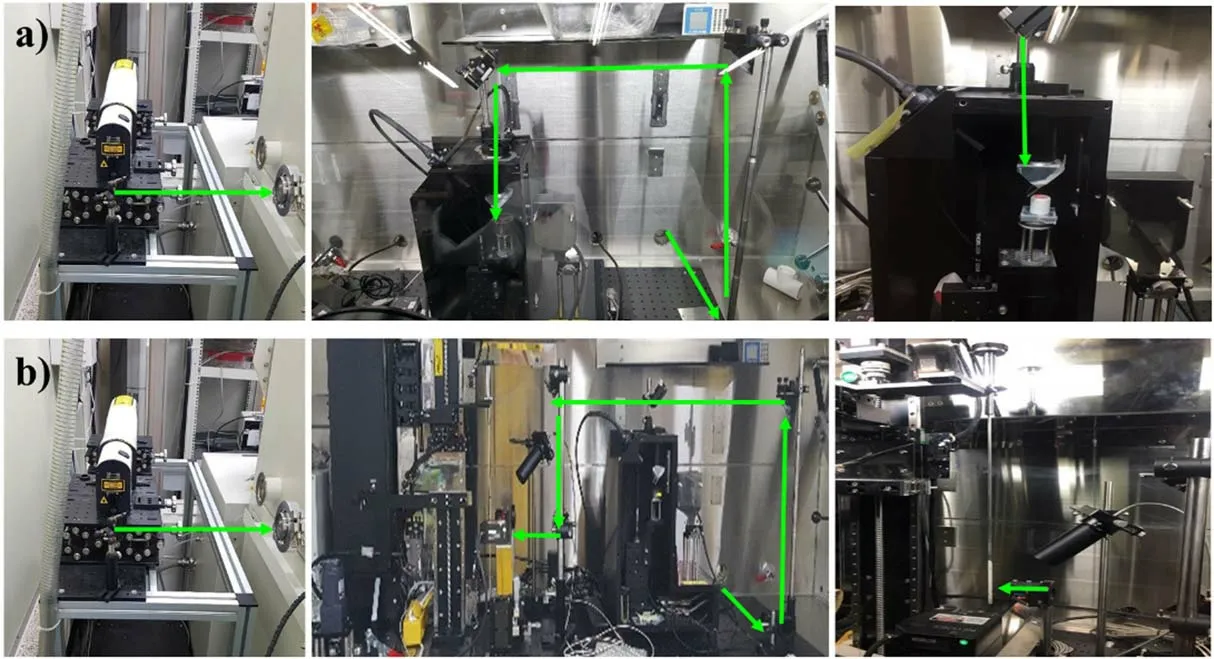
Figure 3.LIBS system (a) for ER salt sample, and (b) for salt on the dipstick.
2.2.Dipstick sampling
LiCl-KCl eutectic salt and RE salts were mixed in an alumina crucible(diameter:110 mm,height:150 mm).The salts used to fabricate the ER salt samples were also used in the dipstick sampling.The weight compositions of the mixed salt were the same as the weight compositions of the ER salt samples before adding the UCl3.UCl3Rwas added four times to increase the U concentration in the salt.After each addition of UCl3,the temperature of the salt in the crucible was increased to 650°C and the temperature was maintained.A salt sample was obtained using a dipstick sampling method.In the dipstick sampling method, cold metal, which was made of iron,was dipped in molten salt,salt was solidified and stuck to the metal stick,and the metal stick with the salt was taken out of the molten salt.Note that before sampling, the salt in the crucible was mixed to homogenize the composition.After the LIBS measurement of the salt on the metal stick, the salt,where the laser beam was incident,was sampled for chemical analysis.The U concentrations in the salt,which was obtained from the dipstick sampling and ICP-OES, were 0.22 wt%,0.45 wt%, 0.53 wt%, and 1.0 wt%, respectively.Though the U concentrations in the salts from the dipstick sampling were intended to be the same as the U concentrations in the ER salt samples, the U concentrations in the salts from the dipstick sampling were lower.It might be due to the inhomogeneity of UCl3in the solid samples and the lower U concentration in the UCl3, which was used in the dipstick sampling.The concentrations of the RE elements, which were obtained from the analysis only for five salt samples, were 0.55 wt%–2.9 wt%.
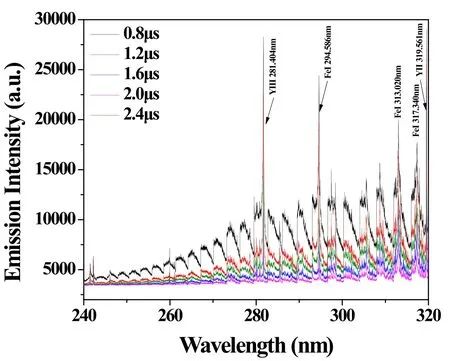
Figure 4.Change of background fluctuation depending on gate delay.The gate width was 50 μs.
The salt samples were taken three times for each U concentration.All of the above-mentioned processes such as salt preparation and the sampling and the LIBS measurement were performed in the glove box, which was used in the fabrication of salt sample.Figure 2 shows the dipstick and salts on the dipstick.
2.3.LIBS system
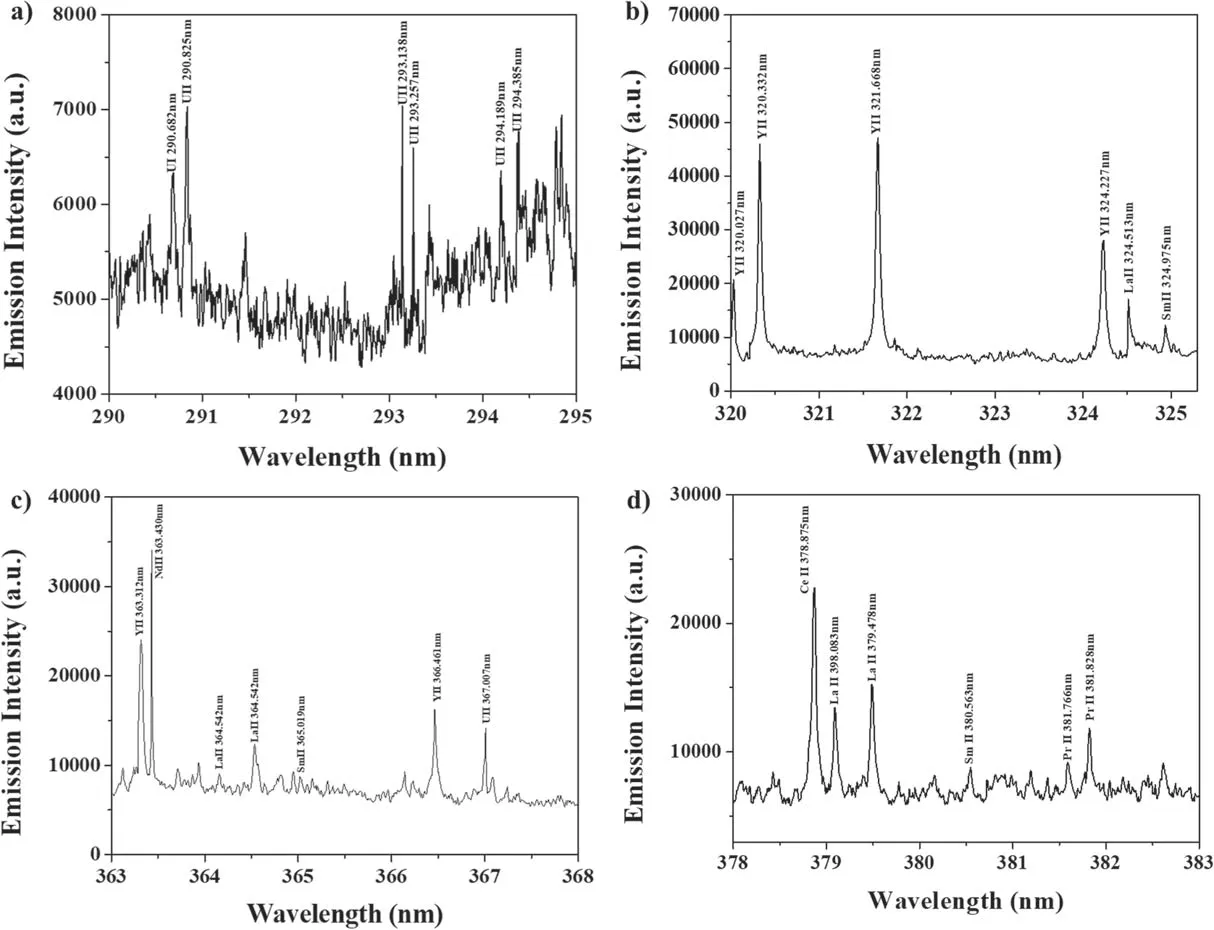
Figure 5.LIBS spectra of salt sample (U concentration of 1.0 wt%).(a) Wavelength range of 290–295 nm, (b) wavelength range of 320–325 nm, (c) wavelength range of 363–368 nm, (d) wavelength range of 378–383 nm.The spectra were obtained by averaging the emissions from 100 laser shots.
As shown in figure 3, a laser pulse with a wavelength of 532 nm from a Q-switched Nd:YAG laser(Brilliant B,Quantel)was passed through the light transfer port of the glove box, the direction of the laser pulse was changed by mirrors, it was focused by the focal lens and was incident on the sample surface to generate plasma.The frequency of the laser pulse was 10 Hz.The distance between the focal lens and the sample surface was always maintained the focal length using anXYZtranslation stage and distance measuring equipment (KEYENCE, LKG150), considering the slightly uneven sample surface.The pulse energy was ~11.5 mJ.The emission from the plasma was collected using a collimation lens and transferred through an optical cable.To obtain the spectrum, an Echelle spectrometer with a resolution of 0.01 nm combined with an Intensified Charge-Coupled Detector (ICCD) was employed.
For each LIBS spectrum, 100 laser pulses were incident on a point of sample surface.After obtaining a LIBS spectrum, the sample was moved horizontally at a 1 mm interval to measure at another point.100 craters were formed on the sample surface after the measurement.The diameter of the craters on the sample surface after laser ablation was~200 μm.Dust buildup on the sample surface or optics was not observed in our measurement.
Three regions of the dipstick(at the Top(T),Middle(M),and Bottom(B))were measured,as shown in figure 2(b).For each measurement region of the dipstick, 3 points were measured with the LIBS.For each LIBS spectrum, 30 laser pulses were incident on a point of sample surface.The measurement conditions of salt on the dipstick such as laser pulse energy, gate delay, gate width were the same as the measurement conditions of the ER salt samples.
3.Results and discussion
3.1.ER salt sample
The gate width of the ICCD was 50 μs,which was used in the previous work [14].The wavelength range of the spectrum 200–410 nm.The gate delay was varied from 0.8 to 2.4 μs,and the LIBS spectrum of the sample with U concentration of 3.7 wt% was measured as shown in figure 4.In figure 4, the background fluctuation was minimized when the gate delay was 2.0 μs,though the background increase at the gate width of 2.4 μs might be due to the measurement condition change.The gate delay of the spectrometer was determined to be 2 μs to minimize the background fluctuation.
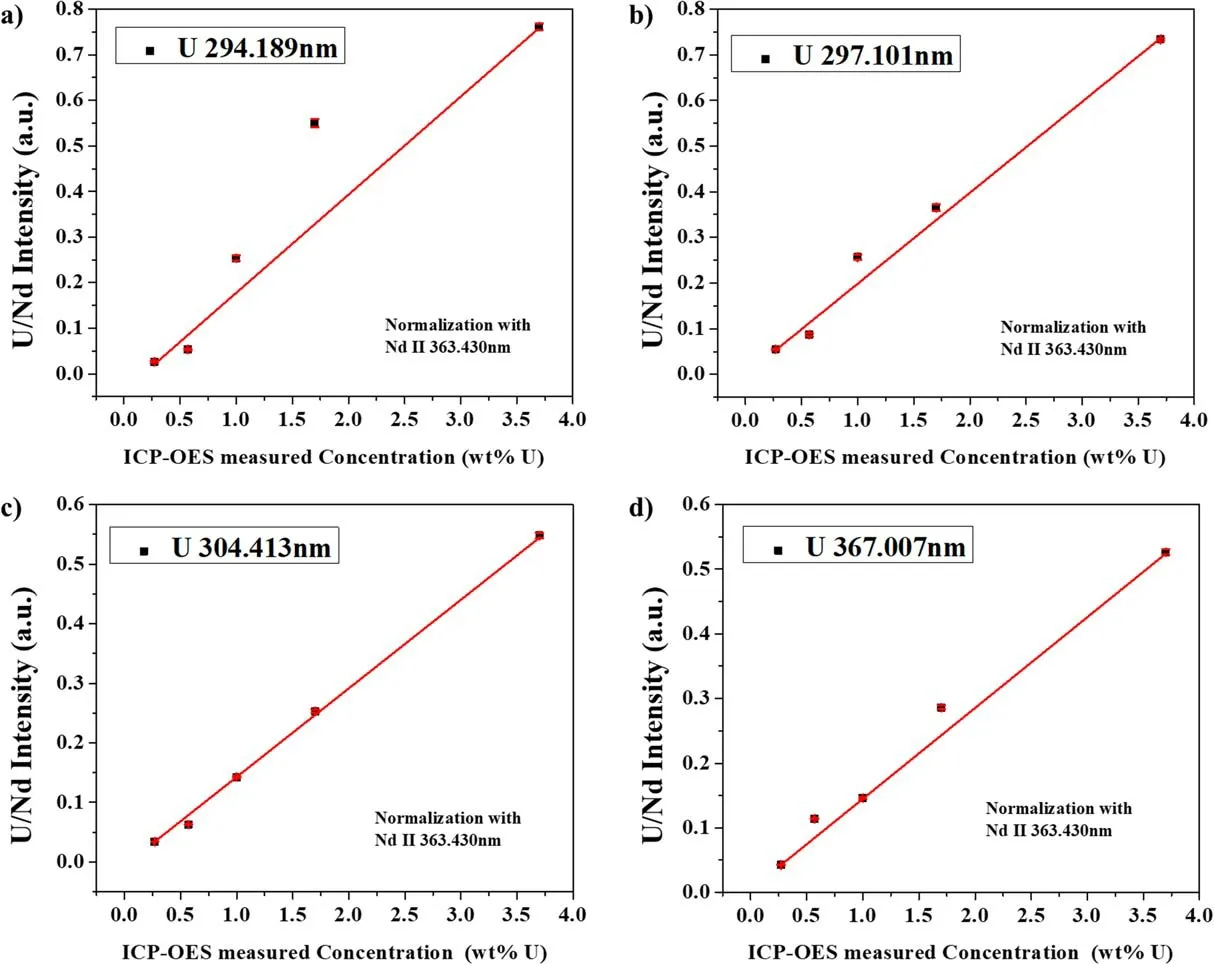
Figure 6.Calibration curves for U: (a) 294.189 nm line, (b) 297.101 nm line, (c) 304.413 nm line, (d) 367.007 nm line.
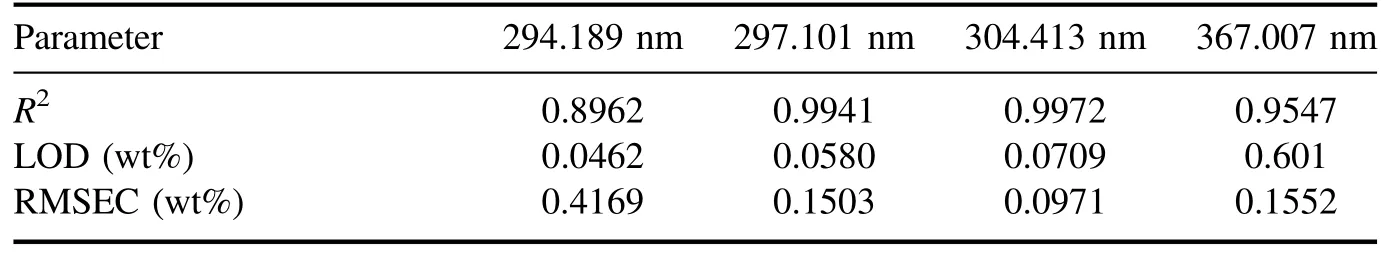
Table 1.Regression coefficients and figures of merit of U calibration curves.
The peaks in the spectrum were identified using the NIST atomic spectra database [15] and the Kurucz database [16].Figure 5(a) shows a spectrum in the wavelength range of 210–410 nm, and figure 5(b) shows a spectrum in the wavelength range of 290–295 nm, wherein 6 U lines were identified.The spectra were obtained by averaging the data from 100 laser shots.The shot-to-shot variation of the laser pulse in the measurement was<10%.Figure 6 shows the calibration curves for the four highest peaks: U II 294.189 nm, U II 297.101 nm, U II 304.413 nm, and U II 367.007 nm,which were obtained by univariate analysis.TheX-axis is the U concentration obtained from ICP-OES,and theY-axis is the net intensity of the U lines divided by the net intensity of the Neodymium (Nd) line: Nd II 363.430 nm.Here,the net intensity means the peak intensity subtracted by the background intensity.The net intensity of the Nd line was chosen as normalization from the following considerations[17]: (1) the same amount of NdCl3was added to all of the ER salt samples, (2) the Nd line did not interfere with other peaks, and (3) the intensity of the Nd line was not saturated.
A point in the calibration curve is the average of 100 measurements,and the error bar is the standard deviation.The net intensities of the U lines mostly increased with the U concentration, and the U 304.413 nm line shows the highest linearity:R2of 0.9972.
The regression coefficient (R2), measurement error, and LOD values from the U lines are summarized in table 1.The measurement error from the calibration curve was calculated using the RMSEC, which is shown in the formula
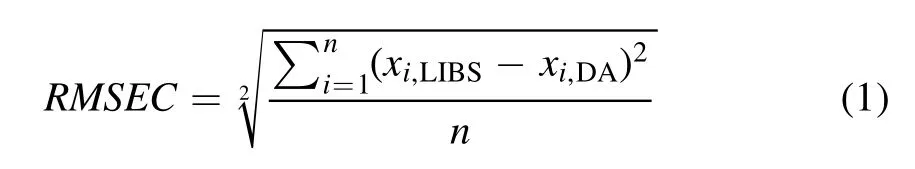
wherexi,LIBSis the uranium concentration estimated from the calibration curve based on the LIBS measurement,xi,DAis the uranium concentration from the ICP-OES, andnis the number of samples.The lowest RMSEC was 0.0972 wt%for 304.413 nm,and the average RMSEC from the 4 U lines was 0.2049 wt%.The LOD was calculated using the formula
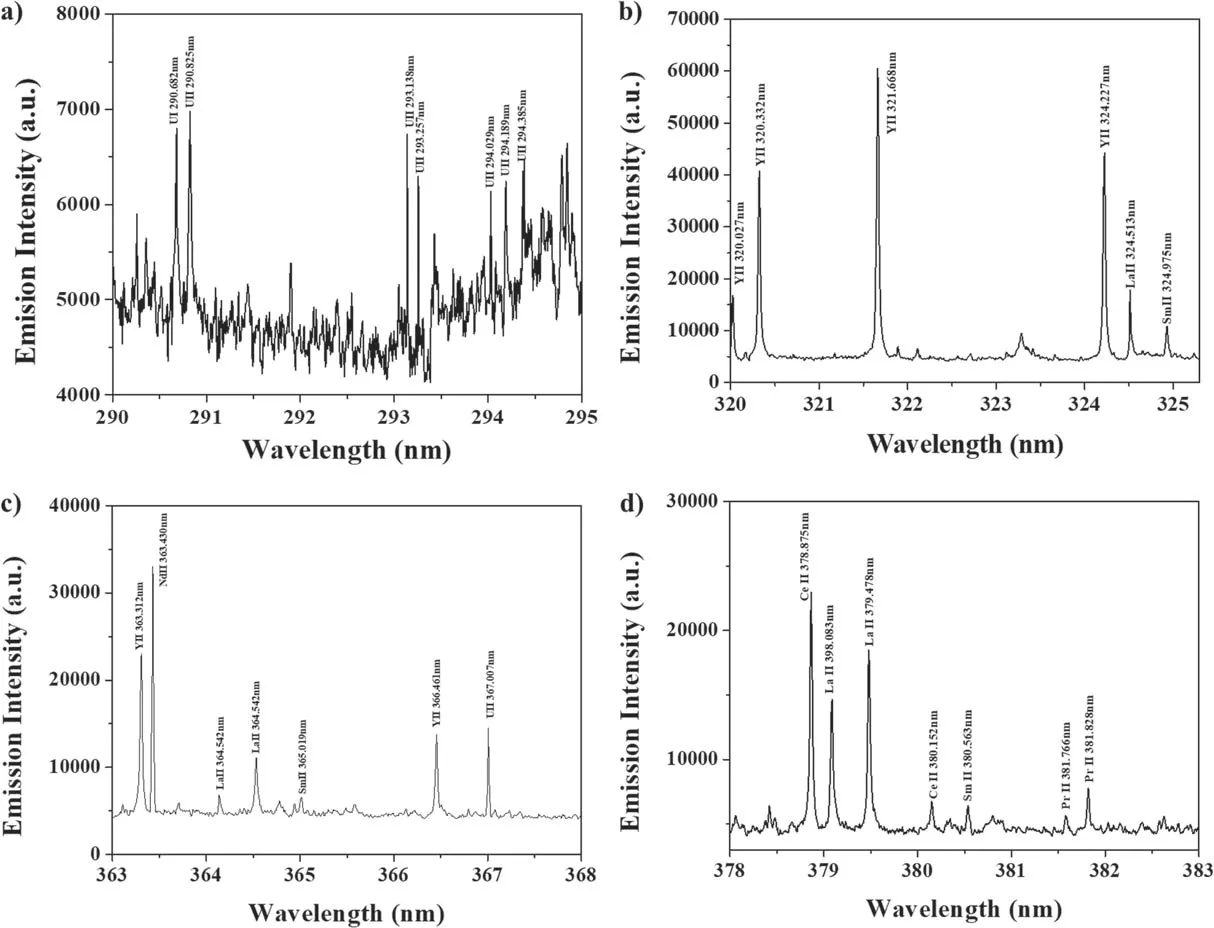
Figure 7.U spectra of salt sampled using dipstick(U concentration of 1.0 wt%):(a)wavelength range of 290–295 nm,(b)wavelength range of 320–325 nm, (c) wavelength range of 363–368 nm, and (d) wavelength range of 378–383 nm.
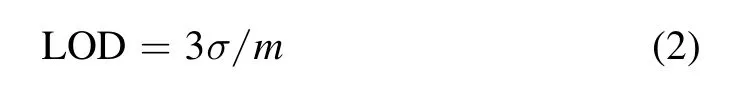
wheremis the slope of the calibration curve, and σ is the standard deviation of the background fluctuation near the U peak of the LIBS spectrum of the sample without U.The lowest LOD was 0.0462 wt% for U 294.189 nm, and the highest LOD was 0.0709 wt% for U 304.413 nm.
3.2.Salt on dipstick
The salt on the dipstick was measured using LIBS,where the salt was not pre-treated for the LIBS measurement.Figure 7(a)shows the LIBS spectrum in the wavelength range of 200–410 nm, and figure 7(b) shows the LIBS spectrum in the wavelength range of 290–295 nm.Six U lines were identified in the LIBS spectrum of the ER salt sample, while 7 U lines were identified in the LIBS spectrum of the salt on the dipstick.
The LIBS spectrum of the ER salt sample was compared with the LIBS spectrum of salt on the dipstick in figure 8.Though the measurements were performed in similar conditions, the background of the LIBS spectrum of salt on the dipstick was lower than the background of the LIBS spectrum of the ER salt sample.
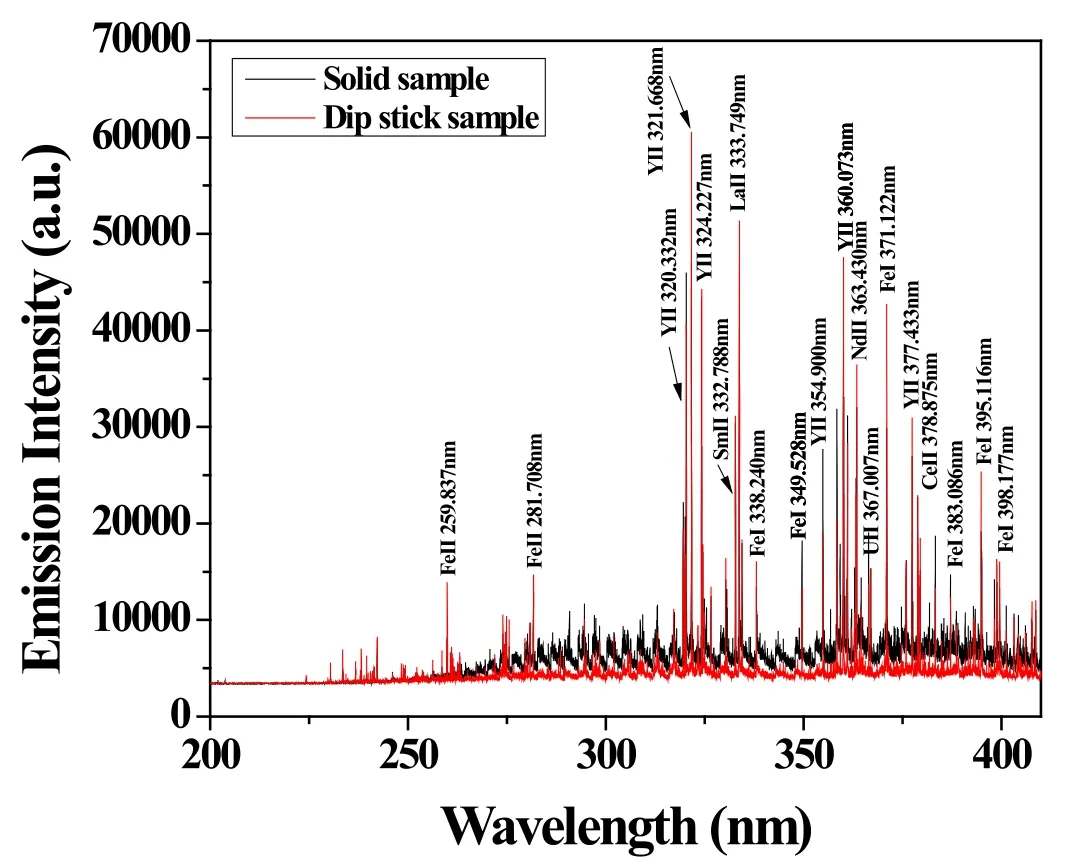
Figure 8.Comparison of the LIBS spectra of ER salt sample and of salt on dipstick.Both of the spectra were obtained when U concentration was 1.0 wt%.
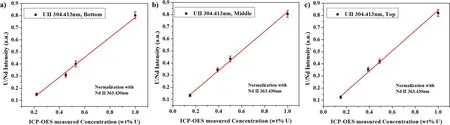
Figure 9.Calibration curves of salts at (a) bottom, (b) middle, and (c) top.
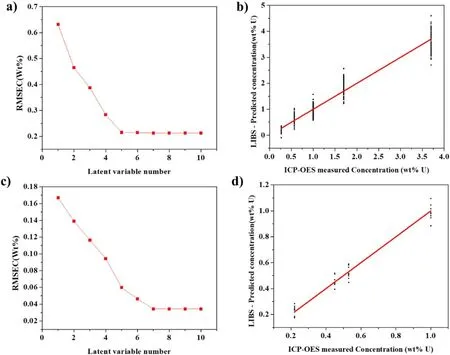
Figure 10.Multivariate analysis results: (a) RMSEC of ER salt sample for latent variable number, (b) PLS calibration curve of ER salt sample, (c) RMSEC of salt on dipstick for latent variable, (d) PLS calibration curve of salt on dipstick.
Figure 9 shows the calibration curves of the U 304.413 nm line, which showed the lowest error, at the three positions (Bottom, Middle, Top) on the stick.TheX-axis is the U concentration obtained from ICP-OES, andY-axis is the net intensity of the U lines divided by the net intensity of the neodymium (Nd) line.The data point is the average of the three measured intensity ratios, and the error bar is the standard deviation of the three measured intensity ratios.The U line intensity increased linearly as the U concentration in the salt increased, and the highestR2was 0.9963, as obtained in the middle of the dipstick.Table 2 summarizes theR, measurement error, and LOD values.The lowest RMSEC was 0.0203 wt%, from the top of the stick,and the average RMSEC was 0.0305 wt%.The lowest LOD was 38 ppm,which was obtained from the top and bottom of the stick.The RMSEC and LOD from the salt on the dipstick were smaller than those obtained from the ER salt sample.
Calibration curves also were obtained by Partial Least Square (PLS) modeling using commercial software (Unscrambler X, CAMO) [18].The regions of the spectrum near the U peaks and Nd peaks were used for the modeling.The regions of U 294.189 nm (204.109–294.247 nm), U 297.101 nm(297.034–297.183 nm),U 304.413 nm(304.359–304.482 nm),U 367.007 nm (366.937–367.042 nm), and Nd 363.430 nm(363.397–363.512 nm) were employed for the multivariate modeling of ER salt samples.The regions of U 304.413 nm(304.359–304.482 nm) and Nd 363.430 nm(363.397–363.512 nm)were employed for the multivariate analysis of salt from the dipstick sampling.All the data from the measured spectra were included in the modeling independently.Figure 10 shows the RMSEC for various numbers of the latent variables.
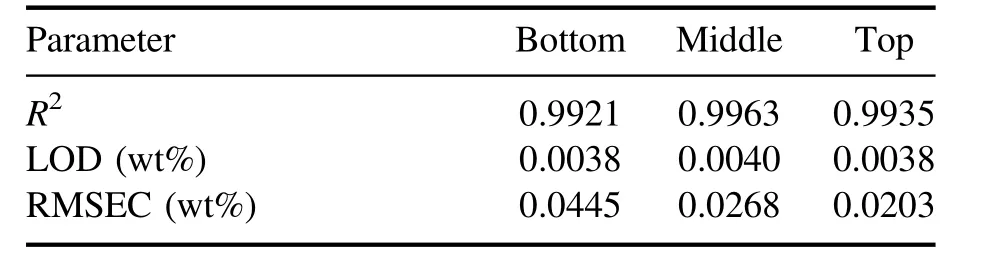
Table 2.Regression coefficients and figures of merit of U calibration curves of salt on dipstick.
For the salt sample, the RMSEC was almost constant above the number of the latent variables of 5,and for the salt on the dipstick, it was almost constant above the number of latent variables of 7.The calibration curves using PLS modeling with the parameter numbers of 5 and 7,as obtained by multivariate analysis, are shown in figure 10.For the ER salt sample, the RMSEC obtained from the PLS was 0.2153 wt%, while the average RMSEC was 0.2049; for the salt on the dipstick, RMSEC from the PLS was 0.0305 wt%, while the average RMSEC was 0.0343 wt%.
4.Conclusions
The measurement of nuclear materials such as Pu and U in the ER salt of the pyroprocessing is necessary to control the nuclear material for peaceful use.Moreover,in situmeasurement of the nuclear materials in the ER salt is effective and efficient in nuclear material control.Generally, the chemical analysis combined with the sampling and sample transfer is used for the ER salt analysis, however, it is timeconsuming and expensive.LIBS is one of the candidates for thein situmeasurement of ER salt, and we proposed and demonstrated than LIBS combined with the dipstick sampling can be one of the methods for the ER salt analysis.
In the present work, U in RE-mixed LiCl-KCl salt was analyzed by LIBS, and the following results were obtained.For the salt sample with the U concentration of 0.27 wt%–3.7 wt%, the RMSEC and LOD obtained by univariate analysis were 0.0971 wt%and 0.0462 wt%,respectively.For the salt on the dipstick with the U concentration of 0.22 wt%–1.00 wt%, the RMSEC and LOD obtained by univariate analysis were 0.0203 and 0.0038 wt%, respectively.The results from the multivariate analysis were consistent with those from the univariate analysis.
The RMSEC and LOD obtained from salts on the dipstick were better than those obtained from the ER salt samples.Especially,the LOD was significantly reduced when the LIBS spectrum was measured for the salt on the dipstick.Though the regions of the U concentration of the salts were different, the reduction of the background in the salt on the dipstick was the reason for the better LOD.The LIBS measurement condition for the dipstick was almost the same as those for the ER salt sample.The salt surface from the dipstick was smoother than the surface of the ER salt sample.There could be many reasons for the reduction of the background fluctuation, the smoother surface was one of the reasons for the reduction of the background.
Based on the results presented above,LIBS analysis of U in ER salt combined with dipstick sampling in a hot cell combined with multivariate analysis would be an effective method for safeguards monitoring in real-time.
Acknowledgments
This work was supported by a National Research Foundation of Korea (NRF) grant funded by the Korean Government’s Ministry of Science and ICT (MSIT) (No.NRF-2017M2A8A5015084).This work also was partly supported by the Nuclear Safety Research Program through the Korea Foundation of Nuclear Safety (KoFONS) using the financial resource granted by the Nuclear Safety and Security Commission (NSSC) of the Republic of Korea (No.1903014).
 Plasma Science and Technology2021年5期
- Plasma Science and Technology的其它文章
- UV and soft x-ray emission from gaseous and solid targets employing SiC detectors
- The acceleration mechanism of shock wave induced by millisecond-nanosecond combined-pulse laser on silicon
- Investigation of non-thermal atmospheric plasma for the degradation of avermectin solution
- Laser-induced breakdown spectroscopy for the classification of wood materials using machine learning methods combined with feature selection
- Colorimetric quantification of aqueous hydrogen peroxide in the DC plasma-liquid system
- Plasma-assisted Co/Zr-metal organic framework catalysis of CO2 hydrogenation:influence of Co precursors