
Forest disturbances and the attribution derived from yearly Landsat time series over 1990–2020 in the Hengduan Mountains Region of Southwest China
2021-02-28 09:13:00YatingLiZhenziWuXiaoXuHuiFanXiaojiaTongandJiangLiu
Forest Ecosystems 2021年4期
Yating Li,Zhenzi Wu,Xiao Xu,Hui Fan*,Xiaojia Tong and Jiang Liu
Abstract
Keywords: Change detection, Disturbance attribution, Landsat,LandTrendr, Hengduan Mountains region
Introduction
Forests have pivotal ecological functions and provide diverse ecosystem services, such as global climate regulation, habitat provision, water and soil conservation,biodiversitypreservation,andcarbon sequestration (Bonan 2008; Pan et al. 2011). However,forest disturbances widely affect the ecological functioning of forest ecosystems and thereby impair the provision of ecosystem services (Betts et al. 2017). As reported recently, the area of global forest loss reached 1.78×10⁶km2between 1990 and 2020 (FAO and UNEP 2020), which was mainly caused by anthropogenic factors, such as forest exploitation and land-use conversion (Barlow et al. 2016; FAO and UNEP 2020). The forest landscape has also been altered by natural environmental changes and disturbances, such as wildfires, insect infestations, flooding,and drought, over many decades (FAO and UNEP 2020).
Most forest disturbances occur at small spatial scales,and regional patterns evolve over long periods (Kim et al. 2014). Accordingly, effectively tracking small-area disturbances requires high-resolution spatial datasets that span long time scales. The free availability of the United States Geological Survey (USGS) Landsat image archives in 2008 catalysed Landsat time series analysis for fine-resolution forest cover change detection via indepth mining of dense Landsat analysis-ready image stacks (Hansen et al. 2013; White et al. 2017, Wulder et al. 2012; Wulder et al. 2019; Zhu 2017, Zhu et al.2019). Recently, numerous algorithms for Landsat time series change detection have been proposed, reviewed and widely used (Banskota et al. 2014, Cohen et al. 2010;Cohen et al. 2017; Huang et al. 2009; Kennedy et al.2010; Zhu 2017, Zhu et al. 2020). A wealth of forest cover change products from local to global scales have been generated from a medium- or high-frequency Landsat time series using these algorithms (Cohen et al.2016; Czerwinski et al. 2014; Hansen et al. 2016; Margono et al. 2012; Masek et al. 2008; Potapov et al. 2012;Schroeder et al. 2007, 2011; White et al. 2017). However,these products are either region-specific datasets with high map accuracy or global datasets with high regional uncertainty in map accuracy. Therefore, individual target-specific forest disturbance detection is still needed for a given forest landscape region. To extract annual time-scale forest disturbances, the Landsat-based detection of trends in disturbance and recovery (LandTrendr)proposed by Kennedy et al. (2010) is one of the most widely used algorithms (Zhu 2017).
The causal agents of forest disturbance have profound ecological and management implications for forest ecosystems but are difficult to identify and characterize (Attiwill 1994). Presently, only a few studies that attempted to map the agents causing forest disturbance (Hermosilla et al. 2015; Kennedy et al.2015; Pickell et al. 2014; Schroeder et al. 2017; Shimizu et al. 2017). Among these studies, disturbance agents are identified either by classifying the spectral,geometric, textural, and topographic properties concerning the detected disturbance patches (Kennedy et al. 2015; Pickell et al. 2014; Schleeweis et al. 2020;Shimizu et al. 2017) or by direct derivation from Landsat spectral-temporal metrics and prior knowledge of causal event types (Hermosilla et al. 2015;Moisen et al. 2016; Oeser et al. 2017; Schroeder et al.2017). In comparison, the former method can produce a more spatially consistent map of casual agents than the latter method (Shimizu et al. 2019).
The Hengduan Mountains Region (HDMR) is one of the world’s biodiversity hotspots and is covered by a series of forest ecosystems ranging from subtropical to cool temperate (Xing and Ree 2017). Complex geomorphic units and diverse forest systems provide unique habitats for many flora and fauna; therefore, natural forest conservation in the HDMR has significant impacts on biodiversity conservation and ecological security at the local, regional and even global scales (Liu et al. 2019). However, the HDMR operated as a major timber supply base in Southwest China until China’s Natural Forest Conservation Program (NFCP), which includes logging bans on natural forests, the creation of protected areas, and other forest policies, was tentatively initiated in 1998 (Yang 2017).With the full implementation of the NFCP in 2000 (Yang 2017),the priority of natural forest management has drastically shifted from timber exploitation to ecological function preservation in this region. Thus, whether and how the abrupt shift in forest management policy affected forest ecosystem dynamics is an urgent question to be answered. However, the long-term and fine-resolution annual dynamics of natural forests and the underlying factors in the HDMR are poorly understood, which thereby hampers the robust quantitative evaluation of the effectiveness of the NFCP and other forest policies. Therefore,investigating the characteristics of forest disturbance and the associated causal agents across this region and over long time periods is imperative to aid comprehensive evaluation of and fine-tuning decision making for the implemented forest policies.
The objective of this study is to map forest disturbances and causal agents in HDMR using the Land-Trendr change detection algorithm based on yearly Landsat time series images acquired from 1990 to 2020.Specific steps involve (1) analysing the spatiotemporal dynamics of forest disturbance, (2) attributing the causal agents of forest disturbances using a random forest (RF)model with spectral and spatiotemporal properties of the disturbed patches, and (3) quantifying the disturbed areas caused by different agents. Spatially explicit, fineresolution and annual information on long-term forest disturbances and the attributing agents can not only improve our understanding of forest dynamics and the dominant factors but also provide a basis for evaluating the impacts and effectiveness of policy shifts in forest management, which will eventually benefit sustainable forest management and regional ecological security.
Study area
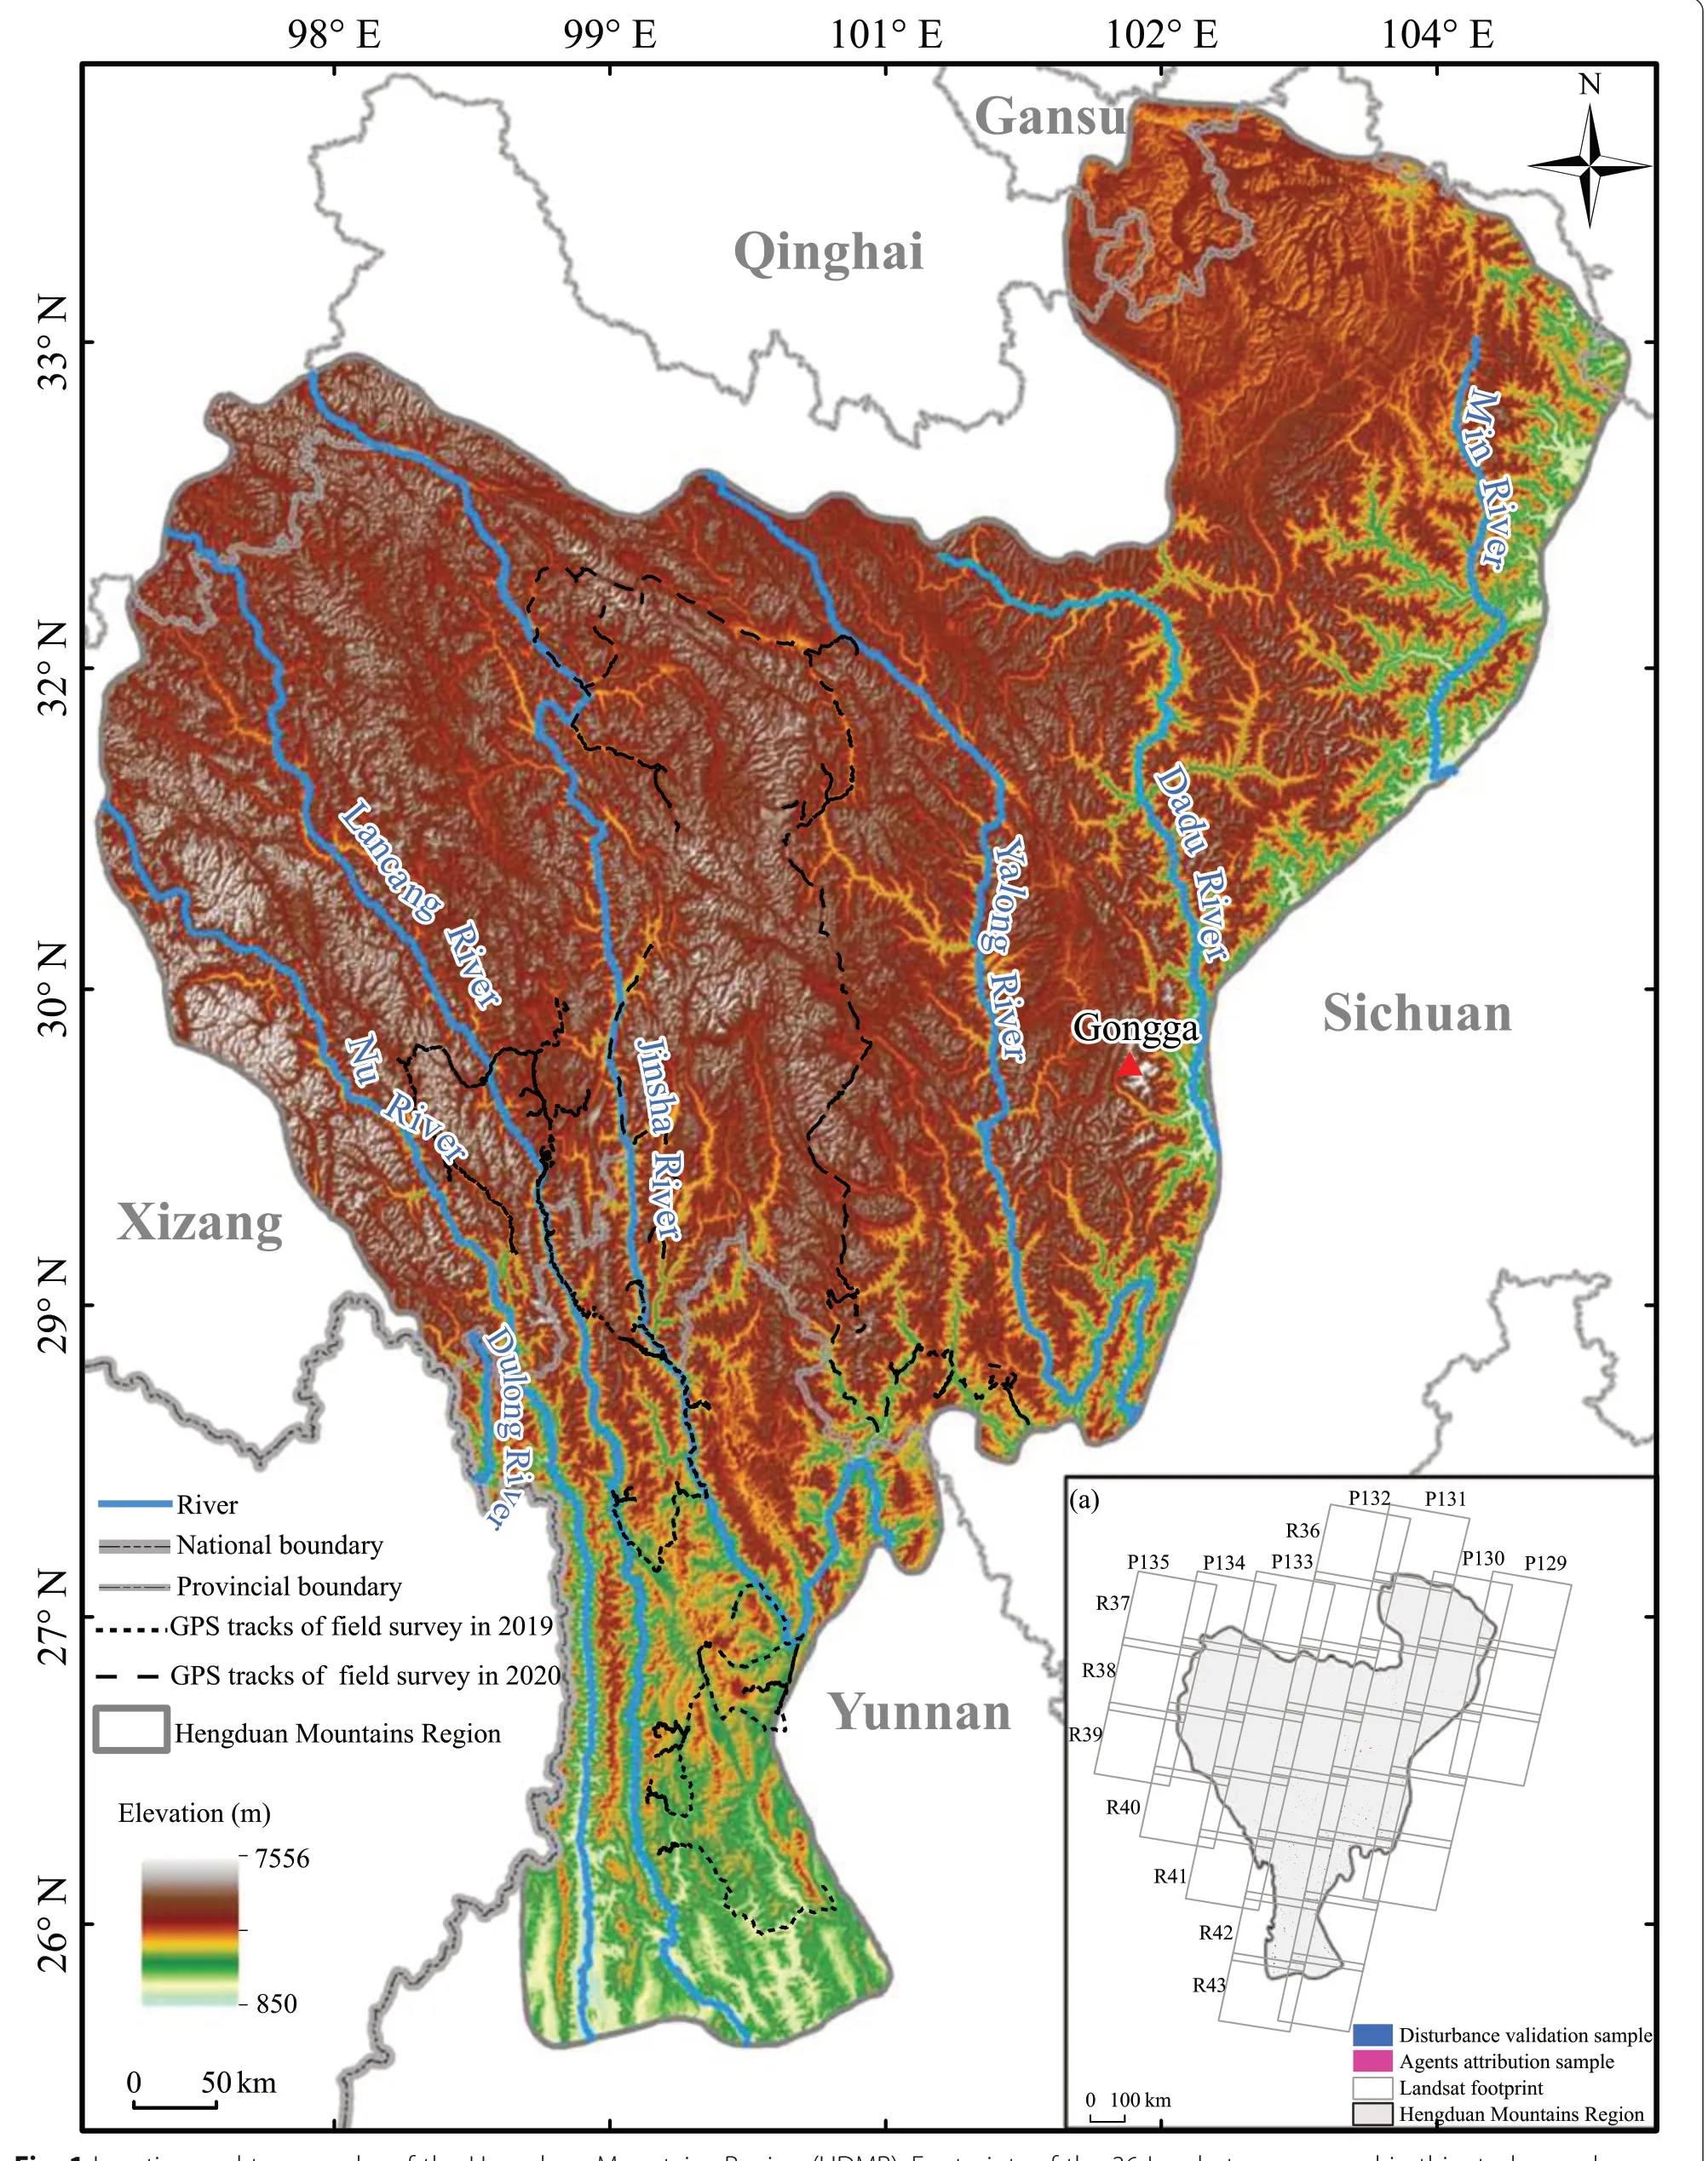
Fig.1 Location and topography of the Hengduan Mountains Region(HDMR).Footprints of the 36 Landsat scenes used in this study are also shown with each path/row in inset(a)
The HDMR (24°39′N–33°34′N, 96°58′E–104°27′E) is located in Southwest China (Li 1987), covering eastern and southeastern Tibet, western Sichuan, northwestern Yunnan, southeastern Qinghai and southwestern Gansu(Fig. 1). The HDMR is characterized by a chain of parallel north-south-oriented mountain ranges and rivers (i.e., Dulong River, Nu River, Lancang River, Jinsha River, Yalong River, Dadu River and Min River) (Li 1987; Zhang et al. 1997). This region has a sharp altitudinal uplift from the southern river valley (appr.850 m) to the summit of Gongga Mountain (7556 m),which results in unique and prominent vertical climatic and vegetation zonation. The regional climate ranges from the subtropics at the southern low elevations to the alpine frigid zone at the northern high elevations (Zhang et al. 1997).Along altitudinal and climatic gradients, vegetation types vary from succulent thorny shrubs in dry-hot valleys,montane mixed coniferous and broad-leaved forests,montane dark coniferous forests, alpine shrub meadows,and alpine sparse vegetation (Sun et al. 2017; Zhang et al. 1997).
Data and methods
The process of data analysis can be roughly divided into two stages: pixel-level forest disturbance detection based on the LandTrendr temporal segmentation of the yearly Landsat normalized burned ratio (NBR) time series and patch-level attribution of disturbance agents using the RF model of LandTrendr- and DEM-derived spectral and spatiotemporal variables for the disturbed areas(Fig. 2).
Data sources and preprocessing
Landsat images and preprocessing
The HDMR intersects with 36 Landsat path/row scenes in the Landsat Worldwide Referencing System (WRS-2)(inset (a) in Fig. 1). All available Landsat surface reflectance of these scenes for Landsat 5 Thematic Mapper(TM), Landsat 7 Enhanced Thematic Mapper Plus(ETM+), and Landsat 8 Operational Land Imager (OLI)images from 1990 to 2020 were selected and extracted from the Google Earth Engine (GEE) (https://earthengine.google.com/) cloud computing platform. To minimize the impact of clouds and cloud shadows,Landsat images acquired only in the non-growing seasons (October–December and January–March of the next year) were used in this study.
To make full use of all available clear observations for producing yearly cloud-free Landsat time series stacks(LTSSs), the CFmask band of Landsat surface reflectance data collections containing per-pixel quality information,which is obtained by the C version function of the mask algorithm (Zhu et al. 2015), was used to remove cloudcontaminated and snow-covered pixels. Then, yearly best-available pixel composites were created based on pixel-scoring functions of clear observations (White et al. 2014). Gap-filling of yearly Landsat composite images was conducted based on the temporally adjacent pixels(i.e., pixels in the previous and next year of a given year) of the LTSS (White et al. 2014). Considering the differences in spectral responses over the Landsat sensor series, reflectance harmonization proposed by Roy et al.(2016) was performed to improve the temporal continuity of Landsat time series.
Forest baseline map in 1990 and topographic data
An initial forest/non-forest benchmark is needed to map forest disturbance using the LandTrendr method (DeVries et al. 2015). Changes occurring within forested areas during the study period were regarded as forest disturbances. A raw forest baseline map was developed from the forest class of the 1 km-resolution China Land-Use/cover datasets (CLUDs) produced from a humancomputer interactive interpretation of Landsat TM data acquired in the late 1980s (Liu et al. 2003a, b). A maximum normalized difference vegetation index (NDVI)composite image was generated from the Landsat TM images in 1990. Then, we resampled the 1 km-resolution forest baseline map to 30-m resolution and subsequently removed the pixels with a negative NDVI value to produce the final 30-m-resolution forest baseline map.
The void-filling version of the Shuttle Radar Topographic Mission (SRTM) digital elevation model (DEM)with a resolution of 30 m provided by the Jet Propulsion Laboratory (JPL) of America’s National Aeronautics and Space Administration (NASA) was obtained from the GEE platform. Topographic variables, such as elevation,slope,and aspect, were derived from the DEM.
Verification data
Three field campaigns were conducted in August and September of 2019 and August–September of 2020 (Fig.1). Geographical references of forest disturbance events were recorded with a Nikon camera with a global positioning system (GPS). Reference samples of forest disturbance were obtained by visually interpreting high spatial resolution images from Google Earth?and Landsat data together with the field records of disturbance events; subsequently, they were used to produce disturbance agent reference samples by combining temporal trajectories of spectral indices (e.g.,NBR)generated from the LandTrendr Pixel Time Series Plotter user interface(https://emaprlab.users.earthengine.app/view/lt-geepixel-time-series) with the spectral-temporal curves of four typical forest disturbance agents (including fire, logging, road construction and insects), as illustrated in Fig. 3. A total of 1721 reference samples containing 774 for disturbance and 947 for non-disturbance were created (inset (a) in Fig. 1), with more than 10 forest disturbance samples with pixels greater than 9 for each year. The number of agent-labelled forest disturbance patch samples with pixels greater than 11 (i.e., patches with an area above 0.01 km2) was 763, including 515 patches for fire, 192 patches for logging, 40 patches for constructing roads, and 15 patches for insect outbreaks.
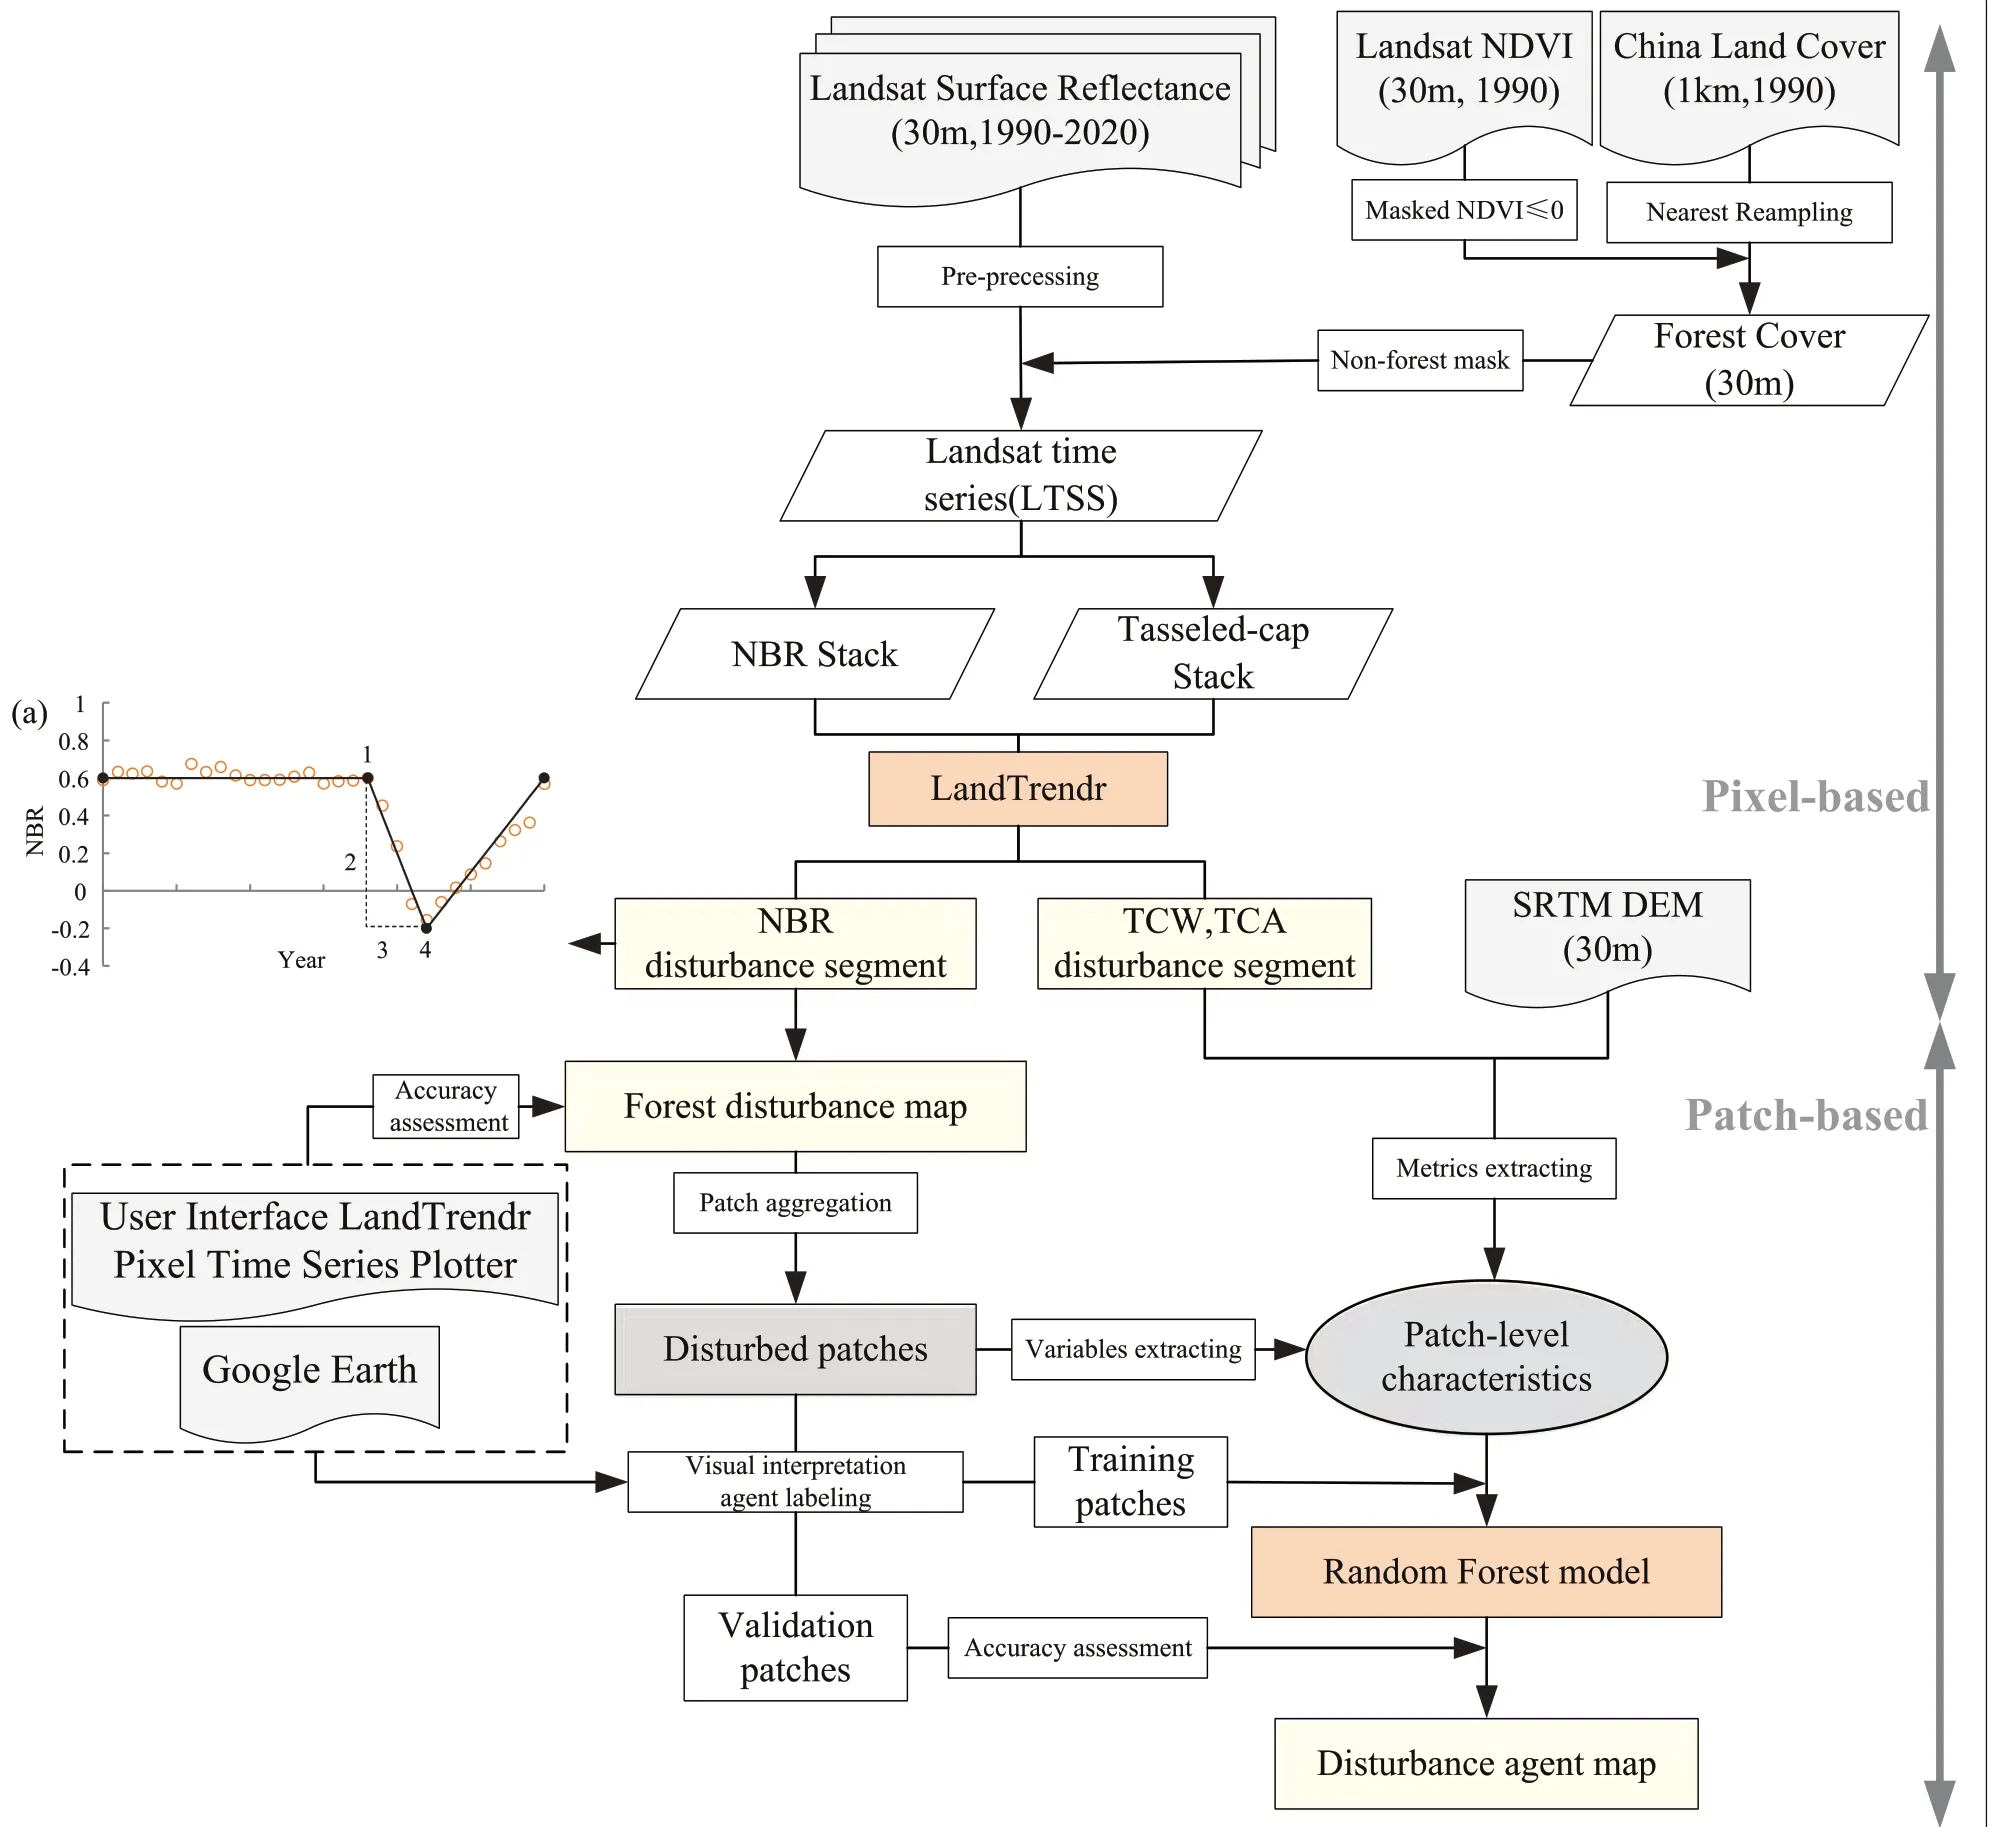
Fig.2 Flowchart of pixel-based disturbance detection and the patch-based attribution process.Inset(a) illustrates an example of LandTrendr segmentation and spectral trajectory fitted to NBR time series,in which a solid line indicates the spectral trajectory fitted to the NBR observation(solid dots)and the numbers 1,2,3 and 4 denote the start-value,magnitude,duration and end-value of the disturbance segment,respectively.The User Interface(UI)LandTrendr Pixel Time Series Plotter was provided by the Oregon State University eMapR Laboratory and Google Earth Engine website:https://emaprlab.users.earthengine.app/view/lt-gee-pixel-time-series
Methods
Pixel-based forest disturbance detection using the LandTrendr algorithm
LandTrendr, a time series segmentation algorithm used to capture both abrupt and gradual disturbances in time series (Kennedy et al. 2007), was used to identify and detect forest disturbances based on the GEE platform(Kennedy et al. 2018). LandTrendr-based time series data processing follows two main steps: first, the start and end of each segment are determined by estimating the years of change in the LTSSs of a given spectral index; second, the spectral index values at the segment breakpoints (also called vertices) are calculated, yielding a trajectory of interconnected segments that characterize the disturbance for each pixel (inset (a) in Fig. 2).

Fig.3 Typical LandTrendr temporal segment trajectories(grey dotted line)for four disturbance agents and the corresponding post-disturbance high-resolution image chips.a Fire,b logging, c road construction,and d insects
The spectral index of NBR is widely used to detect forest change events, such as abrupt and continuous changes, due to its excellent sensitivity to chlorophyll,charcoal ash and water content in vegetation leaves and soil (Kennedy et al. 2010; Kennedy et al. 2015; Zhu et al.2012). In this study, forest disturbances were identified and characterized based on the NBR time series. To obtain the LandTrendr-derived temporal segments representing potential forest disturbances, a magnitude threshold of the NBR value for the temporal segments was based on the median and standard deviation of NBR values for the forest disturbance samples with a sliding threshold method suggested in previous study (Grogan et al. 2015; Tang et al. 2019). In this case, the optimal threshold is ΔNBR=0.277. Then, temporal segments with an NBR value magnitude greater than the optimal threshold and a duration less than 3 years were identified as disturbance events. For each disturbance event,attributes such as year, duration, and magnitude of disturbance, pre- and post-disturbance NBR value, and change rate (i.e., the ratio between change magnitude of NBR value and disturbance duration) were recorded.
Patch-based agent attribution of forest disturbance
Anthropogenic and natural forest disturbances usually occur over large areas (patches) (Kennedy et al. 2015). In this study, the spatially adjacent disturbance pixels within a 3×3 window for each year were aggregated as patches and assumed to be caused by the same disturbance agent. To avoid the effects of small-area unverifiable disturbance on the attribution of forest disturbance,only patches with an area above 0.01 km2were considered for attributing the casual agents of forest disturbance.
Four groups of predictor variables, such as pre- and post-disturbance spectral conditions, disturbance and topographical factors (Table 1), were generated to attribute forest disturbance agents. Predictor variables in the first three groups were derived using LandTrendr-based temporal segmentation of the LTSSs of the NBR, tasselled cap wetness (TCW) and tasselled cap angle(TCA). As these variables are very sensitive to canopy moisture and structure and vegetation cover (Hansen et al. 2001; Powell et al. 2010), the TCW and TCA can provide different disturbance-related spectral properties of LandTrendr-derived temporal segments from the NBR. In total, 27 predictor variables were created for each disturbance patch.
An RF model was used to determine the causal agents of forest disturbance by classifying the predictor variables. Random forest is a nonparametric machine learning approach for classification and regression and is robust for a large number of predictor variables (Breiman 2001). The output of the model is determined by a majority vote of the trees that use the randomly selected training sample subsets and the predictor variables at each node (Breiman 2001). In this study, the RF model was built with the default setting of 500 trees suggested in previous studies (Hermosilla et al. 2015; Kennedy et al. 2015). Considering that the inclusion of correlated variables has no accuracy penalty (Schroeder et al.2017), the number of variables in the random subset at each node was set to(i.e., the square root of the number of input variables). Subsequently, the constructed RF model was applied to all disturbance patches detected by the LandTrendr algorithm to produce the disturbance agent map each year. Moreover, the relative importance of predictor variables was determined using the ranking of the mean decrease in Gini score in the RF model (Shimizu et al. 2019). The higher the value of the mean decrease in the Gini coefficient is, the more important the variable is in the RF model. The RF models were built and run using the R software package “randomForest” (Liaw and Wiener 2002).
Accuracy assessment
The accuracy of forest disturbance mapping was evaluated using the confusion matrix of disturbed and undisturbed forest classes. Traditional and areaadjusted accuracy measures, including overall accuracy(OA), user accuracy (UA) and producer accuracy(PA), were individually calculated. Considering the very few area proportions of disturbed forests in theHDMR, an error-adjusted estimator of area was computed and then applied to produce area-adjusted accuracy measures from the error matrix of estimated area proportions, as proposed by Olofsson et al.(2013, 2014). In this case, variances for the accuracy measures were quantified by the 95% confidence intervals of the disturbed and non-disturbed forest areas. More detailed descriptions of calculating traditional and area-adjusted accuracy measures were provided by Congalton (1991), Liu et al. (2007) and Olofsson et al. (2013, 2014).
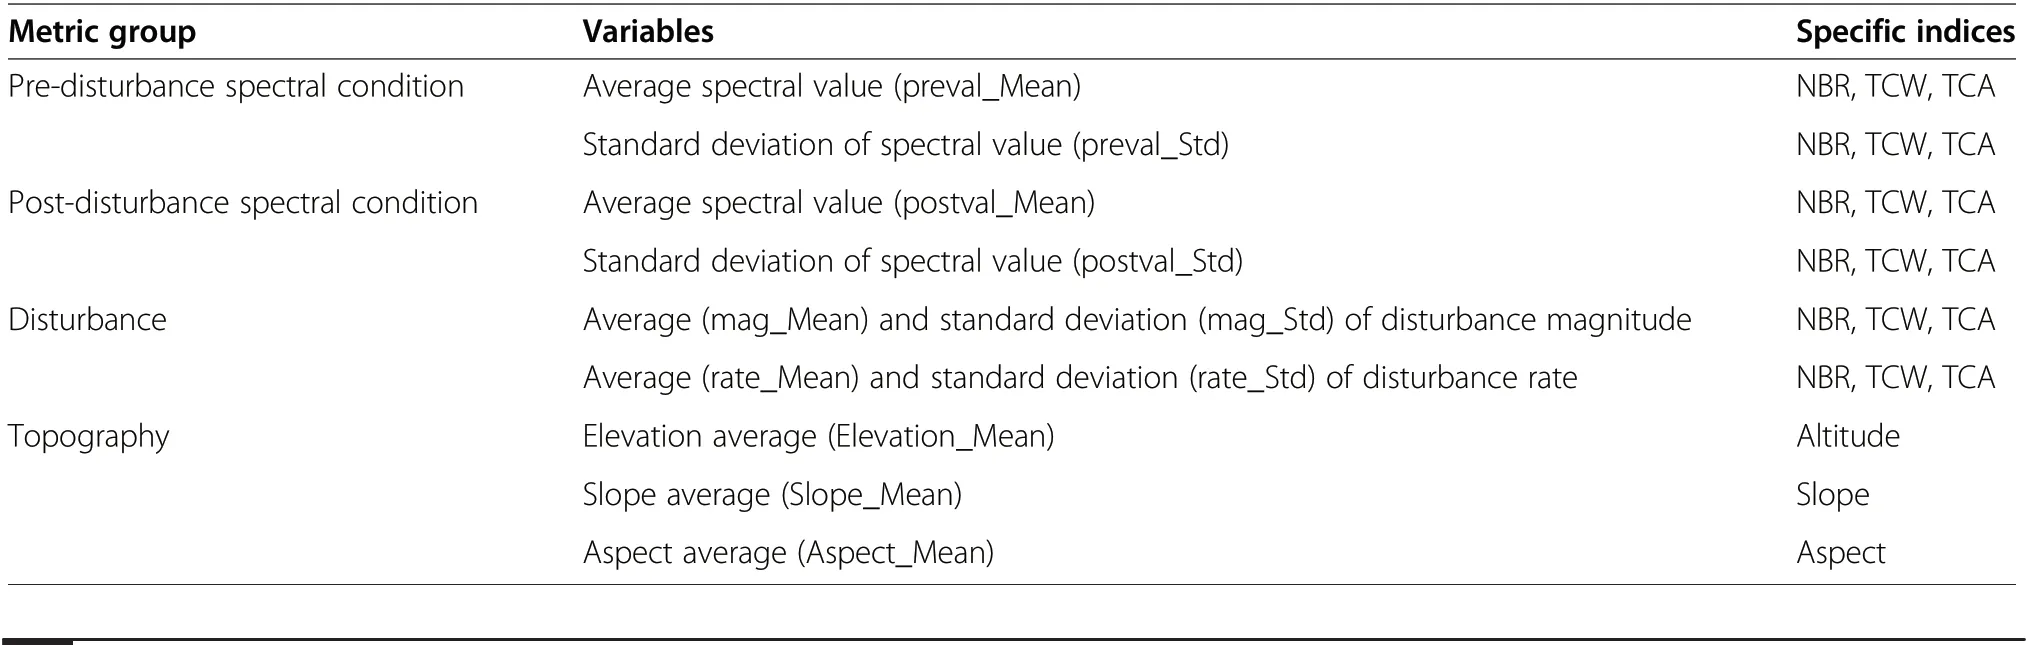
Table 1 Predictor variables extracted from forest disturbance patches and used in the random forest model
The mapping accuracy of disturbance agent attribution in the RF model was calculated using the “out-of-bag”(OOB) estimation technique,which employs an unbiased estimate of the test set error (Breiman 2001). In our study, the RF model was trained using 70% of agentlabelled forest disturbance patch samples generated by a stratified sampling method and tested using the remaining 30% of samples. The accuracies of attributing disturbed patches to different causal agents were computed from the confusion matrix produced by the RF model.
Statistical analyse
A two-sample t-test was employed to determine the significance of the differences in the means of forest loss areas between 1990 and 2000 and 2001–2020 at the 5%significance level (α=0.05) via the R programming language.
Results
Accuracy of forest disturbance detection and attribution
Overall map accuracy
Table 2 shows that the conventional and area-adjusted OAs of the disturbance map were high, with values of 92.39% and 97.70%±0.06%, respectively. The disturbance class presented higher UA (94.25%) and lower PA(77.39%) than the non-disturbance class (91.84% and 98.18%, respectively) for the conventional method, but had lower area-adjusted UA (77.39%±0.32%) and PA(50.17%±0.88%) values than the non-disturbance class(98.18%±0.06% and 99.46%±0.07%, respectively).
The OA of agent classification of disturbed forest patches was 85.80% (Table 3). The fire agent class has the highest UA (94.42%) and PA (86.48%), whereas the insect agent class exhibits the lowest UA (28.57%) and PA (66.67%), with the highest commission error of 71.43%. The UA and PA of the logging agent class are moderate, with values of 72.06% and 83.05%, respectively. The road construction class presents high PA(93.33%) and low UA (53.85%), with a commission error of approximately 46%.
Importance of predictor metrics
As illustrated in Fig. 4, the predictor variables derived from TCW and NBR had higher relative importance in classifying disturbance agents than those derived from TCA and topographical variables. The two most important predictor variables are the mean disturbance magnitude and pre-disturbance value of TCW, followed by the four NBR-derived metrics, such as the mean value of pre- and post-disturbance NBR and the standard deviation of the change magnitude and post-disturbance value of NBR. Among the topographical variables, the mean elevation exhibited the highest importance.
Spatiotemporal characteristics of forest disturbance
The area of disturbed forests from 1990 to 2020 was 3313.13 km2(Fig. 5), roughly accounting for 2.31% of the total forest area (143,357.56 km2) across the HDMR in 1990. The annual forest disturbance area varied from 16.71 km2(in 2017) to 502.69 km2(in 1991), with an average value of 165.79 km2in 1990–2000 and 74.47 km2in 2001–2020.
As depicted in Fig. 6, forest disturbance mainly occurred in the transition areas between forest and non-forest, especially at the forest edges. Forest disturbance in the southern HDMR exhibited more widespread and larger patches than that in the northern HDMR. In addition, forest disturbance was more prone to reoccur in the proximity of the foregonedisturbed areas. Site A in Fig. 6 illustrates that a newly disturbed forest in 2014 occurred in the vicinity of the forest areas disturbed in 2011. Site C in Fig. 6 also shows that forest disturbance reoccurred in 1994 near the areas disturbed in 1992.
Figure 7 shows that forest disturbances mainly occurred in areas with altitudes of 2500–4000 m and areas with slope degrees of 15°–45° and that S and SE slopes(sunny slopes) observed more forest disturbances than Nand NW slopes (shady slopes). Compared with the distribution of forest area in 1990, the occurrence percentage of forest disturbance was higher at moderate elevations between 2000 and 3500 m and sunny slopes(Figs. 7a and c) but was rarely slope-dependent (Fig. 7b).
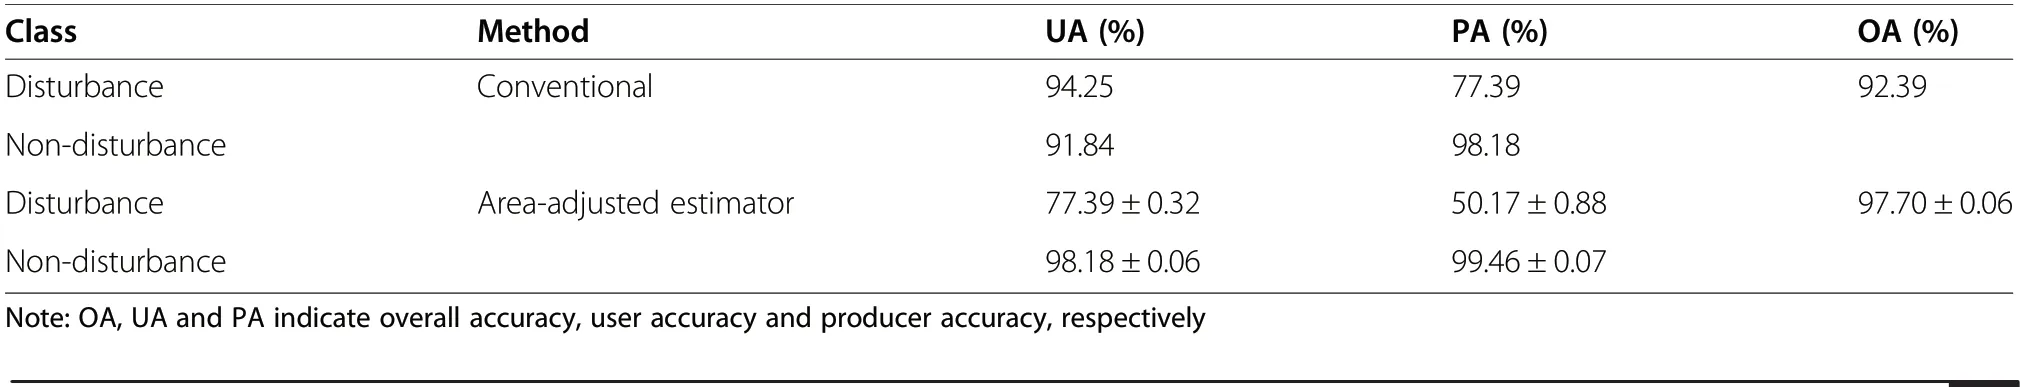
Table 2 Accuracy results of the disturbance map based on two accuracy assessment methods
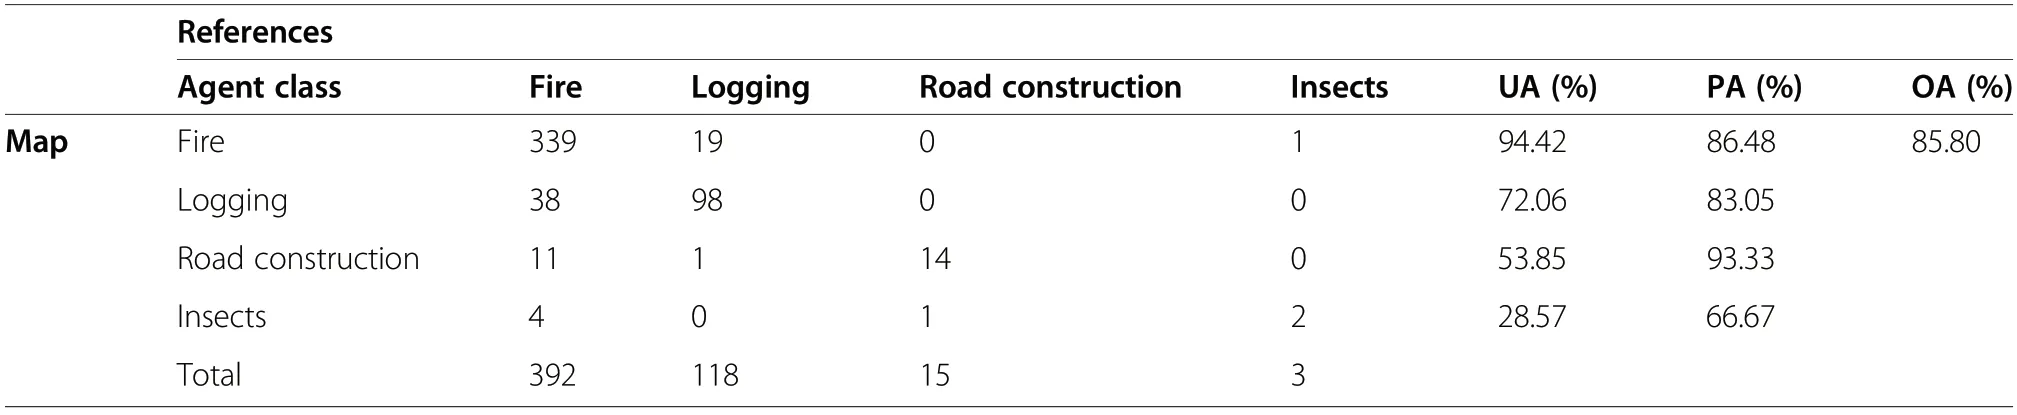
Table 3 Confusion matrix for disturbance agents based on patch numbers
Spatiotemporal patterns of forest disturbance agents
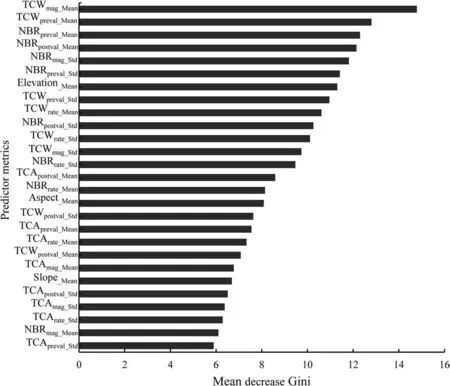
Fig.4 The relative importance of predictor variables ranked by classification mean decrease in Gini.The relative importance derived from the RF model of the predictor metrics is the average over all trees for the total decrease in the node heterogeneity in variable segmentations
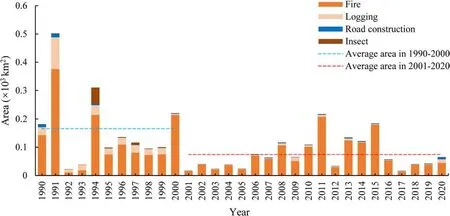
Fig.5 Yearly disturbed areas for different agent classes in the HDMR between 1990 and 2020.The blue and red dotted lines represent theaverage disturbance areas in 1990–2000 and 2001–2020,respectively.The difference in the average disturbance areas between 1990 and 2000 and 2001–2020 was statistically significant at the 5%significance level(α=0.05)
As shown in Figs. 5 and 8, fire was the predominant agent of forest disturbance in the HDMR,followed by logging,insects, and road construction. Forest areas disturbed by the four causal agents were 2760.19, 404.25, 80.10, and 68.60 km2,accounting for 83.31%,12.20%,2.42%and 2.07%of the total disturbed area, respectively (inset (a) in Fig. 8). The statistical results in Fig. 5 further show that the four agents caused larger forest disturbance areas in 1990–2000 than in 2001–2020. The yearly average forested areas disturbed in 1990–2000 and 2001–2020 were 126.27 and 68.56 km2for fire, 29.34 and 4.08 km2for logging, 3.33 and 1.60 km2for road construction, and 6.85 and 0.24 km2for insects, respectively. Three of the four severely fire-affected years had a total burned area above 0.2×10³km2between 1990 and 2000. The t-test statistics further show that the differences in annual mean forest loss areas between the two periods were statistically significant(α=0.05) for logging agents but insignificant (α=0.05) for fire agents. Fire-affected forested areas were remarkably widespread and dominated by large patches across the entire HDMR,whereas the forested areas disturbed by the other three agents were relatively scattered and prevailed in small patches(Fig.8).Additionally,different disturbance agents co-occurred in a given region (Sites A and B in Fig. 8). Except for disturbances caused by insect agents, which mainly occurred in areas with elevations above 4000 m and slopes below 25°,the spatial distributions of the other three agents changed weakly with topographical factors(Fig.7).
Discussion
Forest disturbance dynamics and attribution agents
The total area of disturbed forests during 1990–2020 was 3313.13 km2, approximately 2.31% of forested areas in 1990. The forest disturbance rate is far lower than the global forest loss rate of 4.2% over the same period(FAO 2020) and 17% in Europe between 1986 and 2016(Senf and Seidl 2020). As a well-known global biodiversity hotspot,HDMR possesses many nature reserves,forest parks and scenic areas from the local to national level, which effectively reduces human-induced forest disturbance (Ren et al.2015;Yin et al.2020).In addition,the annual forest disturbance area dropped significantly(α=0.05) from 165.79 km2in 1990–2000 to 74.47 km2in 2001–2020 and from 29.34 to 4.08 km2for logging agents. This finding reflects that the NFCP initiated in 1998 (Zhang et al. 2000), especially the logging bans on natural forests have effectively inhibited human-induced forest loss and greatly improved forest cover in the HDMR (Qu et al. 2018; Ren et al. 2015).
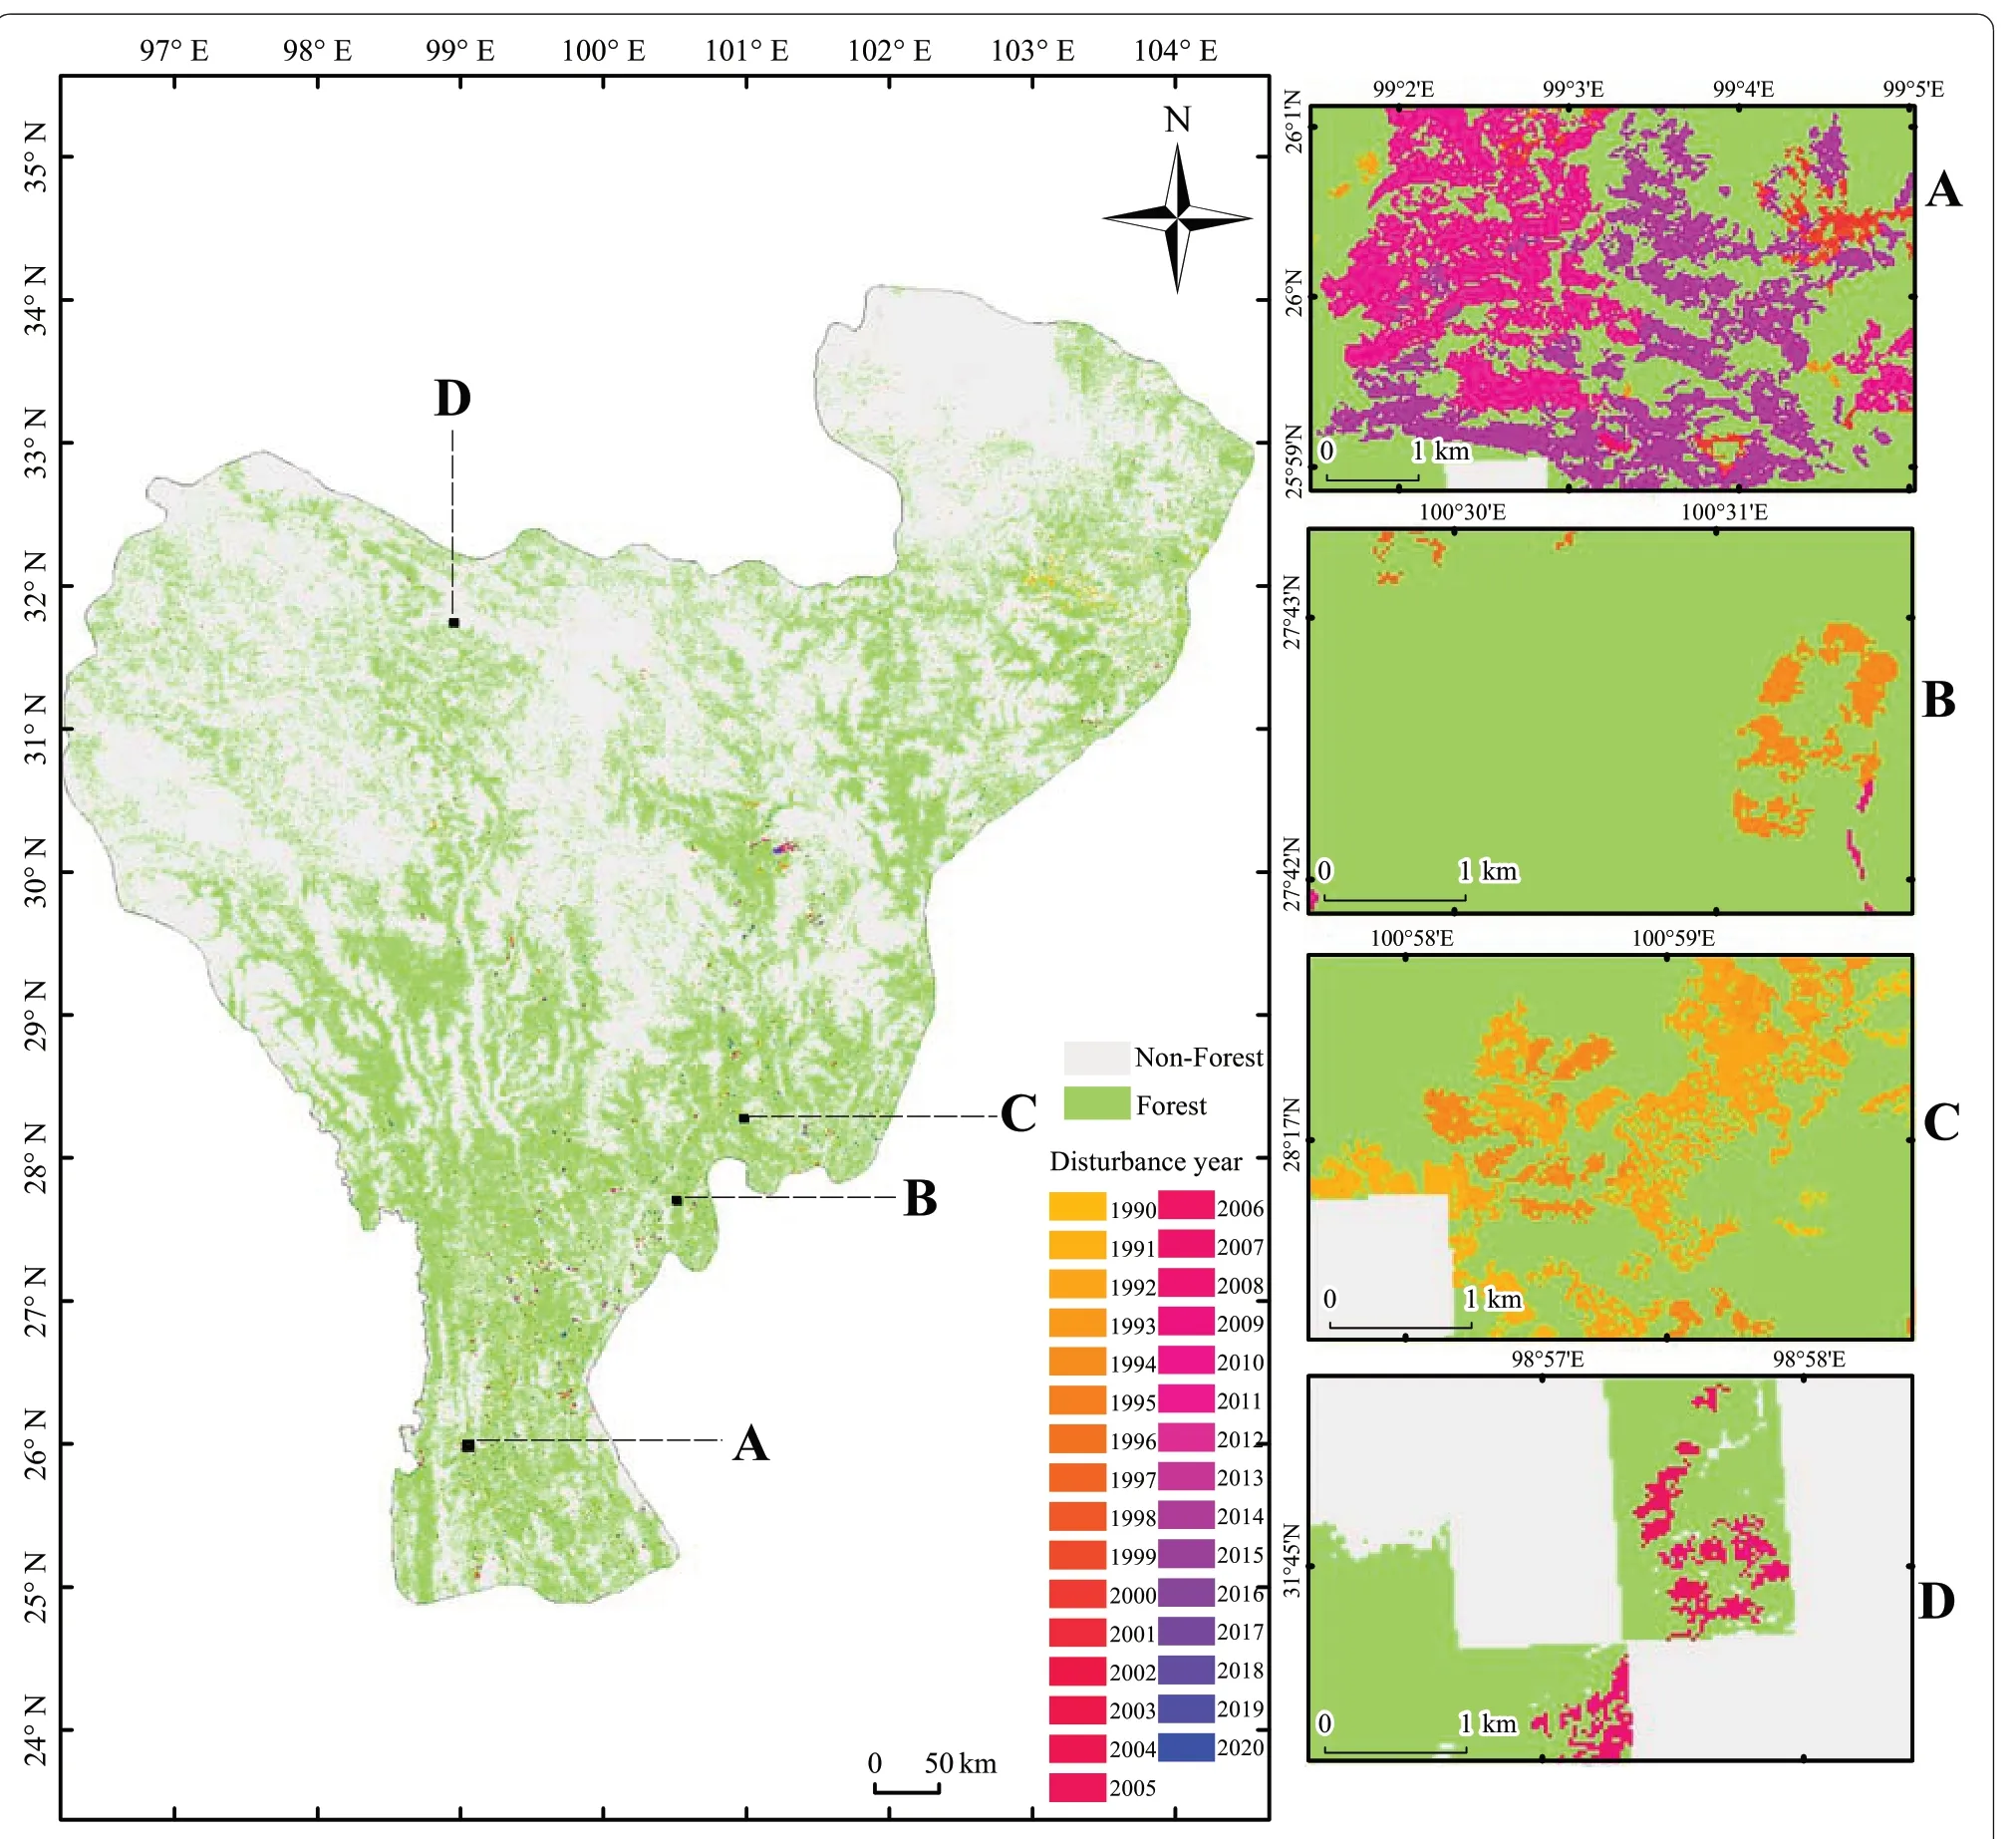
Fig.6 Forest disturbances during 1990–2020 in the HDMR.A, B, C and D are zoomed-in images of four typical sites marked in the left panel with the corresponding letters
Across the HDMR, forest fires were the overwhelmingly predominant disturbance agents. Between 1990 and 2020, the forest area disturbed by fire agents reached 2760.19 km2, approximately 83.33% of the total disturbed area. Previous studies on fire history indicated that fire driven mainly by dry season temperature and drought under the monsoonal climate (Han et al. 2018;Li et al. 2017) was an essential factor affecting forest dynamics in the HDMR and its surroundings (Han et al.2018; Sun et al. 2016; Xiao et al. 2017). Some endemic species, such as Pinus yunnanensis, depend heavily on fire for their persistence and ecosystem sustainability in the HDMR (Pausas et al. 2021; Su et al. 2015). Furthermore, variability in fire regime can cause population divergence and sympatric speciation (Pausas et al. 2021).Although existing evidence has demonstrated that rich biodiversity is uplift-driven diversification in the HDMR(Xing and Ree 2017), fire undoubtedly plays a key role in shaping regional plant evolution, biodiversity and terrestrial ecosystem processes (Huffman 2014; Kelly et al.2020; Pausas et al. 2021; Su et al. 2015). With the implementation of a series of strict forest management measures, such as the NFCP (Zhang et al. 2000), Forest Ecosystem Compensation Fund (2001–2016) (Bryan et al. 2018), and Wildlife Conservation and Nature Protection Program (2001–2050) (Bryan et al. 2018), the annual fire-caused forest disturbance area shrank by half,from 126.27 km2in 1990–2000 to 68.56 km2in 2001–2020. However, the implications of the reduction in burned area to forest ecosystems remain to be explored,especially for fire-dependent ecosystems at the landscape scale (Han et al. 2018; Su et al. 2015). The accurate and spatiotemporally explicit information on fire disturbance in this study provided a basis for further investigating postfire forest regeneration and biodiversity patterns(Pettorelli et al. 2016).
Performance of the LandTrendr algorithm and RF model using Landsat time series of non-growing season image composites
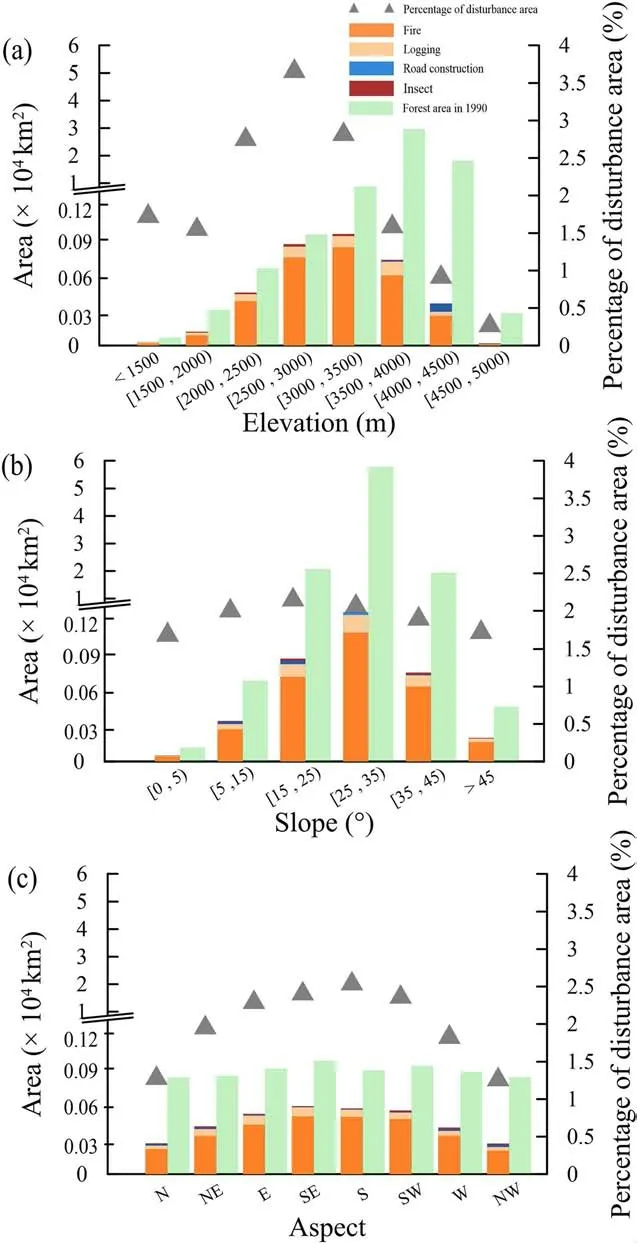
Fig.7 Disturbed areas caused by four disturbance agents under different topographic factors in the HDMR.a Elevation,b slope,and c aspect.The division of slope and aspect is based on the Technical Regulations for the Inventory for Forest Management Planning and Design(GB/T 26424–2010)issued by the National Forestry and Grassland Administration of China.Different aspects are abbreviated as follows:north(N),northeast(NE),east(E), southeast(SE),south(S),southwest(SW),west(W),and northwest(NW)
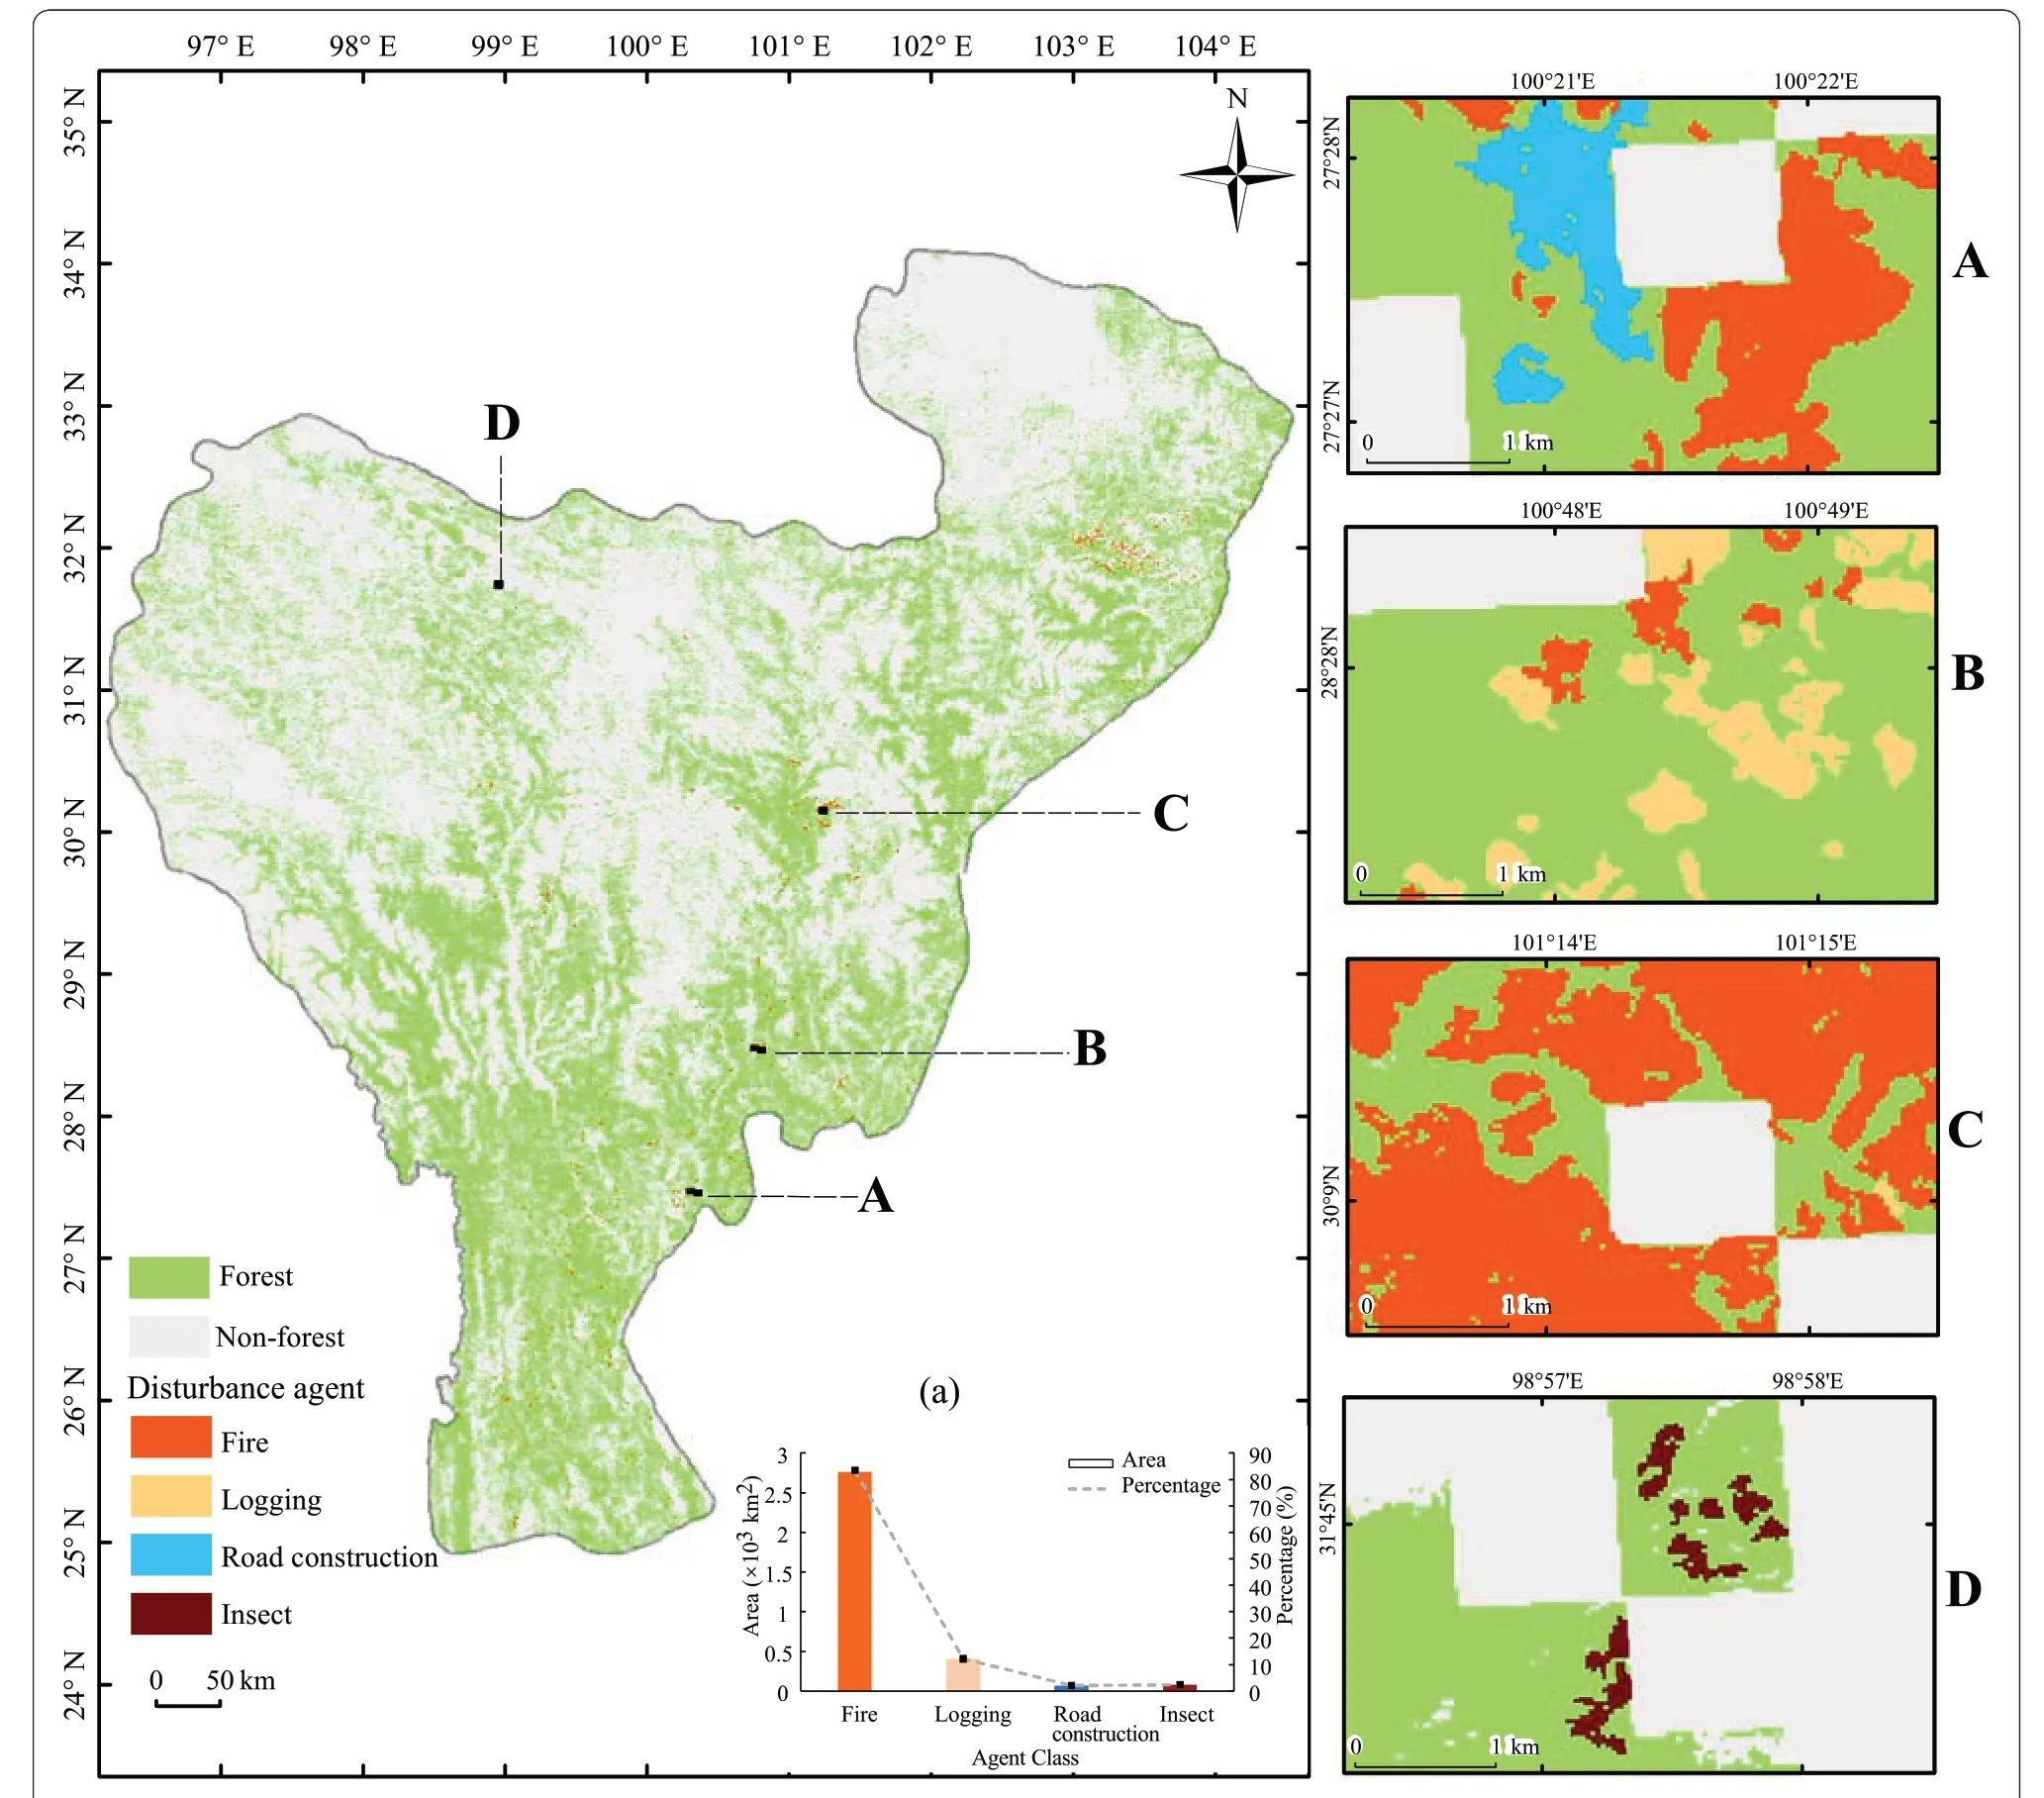
Fig.8 Map of forest disturbances attributed to different agent classes in the HDMR.A, B, C and D are four typical forested sites disturbed by fire,logging, road construction and insect disturbance agents,respectively.The inset(a)in the left panel depicts the area and percentage of forestaffected by different casual agents
The high accuracies of mapping forest disturbances and attributing disturbance agents across the HDMR indicate that the LandTrendr algorithm and RF classification model performed well based on Landsat time series of annual non-growing season image composites. The unique deep gorges and high mountain environment with sharp altitudinal and climatic differentiation together with the prevailing southwest monsoon in the HDMR (Zhang et al. 1997) lead to very poor availability of cloud- and snow-free Landsat images in the growing season. Therefore, a time series of composite Landsat images acquired in the nongrowing season spanning October to March of the following year was employed to map forest disturbance and the attribution agents using the LandTrendr algorithm and RF model in this study.The resultant mapping OAs reach 92.30% (97.70%±0.06% for area-adjusted) for forest disturbance and 85.80% for disturbance agent attribution; these values are higher than 71.8% and 84.7% of the results of Shimizu et al. (2017) in the Bago Mountains of Myanmar based on non-growing season (November–February) Landsat images, approximately 80% and 84%of the work of Kennedy et al. (2015) in Puget Sound,USA, based on growing season (July–August) Landsat images, 83.6%–87.5% and 73.0%–80.7% of the results of Nguyen et al. (2018) in eastern Victoria, Australia, based on growing season (December–March) Landsat images,respectively. The results are also comparable to 92%±1.6% and 91.6% of the results of Hermosilla et al. (2015)in the Canadian Prairies based on growing season (July–August) Landsat images, and 90.8%–96.6% and 78%–91% of the work of Oeser et al. (2017) at three sites in Central Europe based on all available Landsat images.Compared with the previous studies mentioned above,the HDMR investigated here has a larger geographical extent, more complex topographical conditions and more heterogeneous and diverse forest landscapes. Here,the ability to detect forest disturbance and the causal agents was undoubtedly compromised by the topographic and phenological effects in Landsat composites resulting from the wide intra-annual span of image acquisition time. Removing these unfavourable effects prior to running the LandTrendr algorithm and RF model can considerably improve the accuracies of detection and attribution of forest disturbance in future work.
Among the four investigated disturbance agents, the fire agent was best discriminated, followed by logging,whereas the RF model performed poorly for identifying insect disturbances. This result is supported by the results of Neigh et al. (2014), which demonstrated a low attribution accuracy of insect disturbance. The yearly Landsat composite images used in this study together with inadequate fine-resolution verification data of insect disturbance considerably hampered the accurate and effective detectability of defoliation and stand mortality of infested forests (Neigh et al. 2014; Senf et al. 2017). In addition, insect disturbance often occurs with other disturbances, such as fire or logging disturbances, and thus might not be explicitly separated from other causal agents (Hermosilla et al. 2019; Meigs et al. 2015). Although intra-annual data availability has been improved in recent years by integrating multi-source optical time series of varying sensors (such as Sentinel-2), discriminating insect disturbance from other disturbance agents remains challenging in areas (e.g., HDMR) with frequent cloud cover. With the increasing availability of microwave remote sensing data (such as Sentinel-1), combining dense time series of optical and microwave data will help enhance the potential for separating insect disturbances from other disturbances (Hirschmugl et al.2020).
Spectral metrics, such as the change magnitude in TCW, pre-disturbance TCW, and pre- and postdisturbance NBR, exhibited higher relative importance for attributing the causal agents of forest disturbance in the RF model. The top list of most important predictor variables covers the TCW- and NBR-derived metrics and the mean elevation, whereas the TCA-derived metrics and other topographical factors are less important.The effectiveness of spectral change magnitude in separating forest disturbance agents agrees with the results of previous studies (Hermosilla et al. 2015; Kennedy et al.2015; Nguyen et al. 2018; Schroeder et al. 2017; Shimizu et al. 2017; Shimizu et al. 2019), which highlighted the importance of disturbance magnitude and pre- and postdisturbance spectral values. The inclusion of the temporal trajectories of multiple spectral indices into the RF attribution model might improve the accuracy of disturbance agent maps (Cohen et al. 2016; Nguyen et al.2018; Shimizu et al. 2019; Vogelmann et al. 2012). However, the relative importance of different spectral indices varies with the examined agent types, especially the dominant disturbance agent. The most important contributor to attributing different disturbance agents is the mean elevation in the cases of disturbances caused predominantly by forest management and urbanization(Kennedy et al.2015)and by windthrow and bark beetles(Oeser et al. 2017), the TCW magnitude in the areas mainly disturbed by logging and water invasion (Shimizu et al. 2017; Shimizu et al. 2019), and the TCB magnitude and pre-disturbance NBR value in the wildfire-affected forested areas (Nguyen et al. 2018). Similar to the result of Nguyen et al. (2018), elevation exhibited a moderate relative importance because fire occurrences are rarely elevation-dependent (see Fig.7).
Conclusions
A comprehensive understanding of long-term forest dynamics over vast geographical areas is crucial for sustainable forest management, biodiversity conservation and achieving carbon neutrality goals. In this study, we accurately mapped the fine-resolution spatiotemporal patterns and causes of forest disturbances over the HDMR’s forested ecosystems from 1990 to 2020 by combining the LandTrendr algorithm with the RF model, with forest disturbance mapping accuracies of 92.3% (conventional) and 97.70%±0.06% (area-adjusted)and a disturbance attribution mapping accuracy of 85.80%. Over the examined period, only 2.31% of forested areas underwent disturbances, and fire was the predominant disturbance agent, contributing 83.33% of the disturbance area in the HDMR. From 2001 onward,the annual area of disturbed forests dropped significantly, by 55%, compared with the disturbance area in 1990–2000 because China’s logging bans on natural forests together with other sustainability programmes came into operation. Moreover, the occurrences of forest disturbance and the attribution agents were weakly topography-dependent. The outcomes of this study provide insights regarding the long-term and highresolution spatiotemporal dynamics of forest disturbance and the attributing agents and can inform the effectiveness and efficacy of forest management policies and nature protection programmes. Although soundly accurate,further work can be conducted to remove the potential topographic effects in Landsat images covering a wide intra-annual time span and to improve the detectability of diverse disturbance agents by integrating multi-source optical and microwave satellite data.
Authors’contributions
Yating Li, Zhenzi Wu, and Xiao Xu collected and analysed the data and wrote the manuscript draft; Hui Fan designed this research, conducted the fieldwork and wrote the main manuscript;Xiaojia Tong assisted in data analysis; and Jiang Liu conducted the fieldwork and collected the data. The author(s) read and approved the final manuscript.
Funding
This research was jointly funded by the Second Tibetan Plateau Scientific Expedition and Research Program (2019QZKK04020103), National Natural Science Foundation of China (41971239), and programme for provincial innovative team of the climate change study of the Greater Mekong Subregion (2019HC027).
Declarations
Ethics approval and consent to participate
Not applicable.
Consent for publication
Not applicable.
Competing interests
The authors declare no competing interest.
Received: 18 June 2021 Accepted: 24 October 2021


- Forest Ecosystems的其它文章
- Distribution of Panama’s narrow-range trees:are there hot-spots?
- Linkage of microbial living communities and residues to soil organic carbon accumulation along a forest restoration gradient in southern China
- Simultaneous optimization of even flow and land and timber value in forest planning:a continuous approach
- Mature stand developmental stage has ceased to constitute the most suitable habitat for the capercaillie in the Augustów Forest,Poland
- Nutrient resorption strategies of three oak tree species in response to interannual climate variability
- Topography modulates effects of nitrogen deposition on microbial resource limitation in a nitrogen-saturated subtropical forest