
Linkage of microbial living communities and residues to soil organic carbon accumulation along a forest restoration gradient in southern China
2021-02-28 09:13:40ShuoZhangQiDengYingPingWangJiChenMengxiaoYuXiFangHongboHeJinleiChenPingpingXuShenhuaWangandJunhuaYan
Forest Ecosystems 2021年4期
Shuo Zhang,Qi Deng,Ying-Ping Wang,Ji Chen,Mengxiao Yu,Xi Fang,Hongbo He,Jinlei Chen,Pingping Xu,2,Shenhua Wang,2 and Junhua Yan*
Abstract
Keywords: Soil carbon stock, Microbial biomass,Microbial residues, Forest restoration, Soil clay content, Soil layer
Background
Forest restoration or reforestation is considered an effective land-based climate mitigation strategy through carbon (C) sequestration in both plant biomass and soil(Lal 2003; Laganière et al. 2010). Many countries, especially China, have implemented national programs to preserve and expand forests, which have substantially contributed to Earth’s greening in the past 20 years(Chen et al. 2019). With the establishment of trees, plant biomass C of a restored forest can reach a similar amount to the previously undisturbed forest within several decades (Farley et al. 2004; Nave et al. 2013; Wang et al. 2017). However, the restoration of soil C to the level of undisturbed forests usually takes much longer times. Furthermore, the impact of forest restoration on soil C storage is more variable than C storage in plant biomass, and the key underlying mechanisms for those differential responses are still unclear (Dou et al. 2013;Zhang et al.2019;Xiong et al.2020).Therefore,our knowledge is very limited in accurately predicting the C sequestration potential of restored forests(Wieder et al.2018).
Change of soil C pool with forest restoration depends on the balance between plant- and microbial-derived C inputs and outputs processes (Jastrow et al. 2007). However, recent work suggests that microorganisms can directly promote soil organic C (SOC) formation through the selective retention of anabolic byproducts, especially microbial cells and residues, via an in vivo turnover pathway (Liang et al. 2017). The fraction of soil C derived from microbial residues can be about 40 times larger than the living microbial biomass C, and even larger than 50% of total SOC in some regions (Liang et al. 2019). Amino sugars (AS) are the key compounds of microbial cell walls and primarily occur as microbial residues (Kallenbach et al. 2016). Amino sugars are stable against fluctuations in living microbial biomass size, providing a time-integrated indicator of microbial contributions to soil C storage (Liang et al. 2017). Three prominent AS in the soil are glucosamine (GluN), galactosamine (GalN), and muramic acid (MurA). Among them, GluN is more abundant in fungal than bacterial cell walls, while MurA is exclusively originated from bacteria, and GalN is an essential component of extracellular polymeric substances in the soil (Amelung et al.2001b). A recent study in northern China found that not only living microbial biomass (represent by phospholipid fatty acids, PLFAs) but also microbial residues (represent by amino sugars, AS) consistently increased with forest restoration (Shao et al. 2019). Therefore, microbial metabolism may play an increasingly important role in SOC sequestration following forest restoration (Kiem and K?gel-Knabner 2003; Ma et al. 2018; Chen et al.2020b). Meanwhile, the function of fungi and bacteria in C sequestration may be varied due to the different substrate utilization strategies (Rinnan and B??th 2009).Specifically, Xu et al. (2019) found that fungi are more able to utilize the recalcitrant substrates in soil, while Koranda et al. (2014)found that bacteria are more favorable in utilizing available substrates. Furthermore, Liang et al. (2019) found that the AS retention patterns in soil varied between fungi and bacteria. Consequently, a better understanding of different AS and their contribution to SOC would profoundly improve the model projection of soil C sequestration with the implementation of forest restoration.
Forests in southern China account for about one-third of the total forest area in China (Zhou et al. 2006; Zhang et al. 2013). Meanwhile, recent satellite data revealed that forest restoration or reforestation in southern China dominated the greening trend in China over the last three decades (Chen et al. 2019). Unlike northern China,southern China has a relatively warm and moist climate,favoring microbial proliferation and rapid C turnover(Yang et al. 2020). As a result, high-quality (low C:N)broadleaved litter in the southern forest is more easily decomposed by microorganisms than the coniferous litter in the northern forest. Furthermore, soils in southern China are rich in clay and reactive metal oxides (e.g.,iron and aluminum) (Xu et al. 2013), which may inhibit microbial activity through the formation of organomineral complexes that can protect SOC from microbial attack (Six et al. 2002). These factors influence the change of PLFAs and their metabolism may also have various effects on the accumulation of AS in soil following forest restoration. For instance, microbial-derived relatively low molecular weight residue-C is readily adsorbed by soil clay (Ni et al. 2020). Therefore, high soil clay content in subtropical forests may favor the retention of AS and stabilization of SOC. However, the contribution of AS-derived C (AS-C) to SOC and its underlying mechanisms following forest restoration in southern China are understudied.
The objectives of this study were to explore how the contribution of PLFAs and AS-C to SOC, and its influencing factors during the forest restoration processes.Here, we substituted space for time by selecting forests across a restoration gradient with average stand ages of 14, 49, 70, and >90 years in Changsha County, southern China. Soil samples were collected from each of these four stages at 0–10 and 10–20 cm soil layers. We measured both PLFAs and AS. Our null hypothesis is that SOC, PLFAs and AS will increase due to the increasing rate of plant residue inputs to soil following forest restoration. In addition, we hypothesized that the contribution of AS-C to SOC increased with time after forest restoration.Three research questions motivated our study:(1) whether PLFAs, AS and SOC consistently increased following forest restoration;(2)how the retention patterns in soil between fungal and bacterial residues varied across the forest gradients; and (3) what factors controlled the change in PLFAs and the contribution of AS-C to SOC.
Methods
Site description
The study was conducted at Changsha County, Hunan Province, southern China (113°17′–113°27′ E, 28°23′–28°24′ N). The terrains generally are low-hilly landforms with an altitude of 100 to 550 m, and the slope is between 20°and 30°. The regional climate is a typical monsoon climate. The mean annual temperature is 16.5 °C,with the warmest month in July (30.7 °C)and the coldest month in January (6.4 °C) (Ouyang et al. 2016). The mean annual precipitation is about 1,500 mm with most rainfall occurring between April and August (Zhu et al.2016). The soil is classified as Acrisol according to World Reference Base for Soil Resources that developed from slate and shale parent rock (IUSS Working Group WRB 2007).
The climax vegetation of the region is subtropical evergreen broadleaved forests. A range of secondary forests following different restoration stages are found in this region with sporadic primary forests due to the harvesting and natural disturbances. Based on species composition, recovery time, and dominant tree species (Gu et al. 2019; Chen et al. 2020a), the restoration can be divided into four stages. These forests were regenerated naturally without any tree planting. In this study, four adjacent vegetation communities, with basically similar slope and soil parent materials, were selected to represent a vegetation restoration gradient (using the spacefor-time substitution method). The details of the restoration stages are as follows:
(1) Shrub forests (hereinafter referred to as F14). The
native evergreen broadleaved forests were cleared and prescribed-burnt in 1965, then reforested with Cunninghamia lanceolata in 1966. The plantations were clear-cut in 1989 and logged every 3 to 5 years until 2004, then left undisturbed. The community was dominated by shrubs;
(2)Coniferous and broadleaved mixed forests(hereinafter referred to as F49). The native evergreen broadleaved forests were clear-cut in the early 1970 s,then naturally recovered for nearly 50 years, and formed coniferous and broadleaved mixed forests;
(3) Evergreen broadleaved forests (hereinafter referred to as F70). The native evergreen broadleaved forests were protected by residents for many years, and the stand ages are about 70 years;
(4) Old-growth forests (hereinafter referred to as UF).The native evergreen broadleaved forests were well protected without human disturbances. The stand ages are more than 90 years.
Soil sampling
In November 2019, 6 plots (20 m × 20 m) were randomly established within each restoration stage (F14,F49, F70, and UF) to avoid any possible pseudoreplicates. There were in total 24 selected plots across the four different restoration stages. Table 1 includes the general characteristics of the four forest restoration stages. Soil samples were collected with similar slopes(about 20°) and aspects (northwest) from the depth of 0–10 cm (herein defined as topsoil) and 10–20 cm(herein defined as subsoil) in each plot, respectively.After removing surface litter, 10 core samples were collected using a stainless-steel corer (5 cm diameter) along an S-shape pattern from each soil layer within each plot.The core samples were pooled and homogenized into a single sample. A total of 48 soil samples were collected,representing the 4 forest restoration stages × 6 plots × 2 soil layers. Fresh soils were placed in the Ziplocked bags and transported to the laboratory within 12 h ofcollection. Each soil sample was divided into 3 subsamples. All the subsamples were sieved through a 2-mm sieve to remove stones and coarse roots. The subsamples for physic-chemical analysis were air-dried for 30 days,then ground and passed through a 0.15-mm sieve. The other subsamples for analysis of PLFAs were stored at 4-°C and were completed within one month.
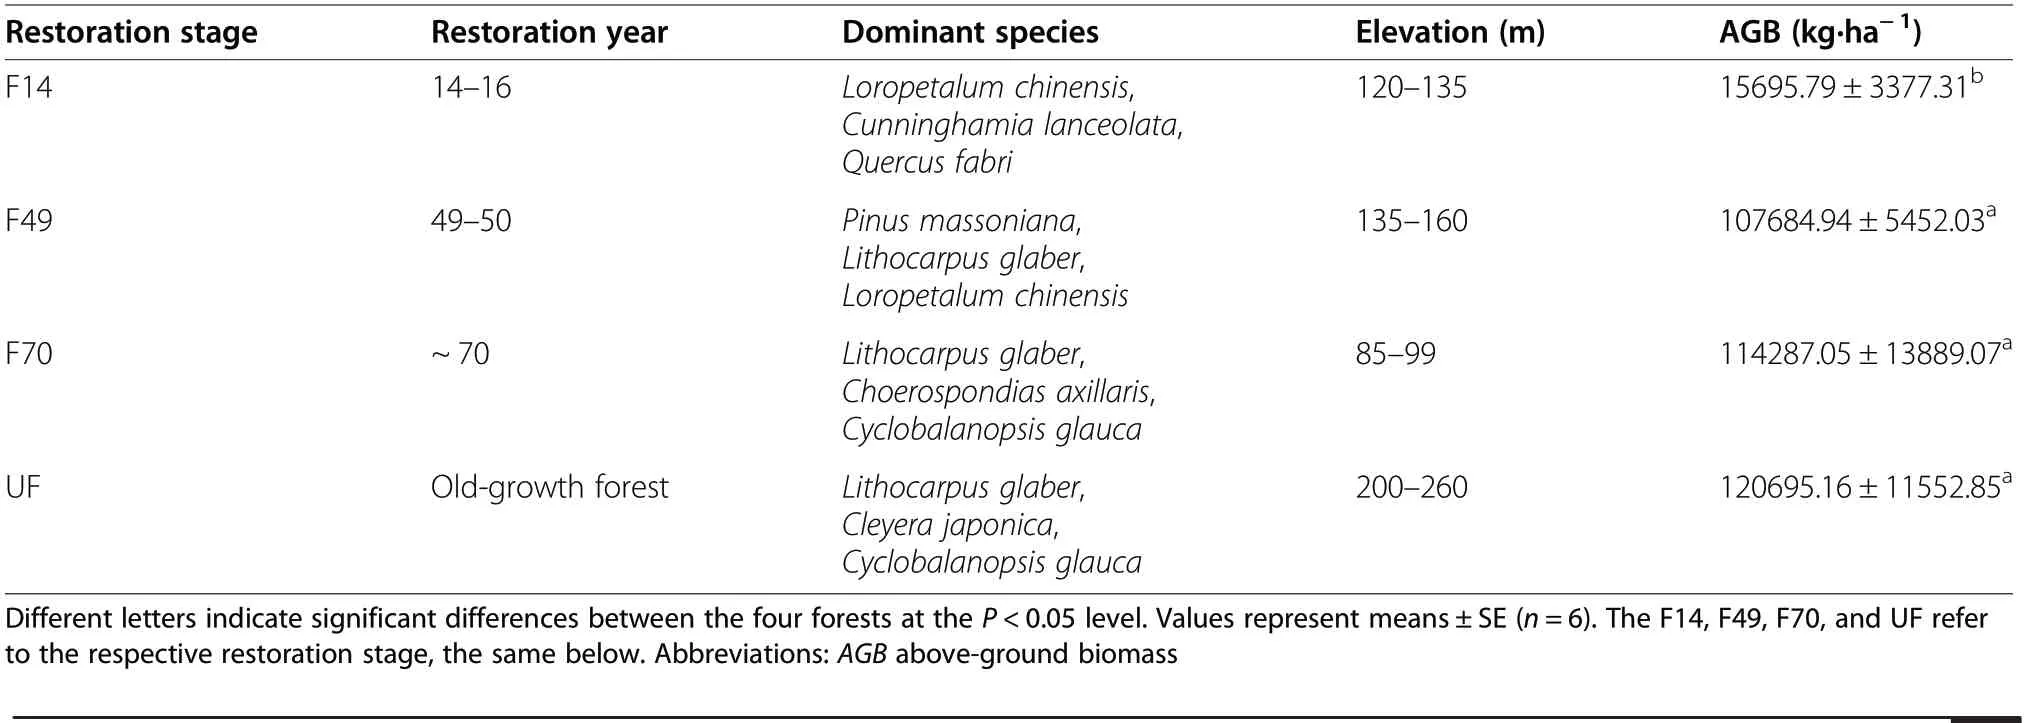
Table 1 General characteristics of the four forest restoration stages
Soil properties analysis
The total carbon(TC) content of soil was measured with an elemental analyzer(Vario MAX,Elementar,Germany).Because soils are acidic (Table 2), the SOC content was equated to TC content. Soil pH was measured in the water and 1 mol·L–1KCL (1:2.5 soil: solution) using a pH meter (Five Easy Plus? FP20-Meter, Mettler Toledo,Switzerland). Soil clay (particle size <2 μm), silt (particle size 2–50 μm), and sand (particle size 50–2000 μm) contents were measured using laser diffraction (MasterSizer 2000, Malvern Corporation). Soil bulk density (BD) was measured gravimetrically in triplicate for generic horizons using the cutting-ring method. SOC stock was calculated as: SOC stock (Mg C·ha-1)=SOC (%) × BD (g·cm–3) ×soil depth (cm) × (1 – δ),and δ is the mass percentage of fragments and stone(>2 mm).
Microbial PLFAs analysis
Microbial PLFAs were measured following a protocol by Frosteg?rd et al. (1993). Briefly, PLFAs were extracted from 2-g freeze-dried and homogenized soil using a specific ratio (1:2:0.8 by vol.; pH 7.4) in a single-phase mixture of chloroform/methanol/phosphate buffer.The PLFA extractions were analyzed using a gas chromatograph equipped with a flame-ionization detector(Agilent 6890,Agilent Technologies,Palo Alto,CA,USA).The content of each fatty acid was expressed as nmol per g of dry soil (nmol·g–1) by the 19:0 internal standard contents (Vestal and White 1989). The total PLFAs content was calculated by summing up all fatty acids mentioned below (C atoms numbers <20). Microbial functional groups were represented by a suit of fatty acids in our study as follows(Frosteg?rd and B??th 1996;Zelles 1997):14:00, 15:00, 16:00, 17:00, 18:00, i19:0, c19:0ω8c, and 10Me19:1ω7c were used as general bacteria; i14:0, i15:0,a15:0, i16:0, i17:0, a17:0, i18:0, i17:1ω9c for gram-positive bacteria; 16:1ω7c, cy17:0, 18:1ω7, 17:1ω8c, and 10Me17:1ω7c for gram-negative bacteria; 18:1ω9c, 18:2ω6c, and 18:3ω3c for fungi; 16:1ω5c for arbuscular mycorrhizal fungi; 10Me16:0, 10Me17:0 and 10Me18:0 for actinomycete. The ratio of fungal to bacterial PLFAs (F:B) was calculated by dividing the sum of all fungal and bacterial fatty acids separately (Frey et al. 1999; Strickland and Rousk 2010).
Amino sugars analysis
Amino sugars were analyzed following a method by Zhang and Amelung (1996) with slight modifications.Briefly, 0.5 g air-dried soil sample (<2 mm) was hydrolyzed with 10 mL 6 mol·L–1HCl at 105 °C for 8 h in a closed hydrolysis flask. The internal standard (100 μg myoinositol) was added to the cooling hydrolysate. The filtered hydrolysate was dried at 52 °C using a rotary evaporator. The dried sample was re-dissolved in the approximately 6 mL deionized water and adjusted pH to 6.6–6.8 with 1 mol·L–1KOH. Then, the sample wascentrifuged for 10 min at 935 g and the supernatant was re-rotating evaporation at 52 °C. After drying, 3 mL absolute methanol was added to dissolve the residue.The supernatant was transferred to a conical reaction vial and dried by N2gas at 45 °C. The dried residue was added with 1 mL deionized water and 100 μL Nmethylglucamine, then freeze-drying. After drying, the residue was dissolved with a 300-μL derivatization reagent, which contains 32 mg?mL–1hydroxylamine hydrochloride and 40 mg?mL–14-dimethylaminopyridine in pyridine-methanol (4:1 v/v). The sample solution was fully mixed by swirling and heating at 75–80 °C for 35 min. After cooling, the derivative was acetylated with 1 mL acetic anhydride and reheated at 75–80 °C for 25 min, then mixed with 1.5 mL dichloromethane. Excessive derivatization reagent (residual anhydride)was removed by extracting with 1 mol?L–1HCL and deionized water. The remaining dichloromethane phase contains AS derivative was dried by N2gas at 45 °C. Finally, the AS derivatives were redissolved with 200 μL ethyl acetate-hexane (1:1) and separated on a gas chromatograph (HP 6890, Agilent, USA) equipped with an HP-5 fused silica column (30 m × 0.25 mm × 0.25 μm).The individual AS (glucosamine, galactosamine, and muramic acid) derivatives were separated by referencing the retention times of authentic standards. The total AS content was calculated as the sum of the individual AS(Amelung et al. 2001b). The fungal residue-C (GluN-C),bacterial residue-C (MurA-C), and GalN-C were using the following equations (Engelking et al. 2007): GluNC=72 × GluN/179.2, GalN-C=72 × GalN/179.2, and MurA-C=108 × MurA/251.23. The total AS-C was estimated as the sum of GluN-C, GalN-C and MurA-C. The proportion of AS-C in SOC content was used to describe the relative contribution of AS-C to SOC (AS-C/SOC) (Liang et al. 2019). The ratio of GluN to MurA(GluN:MurA) was calculated to differentiate fungal and bacterial residues in soil (Zhang et al. 1998; Amelung et al. 2001a;Six et al. 2006).
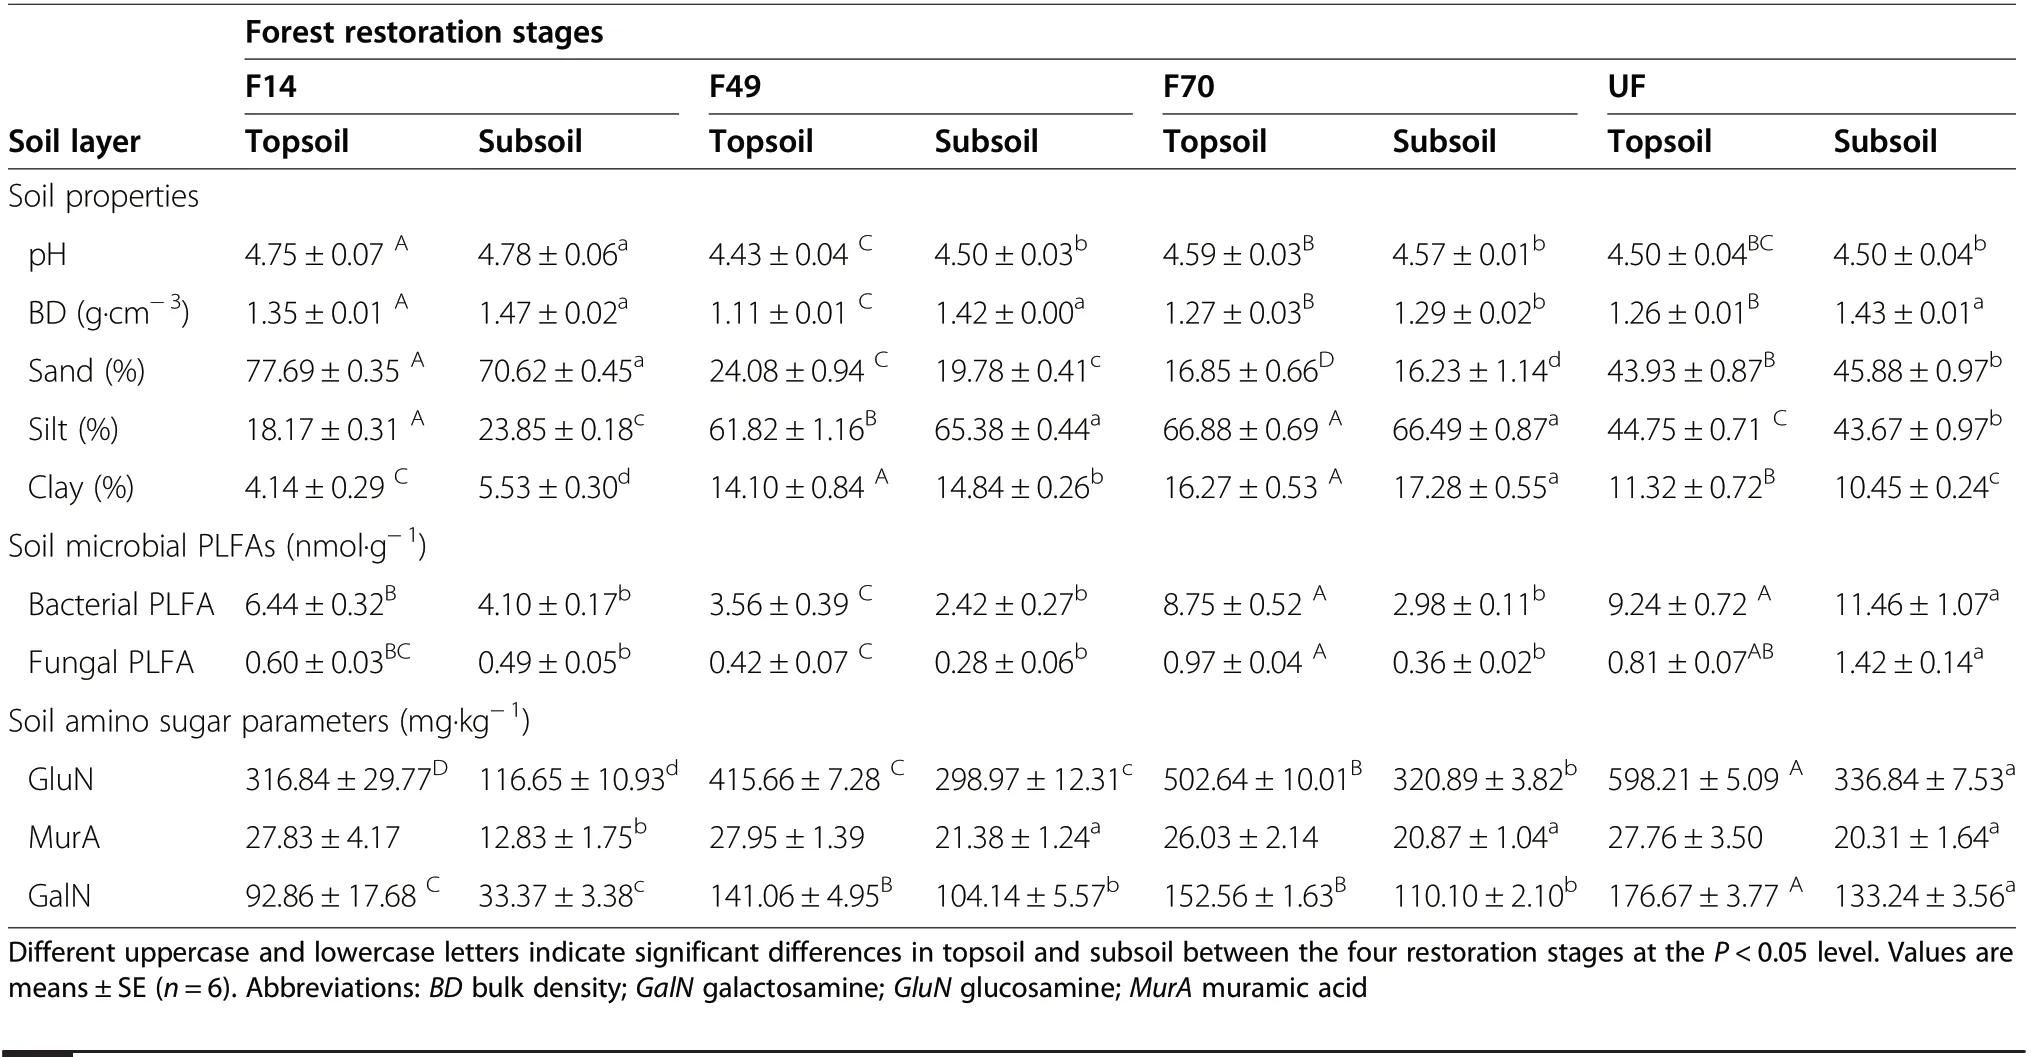
Table 2 Soil and microbial properties between the four forest restoration stages
Statistical analysis
The data were first tested for normal distribution and homogeneity of variance, and no data were natural logtransformed. After confirming the data followed a normal distribution, a one-way analysis of variance(ANOVA) with Tukey’s multiple comparison test (HSD)was used to determine how SOC, microbial PLFAs, and AS changed between forest restoration stages and soil layers. In addition, a generalized linear model (GLM)with normal distribution was applied to evaluate the relationship of SOC, PLFAs, AS, and AS-C/SOC to plant and soil properties. All statistical analyses were carried out with IBM SPSS Version 24.0 (IBM Corp., New York,USA) statistical software. Figures were plotted with SigmaPlot 14.0 software (Systat Software Inc., San Jose,USA).
Results
Variation of soil properties following forest restoration
The SOC content in both soil layers generally increased following forest restoration (Fig. 1, P <0.05), with the lowest value in F14 (10.65 and 6.96 g?kg–1in topsoil and subsoil, respectively). There was no significant difference in SOC content between F70 and UF in topsoil. Similarly, there was no difference in SOC content between F49 and F70 in subsoil. The SOC stock increased with time since forest restoration (Fig. 1, P <0.05), with the lowest value in F14 (24.60 Mg C?ha–1) and the highest value in UF (51.12 Mg C?ha–1).
Soil pH, soil BD, and soil clay content changed with soil layer and forest restoration stage (Table 2, P <0.05).The soil was consistently acidic in both soil layers, with the lowest value in F49 (4.43 and 4.50 in topsoil and subsoil, respectively) and the highest value in F14 (4.75 and 4.78 in topsoil and subsoil, respectively). Soil BD in topsoil significantly decreased from F14 (1.35 g?cm–3) to F49 (1.11 g?cm–3) and then increased with forest restoration. In the subsoil, the BD in the F70 (1.29 g?cm–3)was significantly lower than it was in the other three restoration stages (Table 2, P <0.05). Soil clay content showed a trend of initial increase, then decline in both soil layers following forest restoration (Table 2), with the lowest value in F14 (4.14 and 5.53% in topsoil and subsoil, respectively) and the highest value in F70 (16.27 and 17.28% in topsoil and subsoil,respectively).
Variation of soil living microbial biomass following forest restoration
Soil living microbial biomass (represented as PLFAs)changed significantly between forest restoration stages.Total PLFAs showed a general trend of an initial decrease and then increase (Fig. 2a, P <0.05) in topsoil,with the lowest value in F49 (4.41 nmol?g–1) and the highest value in UF (11.54 nmol?g–1). While in subsoil,total PLFAs were significantly higher in UF (14.53 nmol?g–1) than in the other three restoration stages, and no significant difference was found between these three stages. The F:B ratio showed no significant differences between the different forest restoration stages in both soil layers (Fig. 2b). The content of different individual PLFAs in soil between the four forest restoration stages was listed in Table S1.
Variation of soil microbial residues following forest restoration
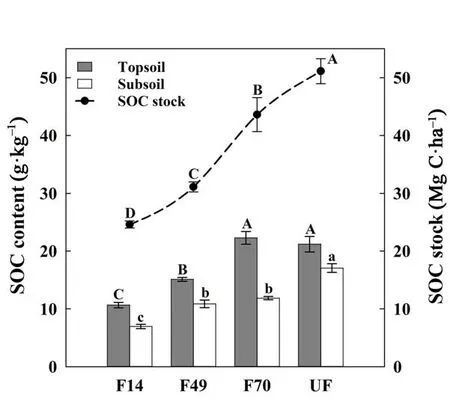
Fig.1 Variations of SOC stock(dotted line)and SOC contents(bar)following forest restoration. Different uppercase and lowercase letters indicate significant differences in topsoil(grey bar) and subsoil(white bar)between the four restoration stages at the P <0.05 level.Symbols and barsrepresent means±SE(n=6)
We found that total AS contents increased following forest restoration in both soil layers (Fig. 3a, P <0.05), with the lowest value in F14 (437.53 and 162.84 mg?kg–1in topsoil and subsoil, respectively) and the highest value in UF (802.63 and 490.40 mg?kg–1in topsoil and subsoil,respectively). The GluN:MurA ratio increased following forest restoration at both soil layers (Fig. 3b, P <0.05),with the lowest value in F14 (11.66 and 9.16 in topsoil and subsoil, respectively) and the highest value in UF(21.85 and 16.68 in topsoil and subsoil,respectively).
Contribution of microbial residue-C to SOC following forest restoration
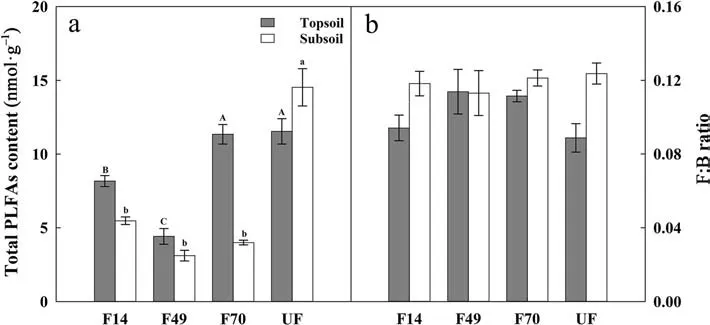
Fig.2 Variations of the total PLFAs content(panel aA ), the ratio of fungal to bacterial PLFAs(F:B, panel bB) following forest restoration. Different uppercase and lowercase letters indicate significant differences in topsoil(grey bar) or subsoil(white bar) between the four restoration stages at the P <0.05 level.Bars represent means±SE (n=6)
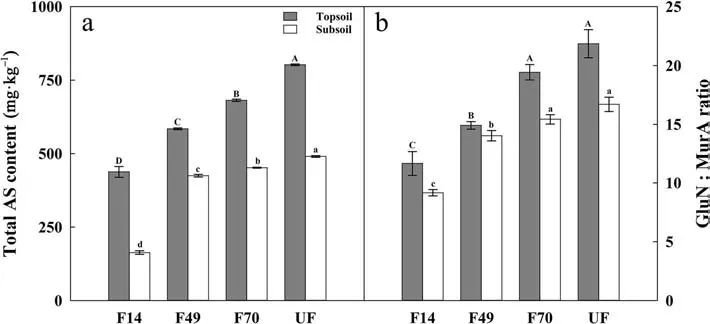
Fig.3 Variations of total amino sugars content(AS,panel Aa ),and the ratio of fungal to bacterial residues in soil(GluN:MurA,panel Bb) following forest restoration. Different uppercase and lowercase letters indicate significant differences in topsoil(grey bar)and subsoil(white bar)between the four restoration stages at the P <0.05 level.Bars represent means±SE(n=6)
The total microbial residue C accounted for 0.95–1.66%in SOC across all forest restoration stages (Fig. 4). In topsoil, the microbial residue-C in SOC (AS-C/SOC)was significantly lower in F70 (1.23%) than in other forests. In subsoil, the AS-C/SOC was significantly lower in F14 (0.95%) and UF (1.16%) than in other forests. The contribution of fungal residue-C in SOC (GluN-C/SOC)was significantly lower in F70 (0.91%) and F49 (1.11%)than in other forests in topsoil, which was significantly lower in F14 (0.68%) and UF (0.80%) in subsoil (Fig. 4b,P <0.05). The bacterial residue-C in SOC (MurA-C) decreased significantly in topsoil following forest restoration (P <0.05, Fig. 4c), with the lowest value in F70(0.05%) and the highest value in F14 (0.11%). In subsoil,the MurA-C/SOC was significantly lower in UF (0.05%)than in other forests.
Correlation analysis
The linear correlation showed that SOC content was positively correlated with AGB in both soil layers and with clay content in topsoil (Fig. 5a, b and P <0.001).The total AS content was also positively correlated with AGB and clay content in both soil layers (Fig. 5e, f and P <0.001). However, there was no relationship between total PLFAs and AGB or soil clay content across the forest restoration gradient (Fig. 5c, d and P ≥0.05). The AS-C/SOC was negatively correlated with clay content in topsoil (Fig.5 h,P <0.001), while it was positively correlated with clay content and AGB in subsoil (Fig. 5 g and 5 h, P <0.001).
Discussion
Changes in SOC, microbial living biomass and residues following forest restoration
In terrestrial ecosystems, SOC stock depends mainly on the balance between the input and output of C in the soil. With the establishment and growth of trees, forest restoration generally increases the input of plant residues into the soil. At the same time, the input of plant residues and the improvement of soil conditions may also stimulate microbial activity and increase the decomposition of plant residues and soil organic matter.Our study demonstrated that forest restoration significantly increased SOC stock following forest restoration in the Changsha county area of southern China (Fig. 1).This result was consistent with previous studies (Lu et al. 2018; Zhang et al. 2019), suggesting that the increased input of plant residues following forest restoration cannot be offset by the increased microbial decomposition. The positive linear relationship between SOC content and AGB observed here supported this view (Fig. 5a). In addition, the increasing vegetation cover and the developing root systems with the forest restoration may reduce loss of soil organic matter from erosion and promote aggregate formation to increase the soil clay content (Sauer et al. 2012; Sun et al. 2019).Meanwhile, the increasing clay content could also enhance SOC accumulation by forming clay-humic complexes and eventually protected SOC from microbial attack (Six et al. 2002). This explanation was supported by the positive linear relationship between SOC and soil clay content as observed in topsoil (Fig. 5b). Previous studies indicated that SOC accumulation might depend on litter quality rather than litter quantity (Zhou et al.2019). However, in this study, we did not find any significant relationship between SOC and litter C:N ratio,probably due to the relatively small variation of litter C:N ratio across the four forest sites. Previous studies indicated that soil C stocks could reach the equivalent level of the undisturbed old-growth forests within about 60 years of restoration in the tropical region (Zhang et al.2019), while it takes about 120 years in the northern temperate forests (Shao et al. 2019). However, our study sites are located in the subtropical region. Hence we speculate that SOC stock in our restored forests may take no than 120 years to reach the equivalent level of the undisturbed old-growth forests.
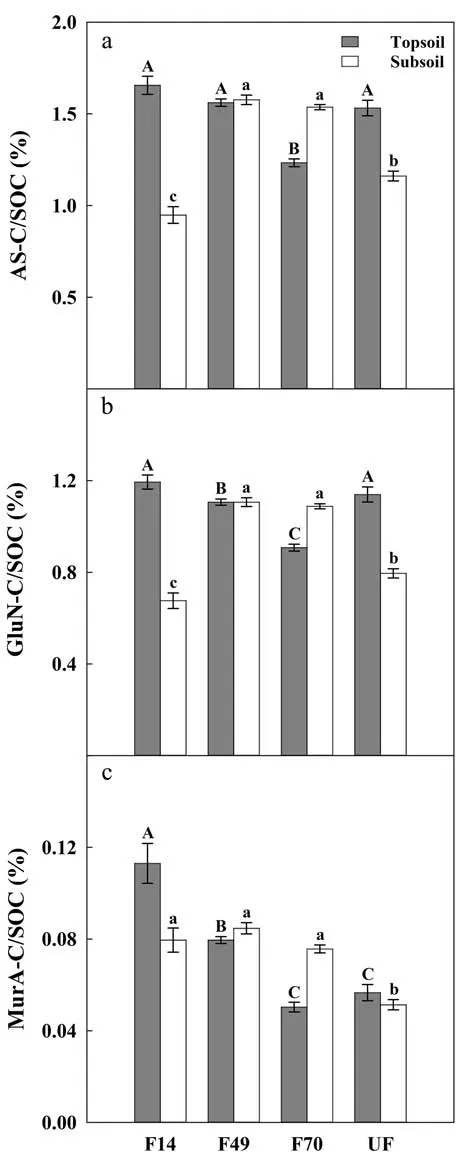
Fig.4 Variations of total microbial residue-C(AS-C,panel aA ), fungal residue-C(GluN-C,panel Bb),and bacterial residue-C(MurA-C, panel Cc ) in SOC following forest restoration. Different uppercase and lowercase letters indicate significant differences in topsoil(grey bar)or subsoil(white bar)between the four restoration stages at the P <0.05 level.Bars represent means±SE(n=6)
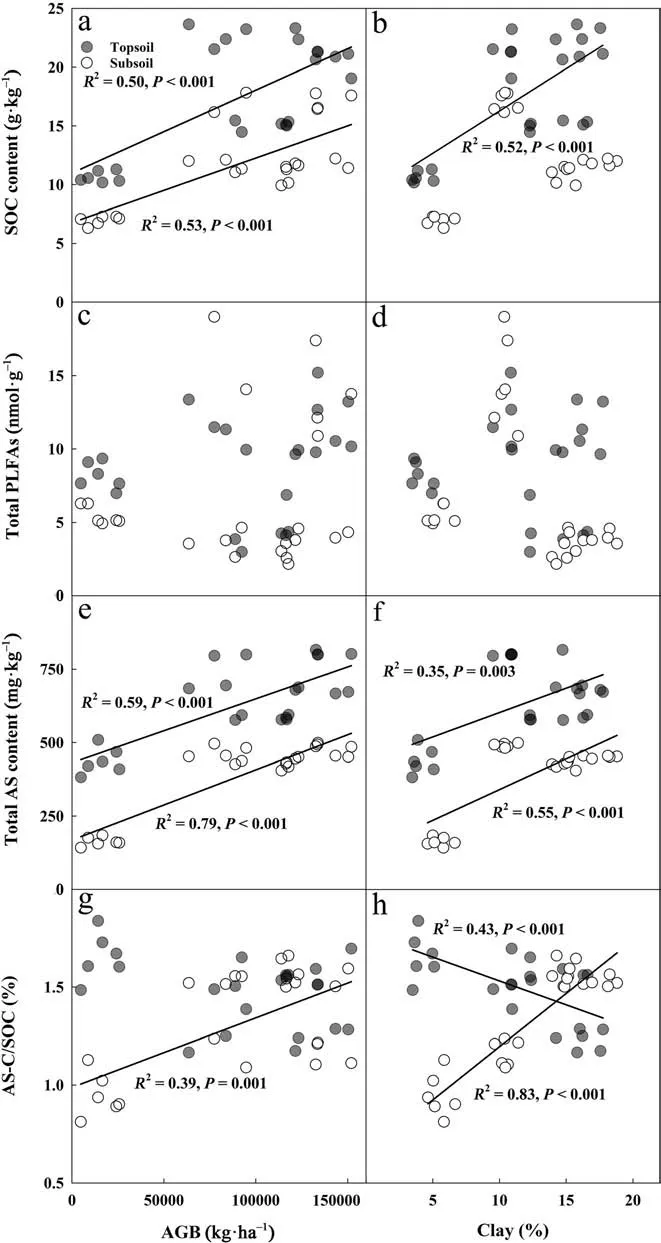
Fig.5 (See legend on next page.)Fig.5 Linear regression of SOC content(Aa –bB),total PLFAs content(Cc –Dd),total AS content(eE– Ff) content and its contribution to SOC(Gg –Hh)against AGB and soil clay content following forest restoration. Symbols(filled circle)and (open circle)correspond to topsoil and subsoil,respectively. Solid lines depict significant linear relationships,while plots without regression lines are not linearly related(P ≥0.05).Abbreviations:AGB,above-ground biomass;AS,amino sugar;AS-C/SOC,the contribution of total microbial residue-C to SOC
The change of the PLFAs following forest restoration differed from SOC (Fig. 2a). The PLFAs reflect the instantaneous state of microorganisms, which decompose quickly after cell death (Zelles 1999; Veum et al. 2019).In this study, we did not find any significant relationship of the PLFAs with either AGB or soil clay content(Fig. 5c and d), probably because of the opposing effects of increasing AGB and soil clay content on PLFAs. With forest restoration, the increasing input of plant residues may stimulate microbial proliferation, while the enhanced soil clay content may restrain microbial activity due to the more robust physical protection of C from microbial attack (Lützow et al. 2006; Yu et al. 2019). For example, the PLFAs were reduced by the higher soil clay content in F49, as compared with those in F14 (Fig. 2a).
Unlike the PLFAs, the AS content in soil represents the accumulation of microbial turnover over time.Despite relatively high soil clay content and low PLFAs in F49, the F49 had higher AS content than the F14(Fig. 3a). In addition, empirical evidence indicates that microbial-derived C generally has relatively low molecular weights, which are readily adsorbed by soil clay, and that a high content of soil clay is conducive to the retention of AS. Consequently, the positive relationships of AS with both AGB and soil clay content following forest restoration were also observed in this study (Fig. 5e and f). However, it is noteworthy that the AGB perks at the F49 and clay content perks at the F70, whereas both SOC and AS continually increased with the highest in UF. Therefore, a high microbial turnover rate might further increase the AS and hence SOC at the UF.
Fungal residues dominate the contribute to SOC following forest restoration
Soil F:B ratios are highly linked to soil C accumulation potential (Malik et al. 2016). Due to the different utilization of substrates, the growth and proliferation of bacteria and fungi are different, and may eventually lead to divergent F:B ratios in PLFAs and fungi/bacteria derived AS following forest restoration. Our study observed no significant change in F:B ratios across the forest restoration gradient (Fig. 2b), while GluN:MurA ratios significantly increased (Fig. 3b). This was contrary to a previous study in southern China showing that the GluN:MurA significantly decreased with forest succession (Shao et al. 2017). The decreasing GluN:MurA in Shao et al. (2017)’s study suggested a dramatic shift from needle-leaf to broad-leaf during forest succession.Higher quality of broad-leaf is more generally favored for bacterial proliferation and the production of its residues over fungi than needle-leaf (Bossuyt et al. 2001;Kramer et al. 2012). In our study, however, the litter quality under different restoration stages varied nonsignificantly. Therefore, no significant differences were found in the F:B of PLFAs following forest restoration.
The accumulation of AS depends on not only the production but also the retention. Although the biomass turnover rate is thought to be slower in fungi than in bacteria, fungal biomass often contains high C content compared to bacteria biomass (Strickland and Rousk 2010). Thus, while the abundances of fungi and bacteria changed similarly following forest restoration, fungi might contribute to more AS production than bacteria.In addition, fungal residues are more decompositionresistant than bacterial counterparts after cell death(Nakas and Klein 1979), thus are likely the preferential retention following forest restoration. Higher fungal abundance has also been related to the higher capacity of C accumulation and lower turnover rate due to enhanced fungal mediated soil aggregation and/or changes in the physiology of the microbial biomass (Six et al.2006; Malik et al. 2016). Thus, a continuously increased fungal residues dominance in the forest restoration process is thought to enhance SOC accumulation and stabilization.
Clay content affected the contributions of microbial residue C to SOC
The AS is the critical and direct pathway of SOC formation (Liang et al. 2017). In this study, we found a slightly decreasing trend of AS-C/SOC at topsoil following forest restoration (Fig. 4a), which is contrary to a previous study by Shao et al. (2017) in southern China, probably due to the different changing patterns in vegetation communities and litter quality between our study sites.Alternatively, we found that change in soil clay content may have played an essential role in regulating AS-C/SOC following forest restoration with different mechanisms between the topsoil and subsoil layer.
The topsoil is a hotspot for microbial activity (Xu et al.2013),as large amounts of plant residues can be assimilated by soil microorganisms (Cotrufo et al. 2015).Therefore, even a small change of microbial activity in topsoil may not only affect the production of AS but also the accumulation of plant residues (Ni et al. 2020). The negative relationship between the AS-C/SOC and soil clay content as observed in the topsoil in this study(Fig. 5 h) probably resulted from the negative effects of increasing soil clay content following forest restoration on the proliferation and the residues production of soil microbes, resulting in more plant residue-derived C retention in the soil. Furthermore, because of the difference in the ecological preferences of fungi versus bacteria in their habitats, the increased C availability due to clay adsorption may have more limited bacterial activities than fungal activities (Fomina and Skorochod 2020). The bacterial residues are more readily decomposed than fungal residues (Nakas and Klein 1979).Therefore the contribution of MurA-C/SOC in topsoil decreased significantly following forest restoration while the GluN-C/SOC remained relatively constant (Fig. 4b and c).
In contrast to the topsoil, we found that AS-C/SOC was positively correlated with soil clay content in subsoil(Fig. 5 h). The PLFAs in subsoil were relatively lower than that in topsoil (Fig. 2a) due to lower SOC content(Fig. 1), and the direct effect of plant residues was weaker than in the topsoil. We speculate that AS in subsoil was not entirely derived from the counterparts of PLFAs after cell death, but also a large part of them may be derived from the input of topsoil AS via leaching.Collectively, higher clay content in subsoil likely favored the retention of topsoil AS when they moved down to subsoil, because the microbial-derived relatively low molecular weight residue-C is readily adsorbed by microaggregates. In addition, higher clay content would inhibit microbial metabolism in subsoil, resulting in a lower turnover rate of AS. The findings reported in our study were supported by a recent review by Ni et al. (2020),who found that AS in topsoil was dominantly determined by its production while in subsoil depended on its retention by soil clay content.
Conclusions
This study stressed the microbially regulated SOC accumulation following forest restoration by using measurements of two biomarkers, PLFAs and AS that represent microbial living biomass and residues, respectively. We found that SOC increased with increasing AGB with time after forest restoration. However, the PLFAs and AS changed differently following the forest restoration.Even though the ratio of fungal PLFAs to bacterial PLFAs showed no change following forest restoration,the ratio of fungal residues to bacterial residues significantly increased. These results suggest that fungal residues may play a more critical role than bacterial residues in SOC accumulation following forest restoration at our study site. In addition, the clay content had a significantly positive effect on the contribution of microbial residue-C to SOC in the 0–10 cm soil layer, but a significantly negative effect in the 10–20 cm soil layer.This result highlights the divergent physical mechanisms in regulating microbial-mediated SOC accumulation at two different soil layers following the forest restoration in subtropical ecosystems. The divergent contribution of microbial residues to soil C accumulation across a forest restoration gradient in our study is essential for improving forest management practices.
Abbreviations
AGB: Above-ground biomass; AMF:Arbuscular mycorrhizal fungi; AS: Amino sugars; AS-C: Microbial residue-C; AS-C/SOC: The contribution of total microbial residue-C to SOC; BD: Bulk density; C: Carbon;F:B: The ratio of fungal PLFAs to bacterial PLFAs; G+: Gram-positive bacteria; G-: Gramnegative bacteria; GalN: Galactosamine; GluN: Glucosamine; GluN-C: Fungal residue-C; GluN-C/SOC: The contribution of fungal residue-C to SOC; GluN;MurA: The ratio of fungal residues to bacterial residues;MurA: Muramic acid;MurA-C: Bacterial residue-C; MurA-C/SOC:The contribution of bacterial residue-C to SOC; PLFAs: Phospholipid fatty acids; SOC: Soil organic carbon;TC: Total carbon
Supplementary Information
The online version contains supplementary material available at https://doi.org/10.1186/s40663-021-00334-8.
Additional file 1.
Acknowledgements
We thank Zhongbing Chang, Yang Chen, Nannan Cao, and Zhiwei Cao for the help with field sampling. We also thank Lingxue Ma, Xiaoying You,Xiaoping Pan, Wei Zhang, and Yi Li for the help with laboratory analysis.
Authors’contributions
QD and JY conceived and designed the study; SZ analyzed the data, drew the figures and wrote the primary draft; SZ and SW did the measurements;YW and JC revised the draft; MY, PX and JC collected the samples; XF and HH discussed the draft with SZ. All authors contributed critically to the drafts and gave final approval for publication.
Funding
This work was financially supported by the National Natural Science Foundation of China for Distinguished Young Scholars (41825020) and General Program (31870461), the “Hundred Talent Program”of South China Botanical Garden at the Chinese Academy of Sciences (Y761031001), the“Young Top-notch Talent” in Pearl River talent plan of Guangdong Province(2019QN01L763), the Guangdong Basic and Applied Basic Research Foundation (2021A1515012147),and the China Scholarships Council(No.202004910605).
Availability of data and materials
The datasets used and/or analyzed during the current study are available from the corresponding author on reasonable request.
Declarations
Ethics approval and consent to participate
Not applicable.
Consent for publication
Not applicable.
Competing interests
The authors declare that they have no competing interests.
Author details
1Key Laboratory of Vegetation Restoration and Management of Degraded Ecosystems, South China Botanical Garden, Chinese Academy of Sciences,510650 Guangzhou,China.2University of Chinese Academy of Sciences,100049 Beijing, China.3Department of Agroecology, Aarhus University, 8830 Tjele, Denmark.4CSIRO Oceans and Atmosphere, PMB 1,Victoria 3195 Aspendale, Australia.5Aarhus University Centre for Circular Bioeconomy,Aarhus University, 8830 Tjele,Denmark.6iCLIMATE Interdisciplinary Centre for Climate Change, Aarhus University, 4000 Roskilde, Denmark.7Faculty of Life Science and Technology, Central South University of Forestry and Technology, 410004 Changsha, China.8Institute of Applied Ecology, Chinese Academy of Sciences, 110016 Shenyang,China.
Received: 5 April 2021 Accepted: 18 July 2021

- Forest Ecosystems的其它文章
- Distribution of Panama’s narrow-range trees:are there hot-spots?
- Simultaneous optimization of even flow and land and timber value in forest planning:a continuous approach
- Mature stand developmental stage has ceased to constitute the most suitable habitat for the capercaillie in the Augustów Forest,Poland
- Forest disturbances and the attribution derived from yearly Landsat time series over 1990–2020 in the Hengduan Mountains Region of Southwest China
- Nutrient resorption strategies of three oak tree species in response to interannual climate variability
- Topography modulates effects of nitrogen deposition on microbial resource limitation in a nitrogen-saturated subtropical forest