
Variation of net primary productivity and its drivers in China’s forests during 2000-2018
2020-07-16 07:19:14YuheJiGuangshengZhouTianxiangLuoYakirDanLiZhouandXiaominLv
Forest Ecosystems 2020年2期
Yuhe Ji,Guangsheng Zhou*,Tianxiang Luo,Yakir Dan,Li Zhou and Xiaomin Lv
Abstract
Keywords: Net primary production (NPP), Forest ecosystem; annual precipitation, NPP model, Fluctuation, Variability
Background
Vegetation net primary productivity (NPP), as a biomass increment, plays an important role in the global carbon cycle. It contributes to understanding the contribution of NPP to the carbon exchanges that take place between the biosphere and atmosphere. Vegetation NPP indicates the atmospheric carbon fixed by plants except for the carbon released by respiration. Global vegetation NPP has increased due to climate change over the last few decades (Nemani et al. 2003; Chen et al. 2019). A significant increase in NPP was observed for grasslands and shrublands after the 1980s across China (Piao et al.2001; Liu et al. 2017; Liang et al. 2015; Xu and Wang 2016; Wang et al. 2017). However, some research has found declines in global NPP over the past decade because of drought (Zhao and Running 2010; Medlyn 2011).
There are various process models for the estimation of vegetation NPP. The Carnegie-Ames-Stanford Approach(CASA) provides a useful tool to estimate NPP by combining grid meteorological data and the satellite-derived fraction of incoming photosynthetically active radiation absorbed by vegetation (Smith et al. 2008). The Carbon Exchange between Vegetation, Soil and Atmosphere(CEVSA) model was used to explore NPP in China’s terrestrial ecosystems,and confirmed a slow increase in NPP over the period 1981-1998 (Tao et al. 2003). The Boreal Ecosystem Productivity Simulator (BEPS) was used to map the spatio-temporal variations of NPP in China for the period from 2000 to 2010 (Chen et al. 2007; Liu et al.2013). The Lund-Potsdam-Jena Dynamic Global Vegetation Model (LPJ-DGVM) was widely applied to predict NPP dynamics by combining terrestrial vegetation dynamics (Smith et al. 2008; Gao et al. 2016).Based on the eddy covariance technique, an eco-physiological process model was developed to calculate NPP directly from gross primary productivity (GPP) by the mean ratio of the NPP/GPP of different vegetation types in a local area (Wang et al.2017).All the process models can be applied in other regions. However, traditional process models have many eco-physiological parameters, and the parameters need to be modified for different research areas. It is difficult to ensure the accuracy of the parameters. Additionally, there are uncertainties in the estimation of NPP because of accumulated errors during the complex process.
Statistics models for vegetation NPP are relatively simple but they can provide a credible output for a specific research area, although they may be difficult to apply to other regions (Adams et al. 2004). The Miami model is a classical statistics-based model that has been used widely for estimating vegetation NPP in different regions (Lieth 1973; Alexandrov and Matsunaga 2008). In China, Zhou and Zhang (1996) established a general statistical model.The model is suitable for predicting NPP for terrestrial vegetation over China, but its accuracy is not very good for estimating forest NPP. Until now, there has not been a specific statistics-based model to predict forest NPP accurately.
Both process models and statistics models need to identify the dominant factors affecting NPP, since different dominant factors might lead to different simulation results. For example, Zhao and Running (2010) reported that global NPP had declined over the past decade, but their findings were based on outcomes from models which assumed a strong temperature dependence (Medlyn 2011).Despite recognition of the roles of temperature and precipitation in controlling NPP dynamics, there are differing opinions over their relative influence(Nemani et al.2003;Zhang et al.2017).Some observations have revealed that NPP was strongly correlated with annual precipitation at a continental scale, but interannual variability in ANPP (above-ground NPP) was not related to variability in precipitation (Knapp and Smith 2001). This conclusion is controversial, since it was reported that the interannual variation in NPP could be explained by changes in precipitation in arid and semi-arid regions,and by changes in air temperature in other regions of China (Chen et al. 2013;Liang et al. 2015; Xu and Wang 2016). In addition,vegetation structure (e.g., canopy cover and leaf area index) can change due to natural growth, climate change and human disturbance(Chen et al.2019).NPP dynamics are likely to be affected by changes in vegetation structure,but most studies ignore the effect of vegetation structure dynamics on NPP fluctuations. The effect of environment variables in NPP dynamics will most likely vary in different regions.
This paper established a statistics-based multiple regression model to estimate forest NPP across China.The objectives were to (1) explore the long-term trends and annual fluctuations of forest NPP for different forest types at a national scale during the period 2000-2018;and (2) identify the key environmental factors controlling the variability of forest NPP. This study helps to understand the variability of forest NPP, as well as the interactions between forest productivity and environmental factors.
Materials and methods
Building the statistics model
The paper assumed that the spatiotemporal patterns of forest NPP were controlled mainly by climatic, topographic and forest structure variables, although previous research has shown different relative dominance between factors affecting NPP. To establish the statistics multivariate regression model, we collected long-term observations of annual forest NPP, normalized difference vegetation index (NDVI, which was used to quantify vegetation structure), altitude, average precipitation and temperature between 1980 and 2010 at 1000 forest inventory sites (Fig.1).
Local topography significantly affects the spatial variation of climatic variables, and each elevation increase of 100 m in China leads to an average reduction of 25 gC·m-2for annual NPP (Chen et al. 2007). The topographic effect on NPP can be described by altitude, so altitude from a digital elevation model (DEM) was selected as an important variable in establishing the statistics-based multivariate regression model. The NDVI was extracted from the annual maximum NDVI of a 16-day cycle, 2000-2010 (https://lpdaac.usgs.gov).
Forest NPP was calculated using the traditional Volume Growth Rate Model from the data of forest inventories, 1980-2010 (Eq.1) (Luo 1996).
where Ps, Pb, Pl and Pr are the annual net biomass of stem, branch, leaf and root in the tree layer, respectively.Pu is the annual net biomass of shrubs and herbs under the forest canopy.
Quality control of forest NPP had been done. Firstly,forest NPP for each observation site was the average value of continuous forest inventory since 1980, and the average value reduced data uncertainty. Secondly, forest NPP for each observation site was checked by comparing with the values of the surrounding area and the values of the same forest types. Thirdly, forest NPP was checked by comparing with the results of some forest productivity models (Luo 1996; Luo et al. 2004).
Based on the relationship between forest NPP and environmental variables (annual maximum NDVI, annual precipitation, annual temperature, and altitude) at 1000 forest inventory sites, a statistics-based multiple regression model was established (Table 1), with a multiple regression R=0.72, and a standard error of 4.34 (Eq.2),
where NPP is forest NPP (gC·m-2·year-1), NDVI is normalized difference vegetation index (0 <NDVI ≤1), P is annual precipitation (mm), T is annual temperature (°C),and A is altitude (m).
Simulation of annual forest NPP over China
The statistics-based multiple regression model allowed us to simulate annual forest NPP over China. The data included climatic variables (annual temperature and annual precipitation), altitude and NDVI. Annual temperature and annual precipitation were obtained from 800 meteorological stations of the National Meteorological Information Center of the China Meteorological Administration (http://cdc.cma.gov.cn). Altitude was derived from a 90-m resolution DEM dataset(http://srtm.csi.cgiar.org/srtmdata/). NDVI with a 1-km spatial resolution was obtained from Land ProcessesDistributed Active Archive Center (https://lpdaac.usgs.gov). To reduce the residual noise caused by haze and clouds, the annual maximum NDVI was extracted from a series of 16-day compositions of NDVI in the growing season. All the input variables were interpolated or resampled into raster layers with a spatial resolution of 1 km×1 km grid cells using the Kriging method with ArcGIS10.2 (http://www.esri.com/software/arcgis).
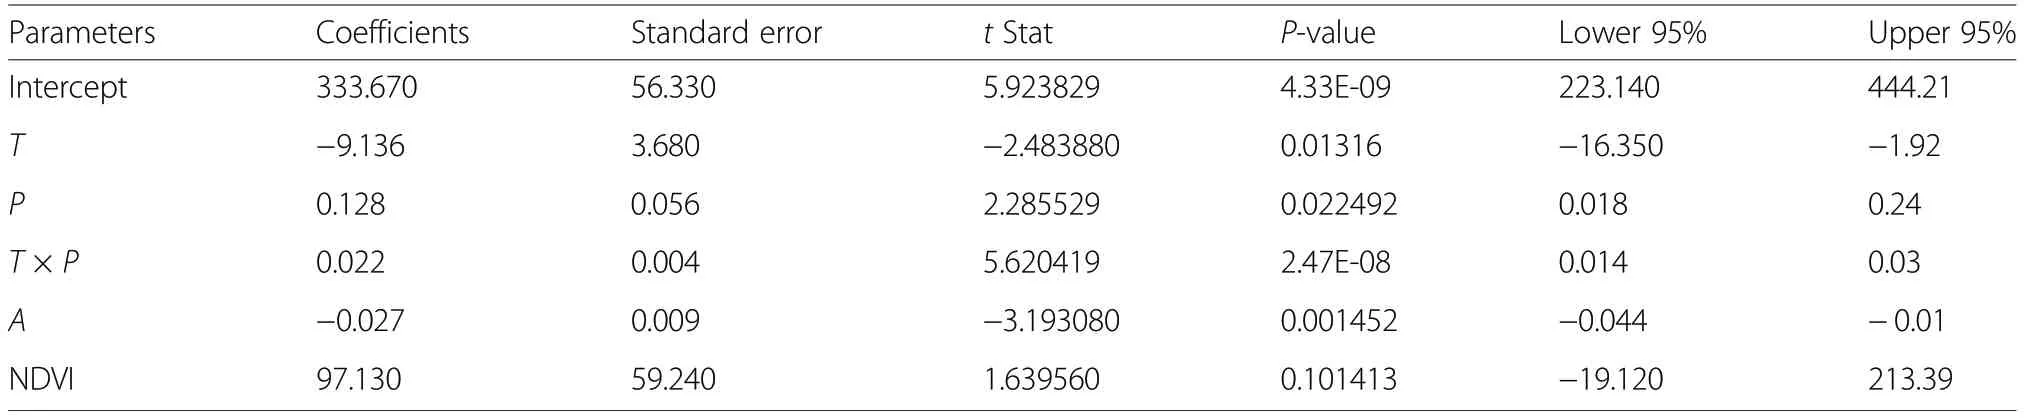
Table 1 The parameters of the statistics-based multiple regression model between forest net primary productivity(NPP) and environmental variables (T is annual temperature (°C), P is annual precipitation (mm),A is altitude (m),NDVI is normalized difference vegetation index (0 <NDVI ≤1))
The distribution of annual forest NPP was obtained from overlay analysis between the Vegetation Map of the People’s Republic of China in 2008 and the simulated annual forest NPP. Prior to overlay analysis, all the forest types were merged into five dominant forest types,including evergreen broadleaf forest, evergreen needleleaf forest, broadleaf-needleleaf mixed forest, deciduous broadleaf forest, deciduous needleleaf forest.
Accuracy assessment
The observed forest NPP at 90 observation sites from forest inventories were used to check the accuracy of the multiple regression model. The check sites were selected following the principle of representativeness. The 90 check sites covered the typical forest types in China, and their spatial distribution could not be concentrated in one area.
Comparison between the predicted NPP and the observed NPP provided a fitting coefficient of R2=0.536(P <0.01) (Fig.2). The results indicated that the multiple regression model had a good performance in predicting forest NPP with acceptable accuracy. Therefore, the model was capable of providing a reliable estimate of China’s forest NPP.
Results
Trend and fluctuation of forest NPP
The results revealed an average forest NPP of 840 gC·m-2·year-1for all forest types in China. Evergreen forests had the highest NPP (1058 gC·m-2·year-1for the evergreen broadleaf forest, 934 gC·m-2·year-1for the evergreen needleleaf forest), because evergreen forest maintains continuous photosynthesis throughout the year. Deciduous forests had lower NPP values (759 gC·m-2·year-1for the deciduous broadleaf forest, 590 gC·m-2·year-1for the deciduous needleleaf forest) since deciduous forests have a narrower photosynthesis period.
Variations (long-term trend and interannual fluctuation) of forest NPP in China were examined. Results revealed an overall increasing trend in forest NPP, with an average increase rate of 5.2 gC·m-2·year-1over China between 2000 and 2018. All the five major forest ecosystems showed significant increasing forest NPP, with an increase rate of 2.9-8.0 gC·m-2·year-1. The largest increase rate was found in evergreen broadleaf forest (8.0 gC·m-2·year-1), followed by evergreen needleleaf forest(6.5 gC·m-2·year-1), broadleaf-needleleaf mixed forest(6.3 gC·m-2·year-1), deciduous broadleaf forest (5.4 gC·m-2·year-1) and deciduous needleleaf forest (2.9 gC·m-2·year-1) (Fig.3).
Interannual fluctuation in forest NPP displayed a fluctuation range of 50-269 gC·m-2·year-1among the five major forest ecosystems. NPP in the evergreen broadleaf forest had the highest fluctuation range(269 gC·m-2·year-1), followed by the evergreen needleleaf forest (202 gC·m-2·year-1). NPP in the deciduous needleleaf forest had the lowest fluctuation range(50 gC·m-2·year-1).
The fluctuation rate (ratio of fluctuation range to average value) was calculated to reflect the degree of fluctuation. The results showed that the evergreen broadleaf forest had the largest fluctuation rate (25%), followed by the evergreen needleleaf forest (22%) and the broadleafneedleleaf mixed forest (20%). The deciduous needleleaf forest had the smallest fluctuation rate (8%) (Fig.3 and Table 2). The results indicated that, among the major forest ecosystems in China, the most unstable forest NPP occurred in the evergreen broadleaf forest, and the most stable forest NPP occurred in the deciduous needleleaf forest.
Comparing forest NPP with its fluctuation, our results revealed an interesting phenomenon: the greater the forest NPP, the greater the fluctuation of forest NPP for the five major forest ecosystems in China.For example, evergreen broadleaf forest had the largest NPP at 1058 gC·m-2·year-1, with the largest fluctuation range, 269 gC·m-2·year-1, as well as the largest fluctuation rate (25%) among the five major forest ecosystems. Deciduous needleleaf forest had the smallest NPP at 590 gC·m-2·year-1, with the smallest fluctuation amplitude, 50 gC·m-2·year-1, as well as the smallest fluctuation rate (8%) (Fig.3 and Table 2). It is likely that this phenomenon is related to the fluctuation of dominant factors affecting NPP, but it needs further confirmation.
Spatial distribution of forest NPP trends
Figure 4 shows the rate of change of forest NPP during the period 2000-2018 at 1 km×1 km spatial resolution.China’s forest NPP exhibited an increasing rate of 0-161 gC·m-2·year-1, which was statistically significant over 90% of forest area during the period 2000-2018. Forest NPP over China did not exhibit a consistent increasing trend everywhere. Approximately 10% of forest area in some regions of southwest and northern China showed a slight decreasing trend in forest NPP, with a range 0-20 gC·m-2·year-1(Fig.4). Generally, there was an overall increasing trend in forest NPP, despite a slightly decreasing trend in some forest areas in China.
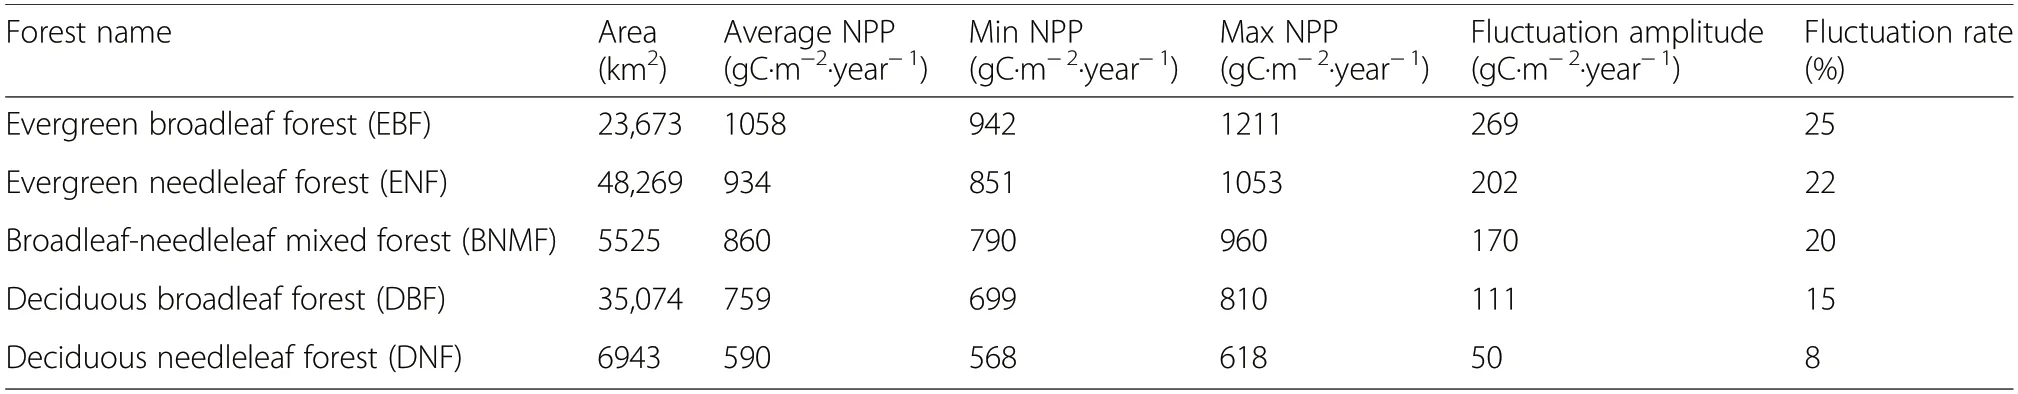
Table 2 The average annual net primary productivity(NPP) and its interannual fluctuation for five main forest types over China during the period 2000-2018
Key drivers of the variation in forest NPP
To identify the key drivers leading to the variation in forest NPP, the fluctuation values (deviation from the mean) of NPP and the environment variables were extracted. Correlation analysis showed a significant correlation between NPP and precipitation fluctuations, with a Pearson coefficient 0.977 (P <0.01), Kendall tau-b coefficient 0.908 (P <0.01), Spearman’s rho coefficient 0.973 (P <0.01). A moderate correlation was found between NPP and temperature fluctuations, with Pearson coefficient 0.484 (P <0.01) (Table 3). The results indicated that the variation in forest NPP was much more sensitive to annual precipitation fluctuation and annual precipitation fluctuation played a pivotal role incontrolling forest NPP changes compared with other environment variables.
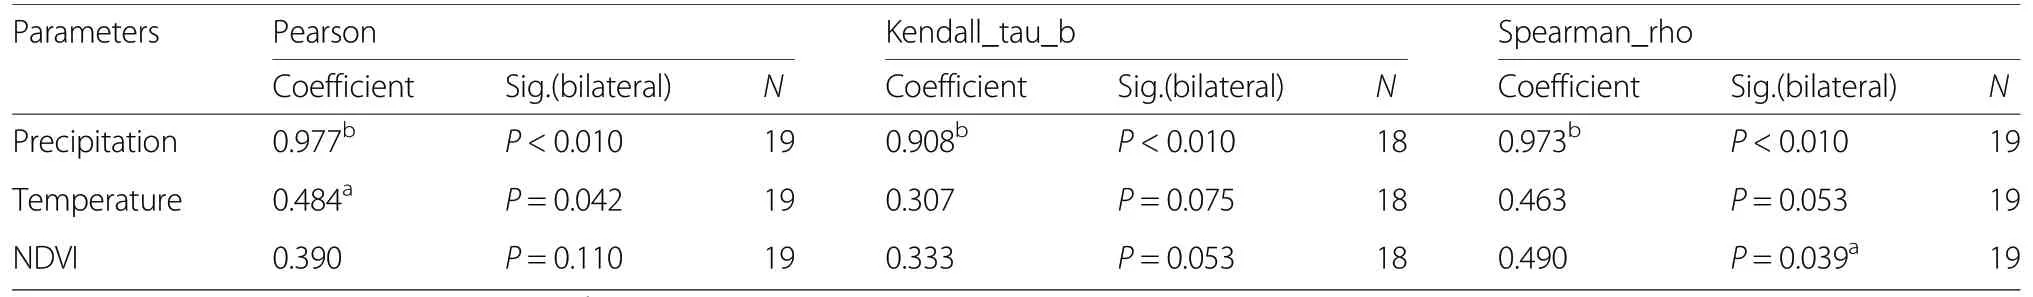
Table 3 The correlations between fluctuations(deviation from the mean)of net primary productivity(NPP)and the driving factors(annual precipitation, annual temperature and normalised difference vegetation index(NDVI))
Comparing the interannual change curves of forest NPP,annual precipitation,annual temperature,and annual maximum NDVI,more similar curves were discovered between NPP and annual precipitation. The results provide another credible proof that forest NPP fluctuation was sensitive to changes in precipitation. In contrast, temperature and NDVI made a smaller contribution to forest NPP(Fig.5).
We also examined the spatial patterns of the changes of forest NPP, precipitation and temperature. It was discovered that the increase in forest NPP was accompanied by an increase in precipitation and temperature for most forest areas in China. The decrease in forest NPP was accompanied by a decrease in precipitation for a few forest areas in southwest China (Figs. 4, 6 and 7).
In brief,precipitation fluctuation was a key factor leading to variations in forest NPP,and temperature was a secondary factor, judging by the correlation coefficients, the change curves and the spatial patterns of change trends.
Discussions
There are different estimates of China’s forest NPP, ranging from 420.1-843 gC·m-2·year-1according to previous studies (Table 4). It was difficult to judge whether one was more credible than the others because of the use of different methods. However, all (previous and our) studies conclude that forest NPP has shown an obvious increasing trend over China in recent decades(Wang et al. 2008; Mao et al. 2010; Yu et al. 2014). The increase in forest NPP is consistent with other findings that the terrestrial vegetation NPP of the northern hemisphere has increased over the past several decades(Nemani et al. 2003). Our results presented an average increase rate of 5.2 gC·m-2·year-1for China’s forest NPP in the period 2000-2018, despite different increase rates for the five major forest ecosystems in China (Fig.3).
Previous studies have ignored the impact of forest structure on NPP, even though forest spatial structure might affect forest NPP (Fotis et al. 2018). The general statistical model of Zhou and Zhang (1996) as a typical climate productivity model also ignored the impact of forest structure, and forest NPP from the model of Zhou and Zhang was usually lower than the observed forest NPP. Our model selected vegetation structure (quantified by NDVI) as an important factor, since spatiotemporal change in forest structure was directly related to forest NPP dynamics. Our results confirmed that forest structure had significant effect on forest NPP dynamics (with Spearman’s rho coefficient 0.490, P <0.05).Therefore, vegetation structure as an input variable in our model improved the accuracy of simulation.
There are a series of factors that may affect NPP, but they do not all have a strong influence on NPP dynamics. The dynamics of the dominant factors affecting NPP are the real causes of changes to NPP. Therefore, we extracted the fluctuation values (deviation from the mean)of NPP and environment variables prior to analysing their relationship. The relationship between these fluctuation values provided more reliable information on the factors controlling NPP dynamics.
Our results revealed that changes in precipitation played a key role in the variation in forest NPP over China, and temperature fluctuation was a secondary factor affecting forest NPP variation. The results disagreed with previous results that air temperature was the dominant climatic factor that controlled the interannual variability in NPP throughout China, except for arid and semi-arid regions (Liang et al. 2015). The disagreement might result from different analysis methods. The results of Liang et al. (2015) came from a simple correlation analysis between annual NPP and climate conditions(i.e., mean annual air temperature and annual cumulative precipitation) from 1982 to 2010. Our results came from the correlation analysis between the fluctuation values of annual forest NPP and environmental factors(annual precipitation, annual temperature, and annual maximal NDVI) from 2000 to 2018. Furthermore, our results from the correlation analysis were confirmed by the fluctuation curves and the spatial trends of forest NPP and environmental factors.
However, there were some uncertainties in the simulation results of our model.Our model paid more attention to natural factors, but ignored human factors. In fact,vegetation NPP in China benefited from the ecological conservation and restoration efforts, since a series of ecological protection policies had been implemented, such as Three-North Shelter Forest Program, Grain for Green Program,and Natural Forest Protection Program(Lv et al.2015;Zhu and Zheng 2019).Although our model selected vegetation structure(quantified by NDVI)as an important factor,and vegetation structure could reflect the impact of human beings on vegetation NPP to some extent, it was not enough to reflect the overall human impact.
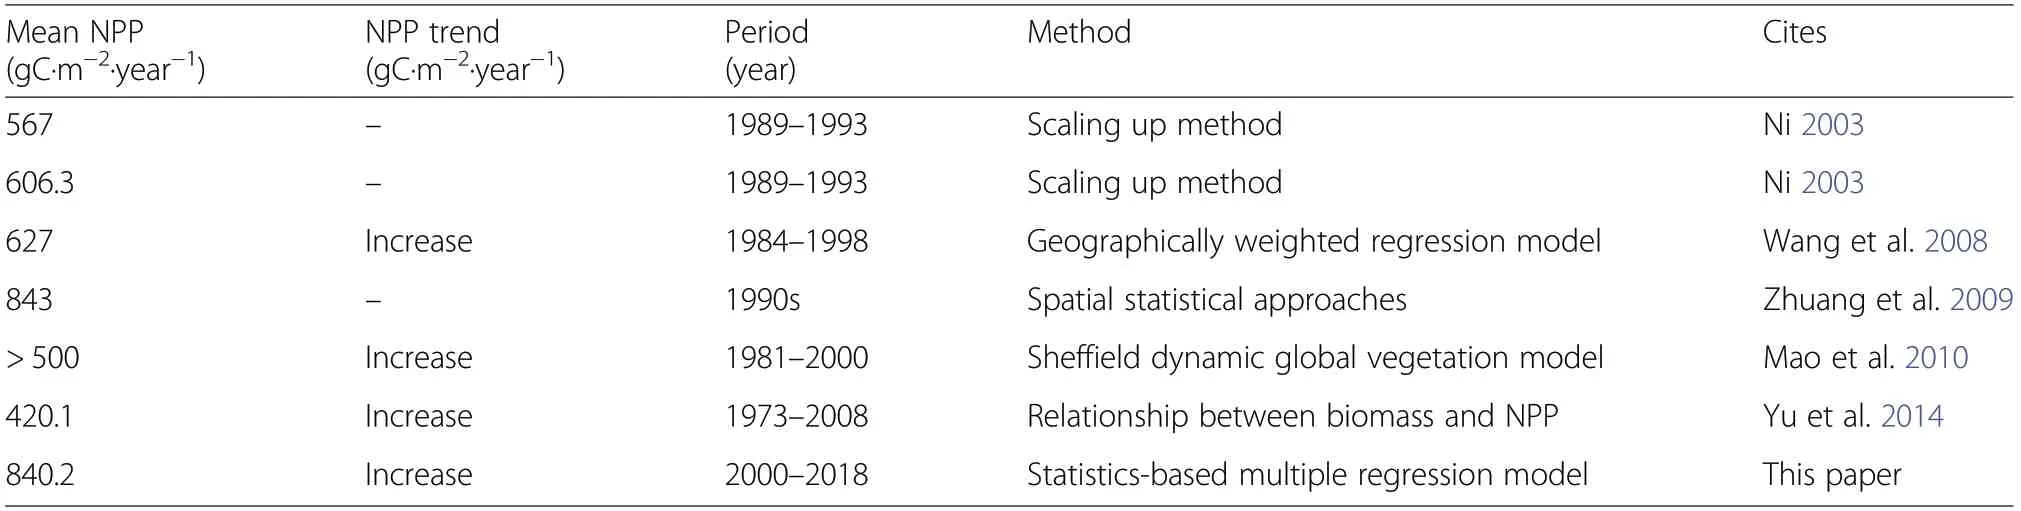
Table 4 Forest net primary productivity(NPP) and its trends in China in recent decades according to previous studies
Conclusions
This paper established a statistics-based multiple regression model to estimate annual forest NPP across China.The model had a good performance in providing a reliable estimation in forest NPP. The trends and the fluctuations of forest NPP in the period 2000-2018 were examined.The results revealed a significant increasing forest NPP for all the five major forest ecosystems, with an average increase rate of 5.2 gC·m-2·year-1over China.There was an increasing NPP trend rate of 0-161 gC·m-2·year-1over 90% of the forest area. The interannual fluctuation range of forest NPP was 50-269 gC·m-2·year-1. The evergreen broadleaf forest had the largest fluctuation(269 gC·m-2·year-1), followed by the evergreen needleleaf forest, the broadleaf-needleleaf mixed forest,the deciduous broadleaf forest and the deciduous needleleaf forest. Our results revealed that the variability in forest NPP was caused mainly by variations in precipitation, then by temperature fluctuations. Therefore, precipitation played a key role in the variation in forest NPP.
Abbreviations
NPP: Net primary productivity; ANPP: Above-ground net primary productivity;GPP: Gross primary productivity; CASA: Carnegie-Ames-Stanford Approach;CEVSA: Vegetation, Soil and Atmosphere model; BEPS: Boreal Ecosystem Productivity Simulator; LPJ-DGVM: Lund-Potsdam-Jena Dynamic Global Vegetation Model; DEM: Digital elevation model; NDVI: Normalized difference vegetation index
Acknowledgments
We gratefully acknowledge Leonie Seabrook, PhD,from Liwen Bianji, Edanz Group China(www.liwenbianji.cn/ac),for editing the English text of a draft of this manuscript.
Authors’contributions
Guangsheng Zhou& Yuhe Ji conceived and designed the study. Yuhe Ji wrote the paper. Tianxiang Luo, Li Zhou and Xiaomin Lv revised and perfected the design of the experiments. Yakir Dan reviewed and edited the manuscript. All authors read and approved the manuscript.
Funding
This study was supported by the National Natural Science Fundation of China (No.41571175, 31661143028) and the special funds for basic research and operation from the Chinese Academy of Meteorological Science(2017Y003).
Availability of data and materials
The datasets used and/or analysed during the current study are available from the corresponding author on reasonable request.
Ethics approval and consent to participate
The subject has no ethic risk.
Consent for publication
All the data and relevant processing methods, including the automated generation of figures of evaluation results,belong to the host institution,namely, Chinese Academy of Meteorological Science.
Competing interests
The authors declare that they have no competing interests.
Author details
1State Key Laboratory of Severe Weather (LASW),Chinese Academy of Meteorological Science, Beijing 100081,China.2Key Laboratory of Alpine Ecology and Biodiversity, Institute of Tibetan Plateau Research, Chinese Academy of Sciences, Beijing 100101, China.3Earth& Planetary Sciences,Weizmann Institute of Science, 76100 Rehovot, Israel.
Received: 21 September 2019 Accepted: 10 March 2020
- Forest Ecosystems的其它文章
- Editorial Board
- Extending harmonized national forest inventory herb layer vegetation cover observations to derive comprehensive biomass estimates
- Combining spatial and economic criteria in tree-level harvest planning
- Environmental rehabilitation of damaged land
- Comparison of estimators of variance for forest inventories with systematic samplingresults from artificial populations
- Gap models across micro-to mega-scales of time and space:examples of Tansley’s ecosystem concept