
Thickness estimation of the Longbasaba Glacier:methods and application
2020-03-29 08:06:52GuangLiHeJunFengWeiXinWang
GuangLi He,JunFeng Wei*,Xin Wang,2
1. School of Resource Environment and Safety Engineering, Hunan University of Science and Technology, Xiangtan,Hunan 411100,China
2. State Key Laboratory of Cryospheric Science, Northwest Institute of Ecology and Environmental Resources, Chinese Academy of Sciences,Lanzhou,Gansu 730000,China
ABSTRACT A total of 71,177 glaciers exist on the Qinghai-Tibet Plateau,according to the Randolph Glacier Inventory (RGI 6.0).De‐spite their large number,glacier ice thickness data are relatively scarce.This study utilizes digital elevation model data and ground-penetrating radar thickness measurements to estimate the distribution and variation of ice thickness of the Longba‐saba Glacier using Glacier bed Topography (GlabTop), a full-width expansion model, and the Huss and Farinotti (HF)model. Results show that the average absolute deviations of GlabTop, the full-width expansion model, and the HF model are 9.8, 15.5, and 10.9 m, respectively, indicating that GlabTop performs the best in simulating glacier thickness distribu‐tion.During 1980?2015,the Longbasaba Glacier thinned by an average of 7.9±1.3 m or 0.23±0.04 m/a,and its ice volume shrunk by 0.28±0.04 km3 with an average reduction rate of 0.0081±0.0001 km3/a.In the investigation period,the area and volume of Longbasaba Lake expanded at rates of 0.12±0.01 km2/a and 0.0132±0.0018 km3/a,respectively.This proglacial lake could potentially extend up to 5,000 m from the lake dam.
Keywords: Longbasaba Glacier; ice thickness distribution; ice volume change; glacial lake retention role; glacial lake expansion
1 Introduction
In the context of global warming, glaciers around the world have generally continued to melt over re‐cent decades (Lemkeet al., 2007). Such morphologi‐cal change, which is characterized by reduced glacier area and thickness (Beameret al., 2017; Mayeret al.,2018; Van Tielet al., 2020), has important implica‐tions regarding local/regional water resources(Immer‐zeelet al.,2010;Immerzeel and Bierkens,2012;Port‐neret al., 2019). Data on glacier thickness distribu‐tion and change are useful in various respects: (i) as basic parameters of glaciological research and applica‐tion, (ii) as essential input parameters for establishing glacier hydrological models, dynamic models, and di‐saster simulation models (Huggelet al., 2003), and(iii) as important indices for both evaluating the influ‐ence of glacier change on surface runoff and formulat‐ing disaster prevention/mitigation measures (Zhanget al., 2012). Owing to limited access and economic costs associated with field-based glacier investigation,it is difficult to directly measure the distribution of glacier thickness and estimate the total glacier volume at the regional scale. Comprehensive, accurate data of glacier ice thickness and ice volume are extremely rare. For glaciers that are difficult to access for direct measurement or that have a large spatial scale, one reasonably effective approach is to estimate glacier thickness distribution based on glacier development characteristics and topographic factors for determin‐ing glacier volume. Many researchers have developed various ice thickness estimation methods based on surface characteristics (Farinottiet al., 2017) that can be used to evaluate glacier ice thickness distribution and ice storage indirectly.
Among the many existing methods for estimating glacier ice thickness distribution,the empirical formu‐la method is the simplest and most practicable, and it has been used widely in recent years (Bahret al.,2015). According to measured data of typical glacier thickness, the empirical formula method uses statisti‐cal methods to obtain a relationship for evaluating the ice thickness distribution and ice volume based on easily obtained glacier parameters such as area and length. This approach primarily explores the relation‐ship between the area and volume of a glacier (Chen and Ohmura, 1990; Bahret al., 1997) and also in‐cludes other characteristics such as glacier length or surface slope (Lüthi, 2009; Radi? and Hock, 2011;Grinsted, 2013). However, the empirical formula method can be used to estimate only the mean thick‐ness and total volume of a glacier.The method adopt‐ed for the estimation of ice thickness distribution usu‐ally depends on various theoretical considerations.Some studies have highlighted that, for an ideal gla‐cier with infinite width, ice thickness can be assessed from the surface slope (Nye, 1952). Subsequently,Nye (1965)extended the scope of consideration to the ideal shape of a valley glacier,and Liet al.(2012)fur‐ther considered the influence of glacier edge side re‐sistance. Haeberli and Heozle (1995) were the first to suggest that glacier thickness could be estimated from the range of glacier elevations. Subsequently, a series of glacier thickness studies were conducted by glacier bed topography (referred to as the GlabTop model, or simply GalbTop hereafter), a modified version named GlabTop2, and the latest version called Glab‐Top2_IITB (Linsbaueret al., 2012; Freyet al., 2014;Pandit and Ramsankaran, 2020). The GlabTop is a model that evaluates the spatial distribution of ice thickness by estimating glacier depth at several points on the so-called glacier branch line. The GlabTop2 model randomly selects digital elevation model (DEM)units in the glaciated area. The GlabTop2_IITB is an independent implementation of the GlabTop2 model and is fully automated.
Budd and Allison (1975) and Rasmussen (1988)applied the methods of mass conservation and ice flow dynamics, which were further developed for ice thickness analyses (Fastooket al., 1995; Farinottiet al.,2009a).Huss and Farinotti(2012)continued to ex‐tend the ice flow dynamics method and were the first to successively present a comprehensive ice thickness distribution of a single glacier.Alternative approaches based on rigorous inverse models often focus on infer‐ring basal slipperiness based on bedrock topography(Gudmundssonet al., 2001; Thorsteinssonet al.,2003; Pralong and Gudmundsson, 2011; Mosbeuxet al., 2016). In recent years, the development of meth‐ods for estimating glacier ice thickness distribution based on surface characteristics has increased rapidly.Some techniques need additional parameters,e.g.,sur‐face velocity and mass balance (Morlighemet al.,2011; McNabbet al., 2012; Clarkeet al., 2013; Fari‐nottiet al.,2013;Gantayatet al.,2014;Huss and Fari‐notti, 2014; Brinkerhoffet al., 2016). Other methods adopt an iterative approach using complex forward models of ice flow (Michelet al., 2013; Van Peltet al., 2013; Michelet al., 2014) or a nonphysical algo‐rithm based on neural network methods (Clarkeet al.,2009; Haqet al., 2014). Some models have also achieved good results in the estimation of ice thick‐ness.For instance,the Brinkerhoff-v2 model(Brinker‐hoffet al., 2016), widely considered the best, can achieve an estimate of glacier thickness with an aver‐age deviation of 3%±27% (Farinottiet al., 2017).Among the various automated methods that can deal with a large number of glaciers, the Huss model is the best, with an average deviation of -14%±35% (Huss and Farinotti,2012;Farinottiet al.,2017).
The input data for an ice thickness distribution model include at least some information on the gla‐cier or ice cap profile and an ice surface DEM. Such models require additional information according to specific conditions, including the surface mass bal‐ance(SMB),ice thickness change rate(?h/?t),and sur‐face velocity. The contours and DEM of a glacier can be acquired from satellite images at a given time. In contrast, the SMB, ?h/?t, and surface velocity of the glacier usually refer to the multiyear averages of an epoch,which should be as close as possible to the cor‐responding DEM to ensure temporal consistency be‐tween datasets. It is difficult to estimate the internal surface velocity,however.
Despite a large number of methods available for the assessment of glacier ice thickness, there has been no analysis of the applicability of any of these methods to a glacier on the Qinghai-Tibet Plateau.The remote location and harsh environment of the Qinghai-Tibet Plateau make it difficult to obtain gla‐cier thickness and ice volume data directly. Currently,glacier ice volume data are relatively scarce, despite a large number of glaciers on the Qinghai-Tibet Plateau.The Longbasaba Glacier, in direct contact with an gla‐cial lake, has a huge scale and many branches.There‐fore, the various ice flow directions and the shear stress on the branch lines are not the same as those on the main flowline,and it is inappropriate to directly es‐timate ice thickness utilizing the glacier height differ‐ence.Hence,this study estimated the ice thickness dis‐tribution of the Longbasaba Glacier using the Glab‐Top model, the full-width expansion model, and the HF-model.The model results were compared with the thickness measurements obtained simultaneously from ground-penetrating radar (GPR) and differential glob‐al positioning system (GPS) to validate their applica‐bility. Finally, the thickness distribution of the Long‐basaba Glacier in 1980,2000,2010,and 2015 estimat‐ed using the most suitable model was presented and used to investigate the variation of ice volume and the volume of the glacial lake.
2 Study site
The Longbasaba Glacier (27°56.67′N, 88°04.21′E)is within the Pengqu River Basin on the northern slope of the Himalayas.The Longbasaba Glacier,with a length of 9 km and an area of approximately 31 km2in 2018(Liuet al.,2020),has experienced rap‐id retreat since the 1970s (Wanget al., 2008; Yaoet al., 2012). Ice serac, supraglacial lakes, and ice cre‐vasses are well-developed features on the glacier sur‐face (Figure 1). The lower part of the ice cliff at the end of the glacier is recessed into the glacier. During the field investigation,the collapse of the ice cliff was observed frequently. Thus, it can be inferred that the thermal karst process plays an essential role in the ero‐sion at the end of the glacier.The glacier terminal mo‐raine lake (Longbasaba Lake) lies at the elevation of 5,500 m and has a length (N ?S) of 2,210 m and a width (E?W) of 685 m. This strip-shaped lake is the source of the second tributary of the Pengqu River Ba‐sin.The water supplied to the Longbasaba Lake is de‐rived mainly from glacier meltwater. In summer,many ice bodies with different sizes break away from the mother glacier and float on the lake.According to a field survey conducted using an echo sounder with a GPS receiver in 2009(Yaoet al.,2012),the water lev‐el of Longbasaba Lake is 5,499 m a.s.l..The lake's av‐erage depth and maximum depth are 48 and 102 m,re‐spectively, and its volume is 0.064 km3. The surface moraine of the glacial lake dam is composed mainly of medium?coarse granite.An artificial outlet was ex‐cavated at the southwest corner of the dam to drain the lake,forming many small ponds at the depressions in front of the moraine ridge. Based on soil tempera‐ture, water, and heat flux data observed at different depths of the dam during 2012?2016, it has been es‐tablished that the permafrost layer of the dam is dete‐riorating, compromising its stability (Wanget al.,2018). Consequently, Longbasaba Lake is considered a high-risk moraine lake, and the probability of col‐lapse is classified as"very high"(Wanget al.,2008).
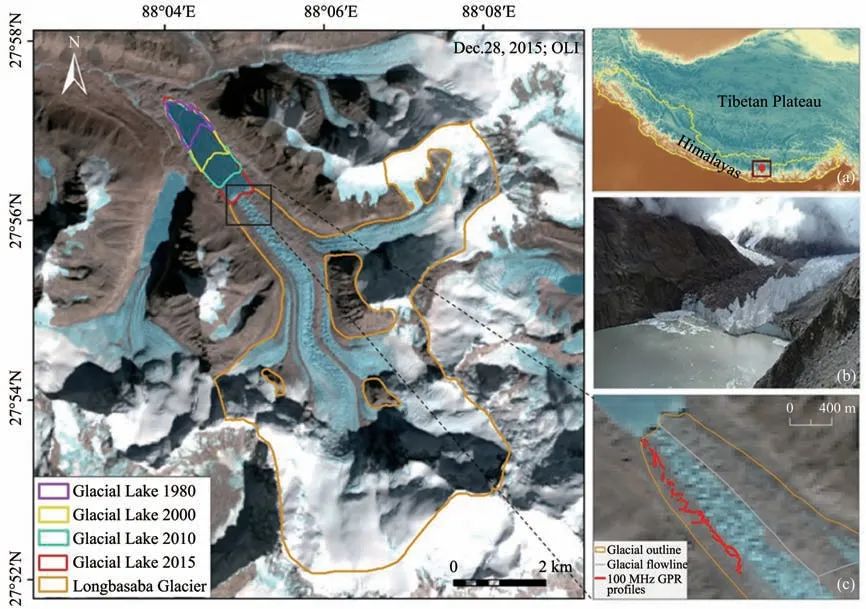
Figure 1 Location and characteristics of the study area:(a)glacier location;(b)contact of the end of the Longbasaba Glacier with the glacial lake,ice floes show a small amount of newly collapse;(c)profiles of GPR survey conducted on the Longbasaba Glacier in July 2009 with Landsat 5 image from December 30,2010,as the background
3 Data and methods
3.1 Data
In this study, a topographic map and three Land‐sat images were used to extract boundary informa‐tion of the Longbasaba Glacier in different periods.In addition, terrain related parameters such as sur‐face slope (needed for ice thickness and ice volume estimation)were extracted for the corresponding pe‐riods from DEM data,e.g., the topographic map and the satellite-derived Shuttle Radar Topography Mission (SRTM), the Advanced Land Observing Satellite (ALOS), and the TerraSAR-X add-on for digital elevation measurements (TanDEM-X) data(Table 1).
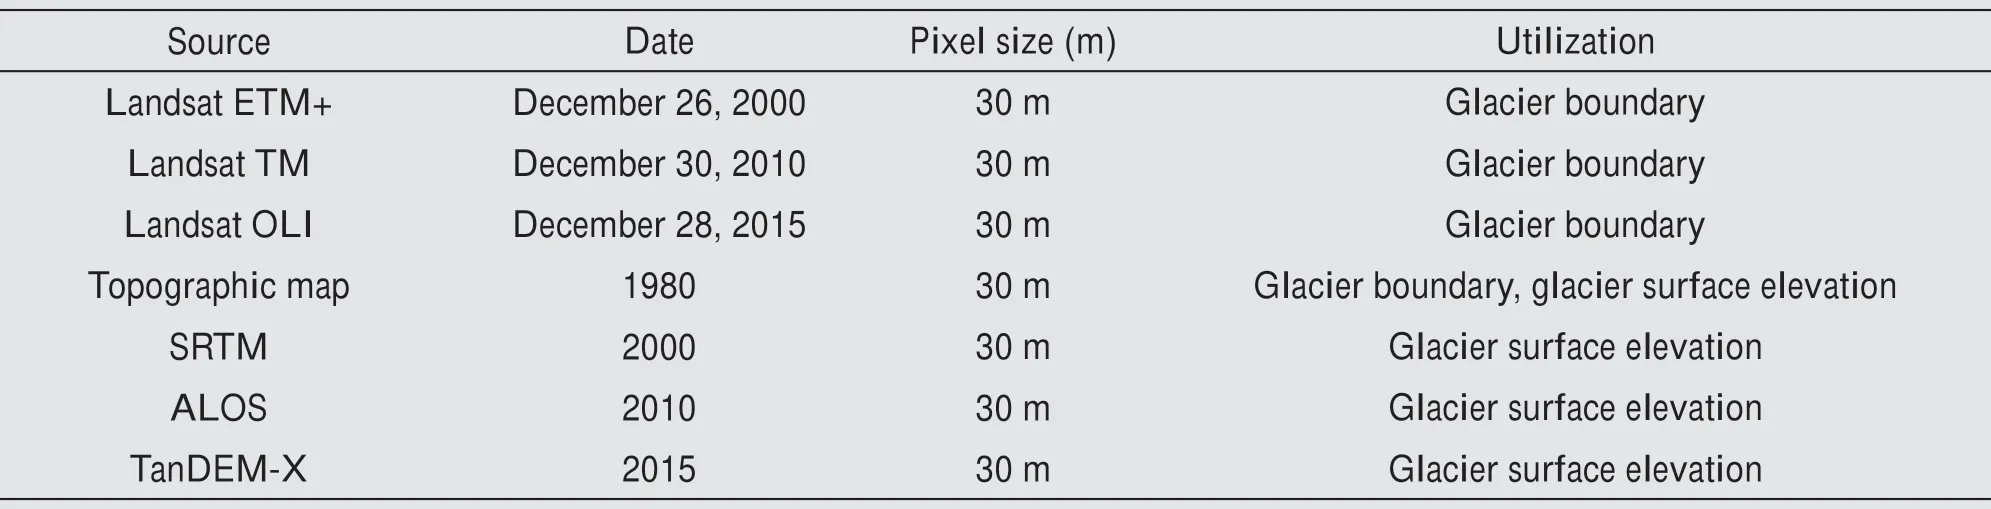
Table 1 Overview of the satellite imagery and data sources used in the study
The Landsat images were obtained from the glob‐al remote sensing image database (https://earthexplor‐er.usgs.gov/) of the United States Geological Survey(USGS). Such images, which have 30-m spatial reso‐lution and plane positioning error better than one pix‐el (Bolchet al., 2010; Guoet al., 2013), are used widely to extract glacier area and related attributes(Guoet al.,2015).In this study,based on a topograph‐ic map from 1980 and Landsat images obtained in 2000, 2010, and 2015, the boundary information of the glacier/glacial lake in corresponding periods was obtained manually. The streamline information of the glacier in the four periods was obtained using an auto‐matic extraction method(Yaoet al.,2015).
The topographic map was produced by the China Military Geodetic Service based on aerial photo‐graphs taken in October 1980. Contours were digi‐tized manually and then converted into a raster DEM(TOPO DEM) with 30-m grid pixels using the Thies‐sen polygon method (Shangguanet al., 2010; Weiet al.,2015;Zhanget al.,2016).Wuet al.(2018)report‐ed that the vertical accuracy of TOPO DEM on gla‐ciers is better than 9 m. The 2000 SRTM1 Arc-Sec‐ond Global data with 30-m resolution were retrieved from the International Scientific Data Mirroring Web‐site (http://datamirror.csdb.cn) of the Chinese Acade‐my of Sciences Computer Network Information Cen‐ter. The vertical difference in the mountain area, as calculated based on the root mean square error of the GPS data,was approximately 12 m (Khasanov,2020).The ALOS/PRISM Level 1B1 stereo image pair DEM was selected to extract the 2010 glacier elevation(http://218.248.0.130/internet/servlet/LoginServlet) with 30-m resolution. At last, the 2015 DEM data of the Longbasaba Glacier were obtained using the direct TanDEM-X image data product provided by the Ger‐man space agency. It is worth noting that the vertical accuracy of the ALOS and TanDEM-X data is 6 to 8 m in steep terrain(Rastner and Paul,2020).
In this study, field measurements of the thickness of the Longbasaba Glacier obtained in 2009 were used to calibrate the parameters and to test the accura‐cy of the glacier thickness estimation. The procedure is as follows. (1) Obtain thickness measurements or estimates from GPR and model simulation at GPS points or sampling points based on DEM data; (2)find the differences between the two data and calcu‐late the average deviation (AD); (3) adjust parameters such asf,m,n,A,C,fdebris, and db?/dz0and iterate (1)and (2) until the AD value is smallest.The parameters are then deemed as optimal and used for estimating the glacier thickness at this time, and the AD value is considered as the accuracy.
The thickness measurements were obtained using a pulse EKKOTM100 GPR (Sensors & Software Inc.,Canada) at 237 points along a line shown in Figure 1c. The thickness at each measuring point was deter‐mined using the Reflexw GPR image processing soft‐ware with a relative error of 1.18%, which is within the required range of glaciological accuracy (Sunet al.,2003).The GPR antenna was operated at 100 MHz at a spacing of 2.5 m and a step length of 0.5 m.The measured wave velocity was 0.169 m/ns. During the GPR survey, a GPS receiver was used to acquire three-dimensional coordinates of each measuring point.
Yaoet al.(2012) used a SyQWest HelboxTMpor‐table high-resolution shallow-water echo sounder to conduct a wide range of on-site water depth measure‐ments on the Longbasaba Lake and collected a total of 35,558 measurement points. And the position of each water depth measurement was acquired by an eTrex Vista GPS receiver with a horizontal accuracy of about 3?6 m and an average error of 1?2 m in so‐nar depth data.
3.2 Glacier thickness and volume estimation
Owing to the limited availability of critical param‐eters in the Longbasaba Glacier area,this study select‐ed three methods to estimate glacier thickness: Glab‐Top,the full-width expansion model,and the HF-model.The accuracy of each method was evaluated based on measured data of ice thickness.
(1)GlabTop:GlabTop assumes that the glacier is a U-shaped ideal plastic body. When in a stable state,the maximum thickness of the ice body can be evalu‐ated based on the glacier surface slope and basal shear stress (Paterson and Cuffey, 1994). It is generally be‐lieved that the maximum thickness of a glacier occurs at the mid-streamline; therefore, glacier thickness (hf)at the streamline can be expressed as follows:
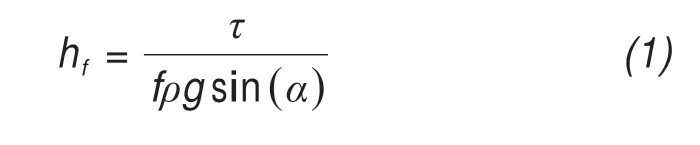
whereτrepresents the average basal shear stress along the mid-streamline kPa;ρ, ice density;g, gravi‐tational acceleration; andα, the average surface slope angle at the glacier mid-streamline, which can be cal‐culated from the DEM. For alpine glaciers, the mor‐phological factorfwas calibrated by the measured ice thickness data to be 0.8. The basal shear stress of the glacier was determined based on the glacier height dif‐ference(ΔH)(Haeberli and H?lzle,1995):
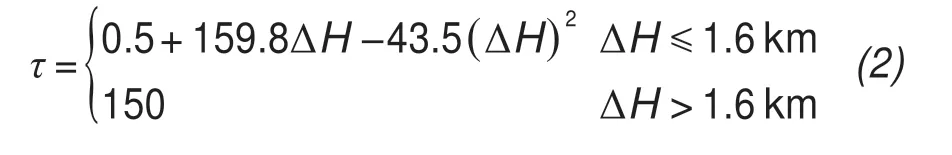
Based on ALOS data, the elevation difference of the Longbasaba Glacier in 2010 was 1,953.88 m;there‐fore, the basal shear stress was 150 kPa. The average glacier surface slope was estimated based on the mean slope within a 400-m length of the mid-streamline(Paterson and Cuffey,1994).
(2)Full-width expansion model:The full-width expansion model represents a development of Glab‐Top.In this method,the glacier shape factor is consid‐ered to have a significant influence on the estimation of maximum glacier thickness, and that fixed parame‐ters should not be used in the calculation for different glaciers (Liet al., 2012). Based on statistical analysis,Nye (1965) suggested that the shape factor is a func‐tion of the glacier's width and thickness. However, Liet al.(2012) assumed a parabolic cross-section and expressed the glacier shape factor (f) using the fol‐lowing formula:
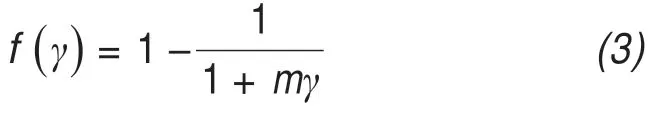
whereγis the ratio of the glacier's half-widthwto its thicknessh, andmis a constant (0.9). Therefore, the above equation can be transformed into the following(Liet al.,2012):
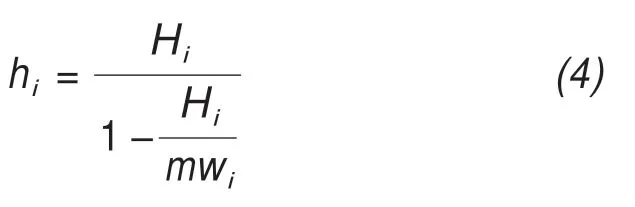
whereHiis the thickness of the glacier in an ideal state,which can be calculated based on Equation(1).
(3)HF-model:According to the basic principles of glacier mass transformation and ice flow dynamics(Glen, 1955), the HF-model considers that the thick‐ness at any point on a streamline of the glacier can be determined as follows:
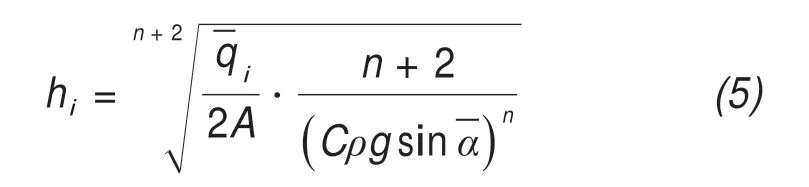
whereCis the terrain correction coefficient;A,the ve‐locity coefficient;n, the flow law index, which usual‐ly fluctuates between 1.5 and 4.2 (generally, taken as 3.0);the mean ice volume flux;the flow line along the glacier;ρ, the density of ice (kg/m); andg,gravitational acceleration (m/s2). The ice flux at any point on a streamline of a glacier can be computed based on the conservation of glacial mass and the gra‐dient of the glacial mass balance as follows (Farinottiet al.,2009a):
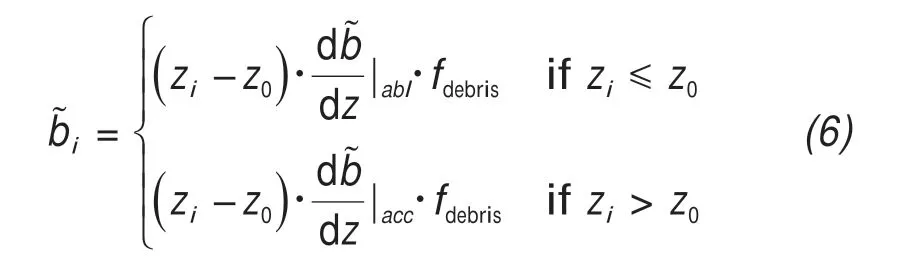
wherefdebrisis the influence factor of the epidermis(generally, taken as 0.5) (Husset al., 2007). For each glacier, the apparent mass balance gradientsandand the elevationzwere used to calculate the apparent mass balance distribution. The apparent mass balancewas derived by accumulating the same at each grid unitiin the glacier area.in this ar‐ea is conducive to the calculation of ice volume flux.The normalized ice volume flux and the local glacier width relevant for ice discharge were used to obtain the mean specific ice flow
Besides, the apparent mass balance gradientsandcould be calculated using the Huss method(Huss and Farinotti,2012):
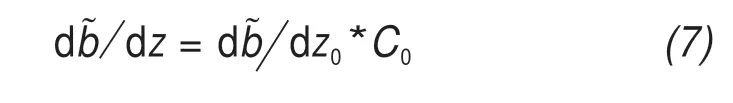
whereC0is the continentality index, which is intro‐duced to set the reference apparent mass balance gra‐dientat 5.5×10?3per year (Husset al., 2007)according to the local glacial conditions. Based on the glacial cell altitudeELAlatand the median altitudeELAg,C0can be obtained as follows:
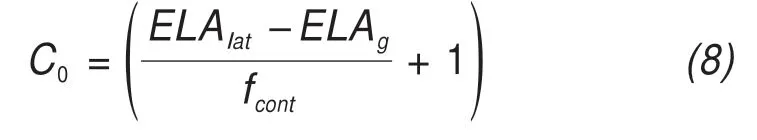
wherefcont, equal to 2,400 m, is a constant parameter calibrated by the difference of the mass balance gradi‐ent observed in mainland glaciers and marine glaciers(Haeberliet al.,2008).
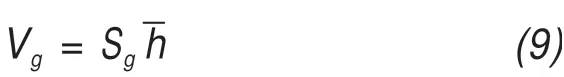
Based on the measured ice thickness data, the ice thickness estimates using GlabTop, the full-width ex‐pansion model, and the HF-model were analyzed and compared to select the optimal method for estimating the thickness of the Longbasaba Glacier. The glacier was divided into different elevation zones based on 50-m elevation intervals. The thickness at the middle point of the different elevation zones of the glacier mid-streamline was evaluated using the above three methods. Additionally, the glacier thickness at any point of the mid-streamline was estimated using the inverse distance weighting method. Based on the zero ice thickness assumption at the glacier boundary and ridge line, and glacier streamline thickness distribu‐tion,the Kruger spatial interpolation method was used to interpolate the thickness at any point of a glacier to obtain the characteristics of glacier thickness distribu‐tion. Notably, topographic factors such as glacier sur‐face slope at selected periods were extracted from a 1980 topographic map, 2000 SRTM data, 2010 ALOS data,and 2015 TanDEM-X data.Eventually,the thick‐ness distributions were obtained for estimating the glacier's volume in the different periods and analyzing its variation characteristics. Specifically, the ice vol‐ume (Vg) was estimated based on the area (Sg)and the average glacier thicknessby using the following formula:
3.3 Estimation of glacial lake water volume
The topography of the Longbasaba Lake/Glacier bed was constructed to calculate the amount of lake water during different periods. First, the depth data collected in 2009 was utilized to establish the shape of the lake basin (Yaoet al., 2012), and the ice thick‐ness and topographic maps of 1980 were used to ob‐tain topographic data of the glacier bed. Considering the steep slope at the glacier end, a vertical glacier front,or a straight"line"in a section view(refer to Fig‐ure 6), was assumed when merging the bed terrains of the lake and glacier. The lake water volume in each year,Vl,was estimated using the following equation:
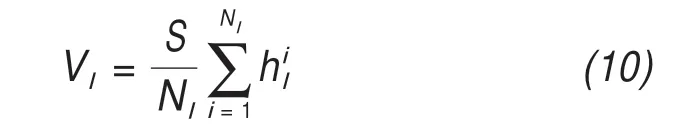
where,Nlis the pixel number within the lake bound‐ary in each year;the depth of the individual pixel,which can be calculated by comparing the water level and the basin morphology; andS, the lake area in the corresponding year.
3.4 Uncertainty analysis
The thickness estimates from the three methods were compared with the field measurements by GPR.Each method's total error was quantified by the aver‐age difference between the estimated and the mea‐sured thicknesses (hereafter, the average deviation).The average deviation expressed as a percentage of each glacier's mean measured flow line thickness was defined as the ice thickness uncertainty (Liet al.,2012).
The geolocation errors of the pixels on the glacier/lake boundaries, generated through a careful manual approach, can be controlled within a pixel. By com‐paring the outline positions from the manual delinea‐tion and GPS measurements, Guo and others (2015)suggested that the accuracies of manual outlines were±11 m and±30 m for clean ice and debris-covered gla‐ciers, respectively. In this study, the position accura‐cy of glacier boundary was affected by the debris cover on the glacier tongue but without the glacier terminus, as it was easy to distinguish the glacier from its proglacial lake exactly. The accuracies of the generated area were defined by the buffer along the glacier/lake perimeters with the size of half of the outline position error, and equal to 0.5 pixels multiplied by the pixel number within the perimeters and the spatial resolution of the images (Bolchet al.,2010; Guoet al., 2015). The average area uncertain‐ties of the glacier and lake were found to be ±8%and±3%,respectively.
According to the ice thickness calculation formu‐la, the uncertainty in ice volume estimation depends on ice thickness and glacier area uncertainty and was found to be about 15.2%. Since the basin topography was derived from ice thickness data and sonar detec‐tion data,the uncertainty of lake water volume estima‐tion results from two aspects. The first aspect of the uncertainty is related to the estimation of the lake wa‐ter volume before the fusion line and mainly depends on the accuracy of the sonar sounding.It can be evalu‐ated as the product of the lake area error and the aver‐age lake depth. The uncertainty of the lake water vol‐ume after the fusion line (basin of 1980) should con‐sider not only the accuracy of sonar sounding but also the uncertainty of the ice thickness estimation and can be evaluated by the following formula:
where,?vis the uncertainty of the glacial lake volume;and ?s, the uncertainty of the lake area;is the aver‐age water depth of the lake;is the uncertainty of the average water depth;Sis the lake area.
4 Results and analyses
4.1 Comparison of ice thickness estimates
According to the methods described in Section 3.2, the ice thickness distributions were analyzed and illustrated in Figure 2.According to the ice thickness distribution obtained using GlabTop shown in Figure 2a, the thickness of the Longbasaba Glacier in 2010 was in the range of 0.0 to 288.1±14.6 m,with an aver‐age ice thickness of 48.8±8.1 m. The maximum ice body thickness occurred in the middle of the glacier,and the maximum ice thickness of the ice tongue was approximately 110.1±18.3 m. Figure 2b illustrates the glacier ice thickness distribution acquired using the full-width expansion model. The ice thickness ranged from 0.0 to 172.8±43.9 m, with an average thickness of 55.8±14.2 m. The maximum ice thickness was lo‐cated within the ice tongue, and the thickness was greatest along the glacier's central flowline. The gla‐cier tongue generally extended deep in the middle and was shallow at the upper and lower ends.From the ice thickness distribution derived from the HF-model shown in Figure 2c, one can see that the maximum glacier thickness appeared in the middle of the gla‐cier, with the ice body thickness ranging from 0.0 to 168.5±31.2 m and an average thickness of 29.4±5.4 m.However, the body of the glacier tongue was thicker,and the ice thickness in the glacier accumulation zone was thinner.
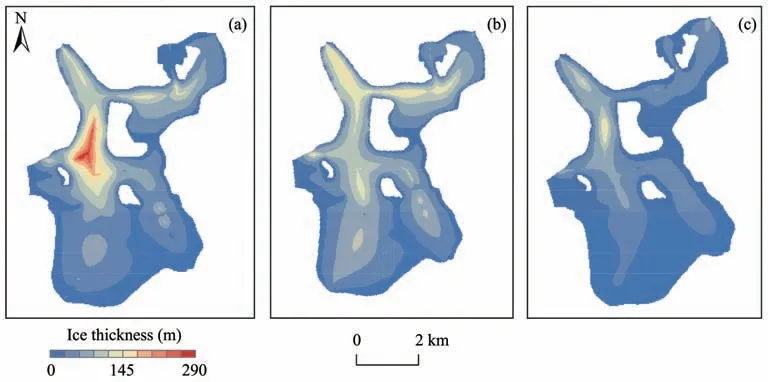
Figure 2 Ice thickness distributions of the Longbasaba Glacier in 2010 obtained using.(a)The GlabTop model,(b)the full-width expansion model,and(c)the HF-model
The scatter plots presented in Figure 3 illustrate how the estimated ice thickness correlates with the measured. In the legend,nrepresents the number of data points,AD represents the average deviation, and the value in parentheses indicates the percent of the average deviation to the average measured streamline thickness of the glacier. The average deviations of GlabTop, the full-width expansion method, and the HF-model are 9.8, 15.5, and 10.9 m, respectively.The ice thickness uncertainty of GlabTop, the full-width expansion method, and the HF-model is 16.6%,25.4%,and 18.5%,respectively.Accordingly,as Glab‐Top produced the smallest deviation from the mea‐sured value of ice thickness, it was considered better than the other two methods and therefore used to esti‐mate the thickness of the Longbasaba Glacier.
4.2 Changes in ice thickness and ice volume
Considering the influence of bedrock wear caused by glacier movement, GlabTop, with its high reliability, was used to estimate the ice thick‐ness of the Longbasaba Glacier in 1980, 2000,2010,and 2015,as shown in Figure 4.The DEM da‐ta used for calculating the ice surface slope in each stage are summarized in Table 1. After the ice thickness of the mid-streamline of the glacier was calculated using GlabTop, the 30 m×30 m resolu‐tion distribution model of ice thickness in each pe‐riod was acquired using Inverse Distance Weighting interpolation.
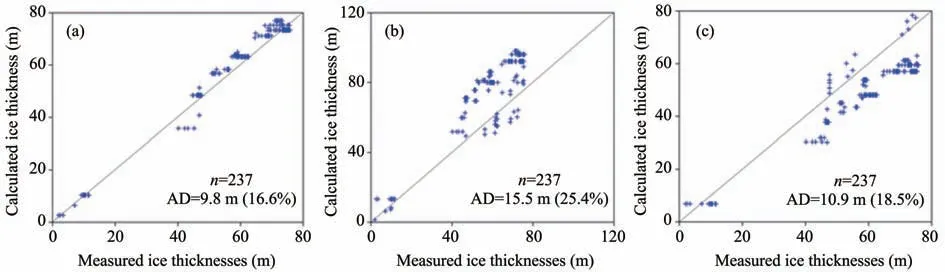
Figure 3 Comparison of measured ice thickness of the Longbasaba Glacier in 2010 with thickness estimated using.(a)GlabTop,(b)the full-width expansion model,and(c)the HF-model
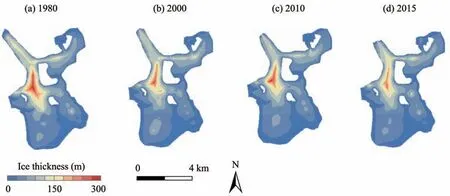
Figure 4 Ice thickness distribution of the Longbasaba Glacier by Glabtop:(a)1980,(b)2000,(c)2010,and(d)2015
In 1980, an obvious dark closed area existed in the glacier tongue, and a deep depression was visible in the ice bed.The maximum depth was 301.9±50.1 m,and the average ice thickness was 55.1±9.1 m. In 2000, the maximum thickness of the central part of the glacier decreased to 295.2±49.1 m, and the aver‐age glacier thickness fell to 50.7±8.4 m. In 2010, the glacier tongue had thinned further, with the maximum ice thickness at the end of the glacier declined to 122.4±20.3 m, the maximum glacier thickness re‐duced to 288.4±47.9 m, and the average glacier thick‐ness dropped to 48.8±8.1 m. By 2015, the maximum thickness of the glacier accumulation area had de‐creased to 270.5±44.9 m, the maximum thickness of the glacier tongue had diminished to 115.3±19.1 m,and the average glacier thickness further thinned to 47.2±7.8 m. In the 35-year study period, the average glacier thickness declined by 7.9±1.3 m or an average annual rate of 0.23±0.04 m.
It can be seen that both the area and the volume of the Longbasaba Glacier have decreased consistently over the study period (Table 2). However, although the rate of ice volume reduction has accelerated over time (Figure 5), the area shrinking rate had declined from 2010 to 2015.During this period,glacier thinning was the main reason for the ice volume reduction.
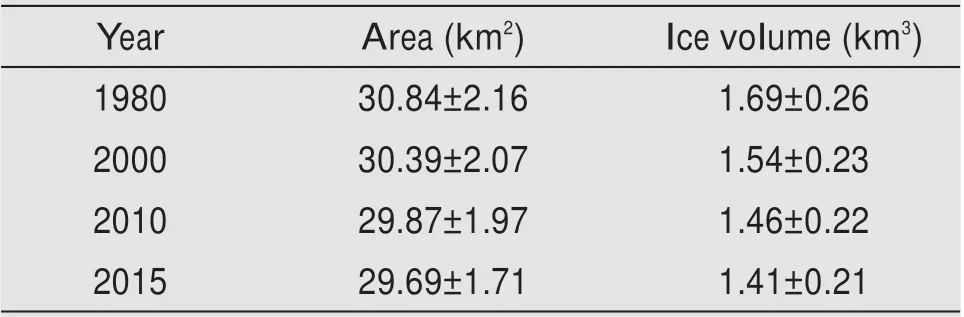
Table 2 Area and volume of the Longbasaba Glacier from 1980 to 2015
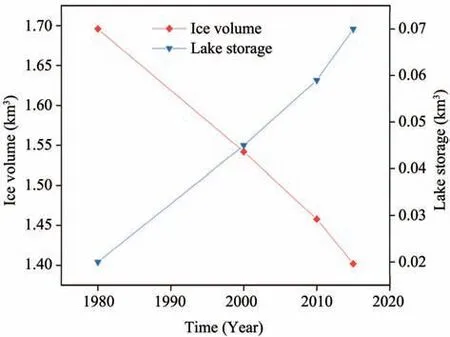
Figure 5 Changes in ice volume and lake storage
5 Discussions
5.1 Sensitivity of model parameters
Many studies have used these glacier thickness models. For example, Panditet al. (2020) used the GlabTop2_IITB model to report that the uncertainty of 65 glaciers in the Chandra Basin in the Western Hi‐malayas is about ±15.0%. Thickness distributions of the glaciers in the southeastern part of the Qinghai-Ti‐bet Plateau were estimated based on mass balance dis‐tribution data, glacier surface velocity and ice flow principles, and the uncertainties in ice thickness and glacier volume estimates are ±13.2% and 12.8%, re‐spectively (Wuet al., 2020). The glacier volume ob‐tained by the Volume and Topography Automation(VOTA) model ranges between 26.5% underestima‐tion and 16.6% overestimation when compared with the field observations (James and Carrivick, 2016).This study's estimated glacier volume was also com‐pared with a glacier volume dataset derived from a combination of up to five models (Farinottiet al.,2019) and was found to be about 4.0% lower than the average of those models. Rabatelet al. (2012) used surface mass balance and ice flow velocity to estimate the thickness of the French and Argentina glaciers.They found that the ice thickness differs from the ob‐served value by 10% to 30%. Combining the best model and measured ice thickness to obtain the over‐all glacier thickness distribution has also achieved good results (Langhammeret al., 2019). Many re‐searchers compared ground-penetrating radar data with simulated ice thickness (Pieczonkaet al., 2018;Pritchardet al., 2020; Weltyet al., 2020). In this study, it is found that the GlabTop model estimated ice thickness results are in good agreement with the ground-penetrating radar measurements, and the un‐certainty is about 16.6%.
To investigate the impact of the uncertainty in the model parameters on ice thickness estimation,a sensi‐tivity analysis was performed on the ice thickness esti‐mation results. Each parameter of the different mod‐els (shape factorf, coefficientm, the flow law expo‐nentn, the flow rate factorA, the correction factorC,the surface moraine impact factorfdebris, and the refer‐ence apparent mass balance gradientwas ad‐justed in sequence. In this examination, the estimated resultant change in ice thickness was divided by an undisturbed estimation value of ice thickness to de‐fine "sensitivity" (Δh). For the Longbasaba Glacier,the undisturbed value refers to the mean glacier thick‐ness assessed using the three different models. The outcomes could be applied to predict potential errors in the ice thickness estimations, and these errors would at that point be linked to a certain parameter(e.g., glacier volume) based on the error. Similarly,this parameter would be evident in the different thick‐ness estimation approaches, and its sensitivity investi‐gation was utilized to measure its effect.
The 2010 data were used as the basis of this sensi‐tivity analysis. The correction parameters in each ice thickness estimation model were adjusted by fitting the ice thickness determined by the model to the GPR-measured thickness.Of the three methods,Glab‐Top and the full-width expansion model have fewer model parameters; the shape factorfand the coeffi‐cientmwere considered. In the validation, two slope parameters (limitα0=4° and thresholdαlim=30°) were adopted (Liet al., 2012). Since there are many model parameters in the HF-model, for simplicity, the most sensitive parameter,i.e., the flow law exponentn, was picked for examination, and the remaining model pa‐rameters were taken from the literature. In a previous study, correction factorCwas set to 0.53 (Farinottiet al.,2009b).The speed coefficient A is generally a pre‐determined estimation of an alpine glacier (Hubbardet al., 1998; Gudmundsson, 1999). The glacier ice densityρwas assumed to be 900 kg/m3,gis 9.8 m/s2,αlimwas set to 20°, andα0was set to 2° (Farinottiet al.,2009a).
Table 3 lists the model parameters considered in the sensitivity analysis and results.Among the param‐eters considered, it is evident that the ice thickness evaluation is most sensitive tonandf. For example, a 10% change in the values ofnandfwould cause Δhto reduce by 40.7% and 9.1%, respectively. By com‐parison, the ice thickness estimation is much less sen‐sitive to the other parameters, includingm,A,C,fdebris,and db?/dz0.
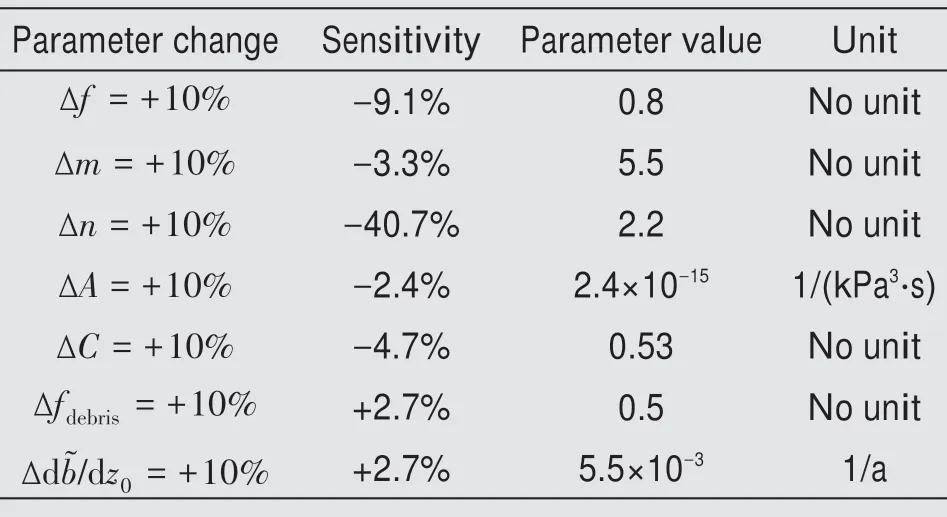
Table 3 Sensitivity analysis and parameter setting of ice thickness estimation models
5.2 Retention of glacier meltwater
The injection of glacial meltwater into a glacial lake leads to its areal expansion. Furthermore, glacial meltwater does not flow out of the cryosphere entirely through surface runoff but is retained temporarily in the glacial lake. This mechanism helps regulate the water circulation process in mountainous areas to a certain extent and delays regional glacial water re‐sources loss due to global warming (Wanget al.,2013; Das, 2015). Under the background of rising air temperatures and shrinking glaciers in the Himalayas,glacial lakes are anticipated to increase in terms of number and area.
Based on the topographic map in 1980 and the Landsat images acquired in 2000, 2010, and 2015, it was determined that meltwater from the Longbasaba Glacier had caused Longbasaba Lake to expand mark‐edly from 1980 to 2015. Based on existing data, it is difficult to accurately calculate how much glacial meltwater is retained by glacial lakes. Given the lack of obvious trends in meteorological factors such as precipitation and evaporation, it could be conjectured that expansion of glacial lake is related directly to the injection of glacial meltwater resulting from the gla‐cial retreat and increased melting (Wanget al., 2013).Accordingly, an approximate estimation of the water retained in Longbasaba Lake was provided next.
Using Equation(10), the net increment of the gla‐cial lake area related to direct injection of glacial melt‐water can be converted into the change of the glacial lake reservoir volume,i.e., the glacial water resource of the Longbasaba Glacier retained by the glacial lake. Based on visual interpretation of topographic maps and Landsat images of different years, the boundaries of Longbasaba Lake in different periods were drawn to assess its area. It was found that Long‐basaba Lake expanded from 0.377 to 1.449 km2from 1980 to 2015. Table 4 summarizes the area and stor‐age volume and its changes in each period.
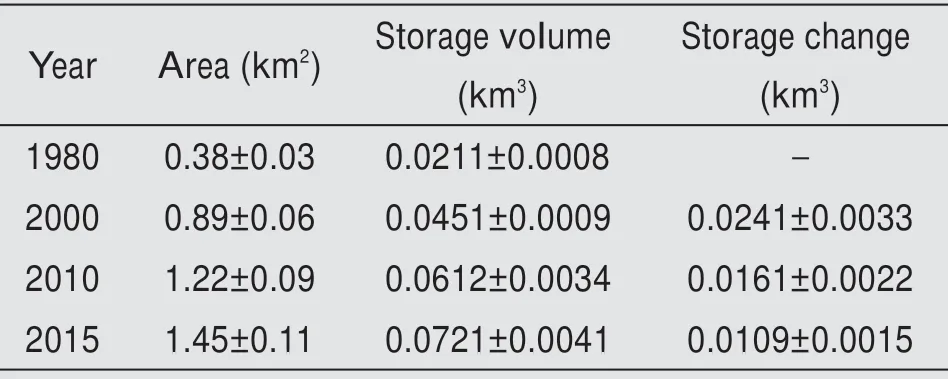
Table 4 Changes of area and storage volume of the Lake Longbasaba from 1980 to 2015
Results in Table 4 show that, from 1980 to 2000,the lake's area increased by 0.51±0.01 km2,its volume grew by 0.0241±0.0082 km3, corresponding to rates of 0.0261±0.0005 km2/a and 0.0013±0.0001 km3/a,re‐spectively, and the relative quantity of retained water in the glacial lake was 16.2%.From 2000 to 2010,the glacial lake area increased by 0.33±0.01 km2, and its storage volume swelled by 0.0112±0.0004 km3, or at rates of 0.0322±0.0006 km2/a and 0.0014±0.0004 km3/a,respectively.The relative quantity of retained water in the glacial lake was approximately 16.7%. From 2010 to 2015,the glacial lake area and volume increased by 0.23±0.01 km2and 0.0109±0.0004 km3, or at 0.0456±0.0009 km2/a and 0.0022±0.0001 km3/a, respectively.And the relative quantity of retained water in the lake was 19.7%. Thus, the changes in the area and storage volume of Longbasaba Lake have accelerated year by year, especially from 2010 to 2015, as illustrated in Figure 5. The increase rates of the lake area and stor‐age volume from 2010 to 2015 were respectively 1.75 and 1.76 times greater than from 1980 to 2000. More‐over, the relative quantity of retained water in the gla‐cial lake has also increased annually.
5.3 Upward expansion of the proglacial lake
Change in ice volume and glacial lake storage is often closely related to the regional climatic back‐ground. Some studies have processed and analyzed air temperature and precipitation data obtained at the meteorological stations located near the Longbasaba Glacier (e.g., Dingri Station, Lazi Station, Xigaze Station, Gyangzi Station, and Nielamu Station) (Yaoet al., 2010). It is found that the annual average tem‐perature at the five meteorological stations has shown a warming trend since their establishment, which is consistent with the general warming trend observed on the Qinghai-Tibet Plateau since the 1960s (Renet al., 2004; Yanget al., 2006). Overall, from 1975 to 2015, the annual average temperature in the Kanchen‐junga region, where the Longbasaba Glacier is locat‐ed,increased significantly at a rate of 0.036°C/a(con‐fidence level: <0.001) (Zhaoet al., 2020). In particu‐lar, the temperature increase at the station nearest the Longbasaba Glacier was as fast as 0.37 °C/10a from 1971 to 2009, which is much higher than the global average temperature rise rate of 0.148 °C/10a (Parryet al., 2007). As the warm and humid airflow from the Indian Ocean is affected by the barrier effect of the Himalayas, overall, the precipitation around the Longbasaba Glacier has seen little changes (Wanget al.,2018).
Some studies concluded that the glaciers on the Qinghai-Tibet Plateau were stable or appeared to even advance slightly during 1970 to 1980, but then started to retreat from the end of 1980 into the 1990s,and the extent and speed of the retreat have increased gradual‐ly in recent years. The Landsat images used in this study show clearly that the boundary of the Longbasa‐ba Glacier has retreated.Over the study period,the re‐treating speed has accelerated, and the area vacated by the retreating glacier had become part of the gla‐cial lake. To summarize, under the background of re‐gional climate warming, the Longbasaba Glacier has recently developed a strong negative mass balance and has been retreating at a rising rate. The lake's re‐tention effect on glacier meltwater is the direct reason for the substantial increase in the area and storage vol‐ume of the Longbasaba Lake.Owing to the lagged re‐sponse of glaciers to climate change, the more obvi‐ous climate warming of recent years will drive the Longbasaba Glacier to continue to retreat, resulting in further expansion of the Longbasaba Lake.
The basin topography of the Longbasaba Lake/Glacier was constructed, as illustrated in Figure 6.Considering that the glacier front often appears as a steep cliff, a coincident zone was chosen to merge the two overlapping parts of the bottom terrain. It is pre‐dicted that the lake could expand to a distance of 5,000 m from the glacial lake dam(Figure 6).
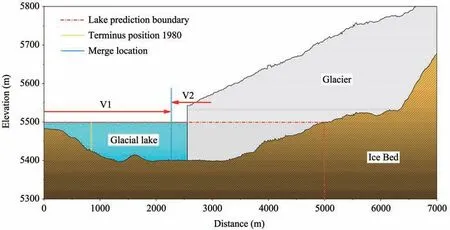
Figure 6 The centerline profiles of the glacier bed,ice thickness,and lake depth.V1 represents the lake water volume before the fusion line at the merge location,and V2 represents the lake water volume after the fusion line.V1 is from the glacier bed of 2009,and V2 is from the bed of 1980
6 Conclusions
Based on the glacier polygon vector data and the digital elevation model data, three ice thickness distribution models were used to estimate the thick‐ness of the Longbasaba Glacier. By comparison with ground-penetrating radar data, the GlabTop model is found to have the best performance in simulating the ice thickness distribution with an uncertainty of 16.6%. Due to regional climate warming, from 1980 to 2015, the thickness of the Longbasaba Glacier de‐creased by 7.9±1.3 m, with an average annual reduc‐tion of 0.23±0.04 m. During the 35-year study period,the Longbasaba Glacier shrunk by 1.07±0.03 km2,and its ice volume declined to 1.41±0.21 km3as of 2015.
The growth rate of the area and water storage of Longbasaba Lake has been accelerating. To a certain extent, the expansion of glacial lakes can delay the loss of regional glacier water resources due to climate warming. On average, approximately 17% of glacial meltwater from its host glacier is retained in this pro‐glacial lake every year. The basin morphology of the Longbasaba Glacier/Lake was reconstructed, and the glacial lake may extend from the lake dam by up to 5,000 m.
Acknowledgments:
The work was funded by the National Natural Science Foundation of China(No.41701061,No.41761144075,No. 41771075, and No. 41271091). We gratefully ac‐knowledge Zhen Wu and Chao Yao for their help in the ice thickness measurements and processing.We al‐so thank Xuanru Zhao for the ALOS and TanDEM.
 Sciences in Cold and Arid Regions2020年6期
- Sciences in Cold and Arid Regions的其它文章
- Guidelines to Authors
- Characteristics and changes of permafrost along the engineering corridor of National Highway 214 in the eastern Qinghai-Tibet Plateau
- Glacier changes in the Qaidam Basin from 1977 to 2018
- Zhangmu and Gyirong ports under the threat of glacial lake outburst flood
- Spatial distribution of supraglacial debris thickness on glaciers of the China-Pakistan Economic Corridor and surroundings
- Manifestations and mechanisms of mountain glacier-related hazards